
FRET-Based Nanobiosensors for Imaging Intracellular Ca2+ and H+ Microdomains

Abstract
:1. Introduction
1.1. Material and Methods
1.2. Dyes PEGylation
1.3. Fluorimetry
1.4. Intracellular Calibration of pH Sensors by Flow Cytometry
2. Results
2.1. From the Principle to a Modular Toolkit: Construction of FRET-Based Ion Sensors
2.1.1. Principle
2.1.2. Ion Sensor Design
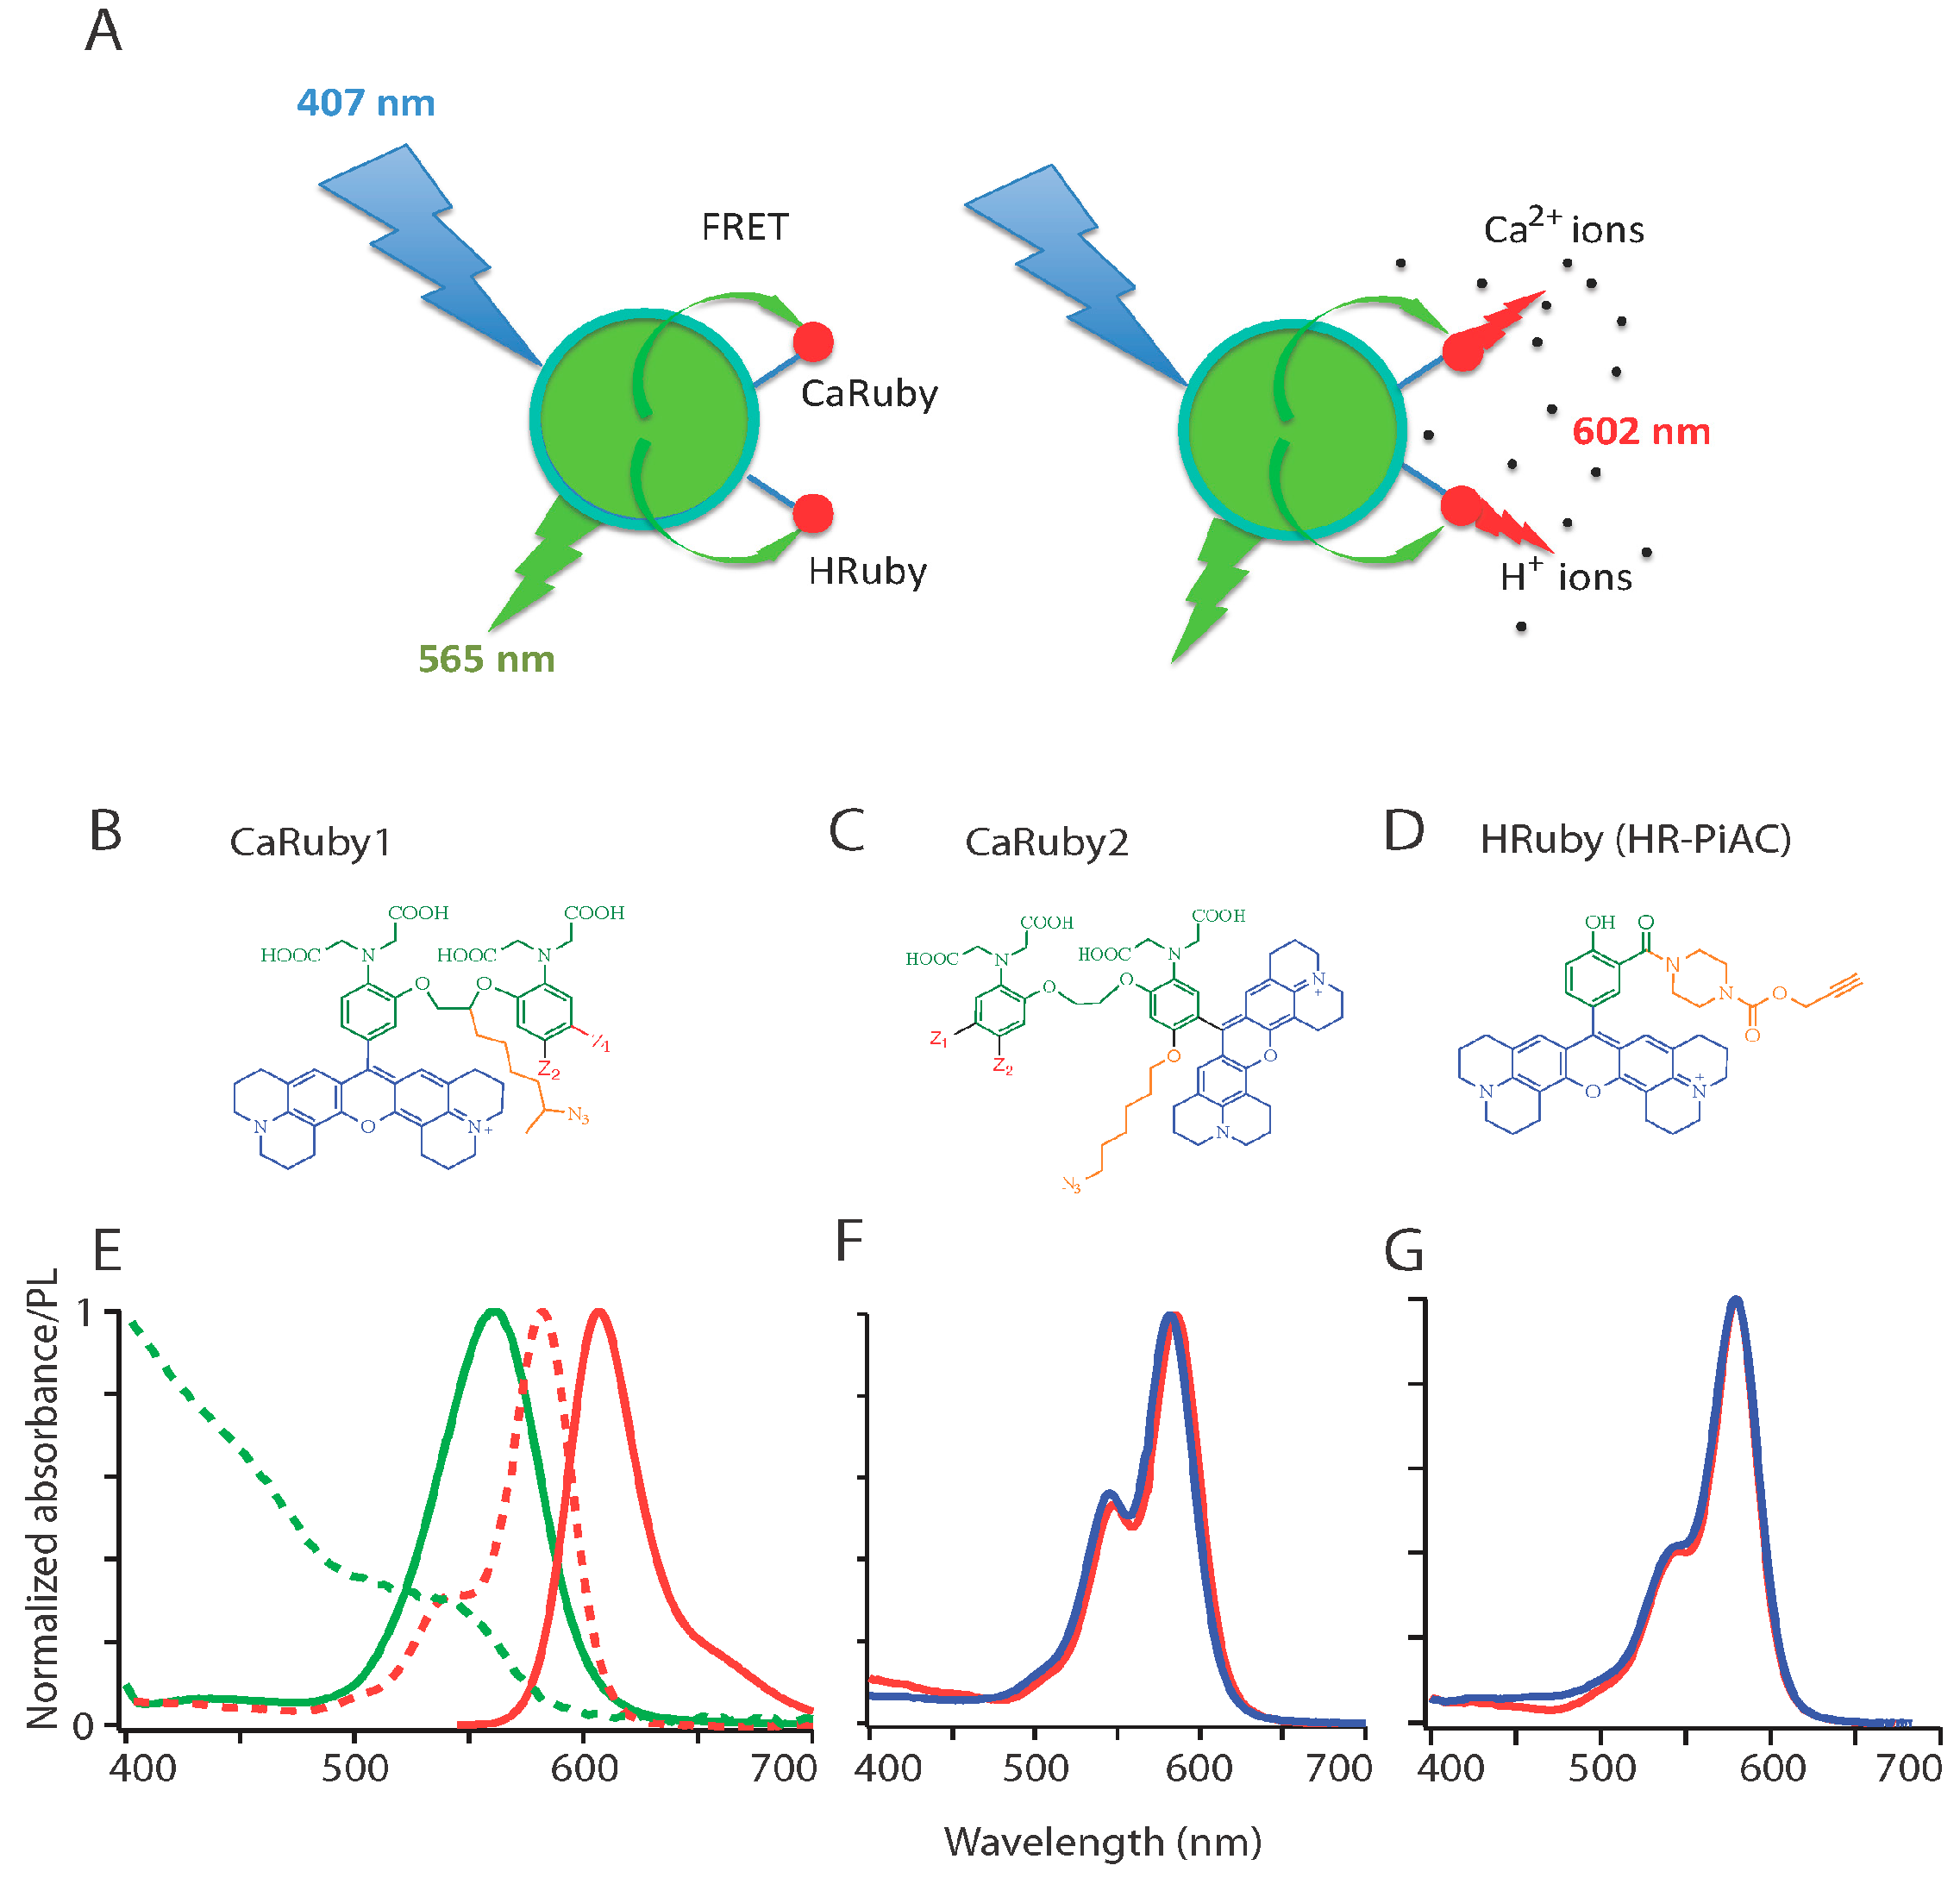
2.1.3. Ca2+ Sensors

| CaRu2-Cl | State | λabs, max | λem, max | KD | ε (M−1·cm−1) | Ф | Dynamic |
| (nm) | (nm) | Range | |||||
| ON a | 583 | 606 | 1.71 µM | 70,120 | 0.63 | 33 | |
| OFF b | 580 | 605 | 76,550 | 0.02 | |||
| CaRu2-F | ON a | 583 | 608 | 0.33 µM | 89,190 | 0.60 | 63 |
| OFF b | 580 | 606 | 90,240 | 0.01 |
2.1.4. H+ Sensors
2.1.5. Quantum Dots (QDs)
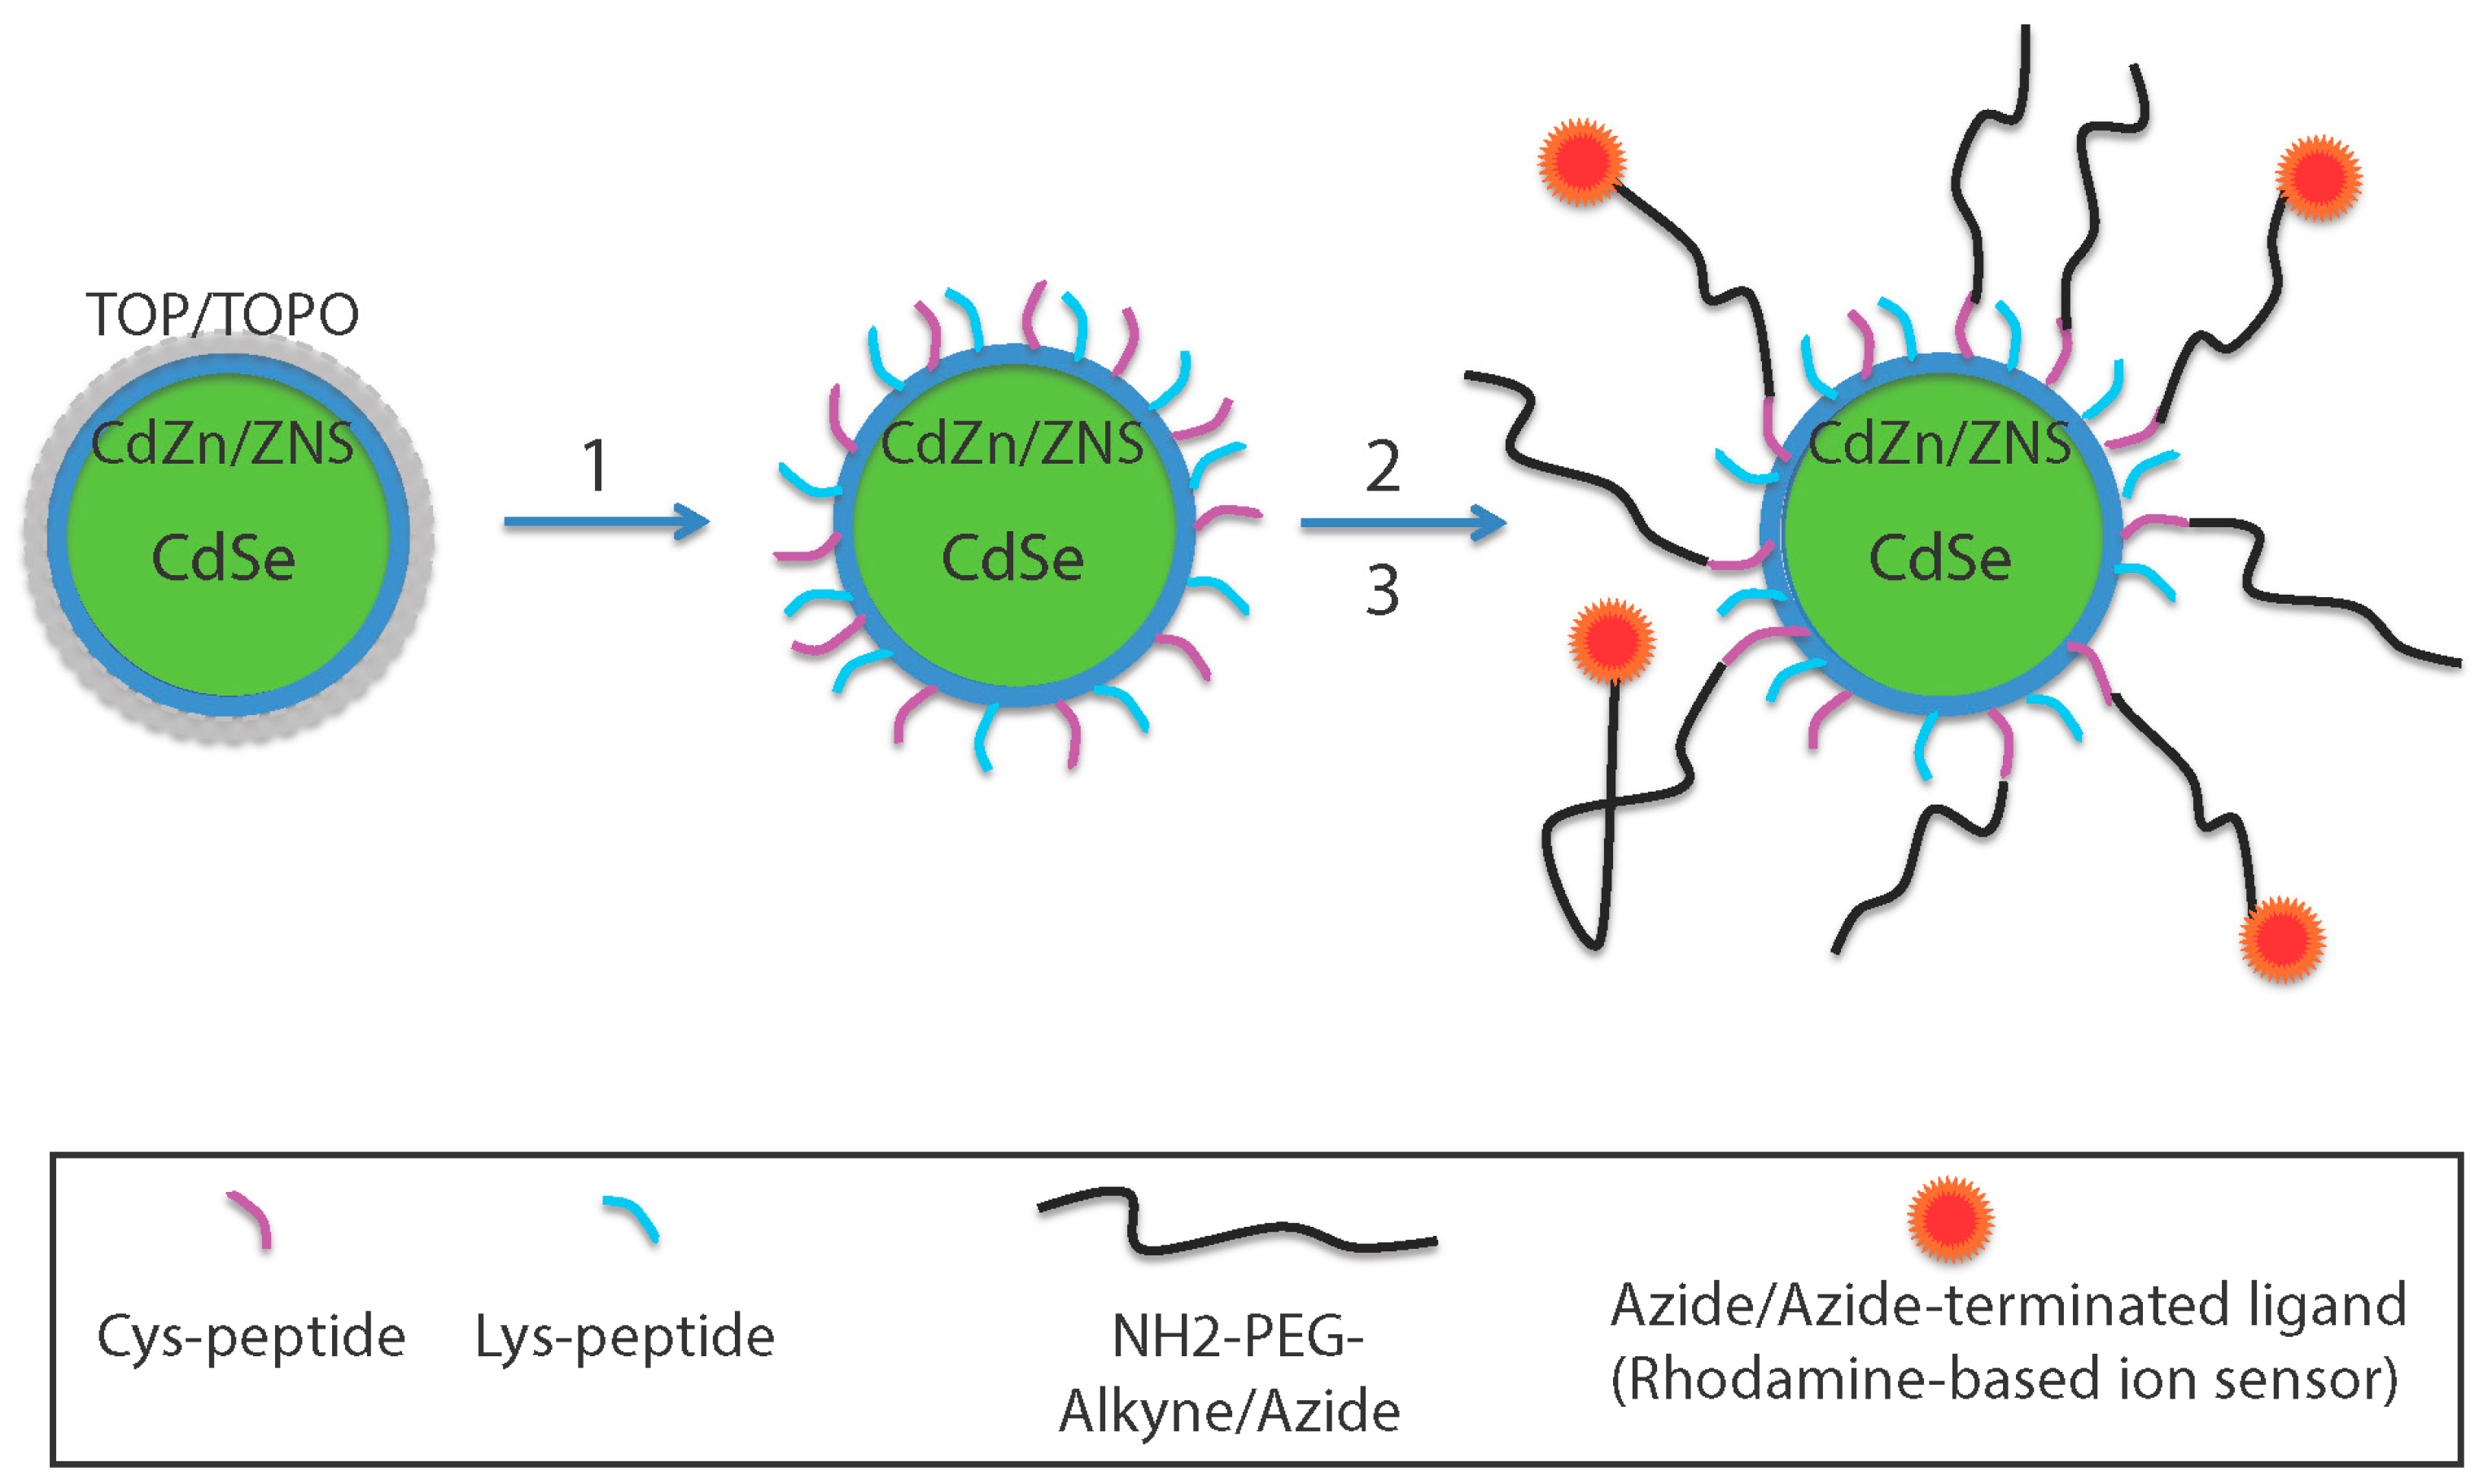
2.1.6. QDs Surface Chemistry and Functionalization Reaction
2.1.7. Construction of the Nanosensors

3. Biophysical Properties of the Nanosensors
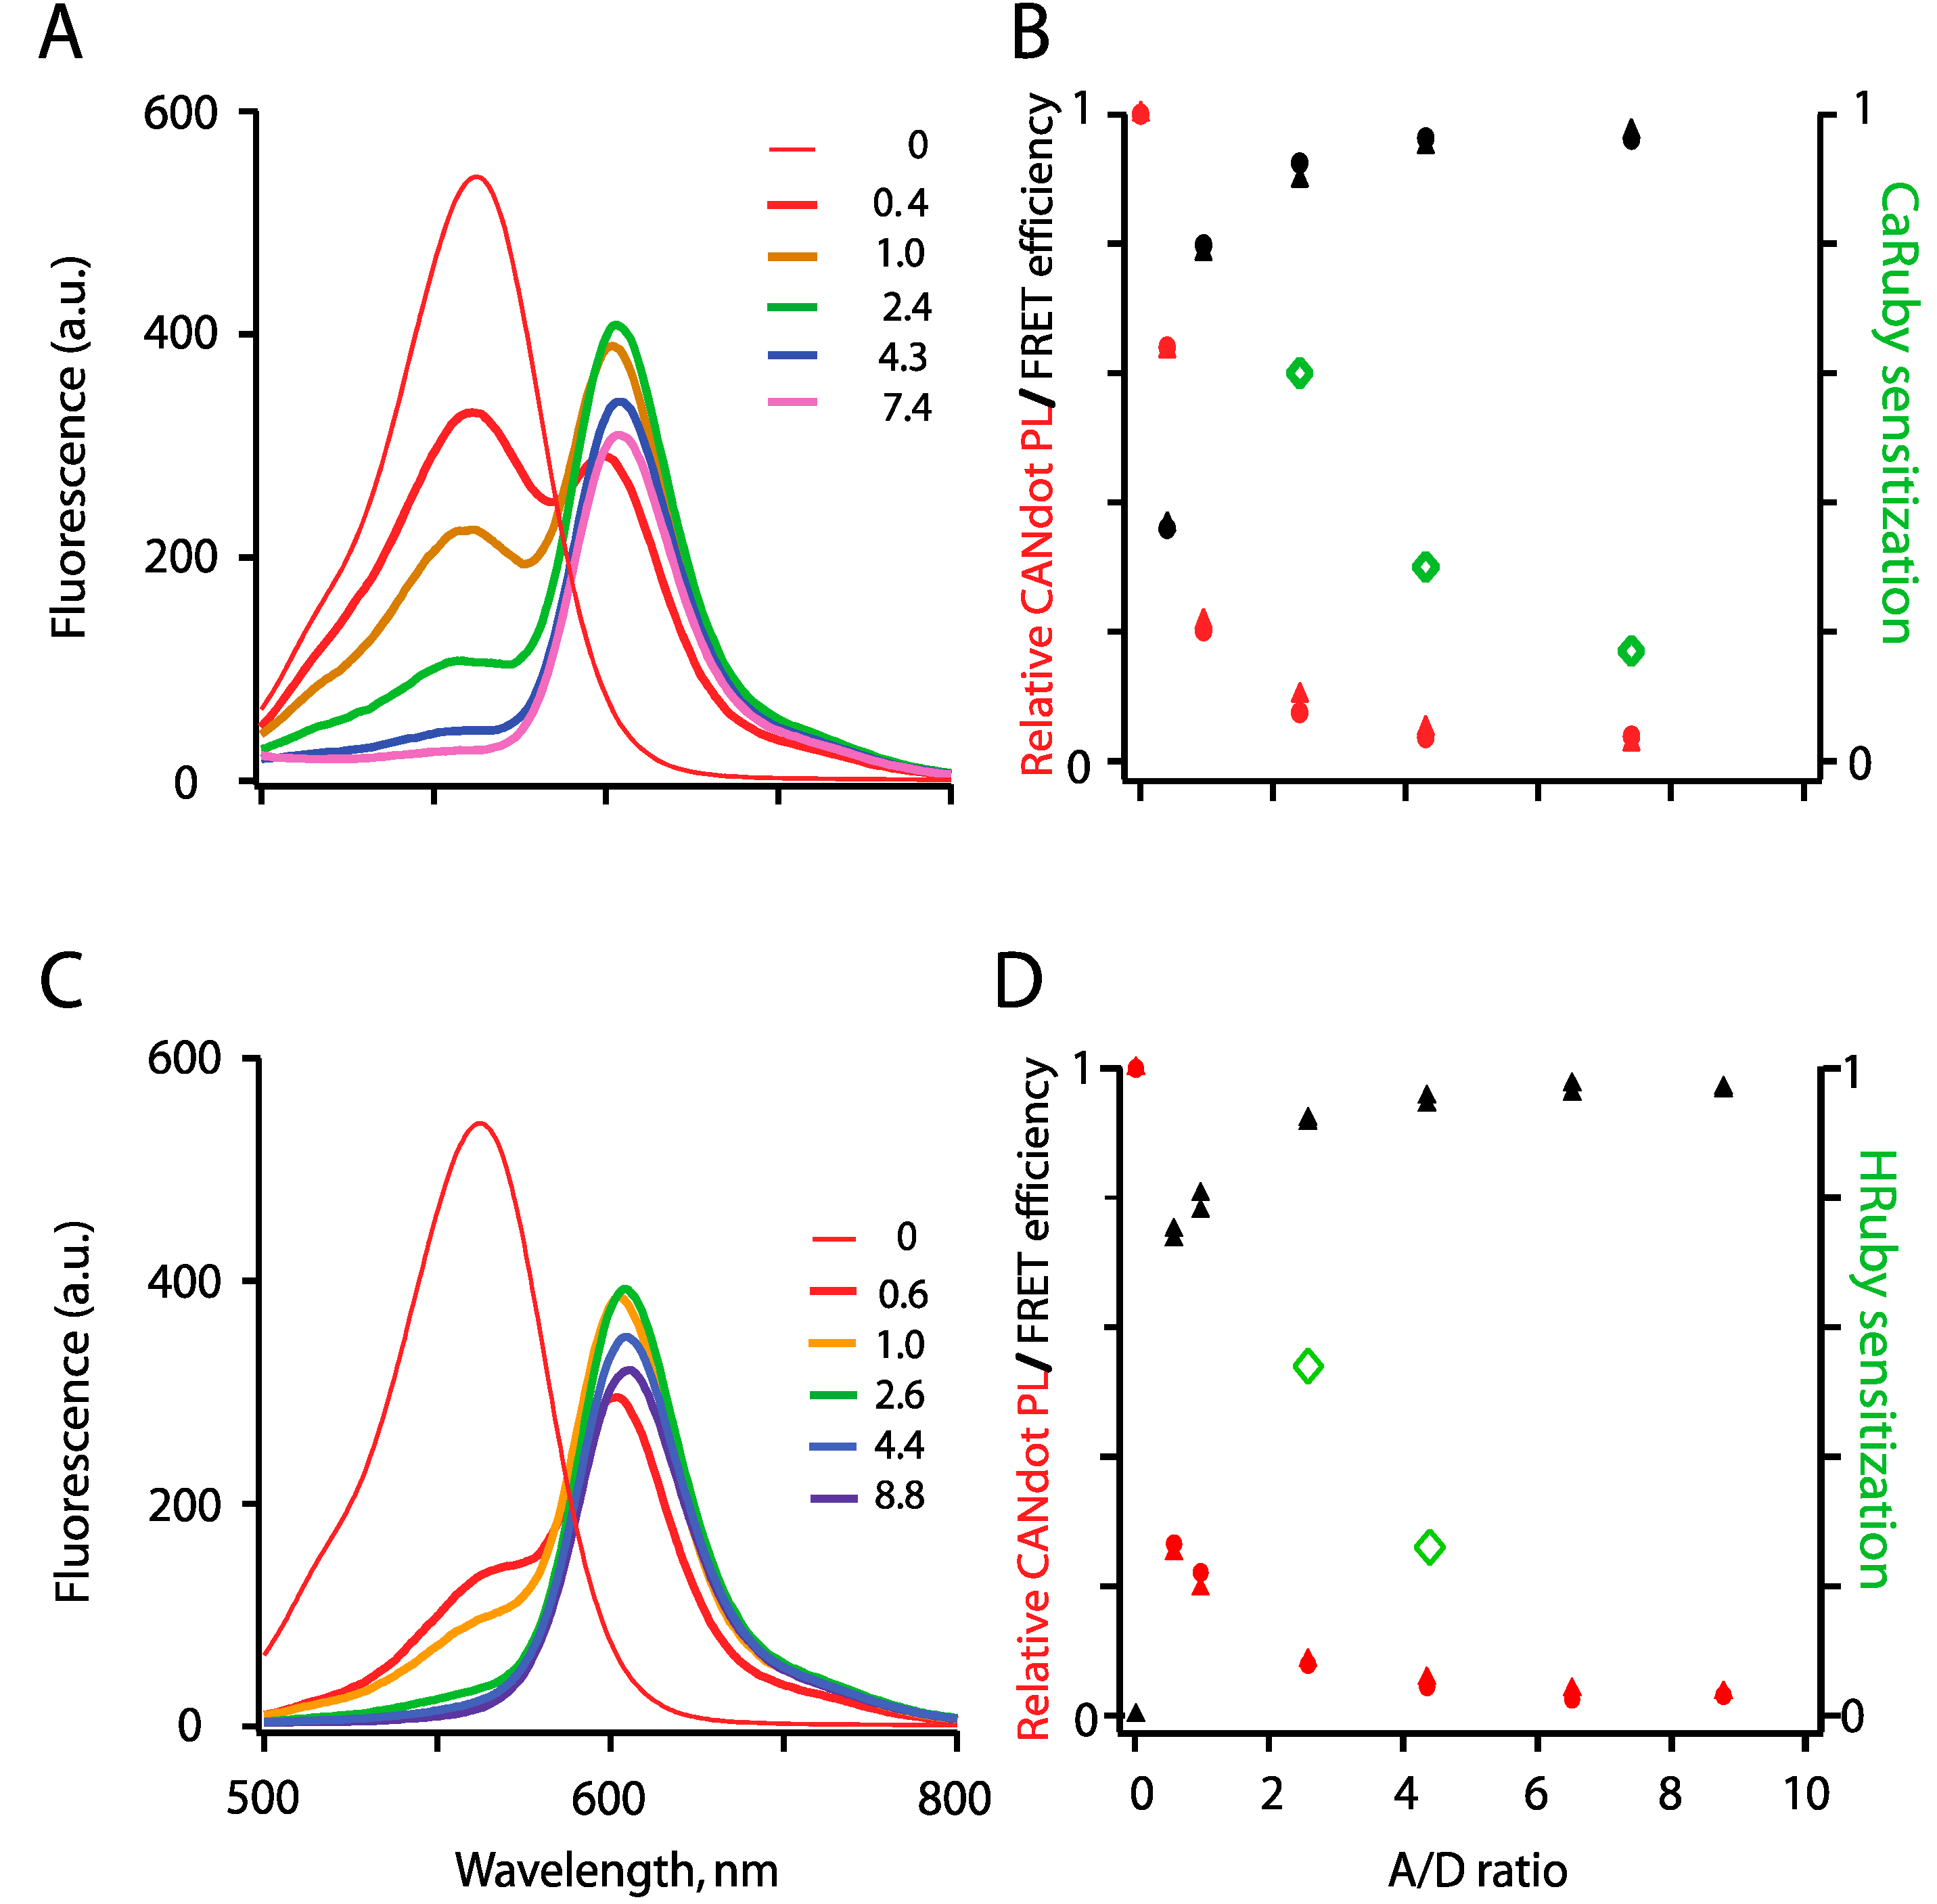
3.1. Spectral Properties

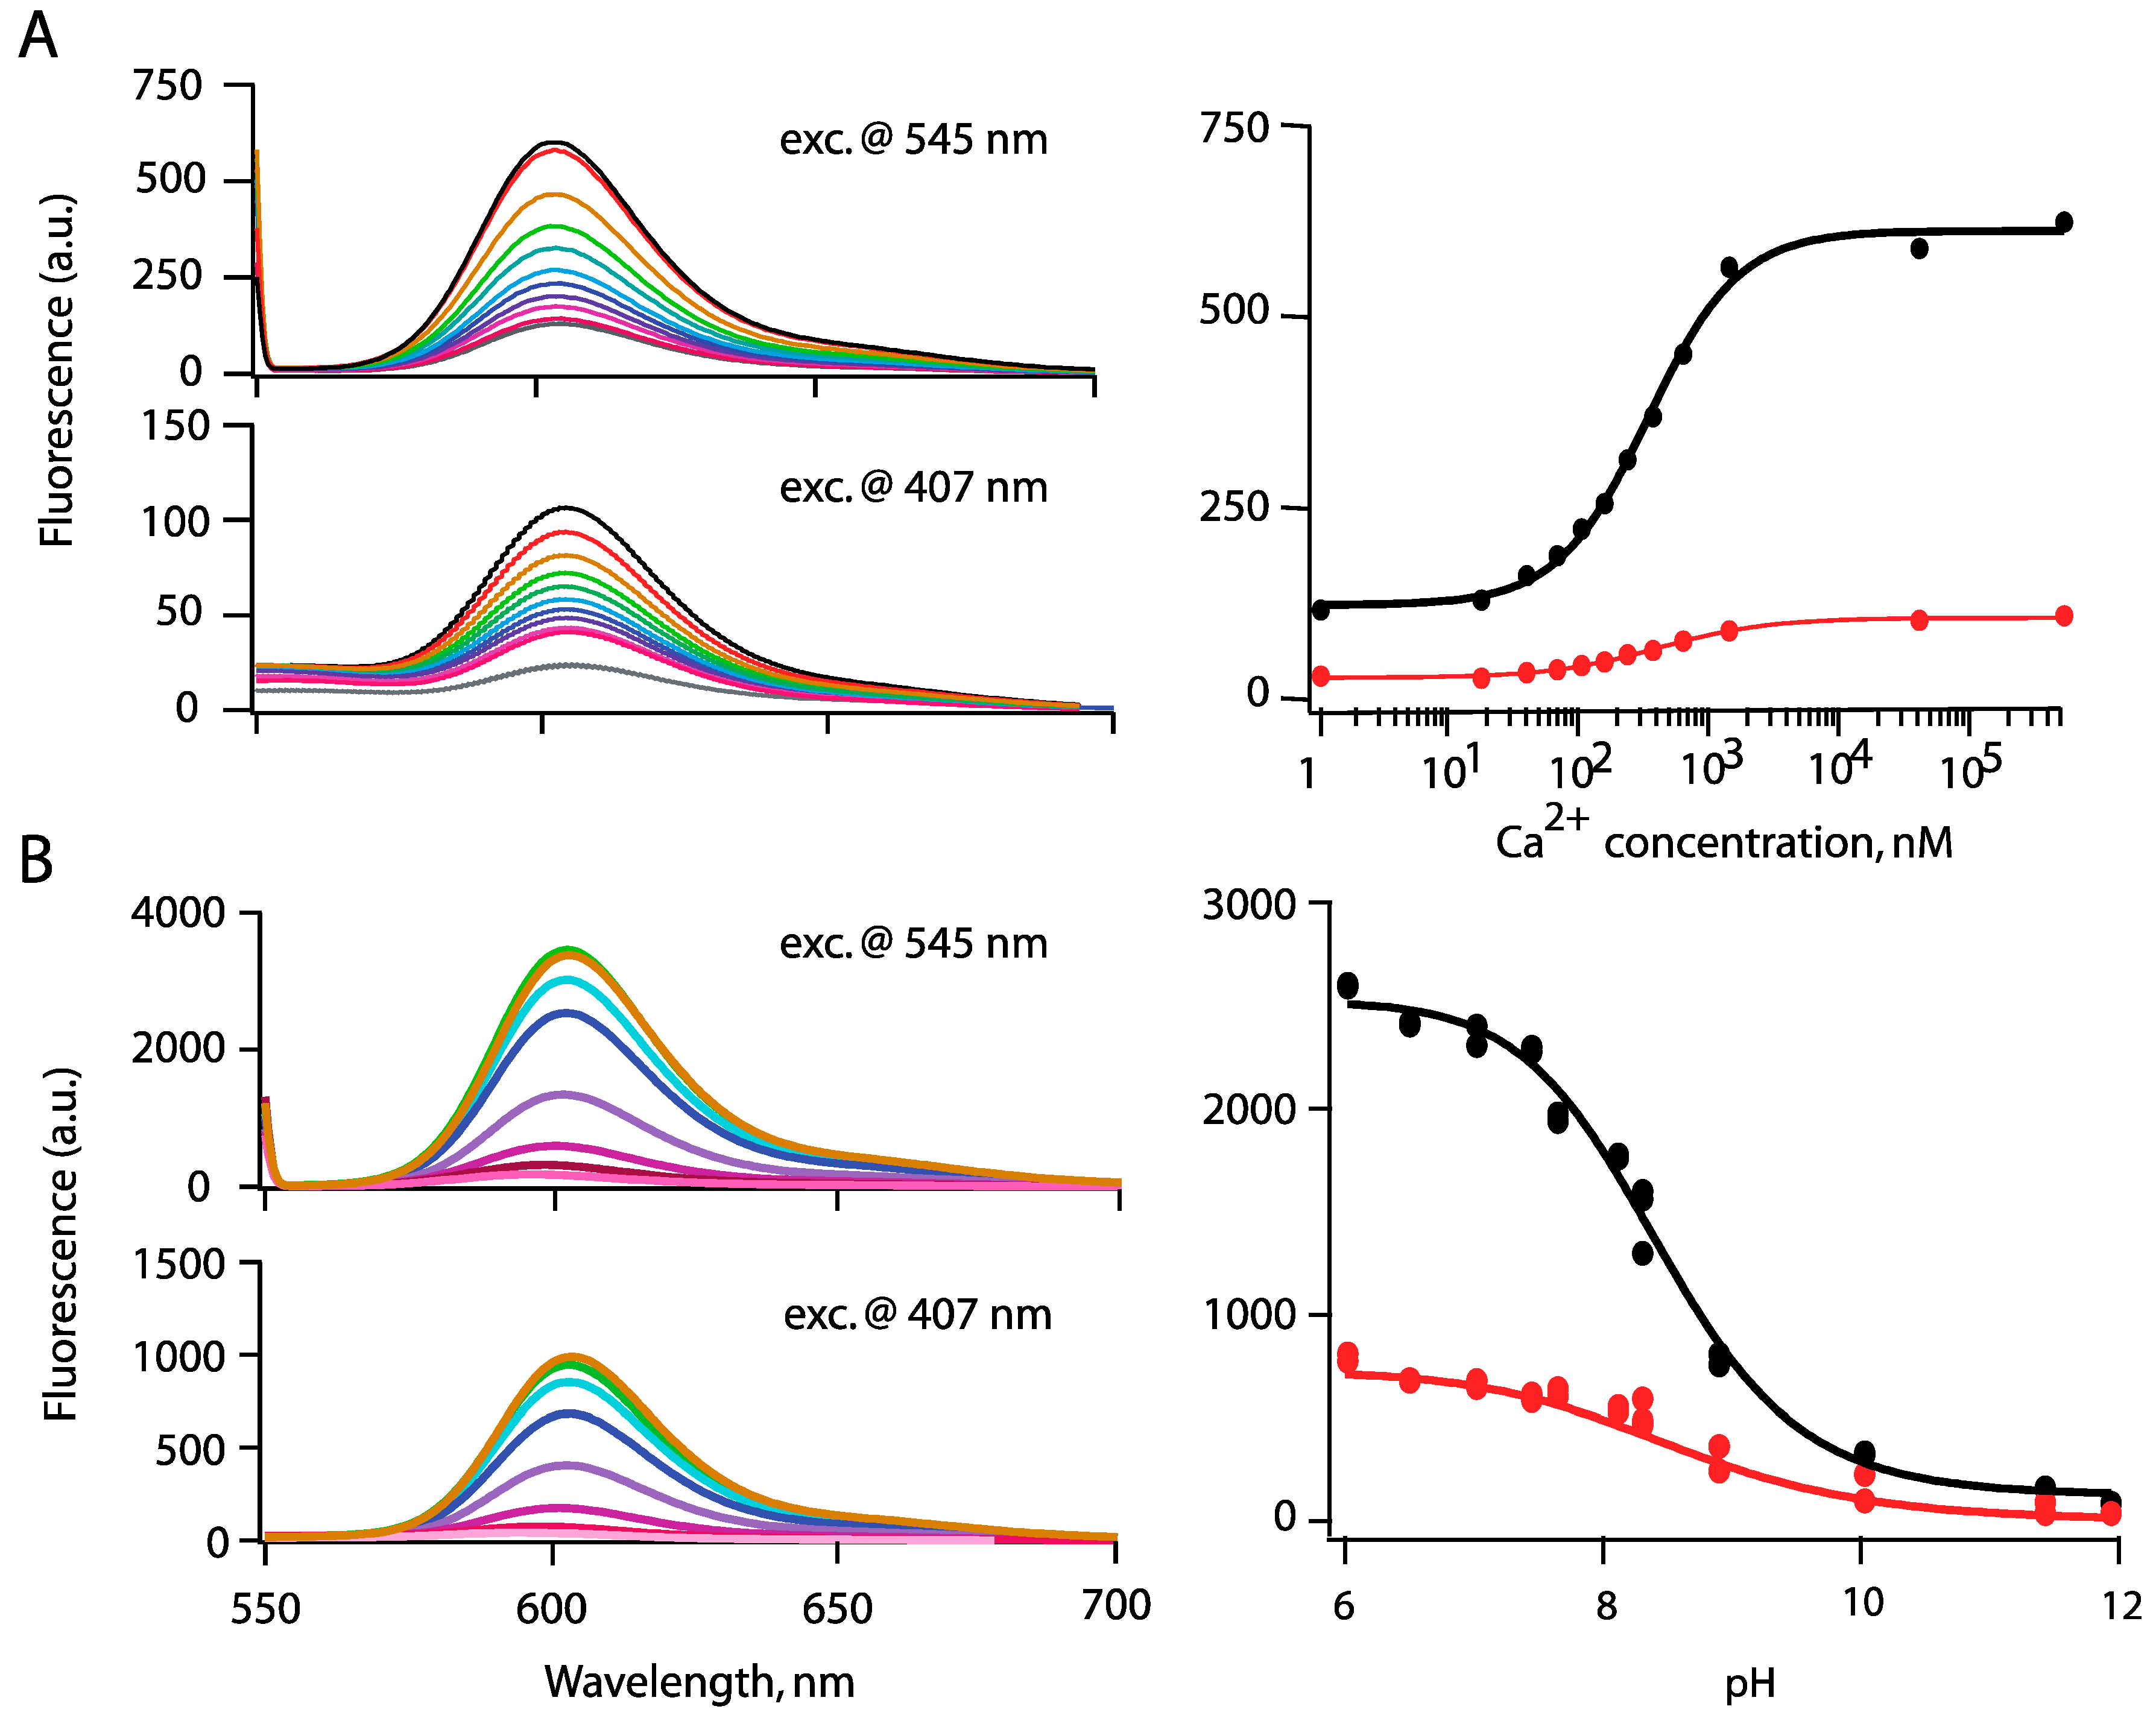
3.2. Ion Sensing

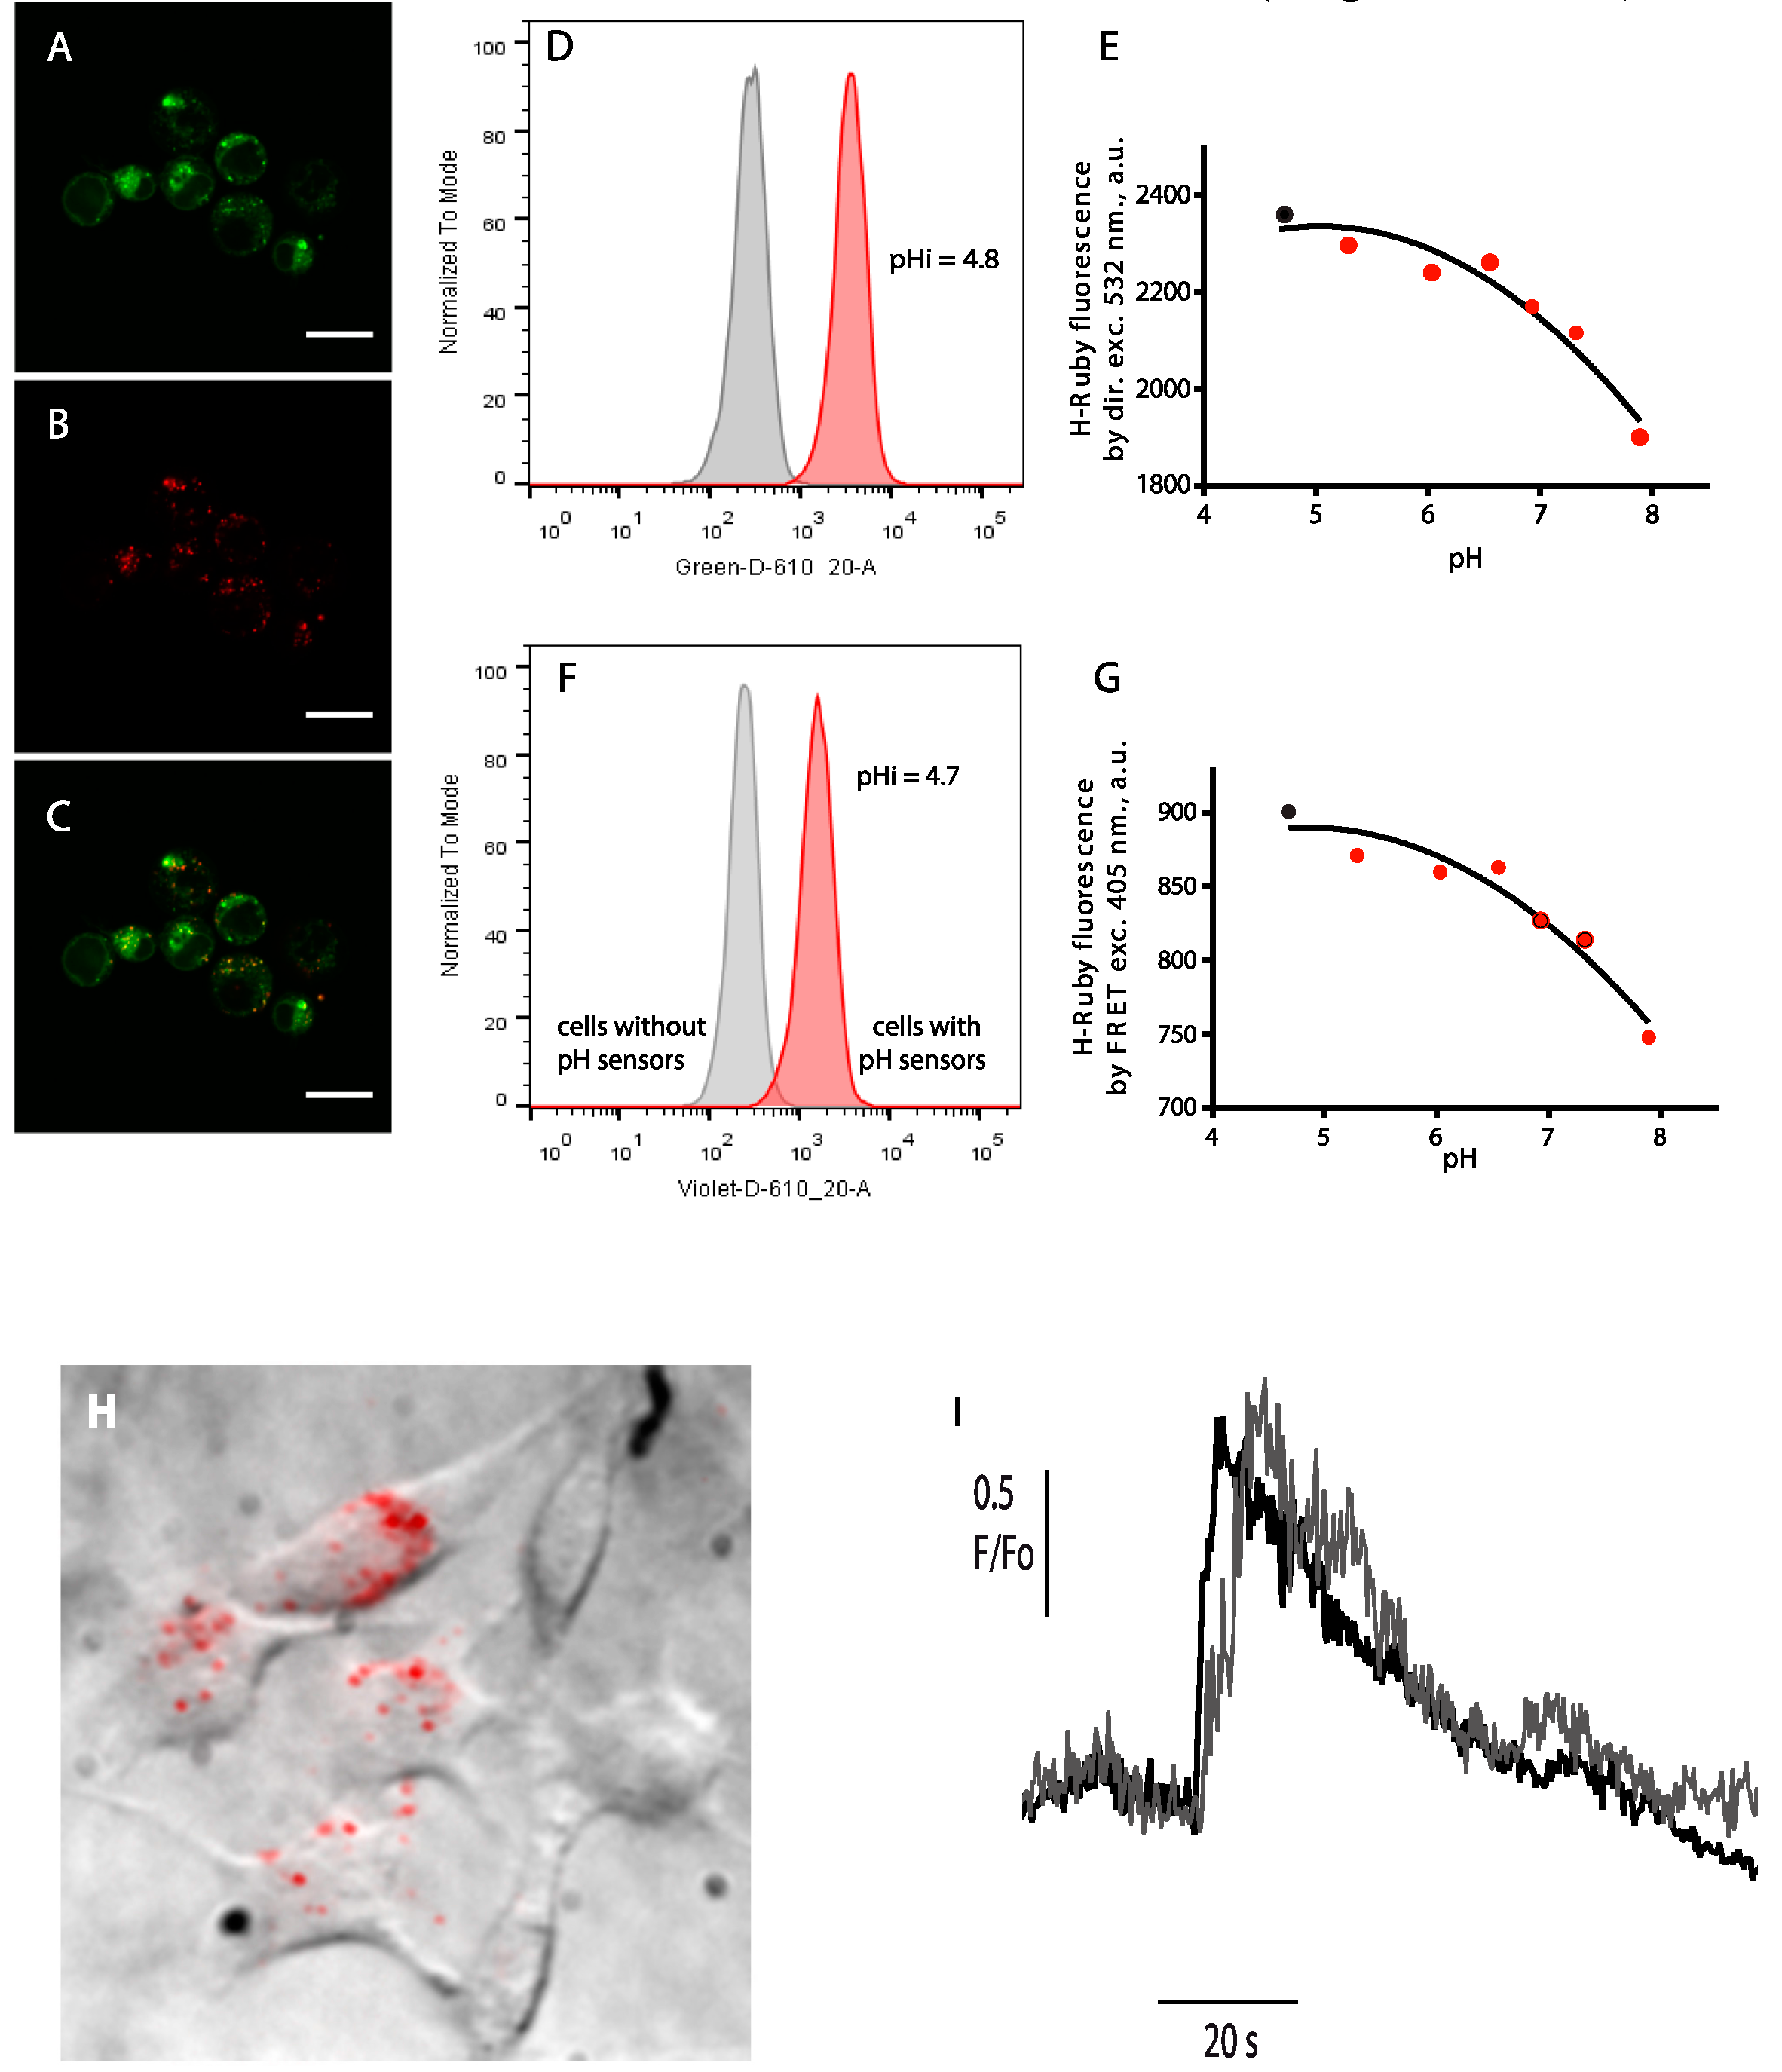
4. Cell Imaging

4.1. Internalization of HRuby-Nanosbiosensors along the Endo-/Lysosomal Route
4.2. Cytoplasmic Ca2+ Measurements
5. Discussion and Conclusions
5.1. Towards a Working in Cellulo Proton-Nanobiosensor
5.2. What is the Reason for the Loss of Dynamic Range for Ca2+ Nanobiosensing?
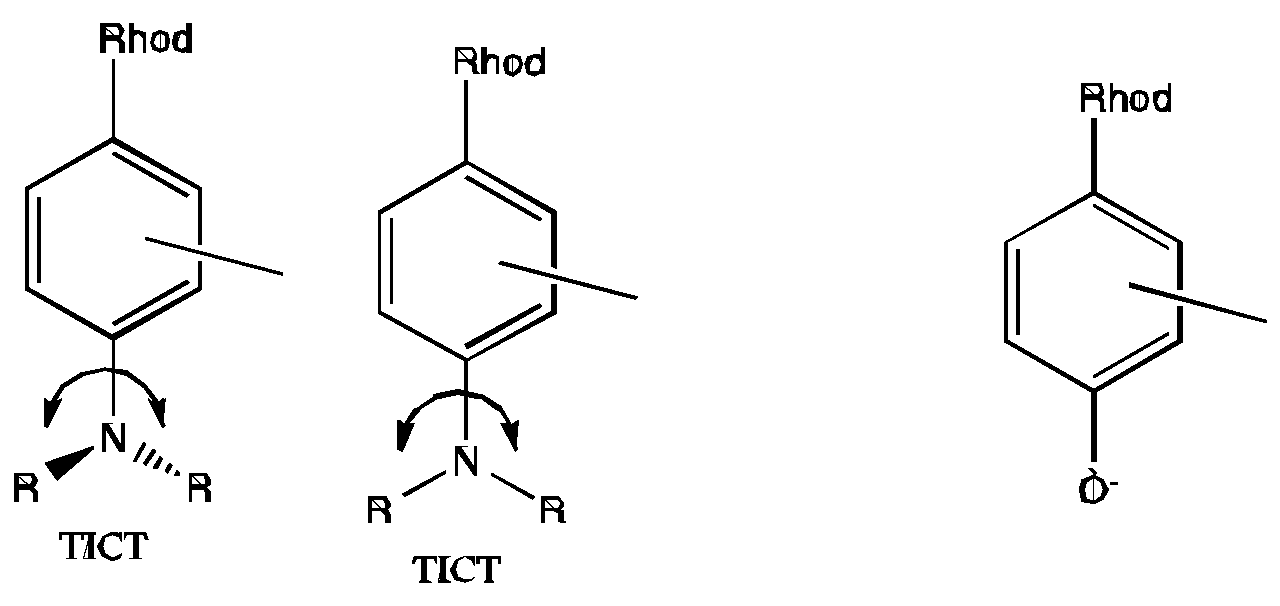
5.3. pH Sensitivity of QD Luminescence
5.4. An Effect of Surface Charge?
Supplementary Files
Supplementary File 1Acknowledgments
Author Contributions
- (i)
- The “Fluorescent red emitting functionazable Ca probes” are protected as a part of an European patent: EP-13194 728.5 and US Patent: US 61/909602.
- (ii)
- The “Fluorescent red emitting functionazable pH probes” are protected as a part of an European patent EP: 13 199 575.5 – 1451 “fluorescent red emitting functionalizable pH probes”.
Conflicts of Interest
References
- Serresi, M.; Bizzarri, R.; Cardarelli, F.; Beltram, F. Real-time measurement of endosomal acidification by a novel genetically encoded biosensor. Anal. Bioanal. Chem. 2009, 393, 1123–1133. [Google Scholar] [CrossRef] [PubMed]
- Scott, C.C.; Gruenberg, J. Ion flux and the function of endosomes and lysosomes: pH is just the start. Bioessays 2011, 33, 103–110. [Google Scholar] [CrossRef] [PubMed]
- Sazanov, L.A. A giant molecular proton pump: Structure and mechanism of respiratory complex 1. Nat. Rev. Mol. Cell Biol. 2015, 16, 375–388. [Google Scholar] [CrossRef] [PubMed]
- Savina, A.; Jancic, C.; Hugues, S.; Guermonprez, P.; Vargas, P.; Moura, I.C.; Lennon-Dumenil, A.M.; Seabra, M.C.; Raposo, G.; Amigorena, S. NOX2 controls phagosomal pH to regulate antigen processing during crosspresentation by dendritic cells. Cell 2006, 126, 205–218. [Google Scholar] [CrossRef] [PubMed]
- Joffre, O.P.; Segura, E.; Savina, A.; Amigorena, S. Cross-presentation by dendritic cells. Nat. Rev. Immunol. 2012, 12, 557–569. [Google Scholar] [CrossRef] [PubMed]
- Neher, E. The Use of Fura-2 for Estimating Ca Buffers and Ca Fluxes. Neuropharmacology 1995, 34, 1423–1442. [Google Scholar] [CrossRef]
- Prasuhn, D.E.; Feltz, A.; Blanco-Canosa, J.B.; Susumu, K.; Stewart, M.H.; Mei, B.C.; Yakovlev, A.V.; Loukov, C.; Mallet, J.M.; Oheim, M.; et al. Quantum dot peptide biosensors for monitoring caspase 3 proteolysis and calcium ions. ACS Nano 2010, 4, 5487–5497. [Google Scholar] [CrossRef] [PubMed]
- Zamaleeva, A.I.; Collot, M.; Bahembera, E.; Tisseyre, C.; Rostaing, P.; Yakovlev, A.V.; Oheim, M.; de Waard, M.; Mallet, J.M.; Feltz, A. Cell-penetrating nanobiosensors for pointillistic intracellular Ca2+-transient detection. Nano Lett. 2014, 14, 2994–3001. [Google Scholar] [CrossRef] [PubMed]
- Dennis, A.M.; Rhee, W.J.; Sotto, D.; Dublin, S.N.; Bao, G. Quantum Dot-Fluorescent Protein FRET Probes for Sensing Intracellular pH. ACS Nano 2012, 6, 2917–2924. [Google Scholar] [CrossRef] [PubMed]
- Snee, P.T.; Somers, R.C.; Nair, G.; Zimmer, J.P.; Bawendi, M.G.; Nocera, D.G. A ratiometric CdSe/ZnS nanocrystal pH sensor. J. Am. Chem. Soc. 2006, 128, 13320–13321. [Google Scholar] [CrossRef] [PubMed]
- Suzuki, M.; Husimi, Y.; Komatsu, H.; Suzuki, K.; Douglas, K.T. Quantum dot FRET biosensors that respond to pH, to proteolytic or nucleolytic cleavage, to DNA synthesis, or to a multiplexing combination. J. Am. Chem. Soc. 2008, 130, 5720–5725. [Google Scholar] [CrossRef] [PubMed]
- Whitaker, J.E.; Haugland, R.P.; Prendergast, F.G. Spectral and photophysical studies of benzo[c]xanthene dyes: Dual emission pH sensors. Anal. Biochem. 1991, 194, 330–344. [Google Scholar] [CrossRef]
- Han, J.; Burgess, K. Fluorescent indicators for intracellular pH. Chem. Rev. 2010, 110, 2709–2728. [Google Scholar] [CrossRef] [PubMed]
- Modi, S.; Nizak, C.; Surana, S.; Halder, S.; Krishnan, Y. Two DNA nanomachines map pH changes along intersecting endocytic pathways inside the same cell. Nat. Nanotechnol. 2013, 8, 459–467. [Google Scholar] [CrossRef] [PubMed]
- Gaillard, S.; Yakovlev, A.; Luccardini, C.; Oheim, M.; Feltz, A.; Mallet, J.M. Synthesis and characterization of a new red-emitting Ca2+ indicator, calcium ruby. Org. Lett. 2007, 9, 2629–2632. [Google Scholar] [CrossRef] [PubMed]
- Luccardini, C.; Yakovlev, A.V.; Pasche, M.; Gaillard, S.; Li, D.; Rousseau, F.; Ly, R.; Becherer, U.; Mallet, J.M.; Feltz, A.; et al. Measuring mitochondrial and cytoplasmic Ca2+ in EGFP expressing cells with a low-affinity calcium Ruby and its dextran conjugate. Cell Calcium 2009, 45, 275–283. [Google Scholar] [CrossRef] [PubMed]
- Collot, M.; Loukou, C.; Yakovlev, A.V.; Wilms, C.D.; Li, D.; Evrard, A.; Zamaleeva, A.; Bourdieu, L.; Leger, J.F.; Ropert, N.; et al. Calcium rubies: A family of red-emitting functionalizable indicators suitable for two-photon Ca2+ imaging. J. Am. Chem. Soc. 2012, 134, 14923–14931. [Google Scholar] [CrossRef] [PubMed]
- Collot, M.; Wilms, C.D.; Bentkhayet, A.; Marcaggi, P.; Couchman, K.; Charpak, S.; Dieudonne, S.; Hausser, M.; Feltz, A.; Mallet, J.M. CaRuby-Nano: A novel high affinity calcium probe for dual color imaging. Elife 2015, 4, e05808. [Google Scholar] [CrossRef] [PubMed]
- Despras, G.; Zamaleeva, A.; Dardevet, L.; Tisseyre, C.; Magalhaes, J.G.; Garner, C.; de Waard, M.; Amigorena, S.; Mallet, J.-M.; et al. A new family of red emitting fluorescent pH sensors for living cells. Chem. Sci. 2015, 6, 5928–5937. [Google Scholar] [CrossRef]
- Vogel, A.I. Vogel’s Textbook of Quantitative Chemical Analysis; Longman Group UK Limited: Harlow, UK, 1989. [Google Scholar]
- Oheim, M.; van’t Hoff, M.; Feltz, A.; Zamaleeva, A.; Mallet, J.M.; Collot, M. New red-fluorescent calcium indicators for optogenetics, photoactivation and multi-color imaging. Biochim. Biophys. Acta 2014, 1843, 2284–2306. [Google Scholar] [CrossRef] [PubMed]
- Kolb, H.C.; Finn, M.G.; Sharpless, K.B. Click chemistry: Diverse chemical function from a few good reactions. Angew. Chem. Int. Ed. Eng. 2001, 40, 2004–2021. [Google Scholar] [CrossRef]
- Tsien, R.Y. New calcium indicators and buffers with high selectivity against magnesium and protons: Design, synthesis, and properties of prototype structures. Biochemistry 1980, 19, 2396–2404. [Google Scholar] [CrossRef] [PubMed]
- Modi, S.; Swetha, M.G.; Goswami, D.; Gupta, G.D.; Mayor, S.; Krishnan, Y. A DNA nanomachine that maps spatial and temporal pH changes inside living cells. Nat. Nanotechnol. 2009, 4, 325–330. [Google Scholar] [CrossRef] [PubMed]
- Zhang, L.W.; Monteiro-Riviere, N.A. Mechanisms of quantum dot nanoparticle cellular uptake. Toxicol. Sci. 2009, 110, 138–155. [Google Scholar] [CrossRef] [PubMed]
- Fischer, H.C.; Hauck, T.S.; Gomez-Aristizabal, A.; Chan, W.C.W. Exploring primary liver macrophages for studying quantum dot interactions with biological systems. Adv. Mater. 2010, 22, 2520–2524. [Google Scholar] [CrossRef] [PubMed]
- Xiao, Y.; Forry, S.P.; Gao, X.; Holbrook, R.D.; Telford, W.G.; Tona, A. Dynamics and mechanisms of quantum dot nanoparticle cellular uptake. J. Nanobiotechnol. 2010, 8, 13. [Google Scholar] [CrossRef] [PubMed]
- Poillot, C.; Bichraoui, H.; Tisseyre, C.; Bahembera, E.; Andreotti, N.; Sabatier, J.M.; Ronjat, M.; de Waard, M. Small efficient cell-penetrating peptides derived from scorpion toxin maurocalcine. J. Biol. Chem. 2012, 287, 17331–17342. [Google Scholar] [CrossRef] [PubMed]
- Tisseyre, C.; Bahembera, E.; Dardevet, L.; Sabatier, J.M.; Ronjat, M.; de Waard, M. Cell penetration properties of a highly efficient mini maurocalcine Peptide. Pharmaceuticals 2013, 6, 320–339. [Google Scholar] [CrossRef] [PubMed]
- Hansen, K.B.; Brauner-Osborne, H.; Egebjerg, J. Pharmacological characterization of ligands at recombinant NMDA receptor subtypes by electrophysiological recordings and intracellular calcium measurements. Comb. Chem. High Throughput. Screen 2008, 11, 304–315. [Google Scholar] [CrossRef] [PubMed]
- Du, H.; Kim, C.; Corradini, M.G.; Ludescher, R.D.; Rogers, M.A. Micro-viscosity of liquid oil confined in colloidal fat crystal networks. Soft Matter 2014, 10, 8652–8658. [Google Scholar] [CrossRef] [PubMed]
- Haidekker, M.A.; Theodorakis, E.A. Environment-sensitive behavior of fluorescent molecular rotors. J. Biol. Eng. 2010, 4, 11. [Google Scholar] [CrossRef] [PubMed]
- Plaza, P.; Dai Hung, N.; Martin, M.M.; Meyer, Y.H. Ultrafast internal charge transfer in a donor-modified rhodamine. Chem. Phys. 1992, 168, 365–373. [Google Scholar] [CrossRef]
- Zhang, F.; Ali, Z.; Amin, F.; Feltz, A.; Oheim, M.; Parak, W.J. Ion and pH sensing with colloidal nanoparticles: Influence of surface charge on sensing and colloidal properties. ChemPhysChem 2010, 11, 730–735. [Google Scholar] [CrossRef] [PubMed]
- Riedinger, A.; Zhang, F.; Dommershausen, F.; Rocker, C.; Brandholt, S.; Nienhaus, G.U.; Koert, U.; Parak, W.J. Ratiometric optical sensing of chloride ions with organic fluorophore-gold nanoparticle hybrids: A systematic study of design parameters and surface charge effects. Small 2010, 6, 2590–2597. [Google Scholar] [CrossRef] [PubMed]
- Kreft, O.; Javier, A.M.; Sukhorukov, G.B.; Parak, W.J. Polymer microcapsules as mobile local pH-sensors. J. Mater. Chem. 2007, 17, 4471–4476. [Google Scholar] [CrossRef]
- Gil, P.R.; Nazarenus, M.; Ashraf, S.; Parak, W.J. pH-sensitive capsules as intracellular optical reporters for monitoring lysosomal pH changes upon stimulation. Small 2012, 8, 943–948. [Google Scholar] [PubMed]
- Kantner, K.; Ashraf, S.; Carregal-Romero, S.; Carrillo-Carrion, C.; Collot, M.; del Pino, P.; Heimbrodt, W.; de Aberasturi, D.J.; Kaiser, U.; Kazakova, L.I.; et al. Particle-based optical sensing of intracellular ions at the example of calcium—what are the experimental pitfalls? Small 2015, 11, 896–904. [Google Scholar] [CrossRef] [PubMed]
© 2015 by the authors; licensee MDPI, Basel, Switzerland. This article is an open access article distributed under the terms and conditions of the Creative Commons Attribution license (http://creativecommons.org/licenses/by/4.0/).
Share and Cite
Zamaleeva, A.I.; Despras, G.; Luccardini, C.; Collot, M.; De Waard, M.; Oheim, M.; Mallet, J.-M.; Feltz, A. FRET-Based Nanobiosensors for Imaging Intracellular Ca2+ and H+ Microdomains. Sensors 2015, 15, 24662-24680. https://doi.org/10.3390/s150924662
Zamaleeva AI, Despras G, Luccardini C, Collot M, De Waard M, Oheim M, Mallet J-M, Feltz A. FRET-Based Nanobiosensors for Imaging Intracellular Ca2+ and H+ Microdomains. Sensors. 2015; 15(9):24662-24680. https://doi.org/10.3390/s150924662
Chicago/Turabian StyleZamaleeva, Alsu I., Guillaume Despras, Camilla Luccardini, Mayeul Collot, Michel De Waard, Martin Oheim, Jean-Maurice Mallet, and Anne Feltz. 2015. "FRET-Based Nanobiosensors for Imaging Intracellular Ca2+ and H+ Microdomains" Sensors 15, no. 9: 24662-24680. https://doi.org/10.3390/s150924662
APA StyleZamaleeva, A. I., Despras, G., Luccardini, C., Collot, M., De Waard, M., Oheim, M., Mallet, J.-M., & Feltz, A. (2015). FRET-Based Nanobiosensors for Imaging Intracellular Ca2+ and H+ Microdomains. Sensors, 15(9), 24662-24680. https://doi.org/10.3390/s150924662