
Energy-Efficient Crowdsensing of Human Mobility and Signal Levels in Cellular Networks


Abstract
:1. Introduction
- We improve the energy-efficient GPS tracking, for example by using signal strength of GPS satellites to avoid unnecessary battery drain, and show how to implement it for crowdsourcing (Section 5).
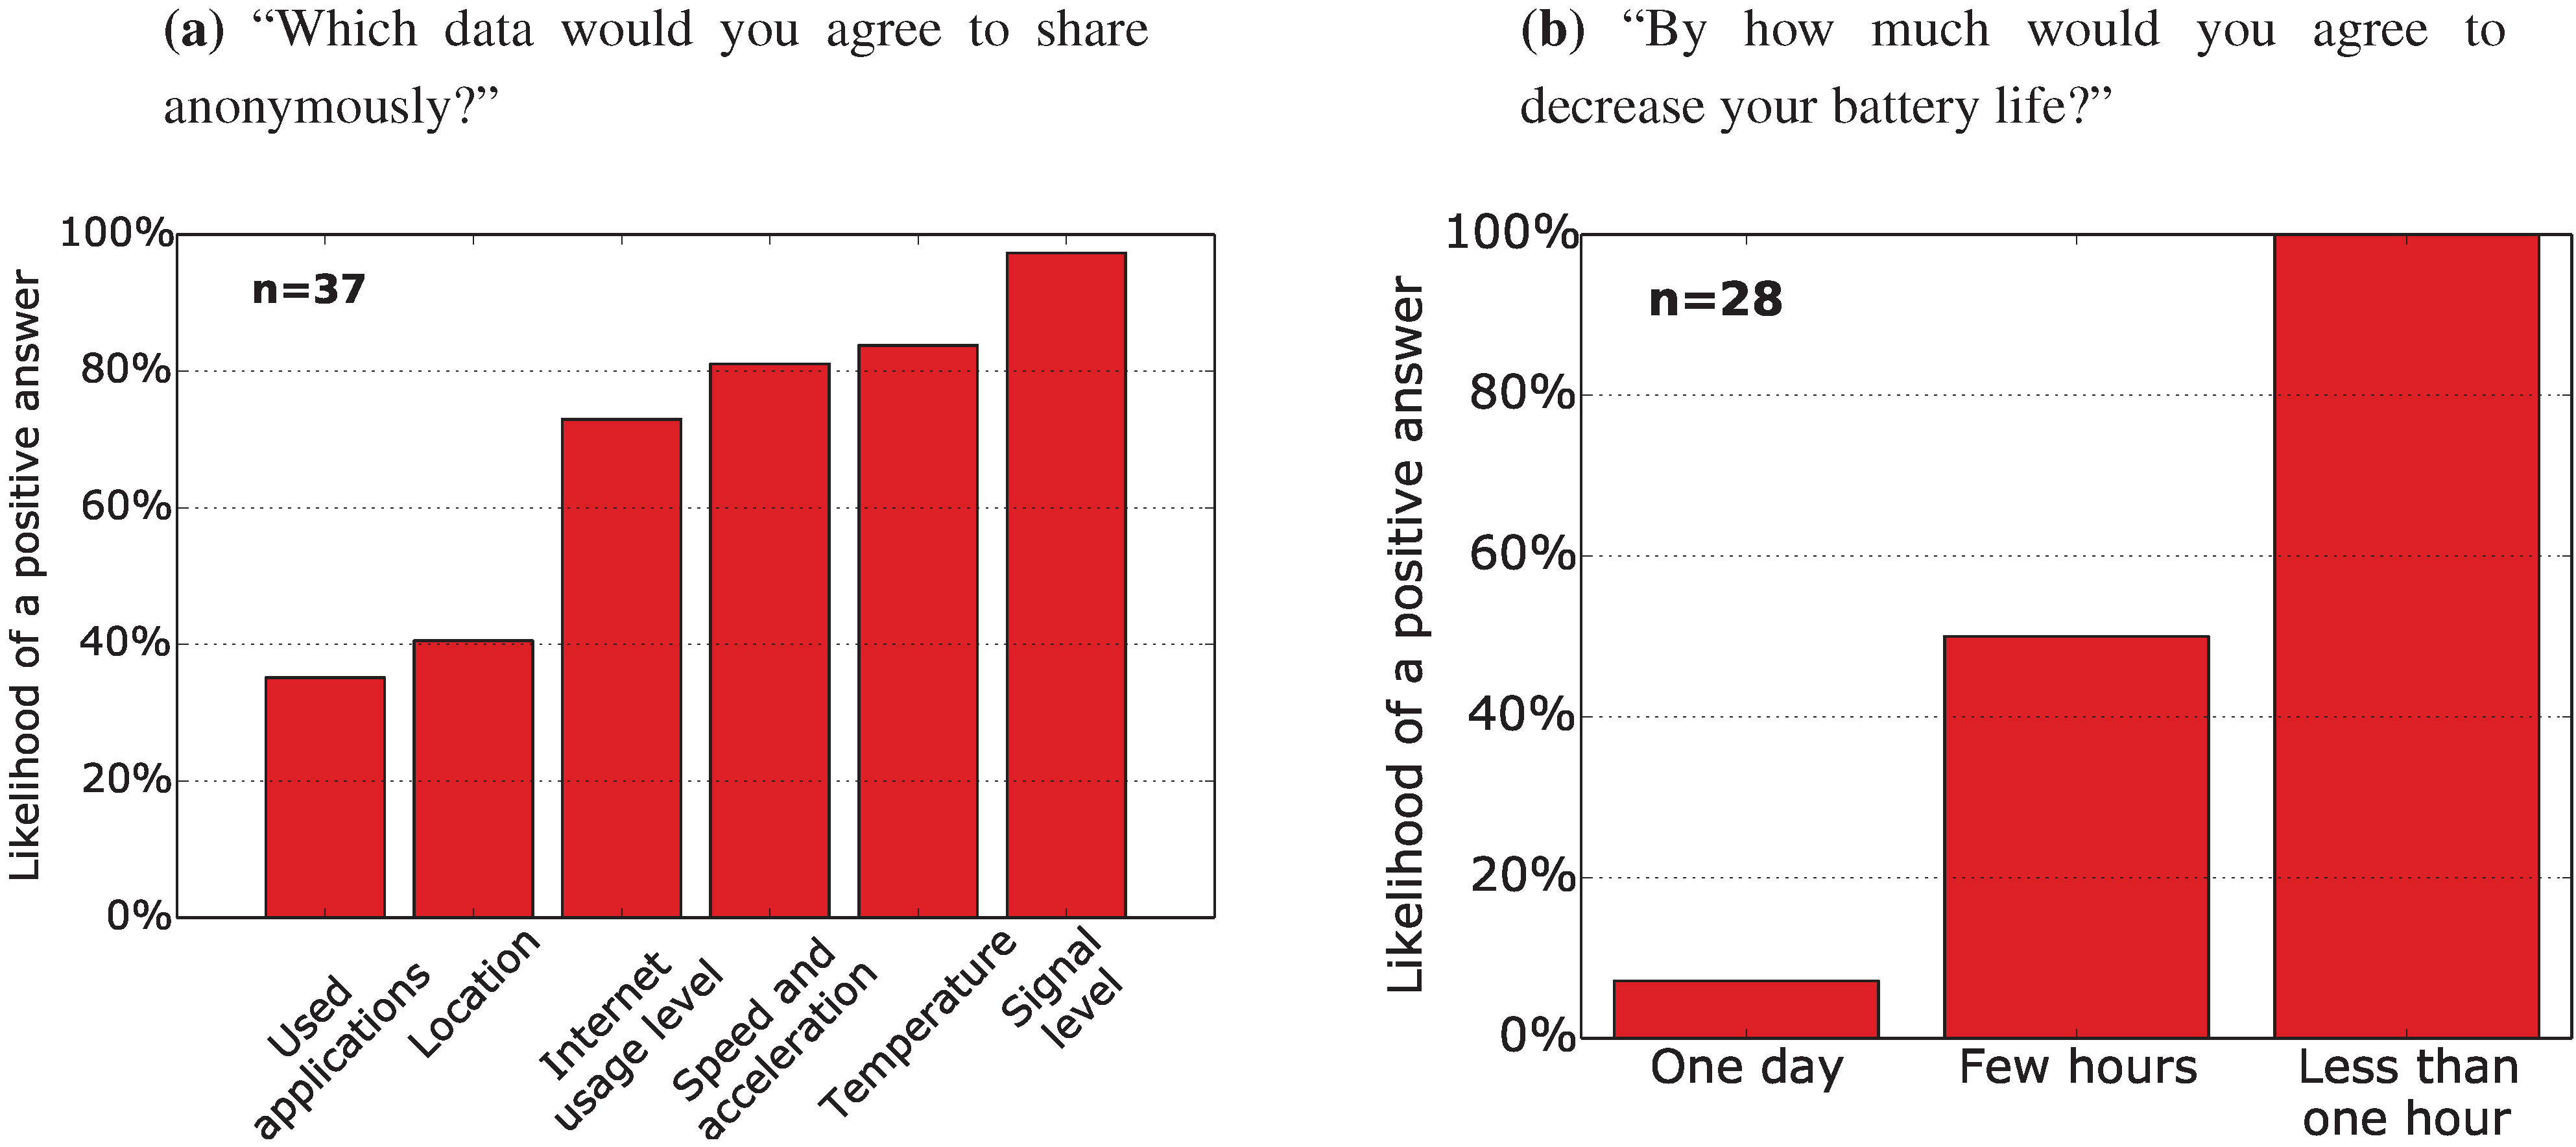
- In an online survey of 100 people, we found that 37% of our respondents would agree to participate in crowdsourcing, but they expect a minimum impact on their battery lifetime and phone usage habits (Section 3).
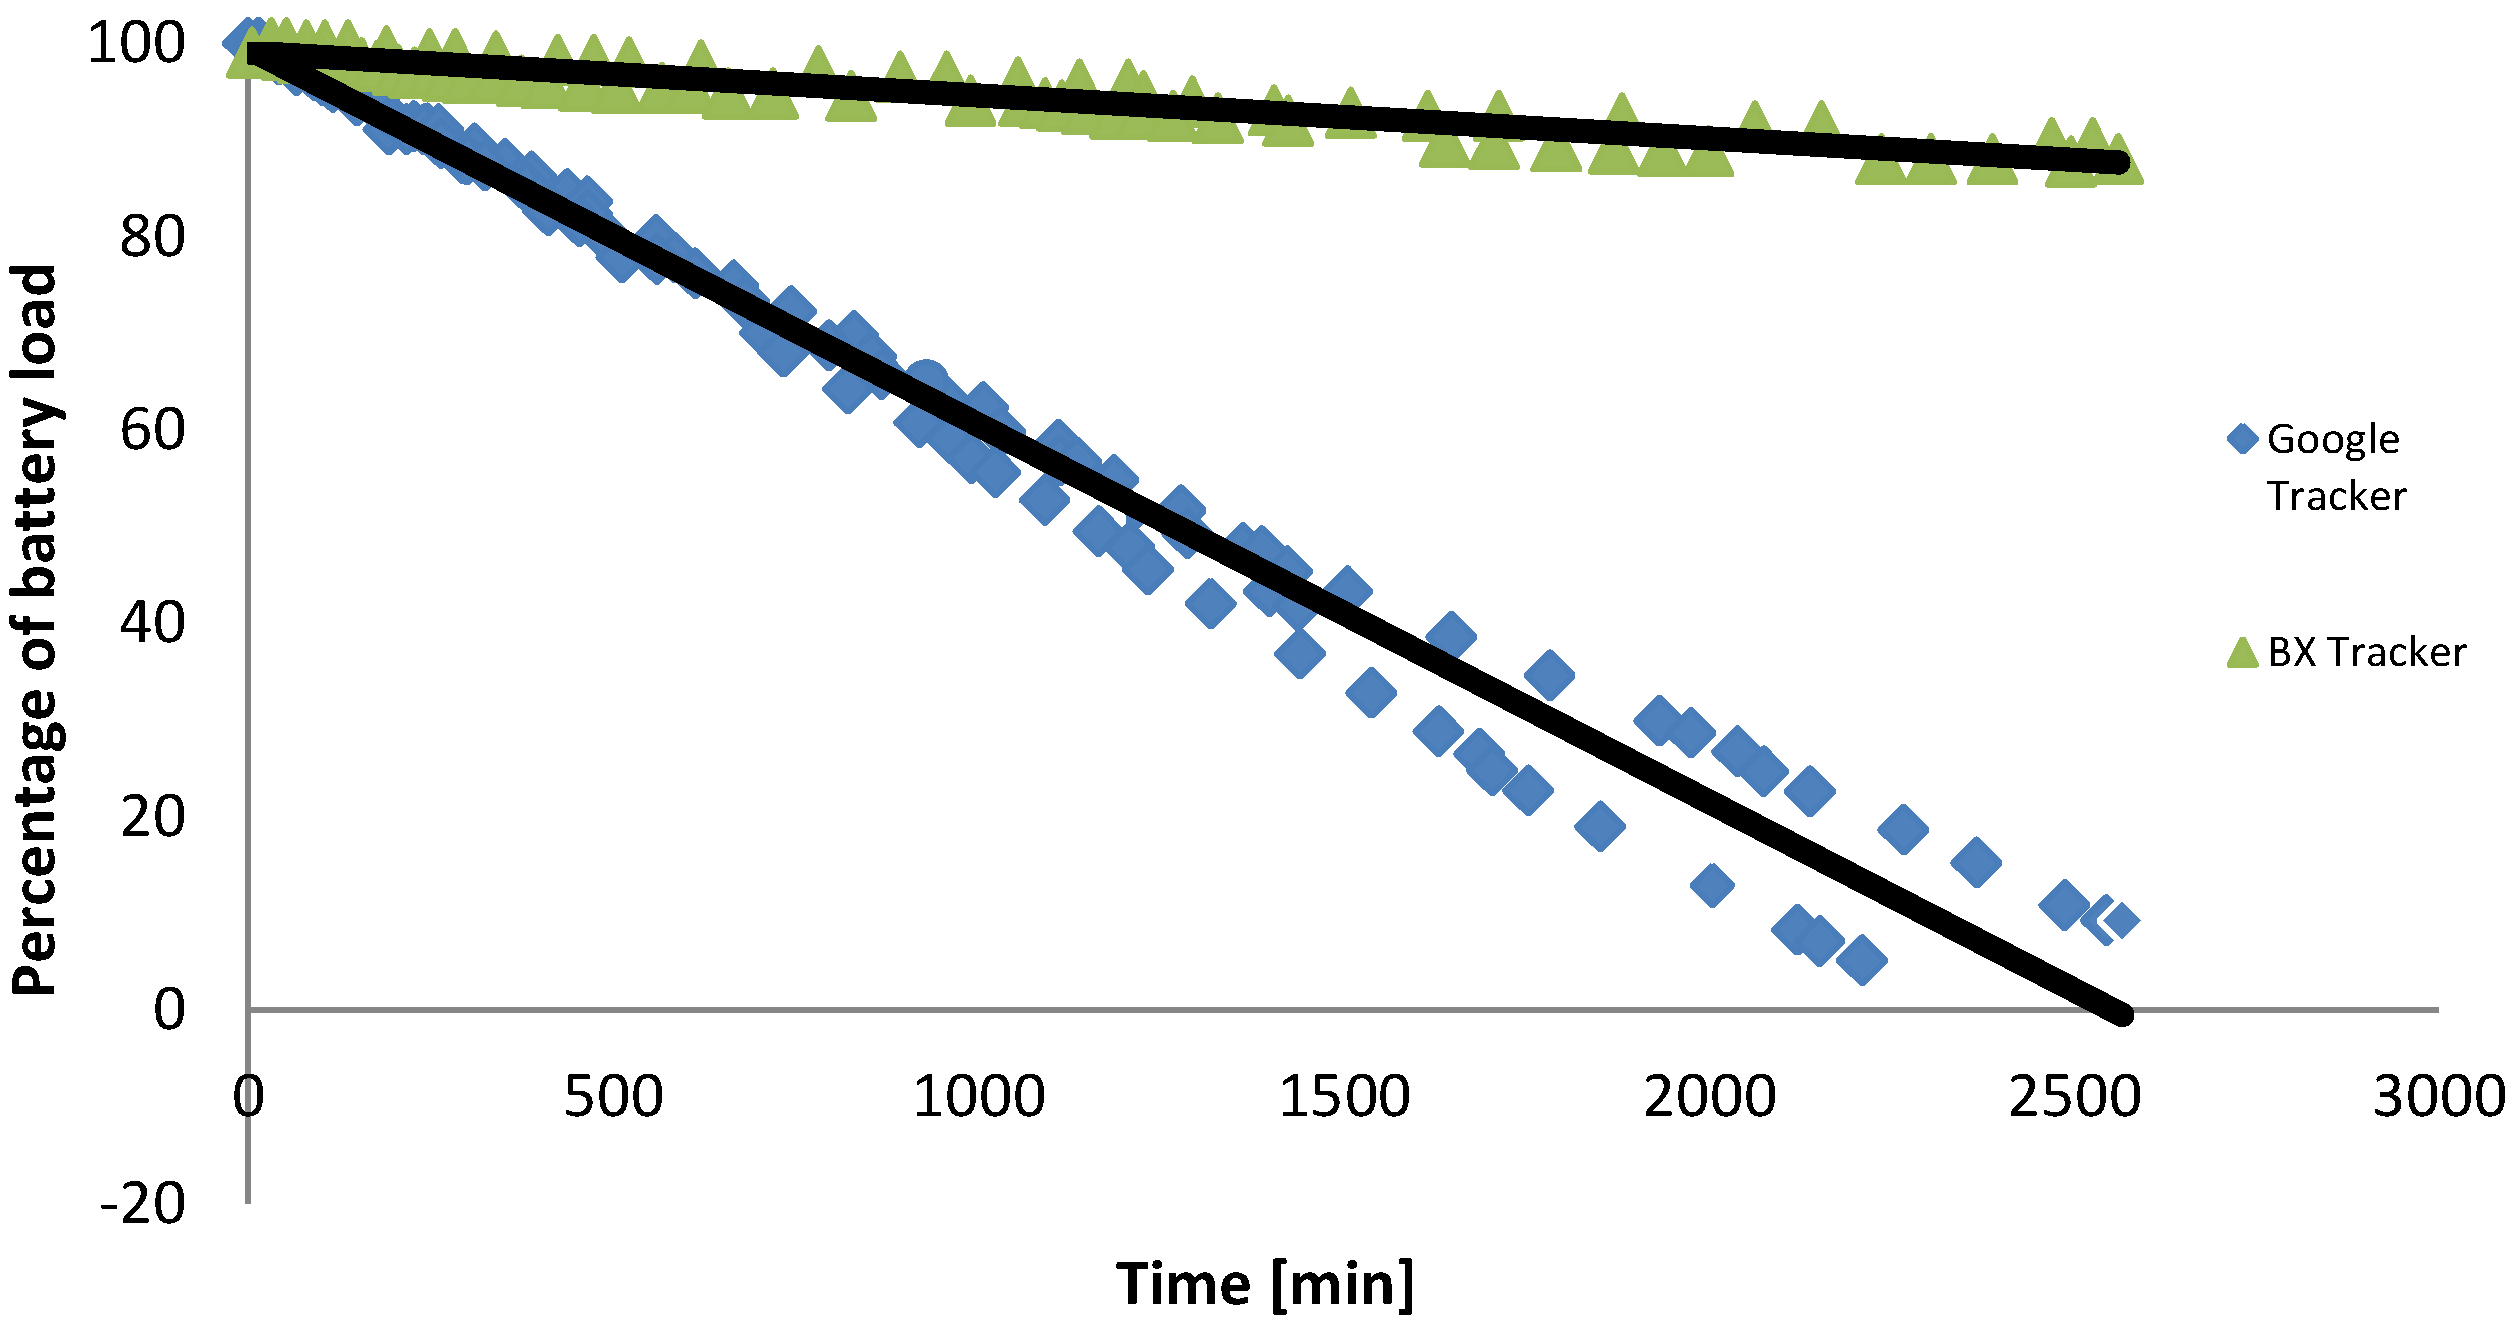
- By running a two-week experiment on various Android devices, we found that, on average, our tracking application reduced the battery lifetime by 20% (Section 5.3 pt 1).
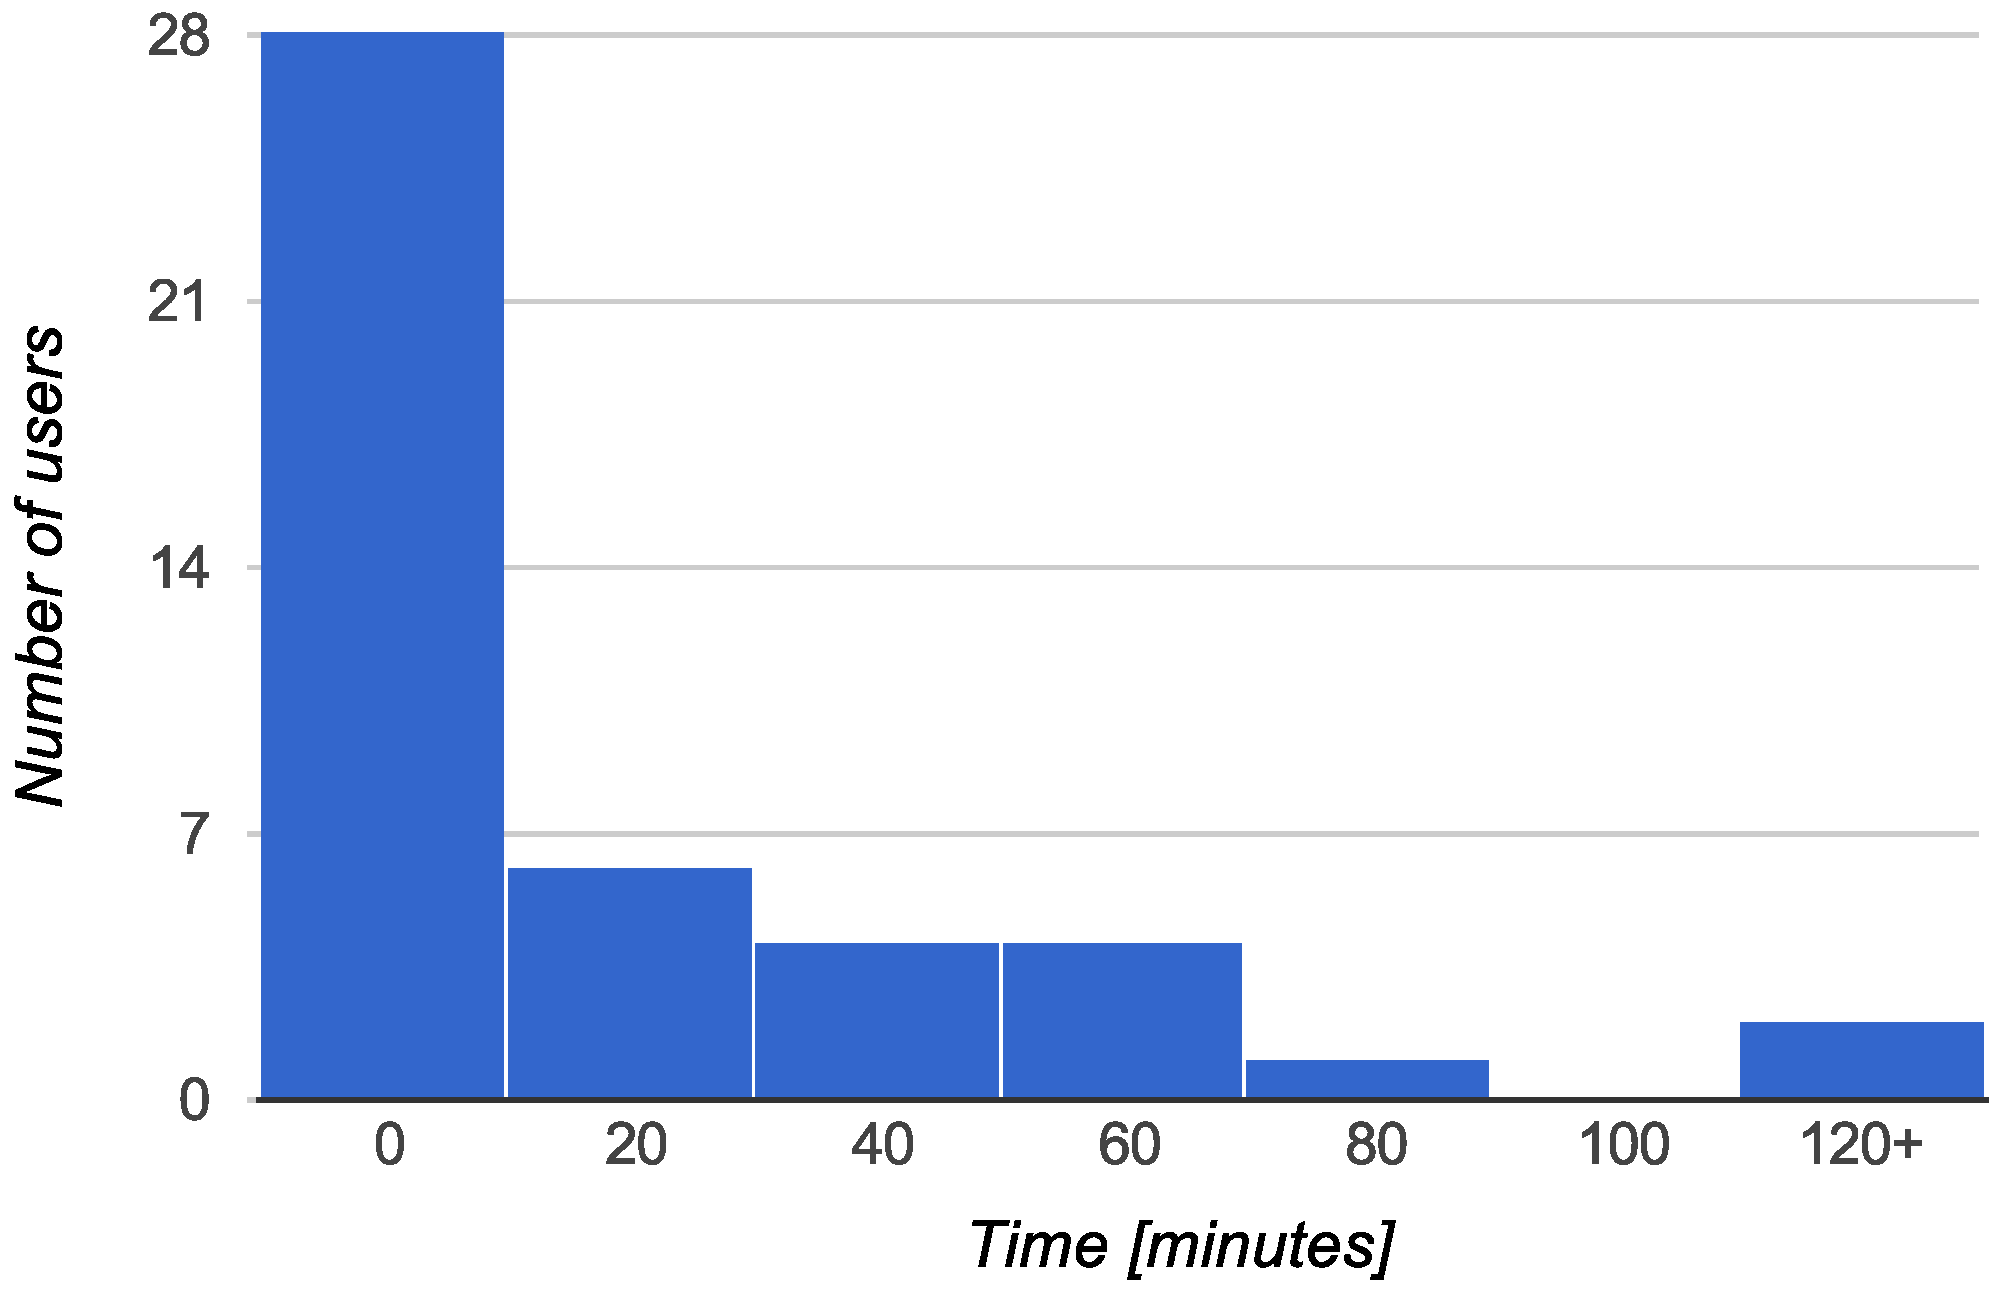
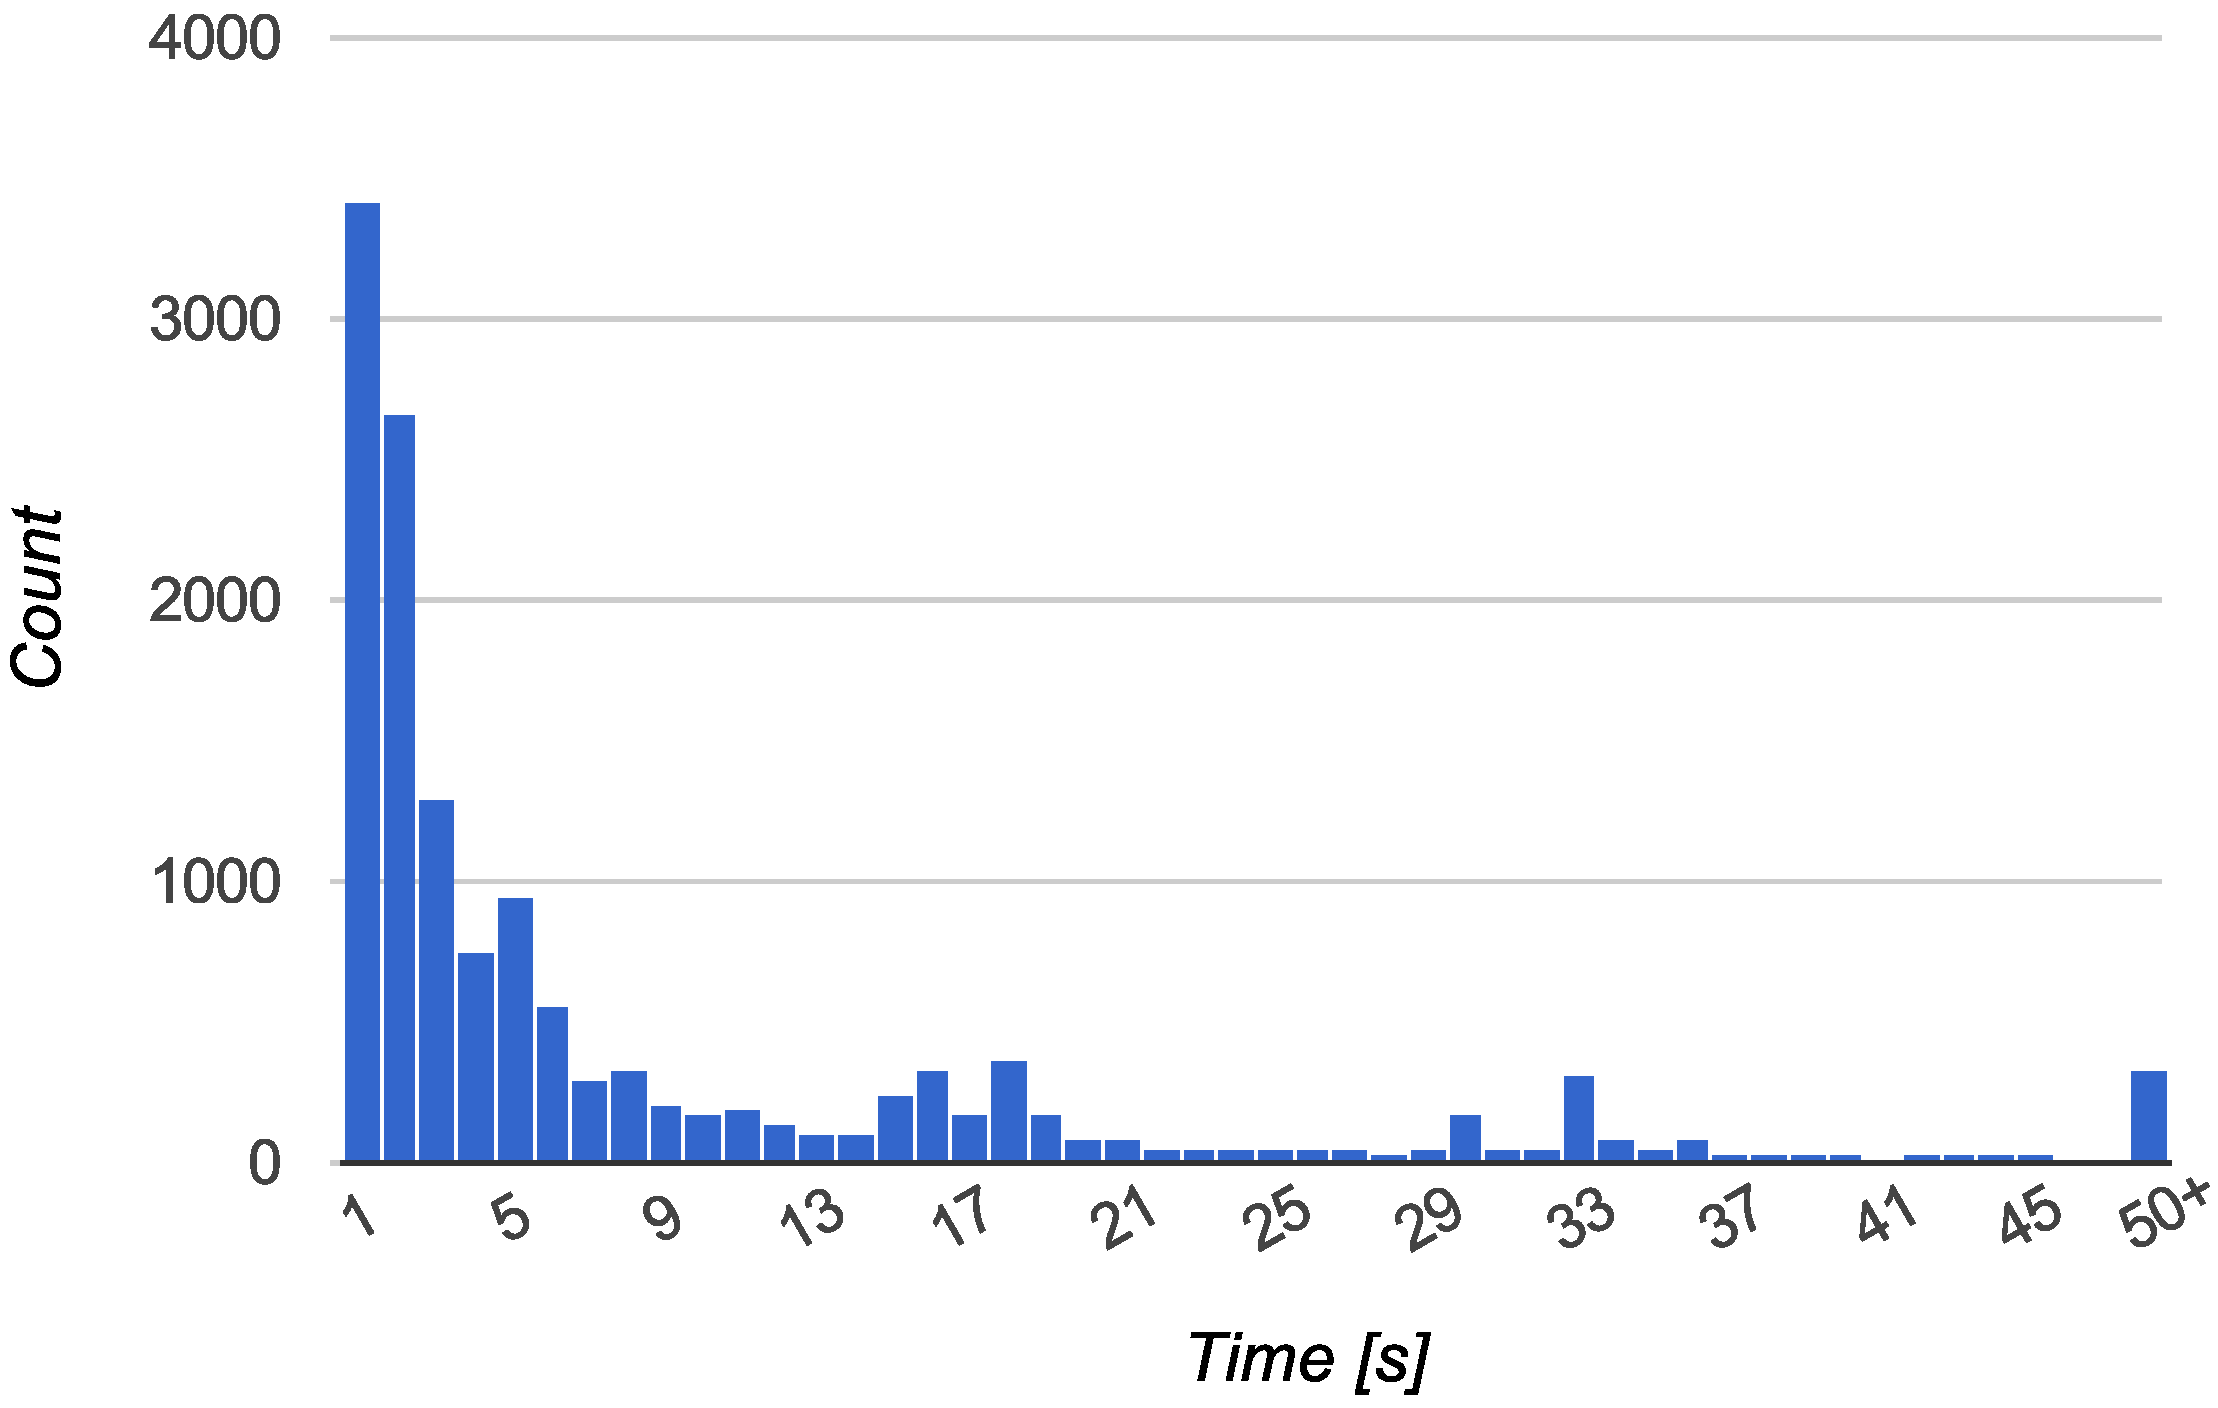
- By analyzing real data on 272,000 searches for a GPS fix (acquiring the radio signal from satellites to calculate the position) on mobile platforms, we found that 92% of searches stopped in under 30 s, and 84% of platform users experienced a daily GPS duty cycle below 5%, which roughly corresponds to one hour of movement a day (Section 5.3 pt 2).
2. Related Work
3. Analysis of Barriers for Participation in Crowdsensing


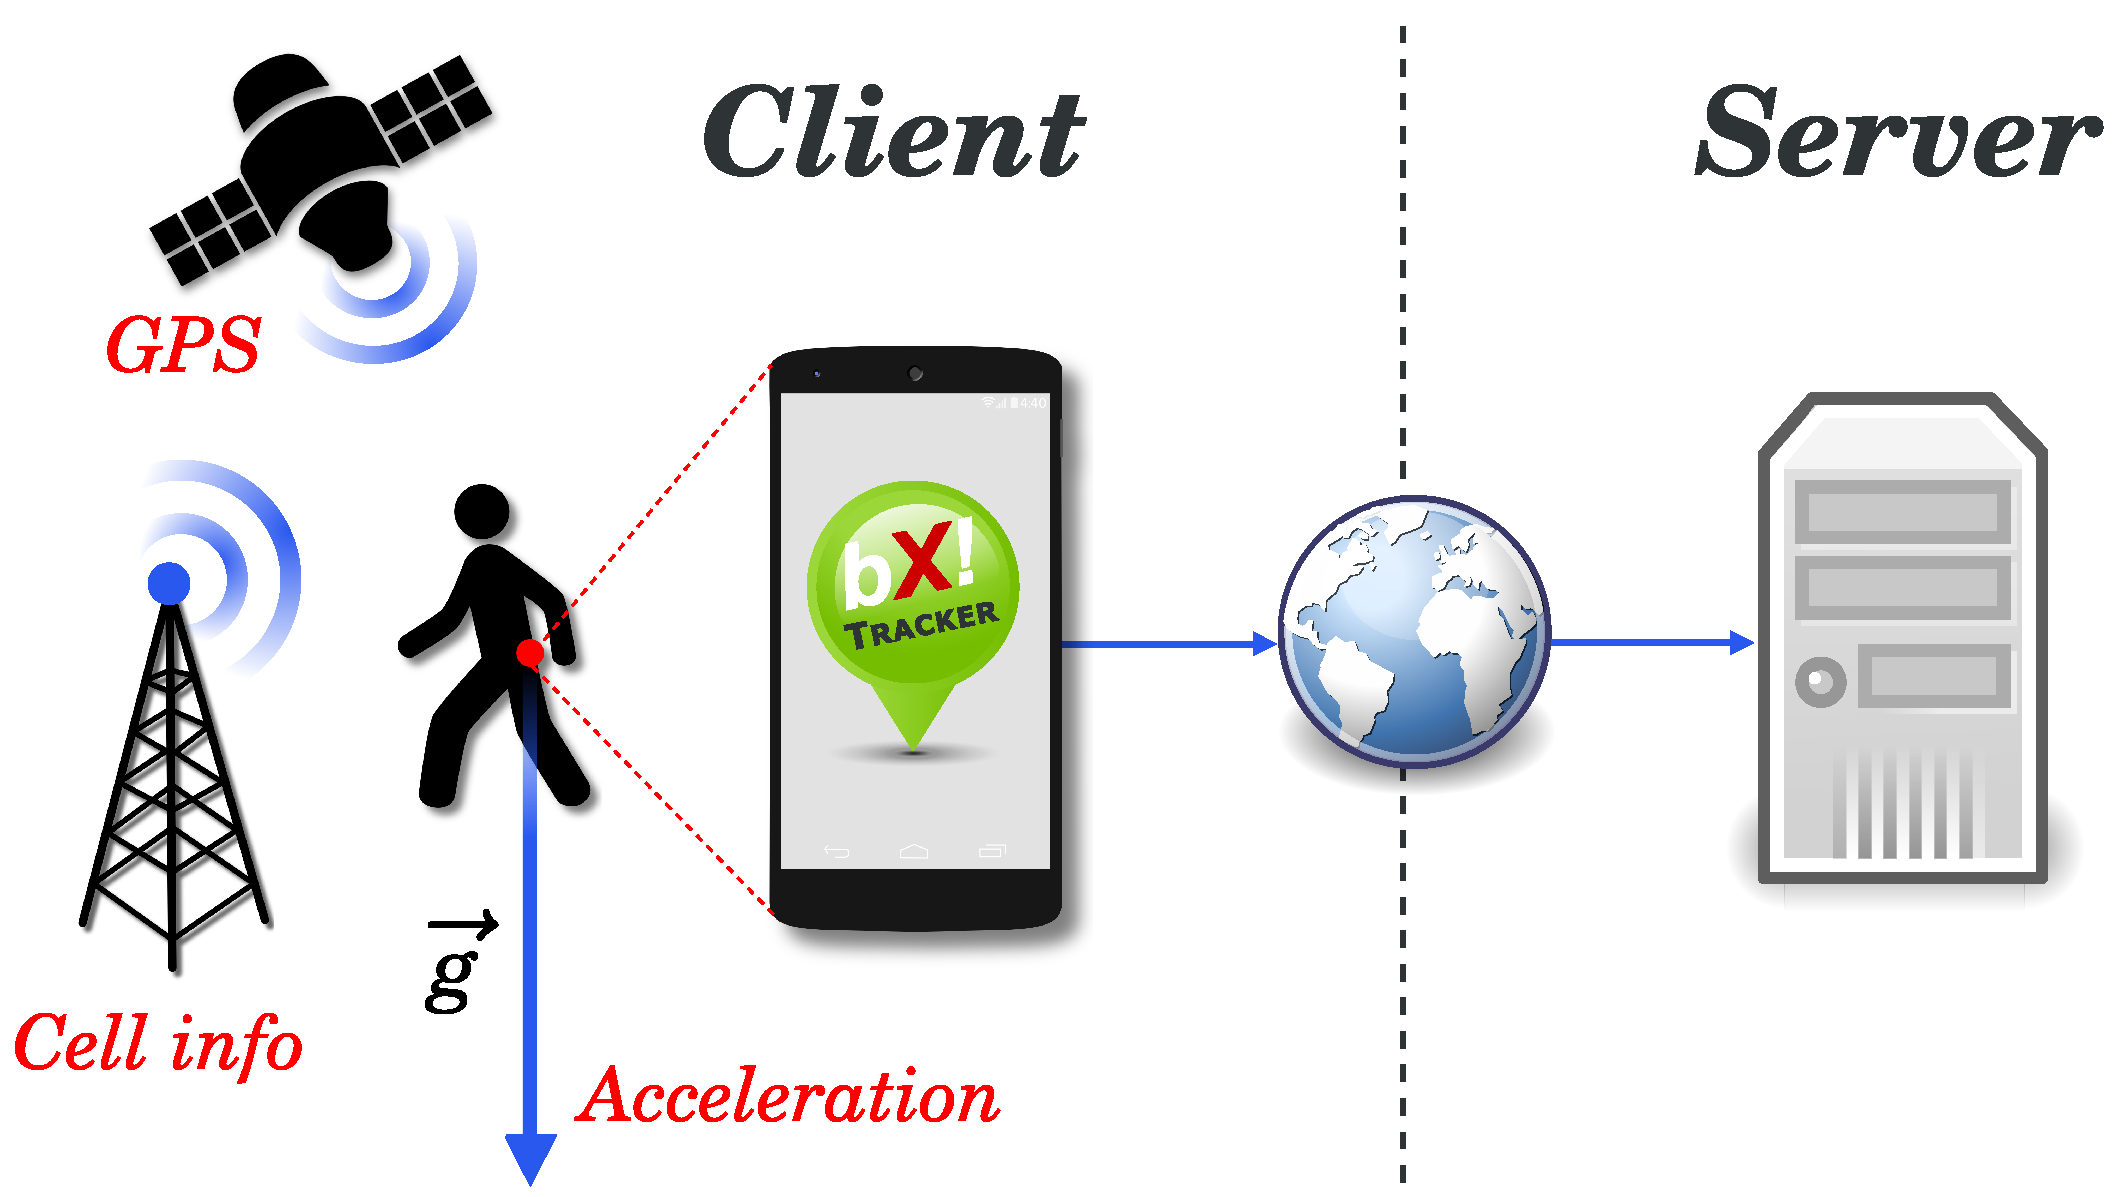
4. BX Tracker: An Energy-Efficient Crowdsensing Platform
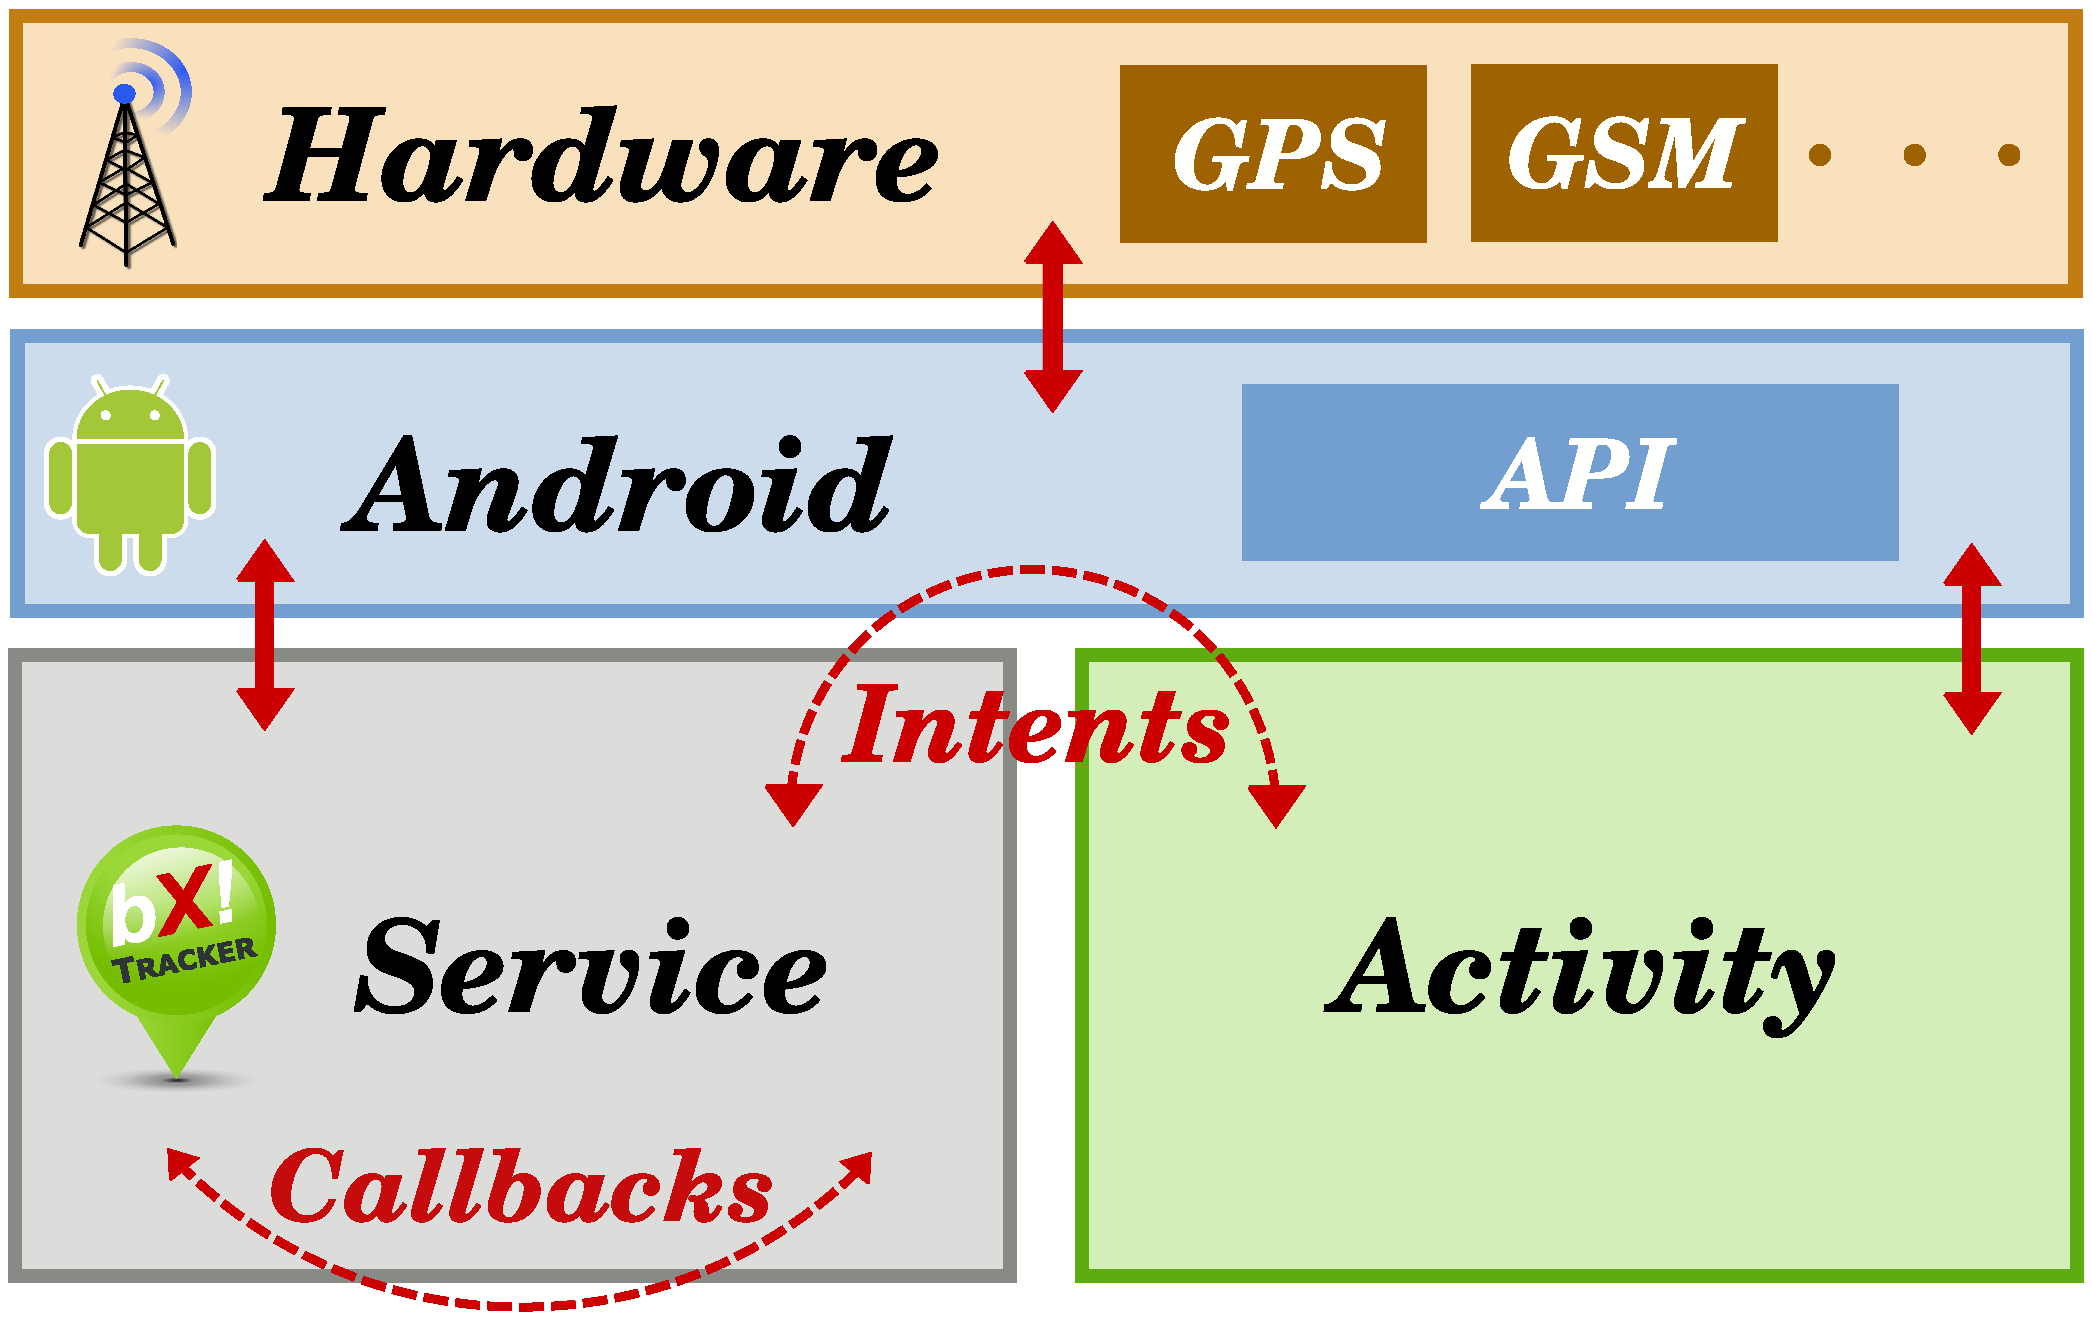
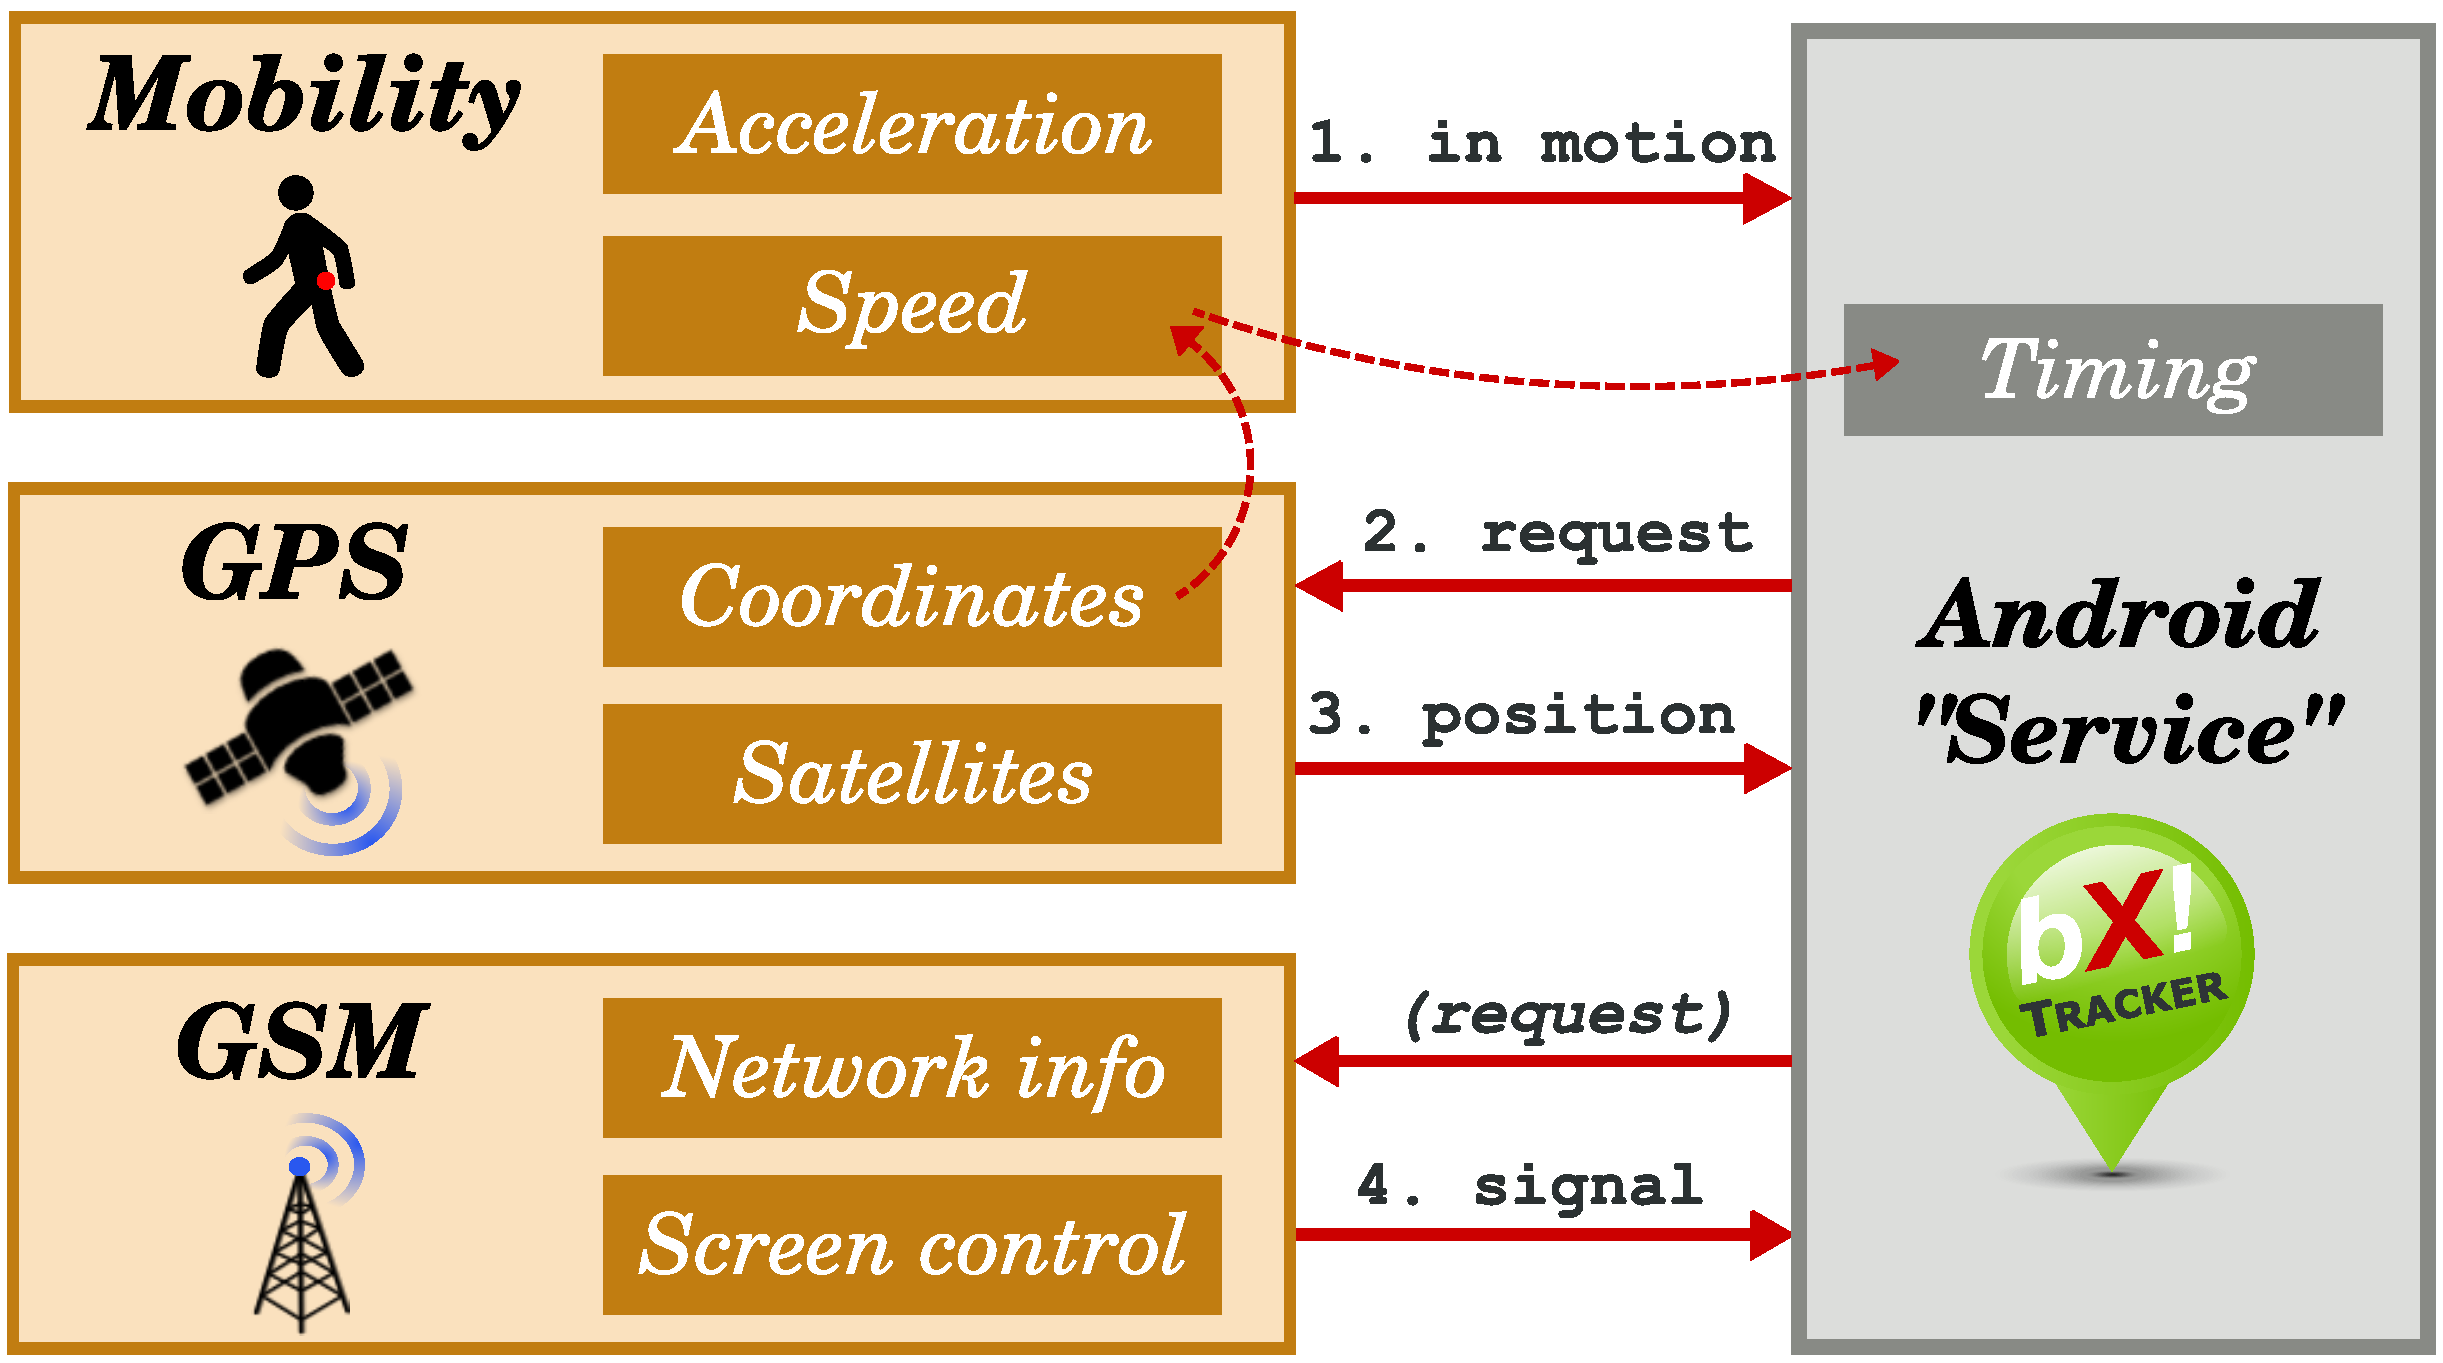
4.1. Architecture
4.2. Android Application

4.3. Collecting Data

| Column Name | Description |
|---|---|
| now | Date and time of this data point (ISO 8601, UTC) |
| lat | Location: latitude |
| long | Location: longitude |
| alt | Location: altitude (m) |
| acc | Estimated location accuracy (m) |
| speed | Top speed in the last 2 min relative to now (km/h) |
| activity | Google Activity Recognition: in-vehicle, on-bicycle, on-foot, still, unknown |
| age | Time between measuring the location and now (s) |
| Column Name | Description |
|---|---|
| now, lat, long, acc, age, speed, activity | The same as in Table 1 |
| type | Cellular network type, e.g.: LTE, EDGE (Enhanced Data rates for GSM Evolution), HSPA (High Speed Packet Access), HSPA+ |
| signal | Signal level (dBm) |
| netop | Mobile Country Code (MCC) and Mobile Network Code (MNC) |
| cid | Cell ID (CID) of the connected base transceiver station (BTS) |
| lac | Location Area Code (LAC) |
| signal-age | Time between measuring the signal level and now (s) |
4.4. Attracting Users

5. Energy-Efficient GPS Tracking
5.1. Motivation and Idea
5.2. Implementation

| Activity | d (s) |
|---|---|
| in-vehicle | 15 |
| 10 | |
| on-bicycle | 20 |
| on-foot | 30 |
| Otherwise | 60 |
| 10 | |
5.3. Battery Impact
| Device | Battery (mAh) | No Tracking | Tracking | Difference | ||||
|---|---|---|---|---|---|---|---|---|
| BD (%/h) | BL (h) | BD (%/h) | BL (h) | BD (%/h) | BL (h) | E (mWh) | ||
| Galaxy S2 Lite | 1500 | 2.4 | 42 | 3.9 | 26 | +1.5 | −38% | +83 |
| Galaxy S3 | 2100 | 4.2 | 24 | 5.0 | 20 | +0.8 | −16% | +62 |
| Galaxy S4 | 2600 | 3.5 | 29 | 5.3 | 19 | +1.8 | −34% | +170 |
| Xperia Z1 C | 2300 | 1.9 | 53 | 2.4 | 42 | +0.5 | −21% | +43 |
| Xperia Z2 | 3200 | 1.4 | 71 | 1.5 | 67 | +0.1 | −7% | +12 |
| Nexus 5 | 2300 | 3.2 | 31 | 3.7 | 27 | +0.5 | −14% | +43 |
| ME302KL No. 1 | 6760 | 0.6 | 167 | 0.7 | 140 | +0.1 | −16% | +28 |
| ME302KL No. 2 | 6760 | 0.7 | 152 | 0.8 | 130 | +0.1 | −15% | +30 |
| Average: | +0.7 | −20% | +59 | |||||


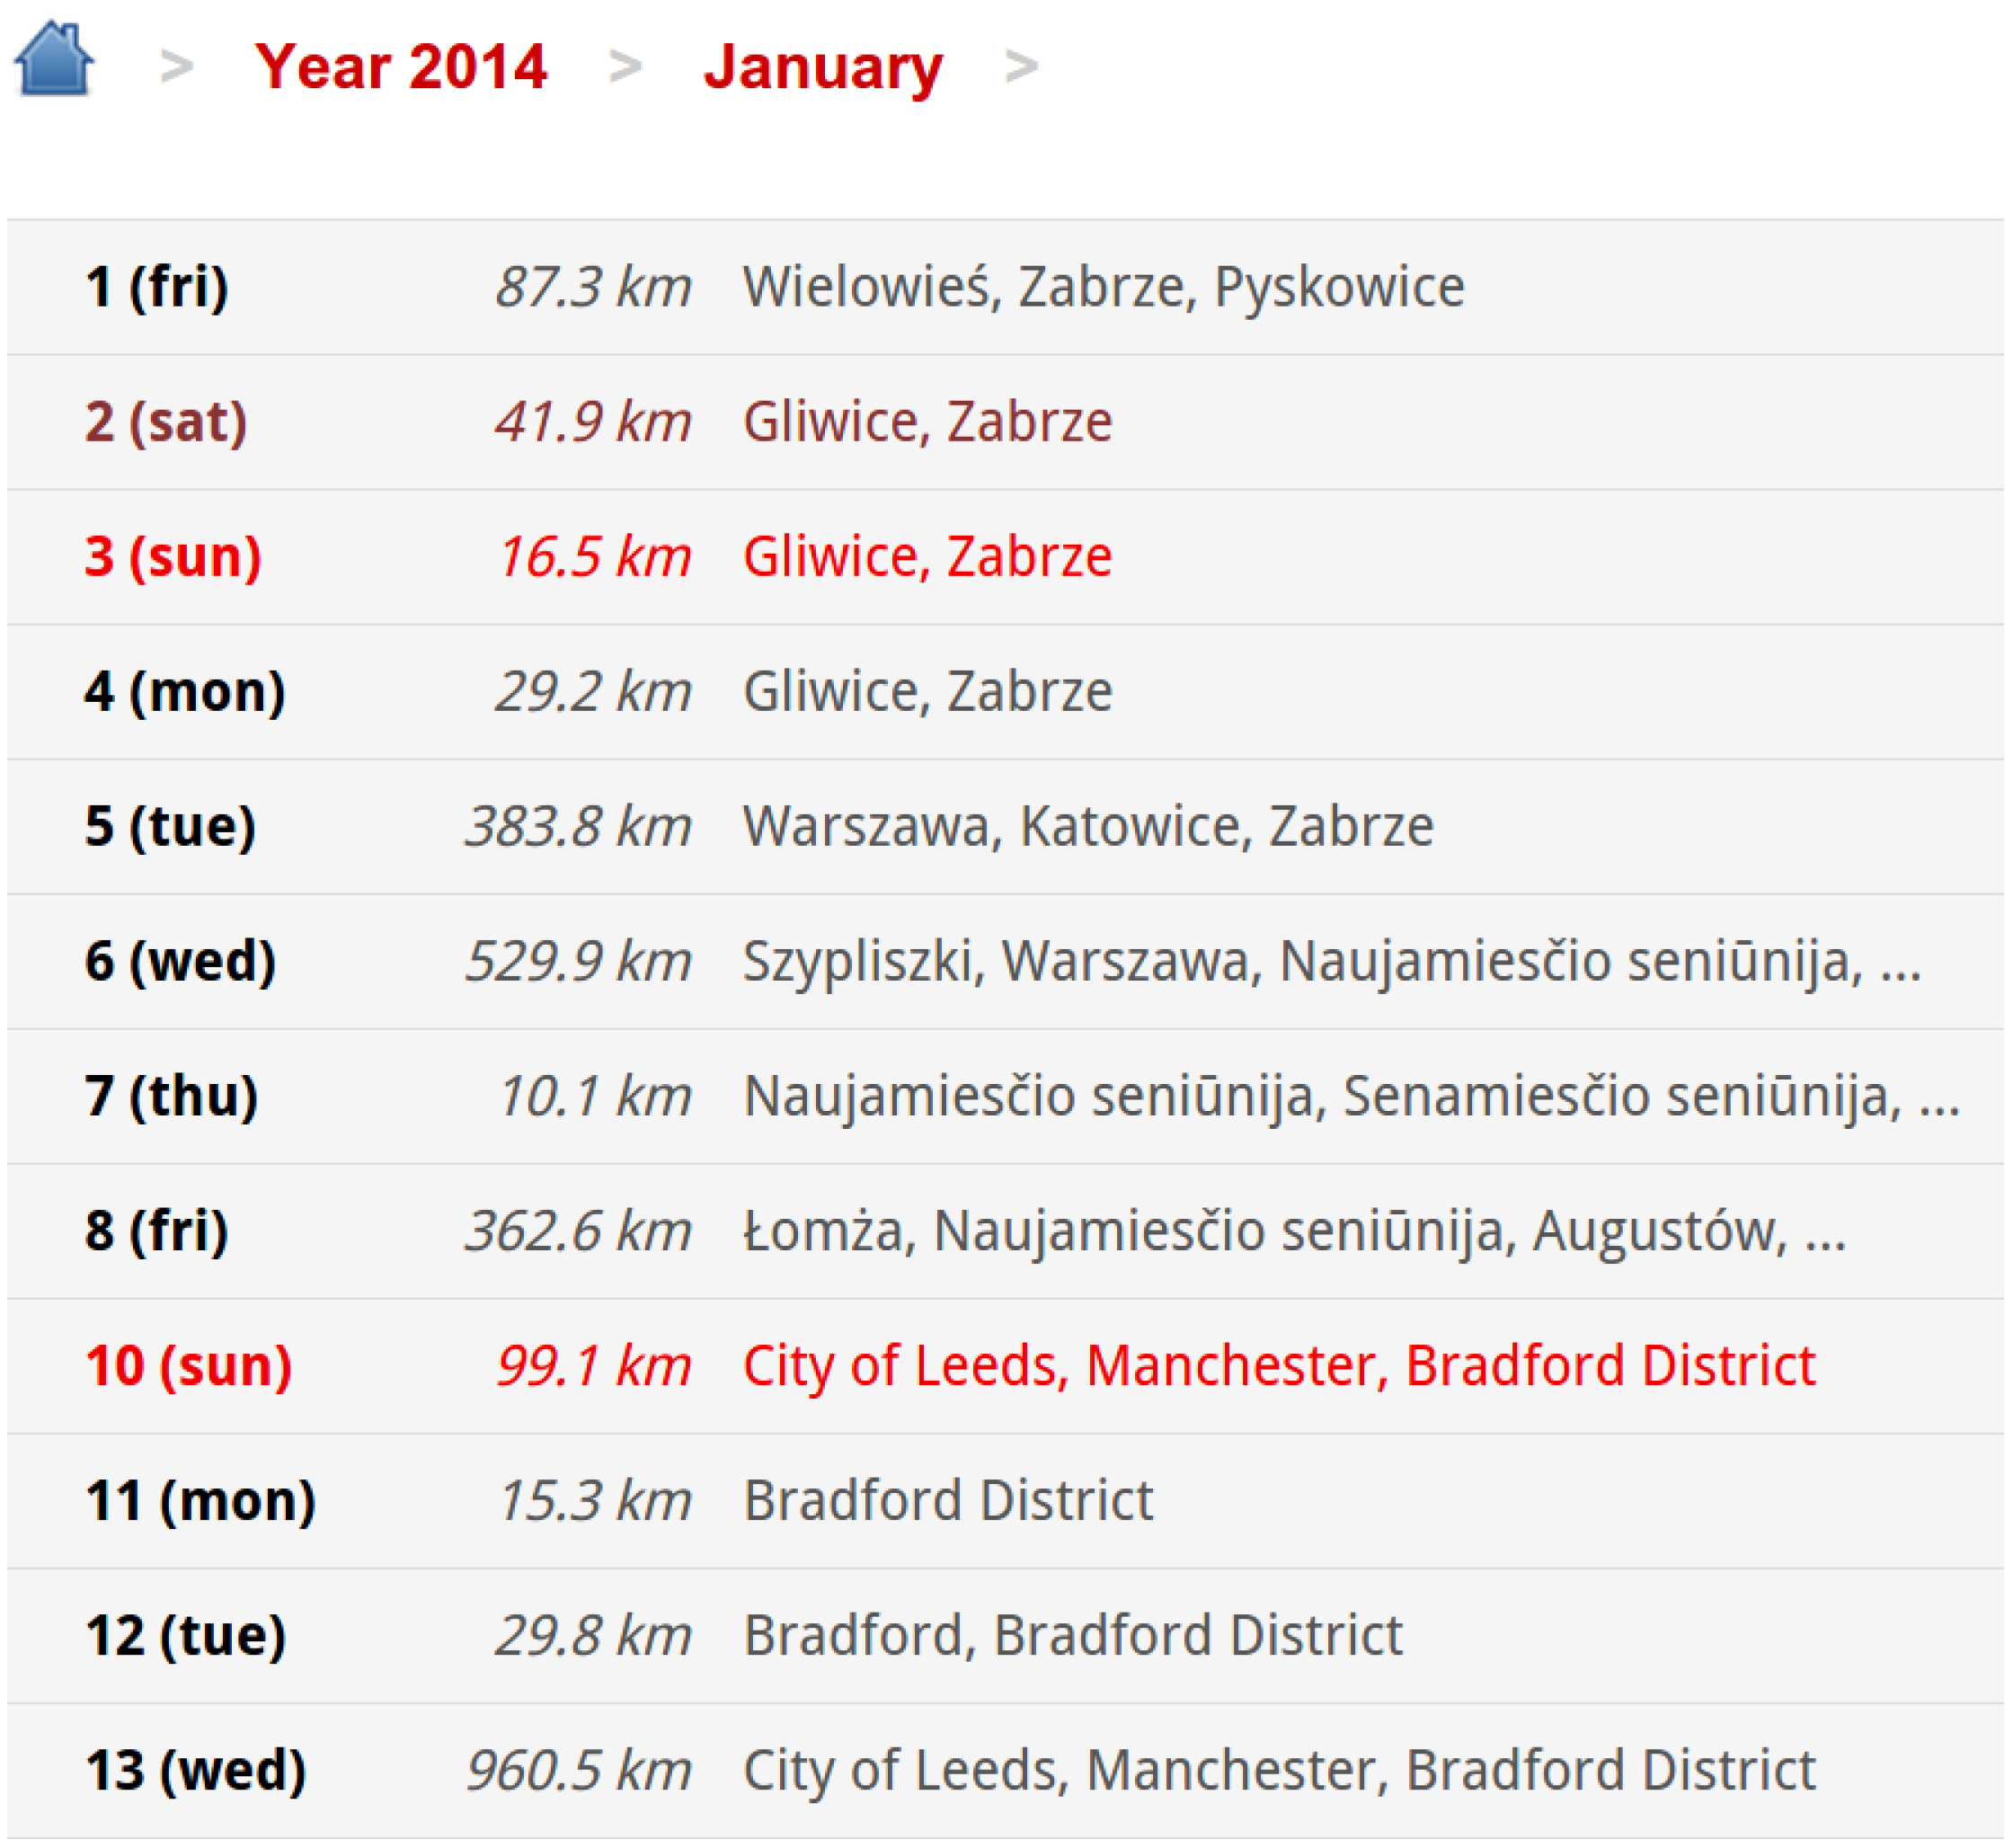
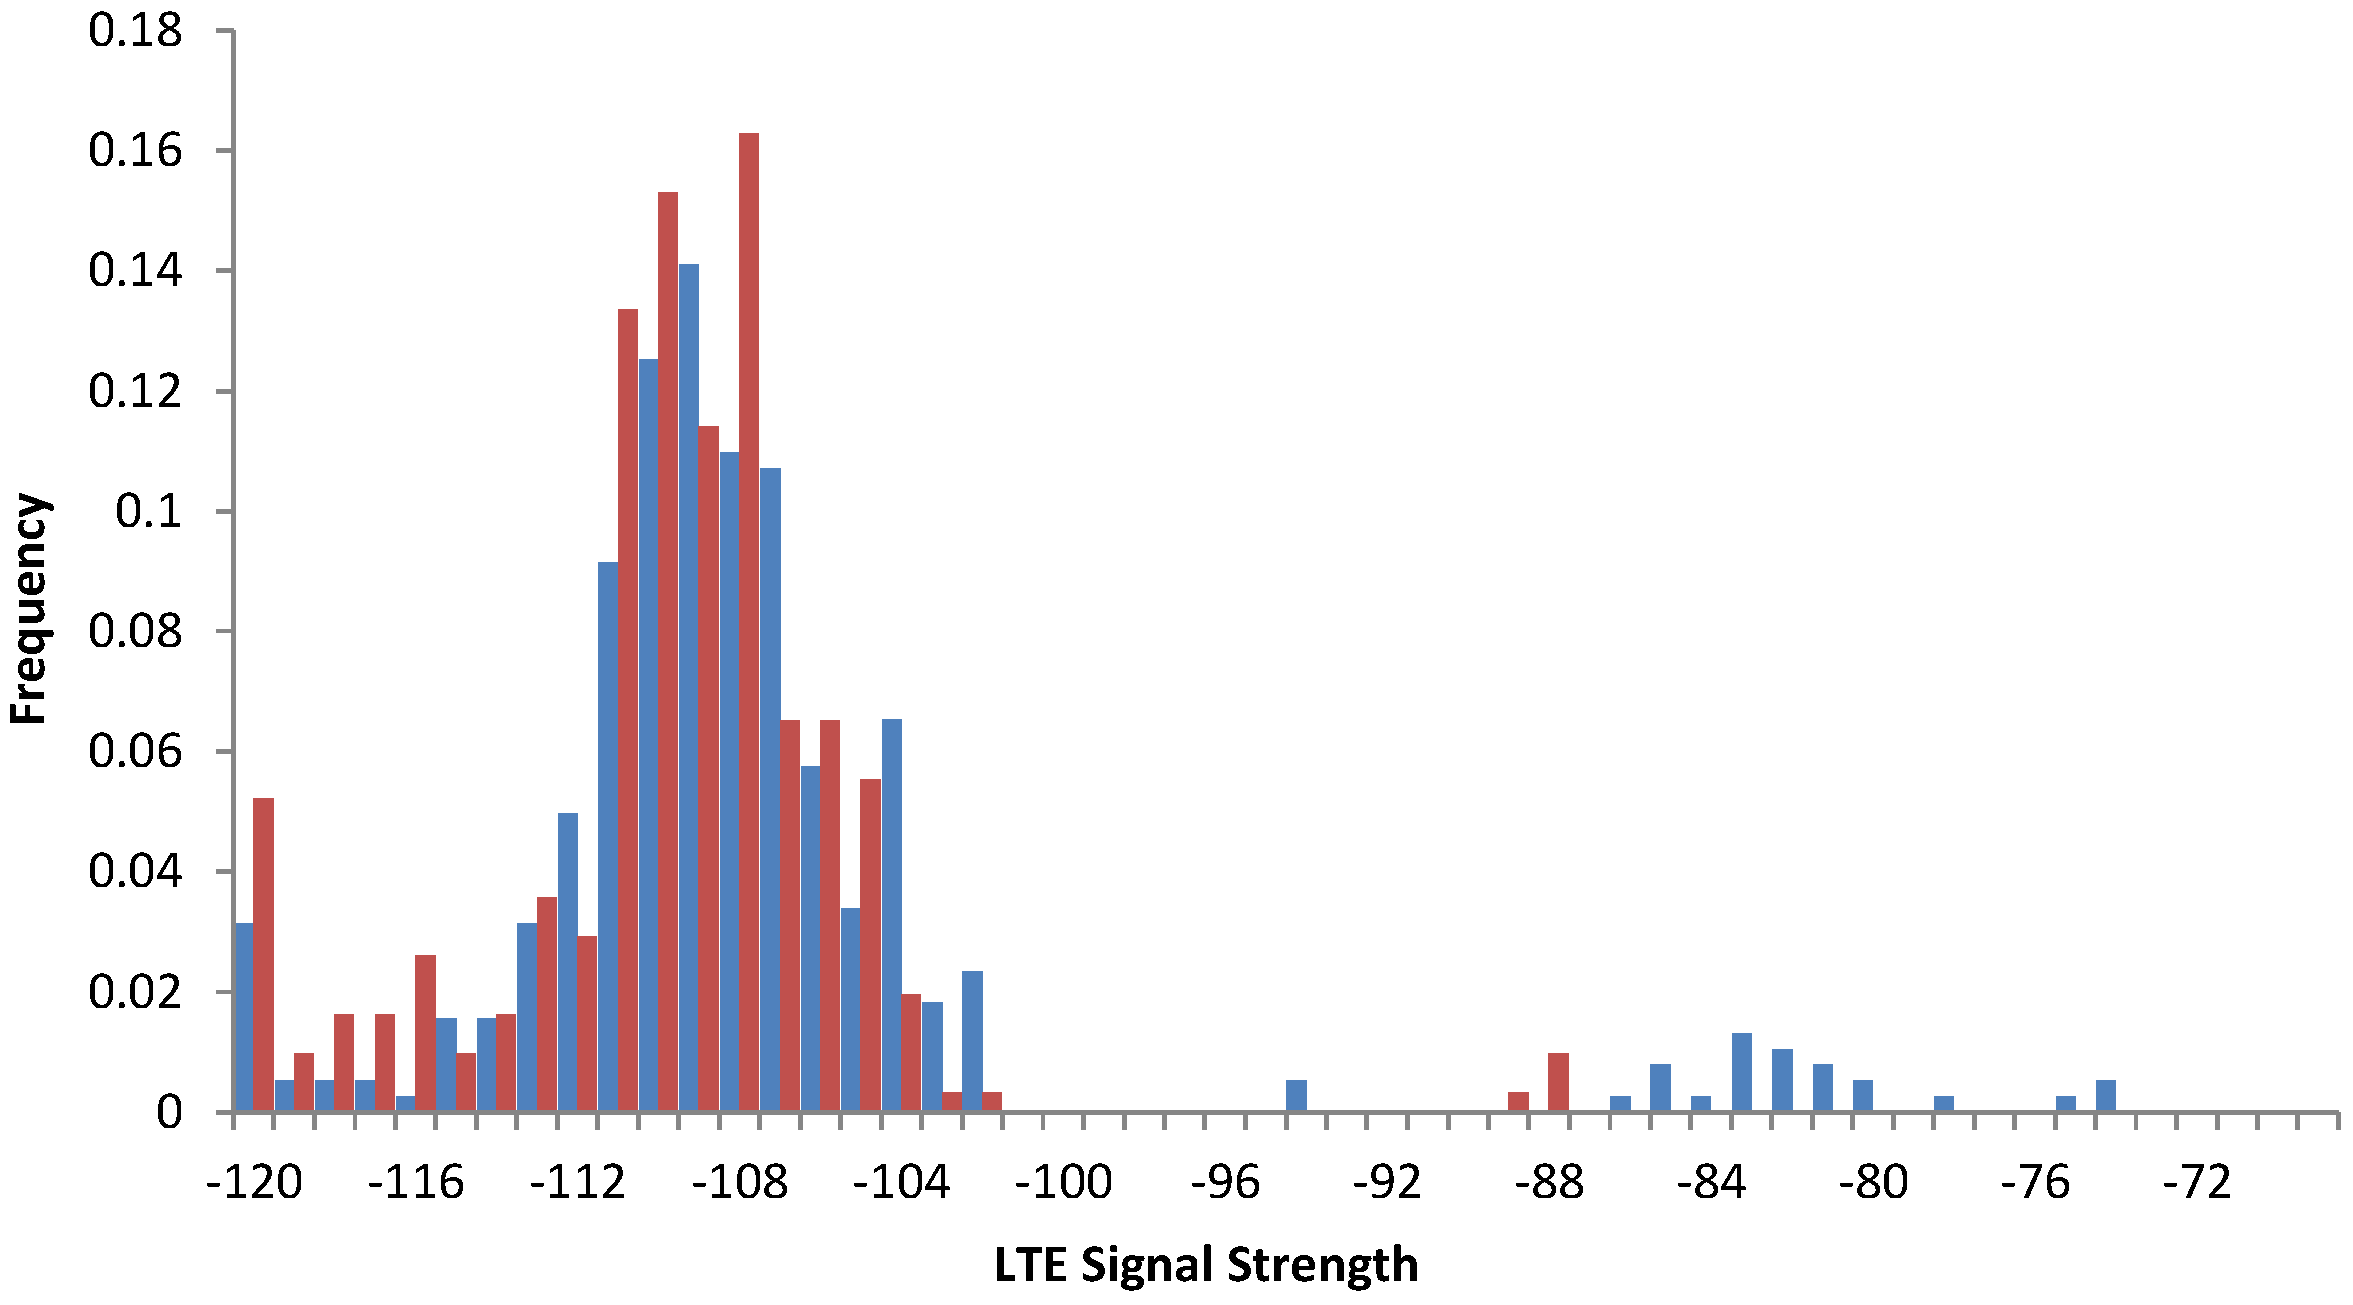
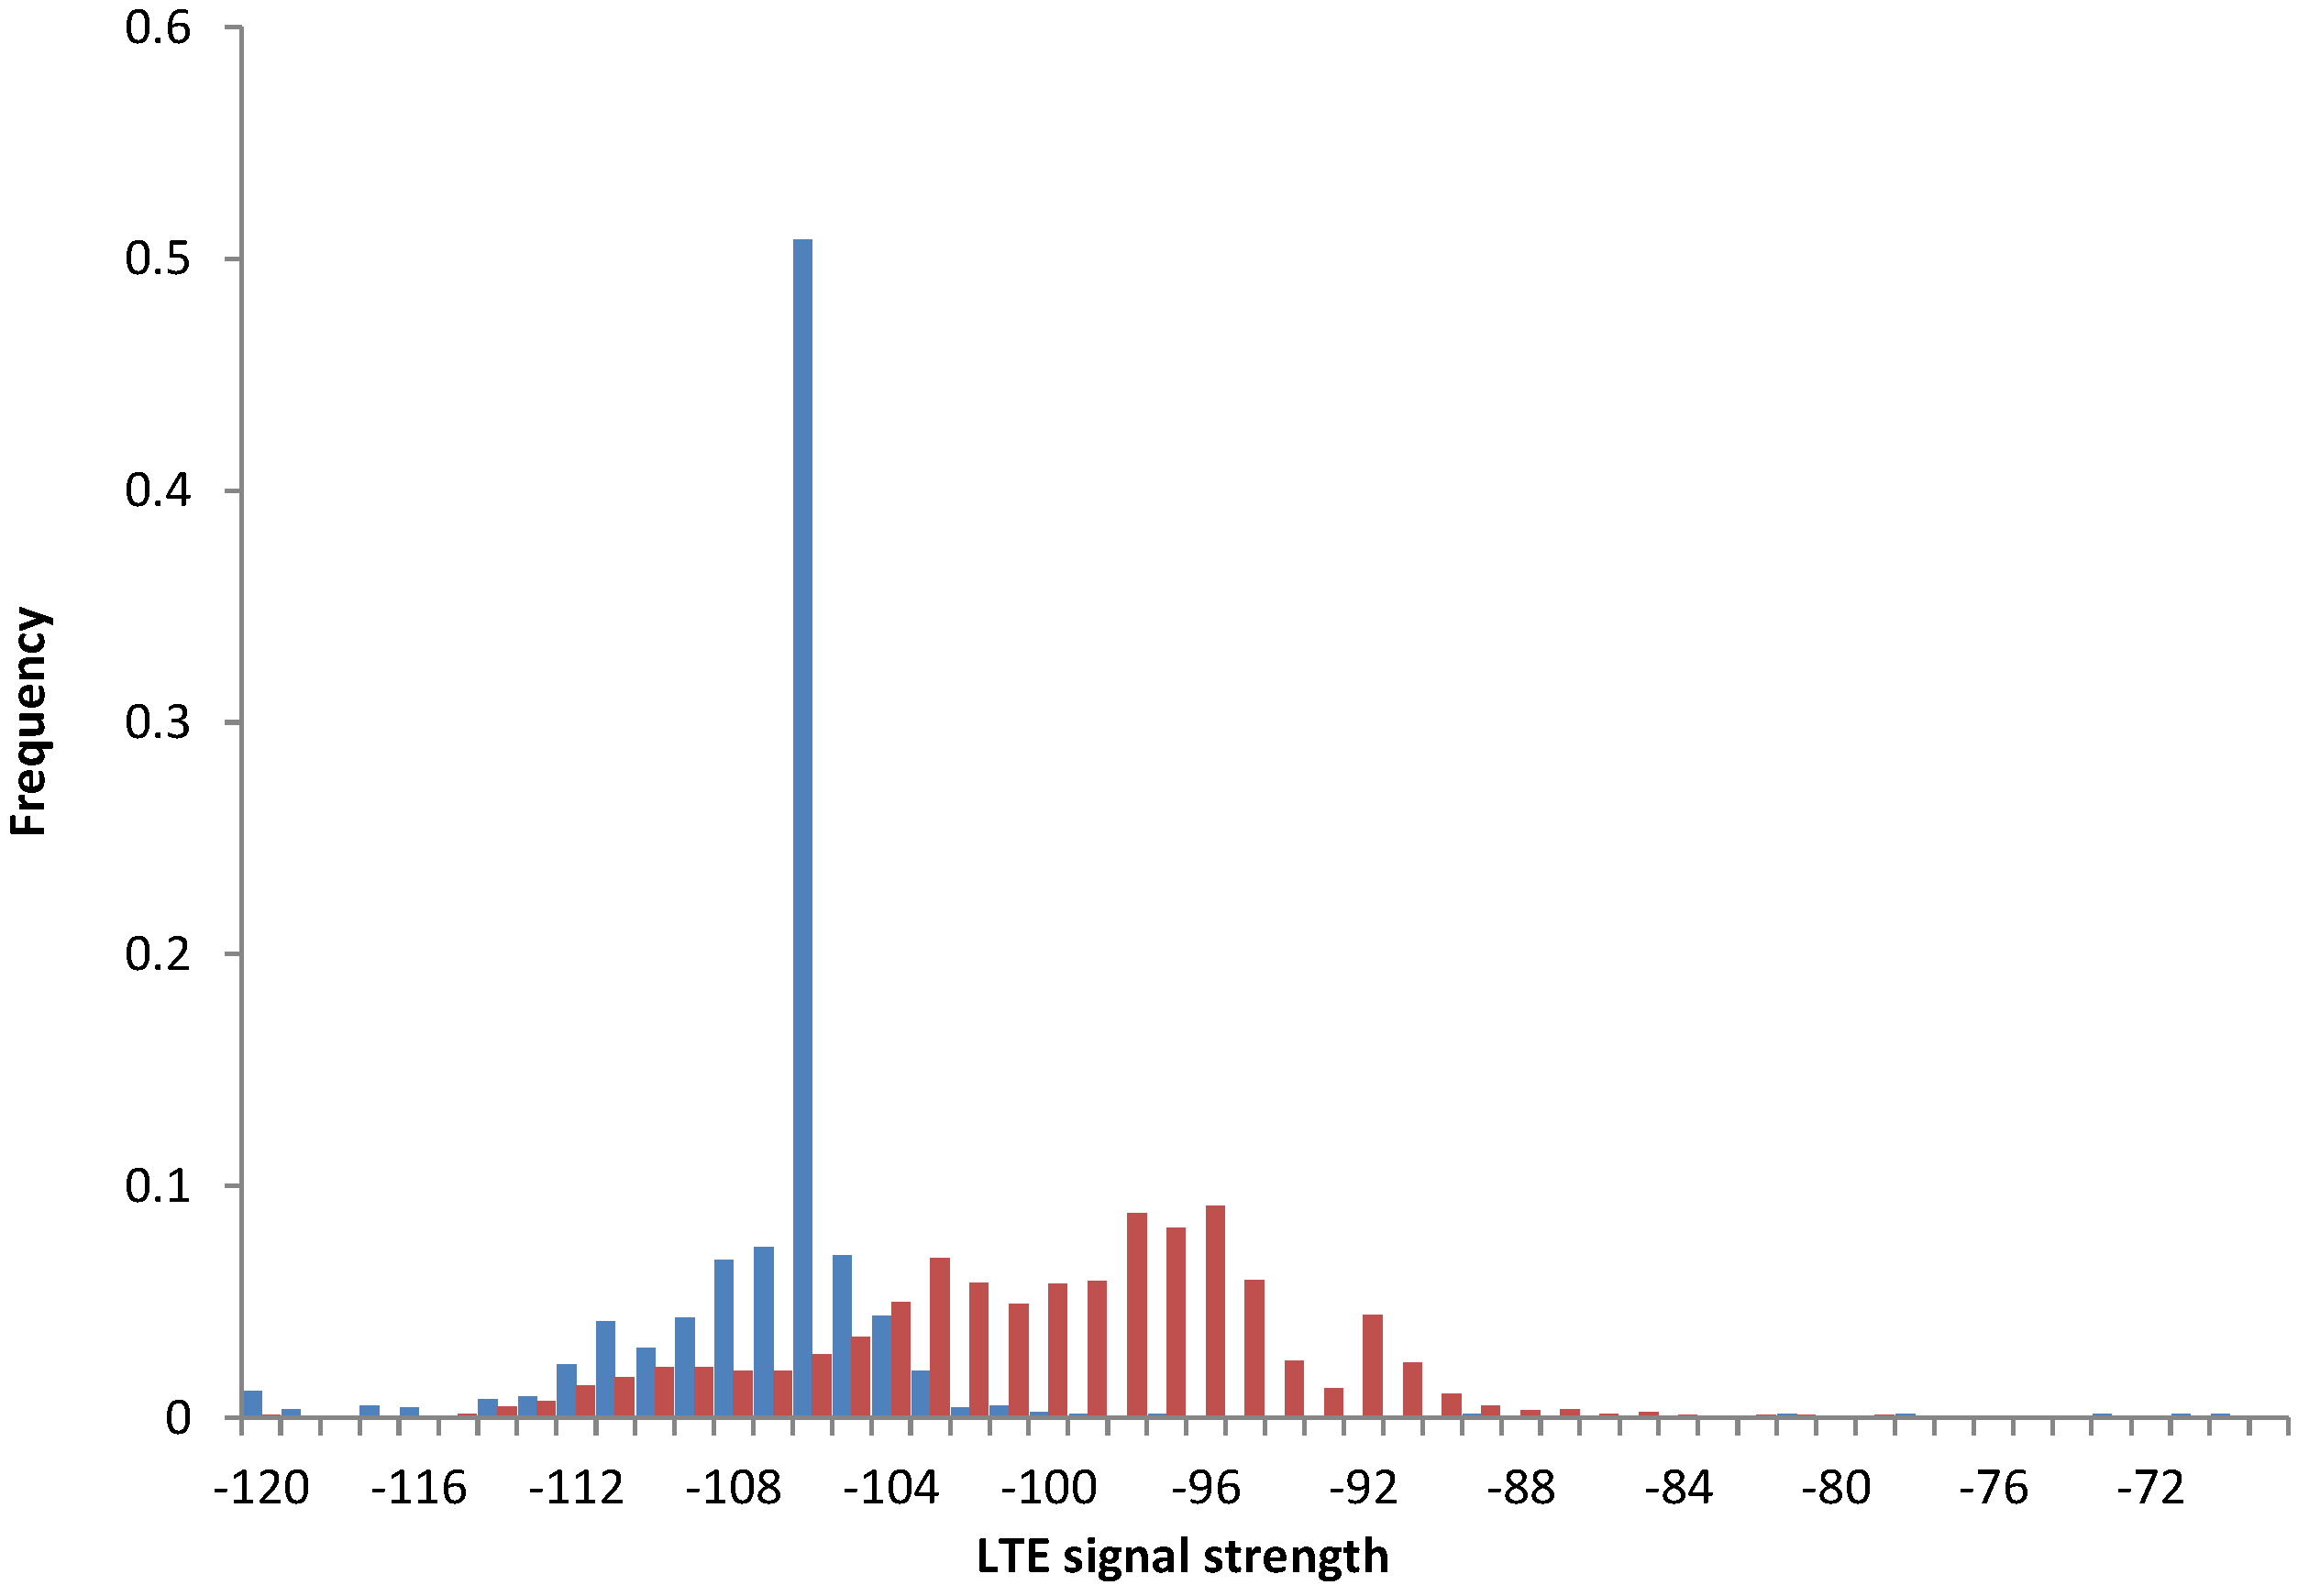
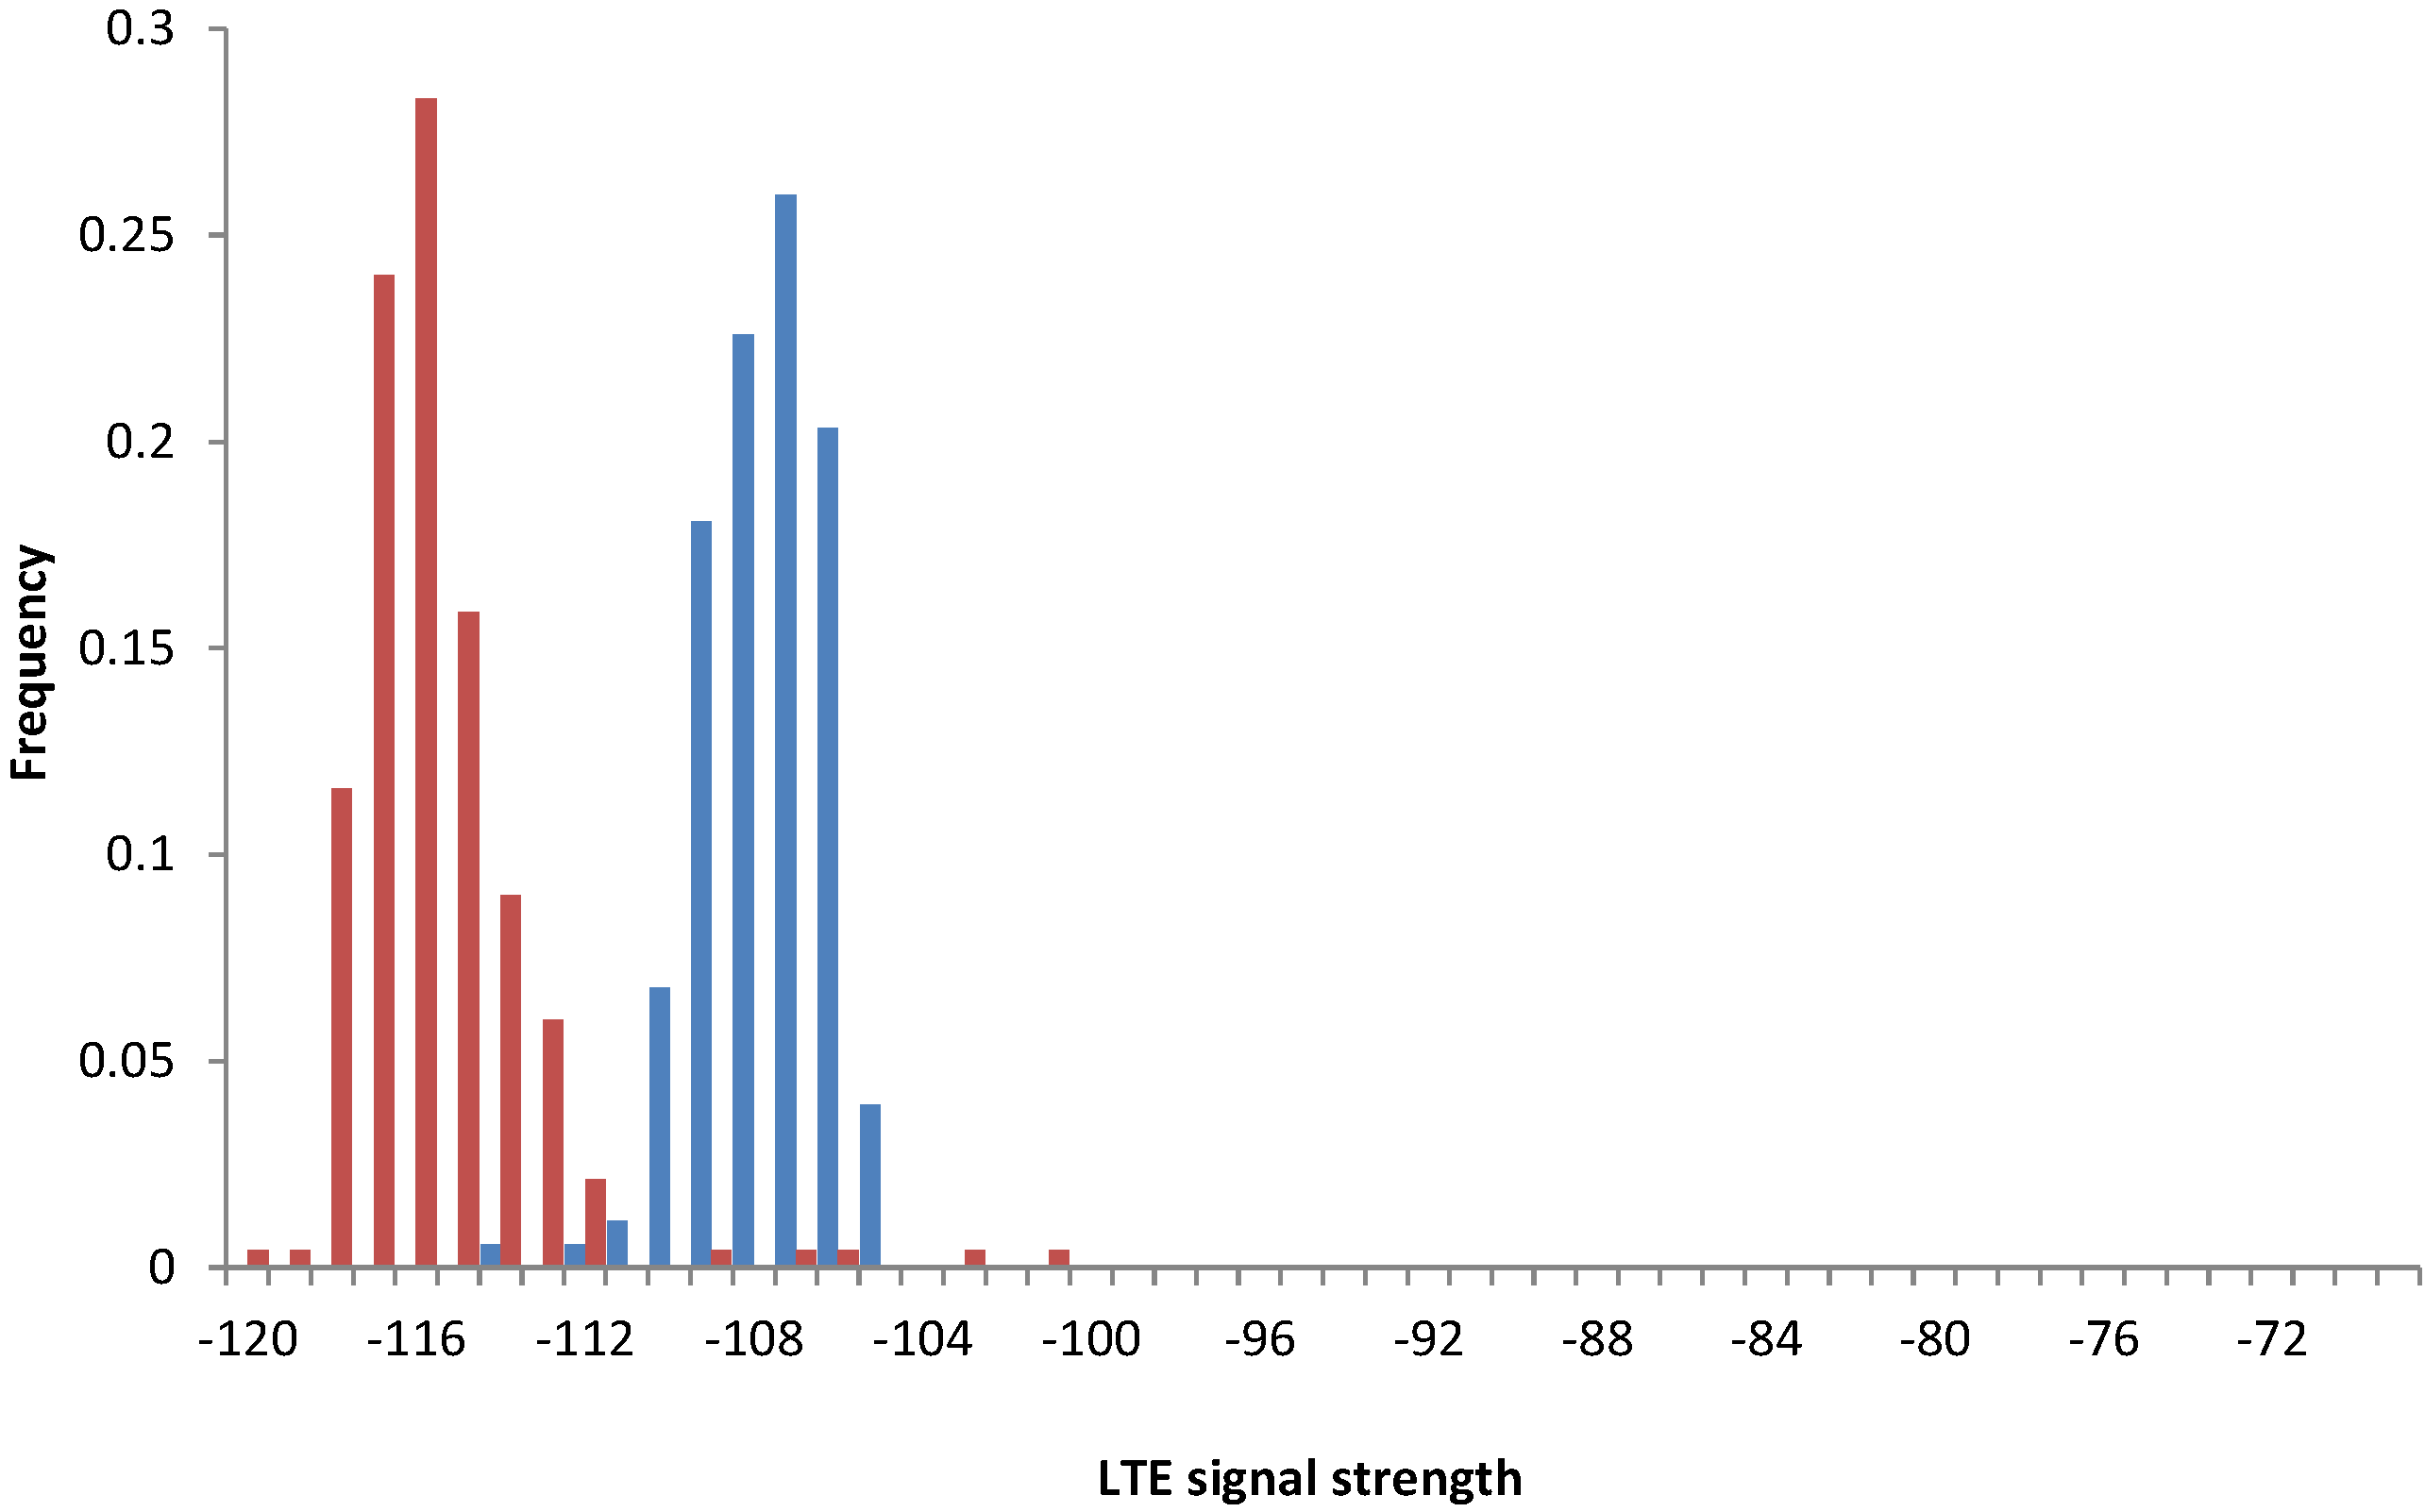
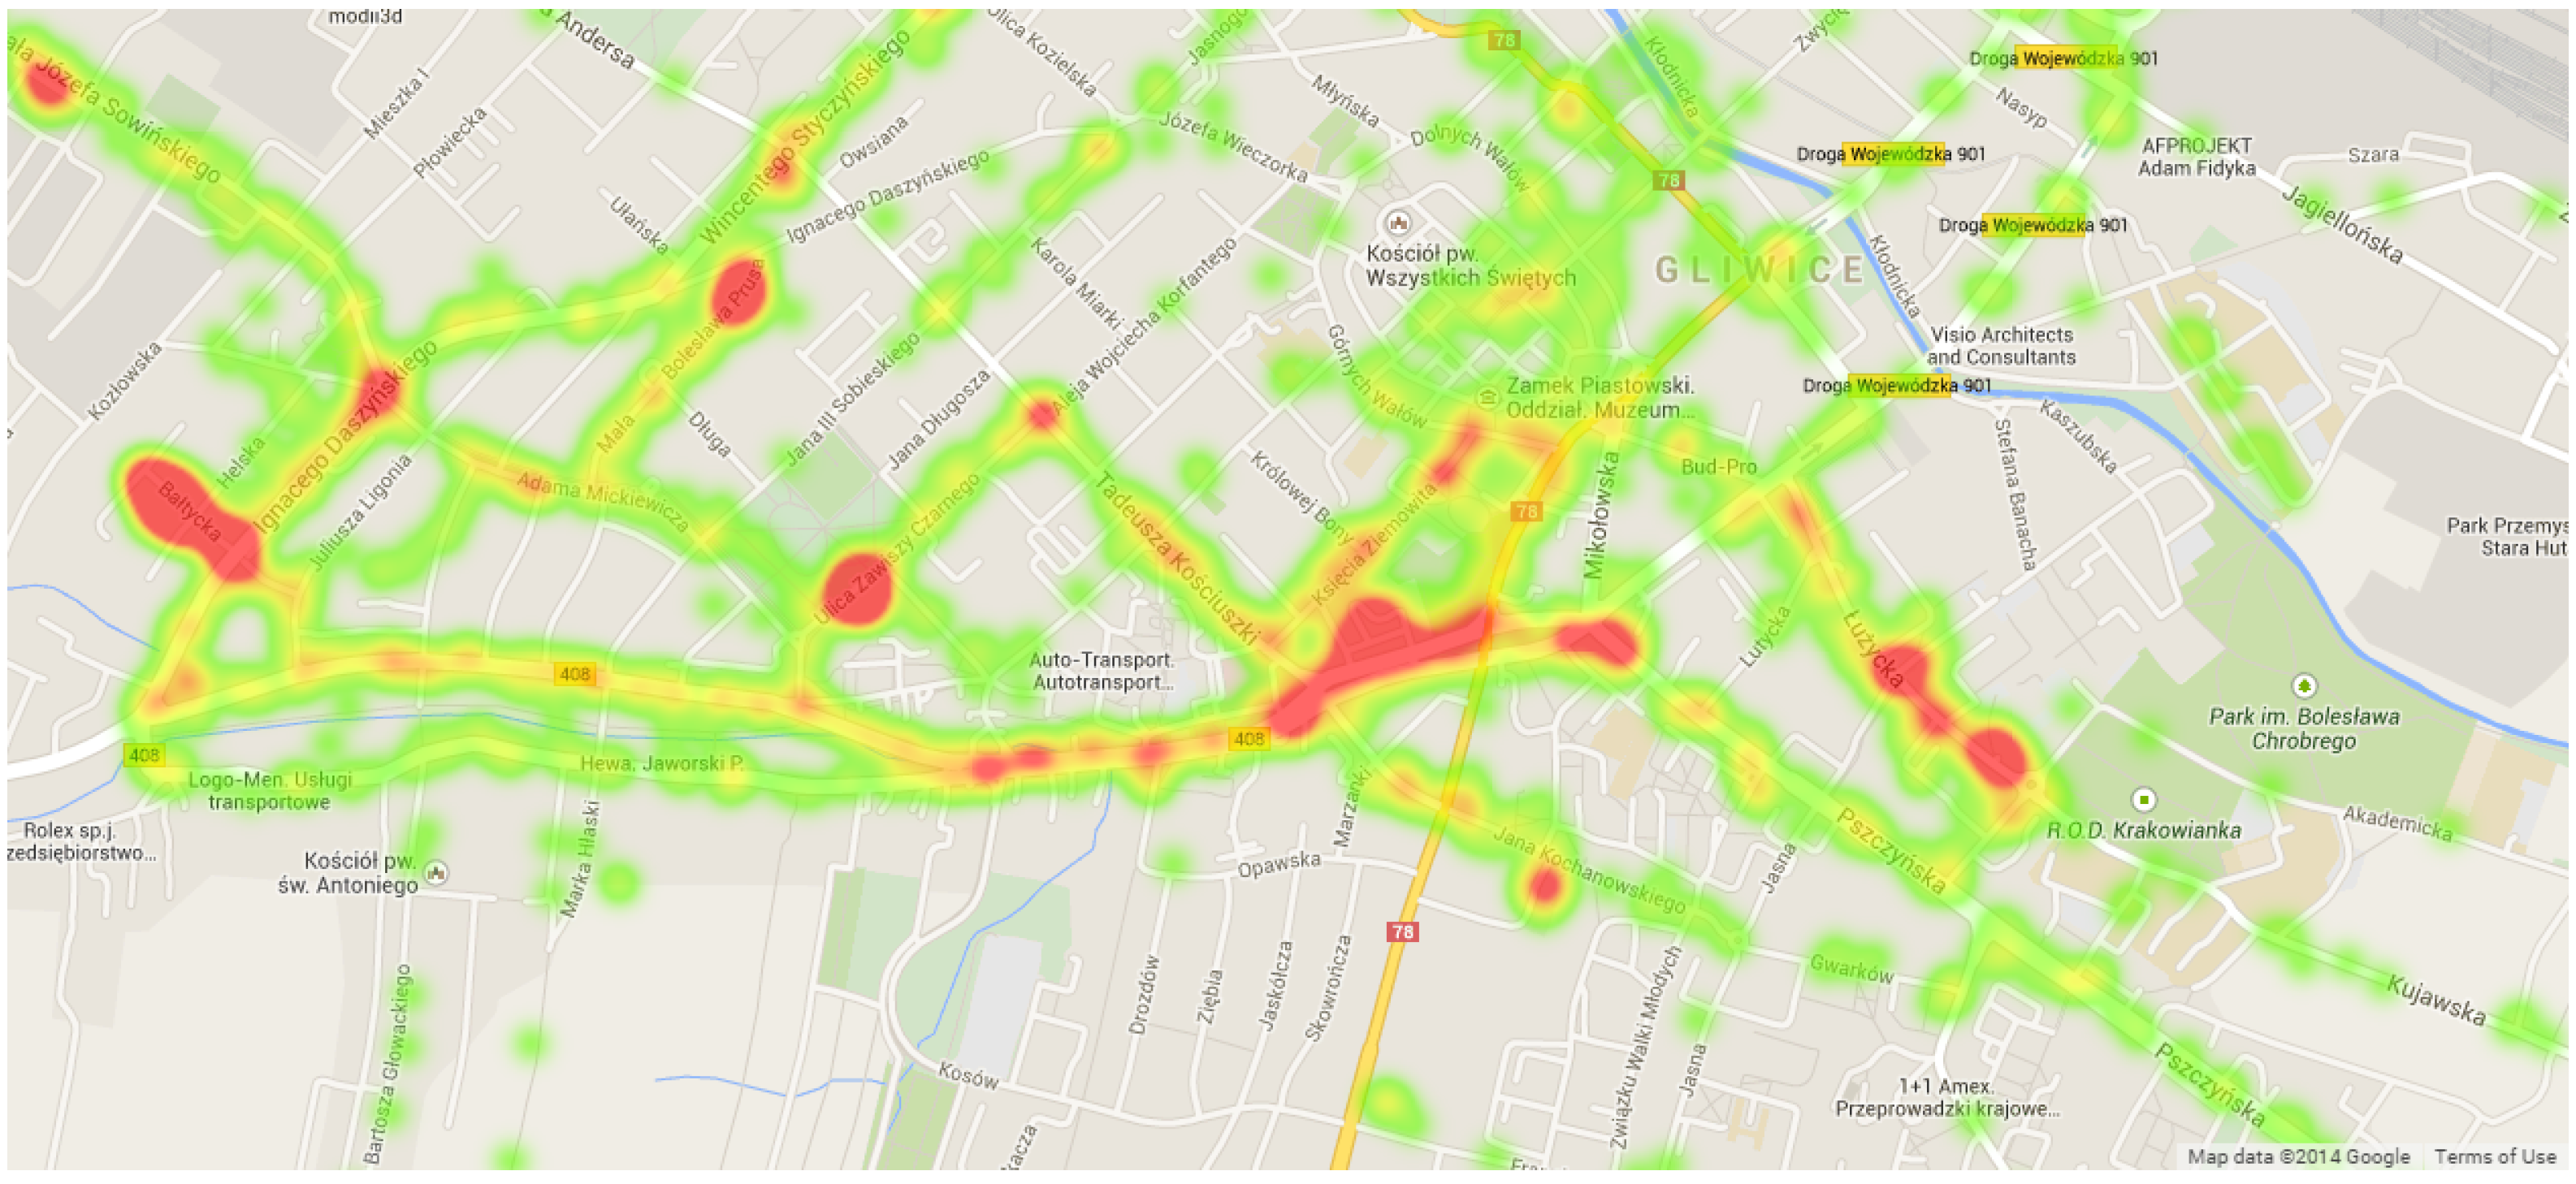
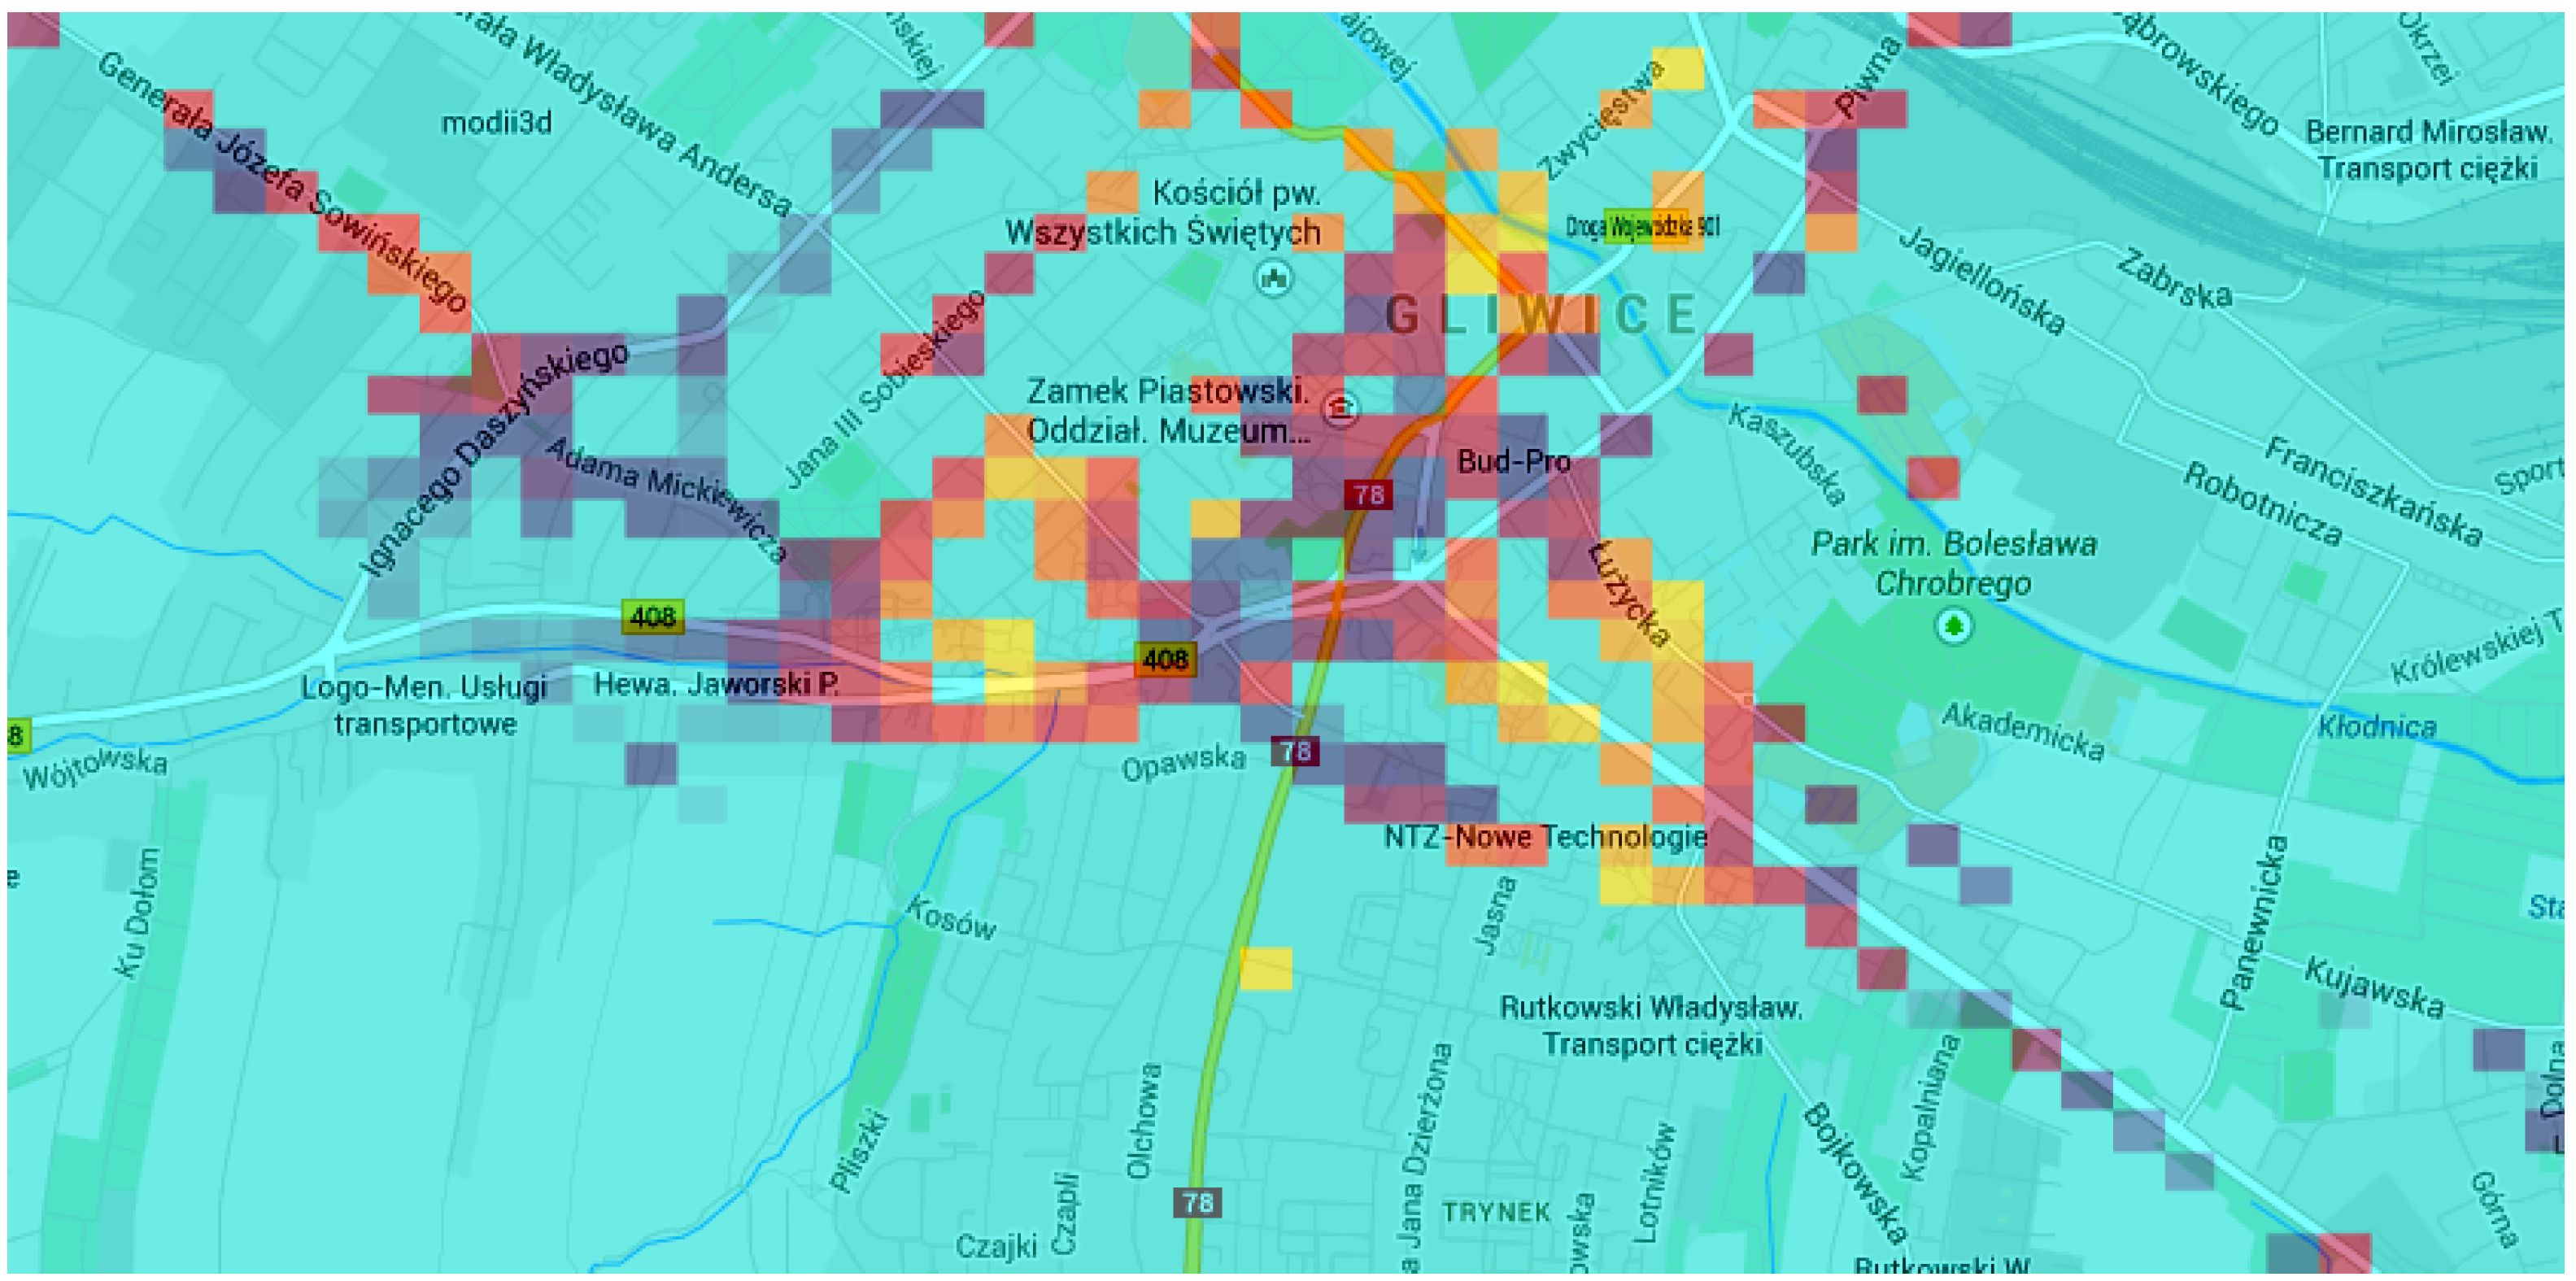
6. Sample Results
| Activity | Duration | Percentage |
|---|---|---|
| Workweek | ||
| still | 114:21:53 | 94.19% |
| in-vehicle | 1:00:00 | 0.82% |
| on-foot | 6:03:09 | 4.98% |
| Weekend | ||
| still | 40:20:46 | 84.78% |
| in-vehicle | 3:50:45 | 8.08% |
| on-foot | 3:23:49 | 7.14% |
| Total weekly values | ||
| still | 154:42:39 | 91.54% |
| in-vehicle | 4:50:45 | 2.87% |
| on-foot | 9:26:58 | 5.59% |


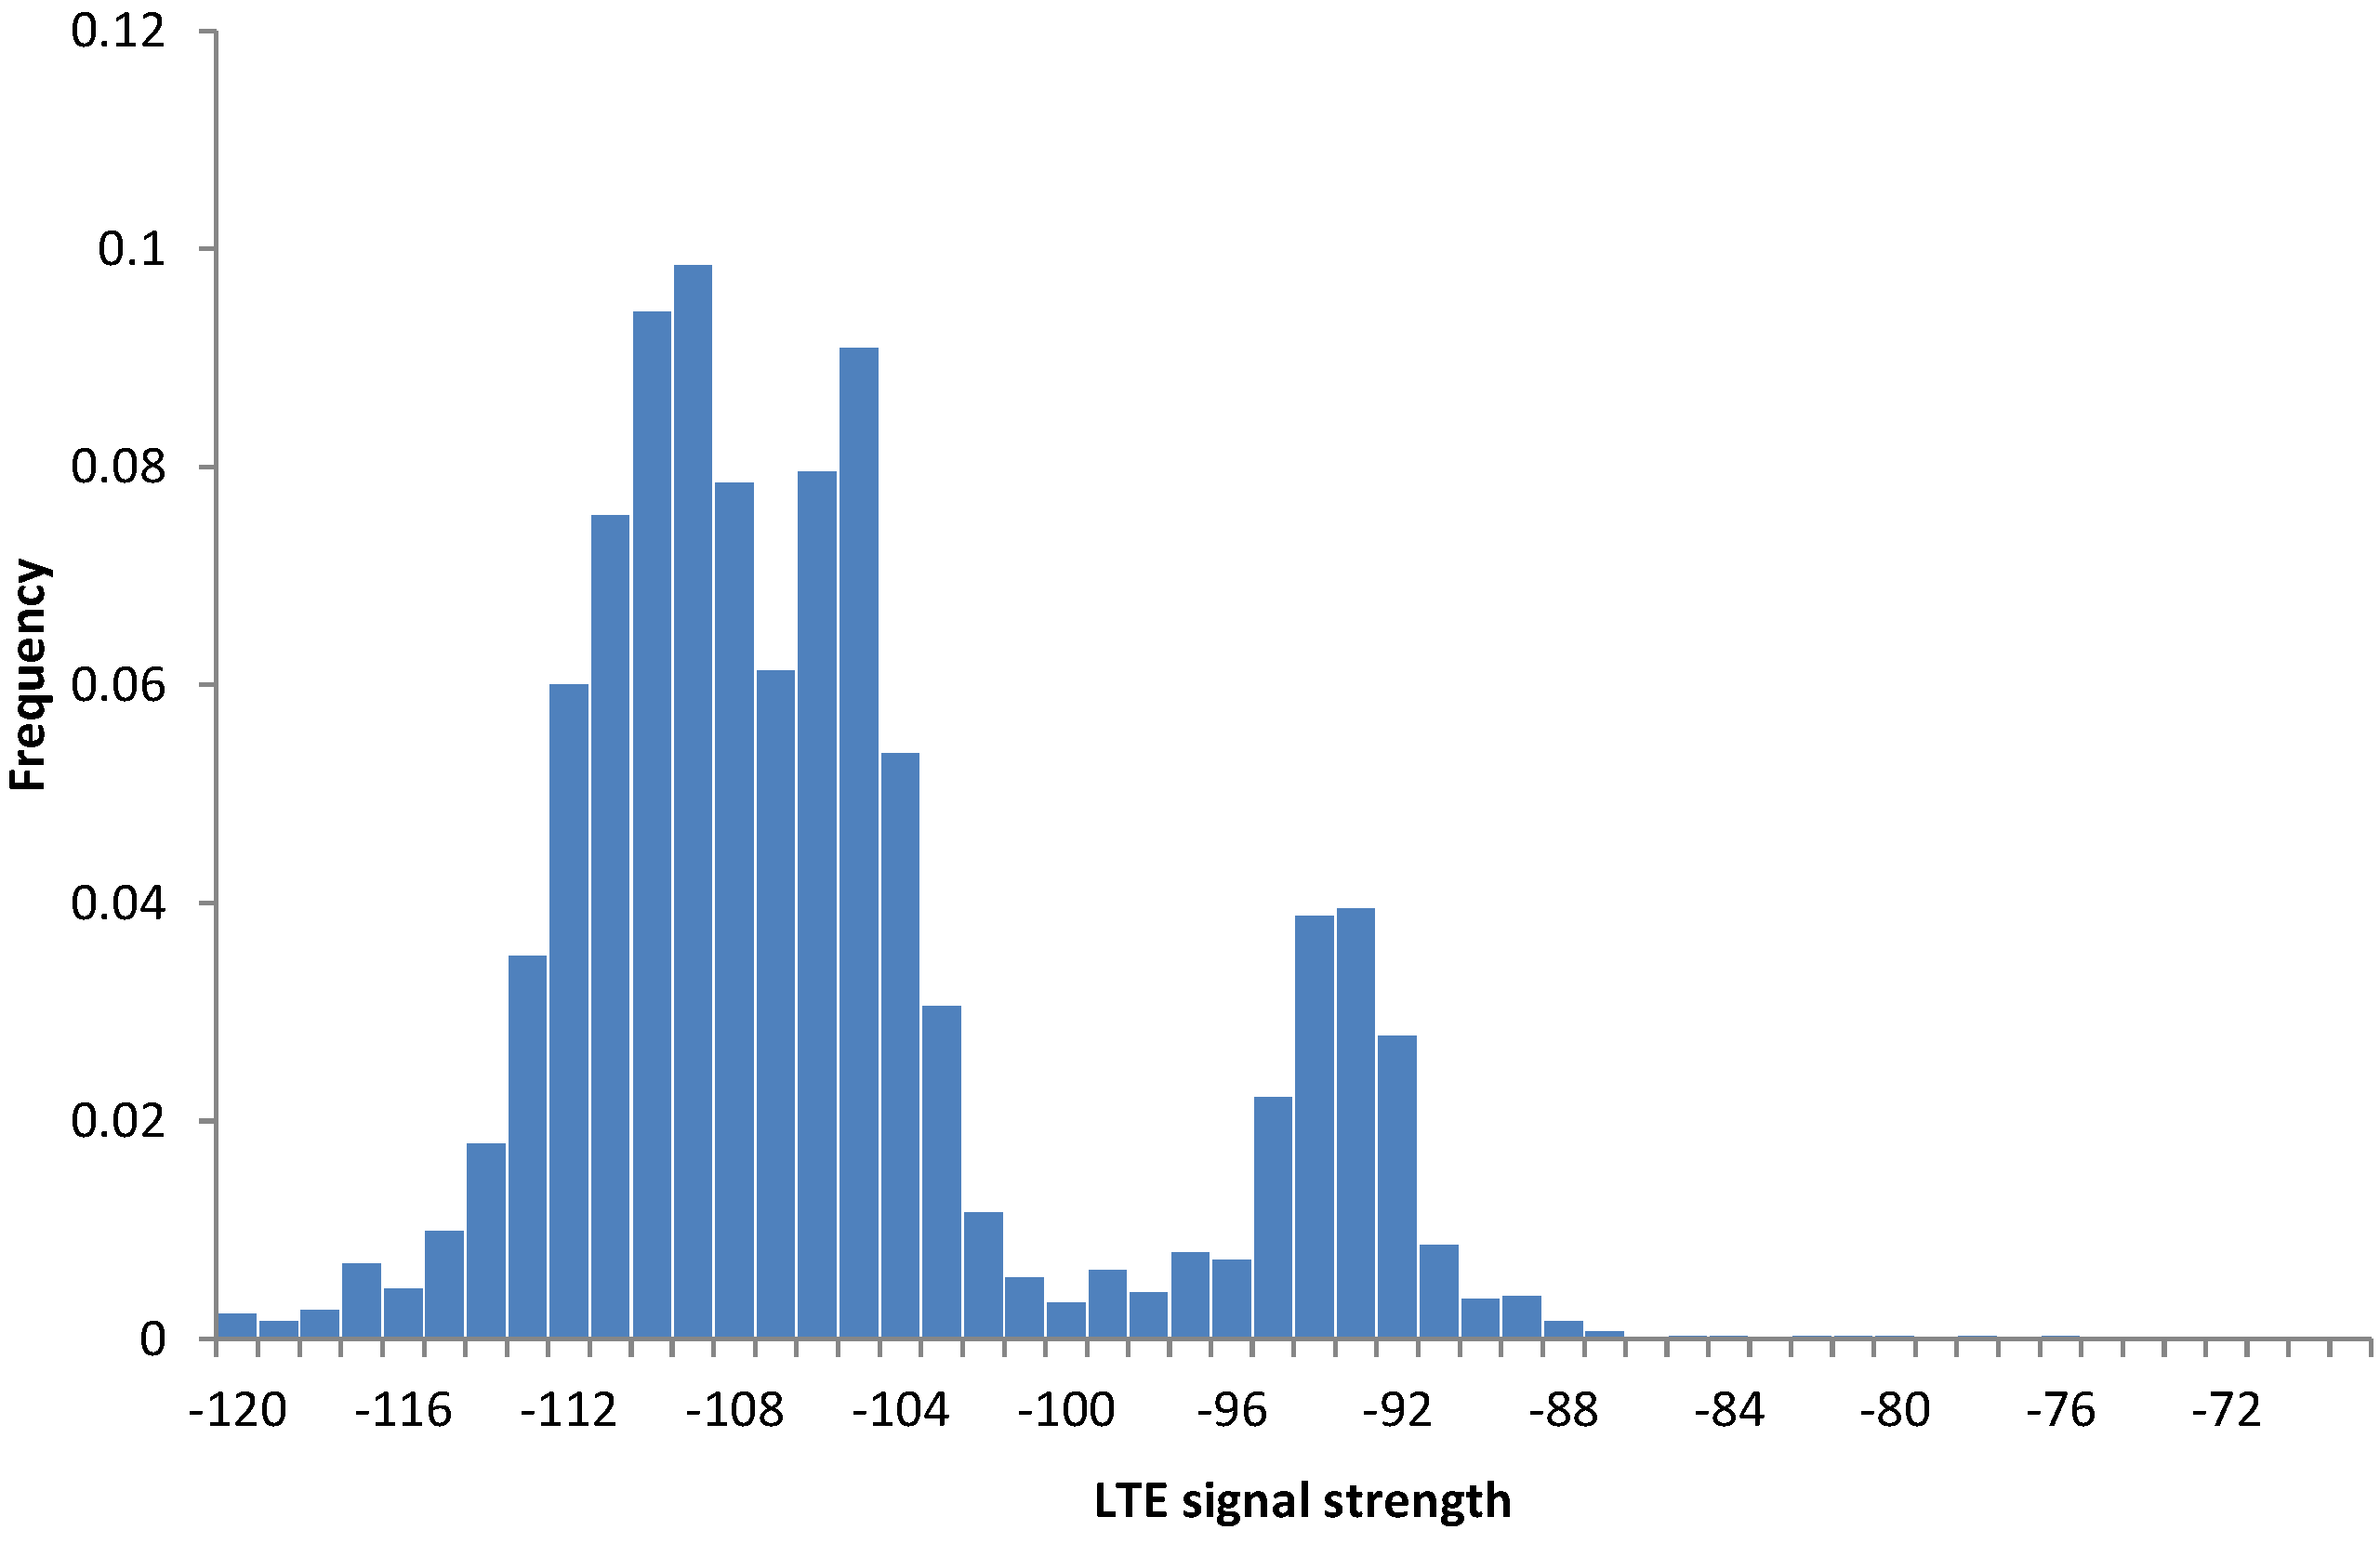
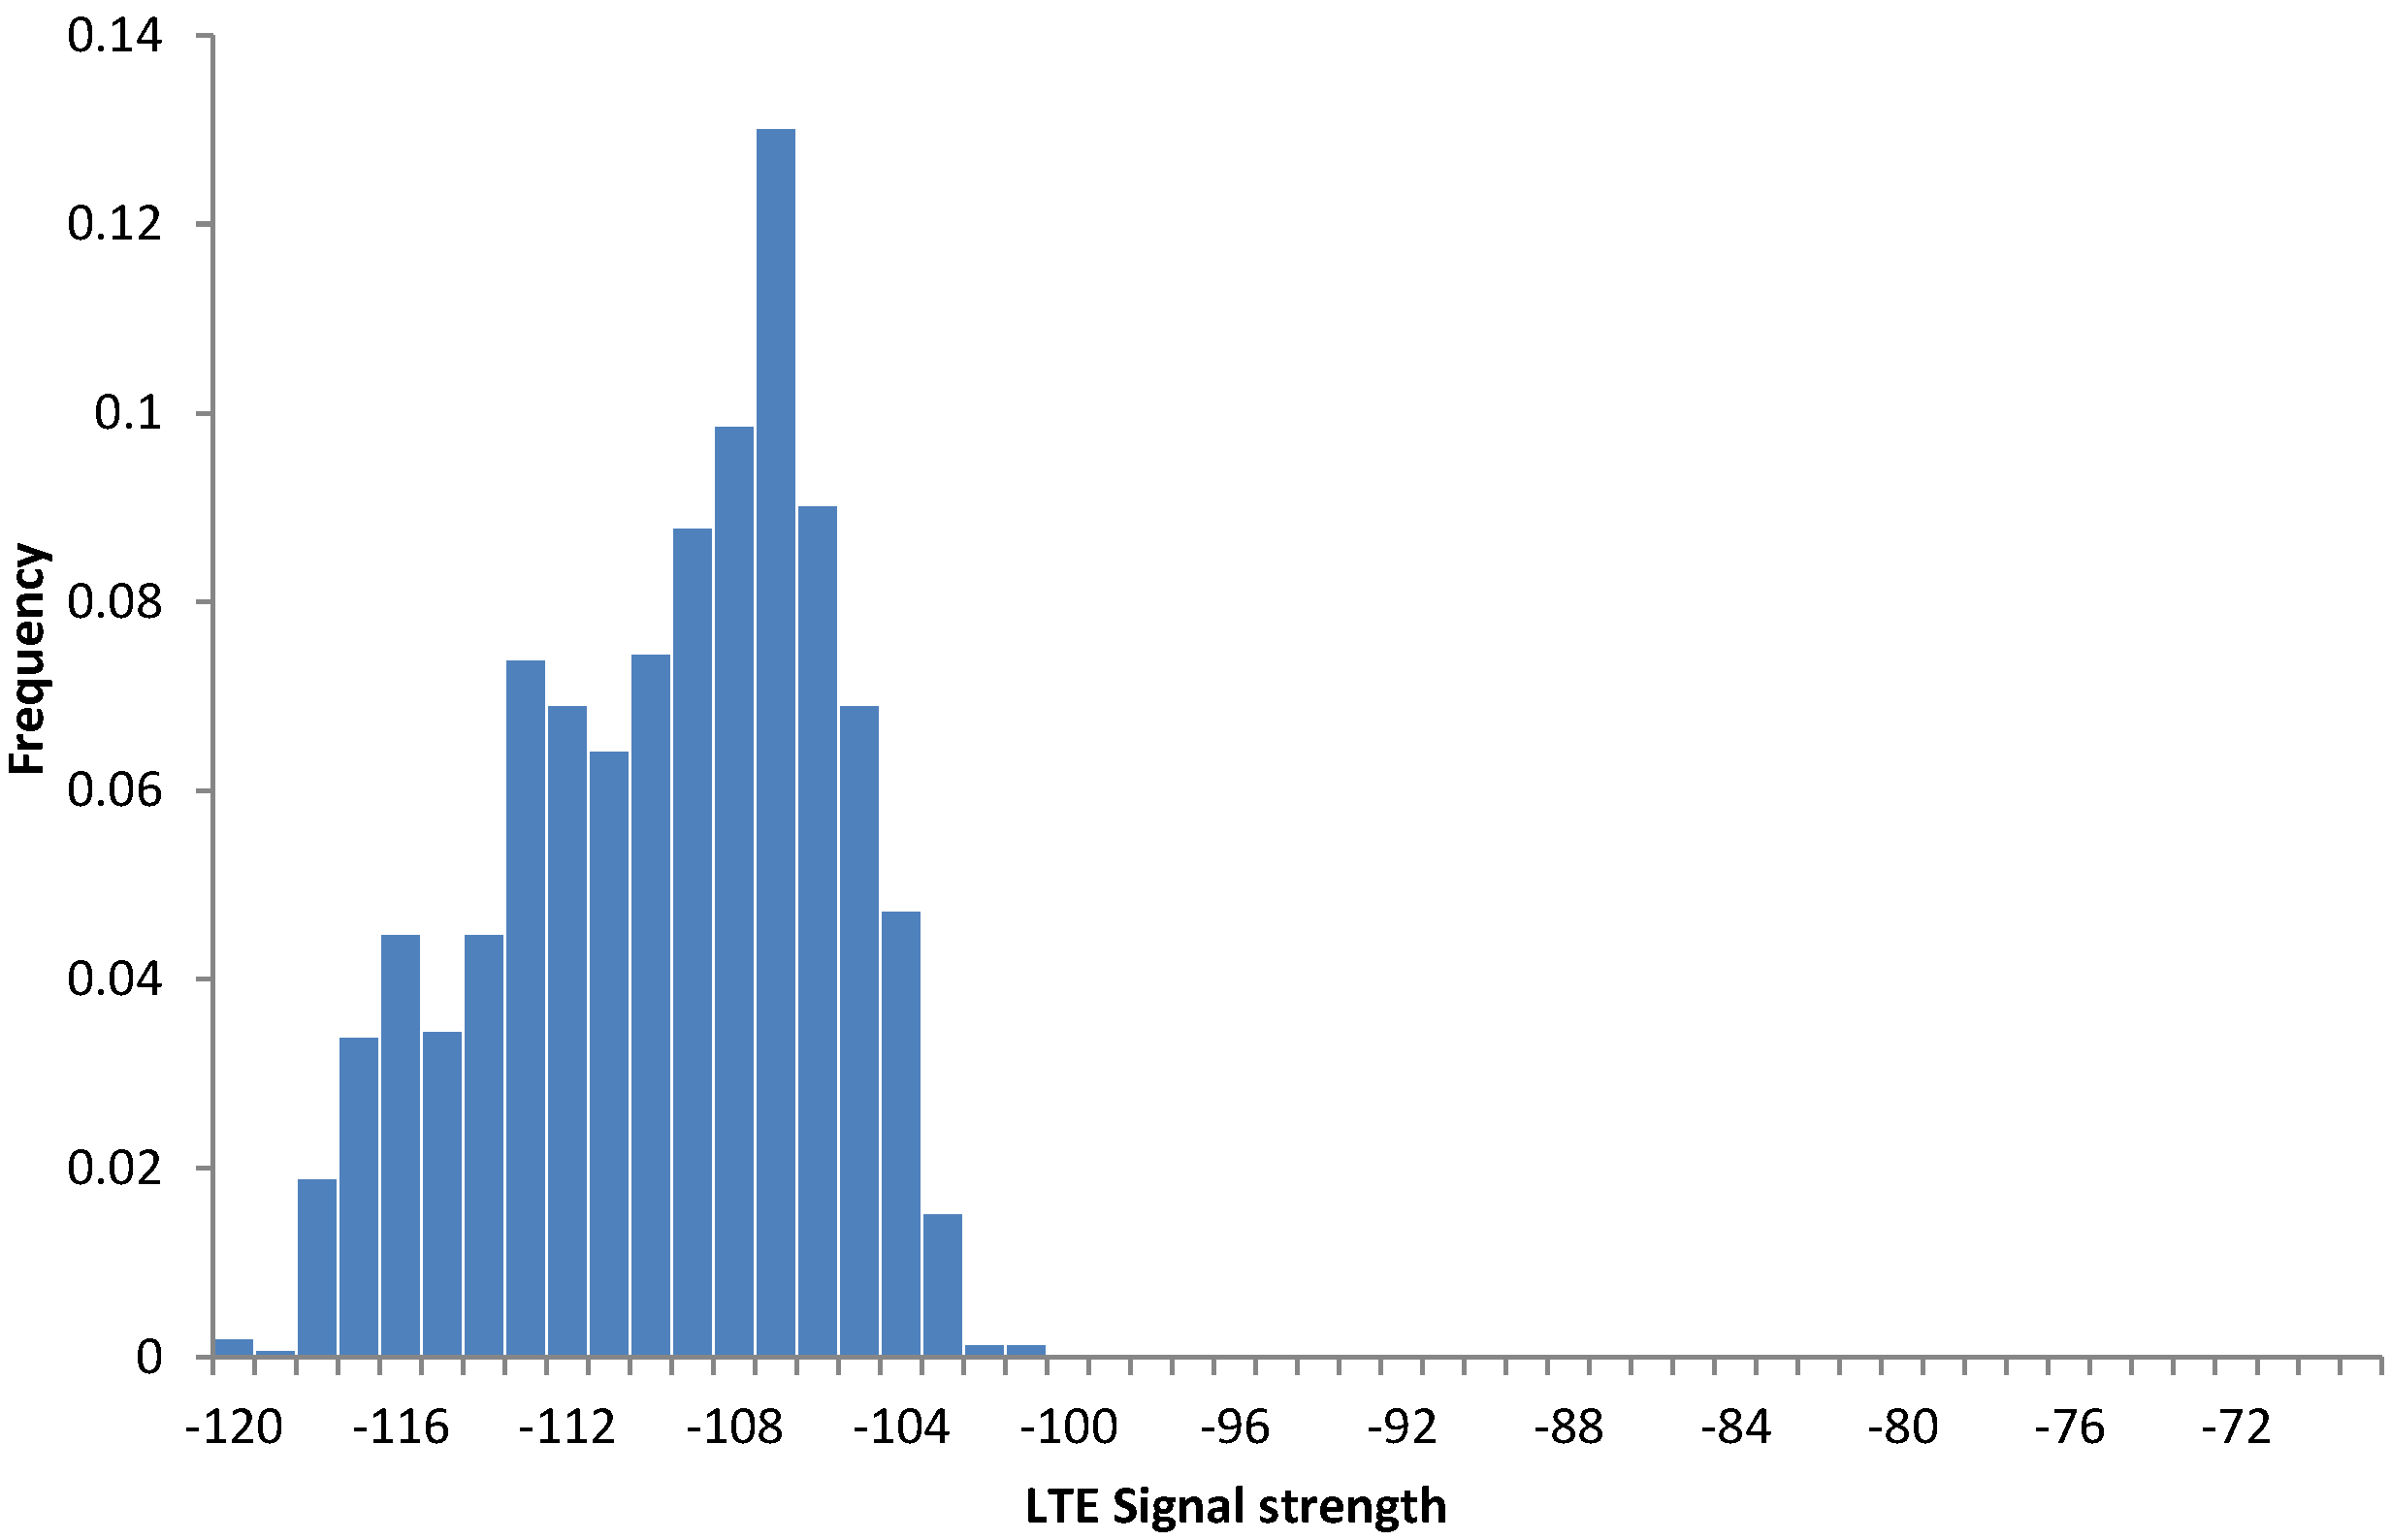
| Value | LTE | EDGE | HSPA | HSPA+ |
|---|---|---|---|---|
| Series I: single floor | ||||
| Total time | 03:37:44 | 00:04:02 | 00:40:57 | 00:15:09 |
| Average time between changes | 00:12:06 | 00:01:00 | 00:01:39 | 00:01:05 |
| % of connections | 78.36% | 1.45% | 15.04% | 5.45% |
| Series II: many floors, elevator | ||||
| Total time | 02:56:42 | 00:13:24 | 01:49:07 | 00:07:03 |
| Average time between changes | 00:14:43 | 00:03:21 | 00:04:36 | 00:00:53 |
| % of connections | 57.69% | 4.38% | 35.63% | 2.30% |
| Total | ||||
| Total time | 06:34:26 | 00:17:26 | 02:30:04 | 00:22:12 |
| Average time between changes | 00:13:25 | 00:02:11 | 00:03:07 | 00:00:59 |
| % of connections | 67.53% | 2.98% | 25.69% | 3.80% |
7. Conclusions
Acknowledgments
Author Contributions
Conflicts of Interest
References
- Ganti, R.K.; Ye, F.; Lei, H. Mobile crowdsensing: current state and future challenges. IEEE Commun. Mag. 2011, 49, 32–39. [Google Scholar] [CrossRef]
- Chon, Y.; Lane, N.D.; Li, F.; Cha, H.; Zhao, F. Automatically characterizing places with opportunistic crowdsensing using smartphones. In Proceedings of the 2012 ACM Conference on Ubiquitous Computing, Pittsburgh, PA, USA, 5–8 September 2012; pp. 481–490.
- Dutta, P.; Aoki, P.M.; Kumar, N.; Mainwaring, A.; Myers, C.; Willett, W.; Woodruff, A. Common sense: participatory urban sensing using a network of handheld air quality monitors. In Proceedings of the 7th ACM Conference on Embedded Networked Sensor Systems, Berkeley, CA, USA, 4–6 November 2009; pp. 349–350.
- Farshad, A.; Marina, M.K.; Garcia, F. Urban WiFi characterization via mobile crowdsensing. In Proceedings of the IEEE Network Operations and Management Symposium (NOMS), Krakow, Poland, 5–9 May 2014; pp. 1–9.
- Xiao, Y.; Simoens, P.; Pillai, P.; Ha, K.; Satyanarayanan, M. Lowering the barriers to large-scale mobile crowdsensing. In Proceedings of the 14th Workshop on Mobile Computing Systems and Applications, Jekyll Island, GA, USA, 26–27 February 2013.
- Brabham, D.C. Crowdsourcing; Mit Press: Cambridge, MA, USA, 2013. [Google Scholar]
- Lane, N.D.; Miluzzo, E.; Lu, H.; Peebles, D.; Choudhury, T.; Campbell, A.T. A survey of mobile phone sensing. IEEE Commun. Mag. 2010, 48, 140–150. [Google Scholar] [CrossRef]
- Open Signal Inc. Available online: http://www.opensignal.com (accessed on 15 October 2014).
- Haderer, N.; Rouvoy, R.; Ribeiro, C.; Seinturier, L. APISENSE: Crowd-Sensing Made Easy. ERCIM News 2013, 93, 28–29. [Google Scholar]
- Jayaraman, P.P.; Perera, C.; Georgakopoulos, D.; Zaslavsky, A. Efficient opportunistic sensing using mobile collaborative platform mosden. In Proceedings of the 9th IEEE International Conference on Collaborative Computing: Networking, Applications and Worksharing (Collaboratecom), Austin, TX, USA, 20–23 October 2013; pp. 77–86.
- Yang, D.; Xue, G.; Fang, X.; Tang, J. Crowdsourcing to smartphones: incentive mechanism design for mobile phone sensing. In Proceedings of the 18th ACM Annual International Conference on Mobile Computing and Networking, Istanbul, Turkey, 22–26 August 2012; pp. 173–184.
- Koutsopoulos, I. Optimal incentive-driven design of participatory sensing systems. In Proceedings of the IEEE INFOCOM, Turin, Italy, 14–19 April 2013; pp. 1402–1410.
- Haderer, N.; Rouvoy, R.; Seinturier, L. A preliminary investigation of user incentives to leverage crowdsensing activities. In Proceedings of the IEEE International Conference on Pervasive Computing and Communications Workshops (PERCOM Workshops), San Diego, CA, USA, 18–22 March 2013; pp. 199–204.
- Foursquare Inc. Available online: http://www.foursquare.com (accessed on 15 October 2014).
- Ramani, S.V.; Tank, Y.N. Indoor Navigation on Google Maps and Indoor Localization Using RSS Fingerprinting. Int. J. Eng. Trends Technol. 2014, V11, 171–173. [Google Scholar] [CrossRef]
- Simula, H.; Vuori, M. Benefits and barriers of crowdsourcing in B2B firms: Generating ideas with internal and external crowds. Intern. J. Innov. Manag. 2012, 16. [Google Scholar] [CrossRef]
- Faggiani, A.; Gregori, E.; Lenzini, L.; Luconi, V.; Vecchio, A.; di Ingegneria dell’Informazione, D. Smartphone-based crowdsourcing for network monitoring: Opportunities, challenges, and a case study. IEEE Commun. Mag. 2014, 52, 106–113. [Google Scholar] [CrossRef]
- Han, K.; Zhang, C.; Luo, J. Truthful Scheduling Mechanisms for Powering Mobile Crowdsensing. CoRR 2013, PP. [Google Scholar] [CrossRef]
- Lane, N.D.; Chon, Y.; Zhou, L.; Zhang, Y.; Li, F.; Kim, D.; Ding, G.; Zhao, F.; Cha, H. Piggyback CrowdSensing (PCS): Energy efficient crowdsourcing of mobile sensor data by exploiting smartphone app opportunities. In Proceedings of the 11th ACM Conference on Embedded Networked Sensor Systems, Roma, Italy, 11–15 November 2013.
- Duribreux, J.; Rouvoy, R.; Monperrus, M. An Energy-efficient Location Provider for Daily Trips; RR-8586; HAL: Lyon, France, 28 August 2014. [Google Scholar]
- Oshin, T.O.; Poslad, S.; Ma, A. Improving the Energy-Efficiency of GPS based location sensing smartphone applications. In Proceedings of the 11th IEEE International Conference on Trust, Security and Privacy in Computing and Communications (TrustCom), Liverpool, UK, 25–27 January 2012; pp. 1698–1705.
- Ofstad, A.; Nicholas, E.; Szcodronski, R.; Choudhury, R.R. Aampl: Accelerometer augmented mobile phone localization. In Proceedings of the First ACM International Workshop on Mobile Entity Localization and Tracking in GPS-less Environments, San Francisco, CA, USA, 14–19 September 2008; pp. 13–18.
- Zhao, D.; Ma, H.; Liu, L. Energy-efficient opportunistic coverage for people-centric urban sensing. Wirel. Netw. 2014, 20, 1461–1476. [Google Scholar] [CrossRef]
- Kjærgaard, M.B.; Bhattacharya, S.; Blunck, H.; Nurmi, P. Energy-efficient trajectory tracking for mobile devices. In Proceedings of the 9th International Conference on Mobile Systems, Applications, and Services, Bethesda, MD, USA, 28 June–1 July 2011; pp. 307–320.
- Kjærgaard, M.B.; Langdal, J.; Godsk, T.; Toftkjær, T. EnTracked: Energy-efficient Robust Position Tracking for Mobile Devices. In Proceedings of the 7th ACM International Conference on Mobile Systems, Applications, and Services, Wroclaw, Poland, 22–25 June 2009; ACM: New York, NY, USA, 2009; pp. 221–234. [Google Scholar]
- Xiong, H.; Zhang, D.; Wang, L.; Gibson, J.P.; Zhu, J. EEMC: Enabling Energy-Efficient Mobile Crowdsensing with Anonymous Participants. ACM Trans. Intell. Syst. Technol. 2015, 6, 1–26. [Google Scholar] [CrossRef]
- Xiong, H.; Zhang, D.; Wang, L.; Chaouchi, H. EMC3: Energy-efficient Data Transfer in Mobile Crowdsensing under Full Coverage Constraint. IEEE Trans. Mob. Comput. 2015, 14, 1355–1368. [Google Scholar] [CrossRef]
- Wang, L.; Zhang, D.; Pathak, A.; Chen, C.; Xiong, H.; Yang, D.; Wang, Y. CCS-TA: Quality-Guaranteed Online Task Allocation in Compressive Crowdsensing. In Proceedings of the 2015 ACM International Joint Conference on Pervasive and Ubiquitous Computing (UbiComp’15), Osaka, Japan, 7–11 September 2015.
- Xiong, H.; Zhang, D.; Chen, G.; Wang, L.; Gauthier, V. CrowdTasker: Maximizing coverage quality in Piggyback Crowdsensing under budget constraint. In Proceedings of the 2015 IEEE International Conference on Pervasive Computing and Communications (PerCom), St. Louis, MO, USA, 23–27 March 2015; pp. 55–62.
- Zhang, D.; Xiong, H.; Wang, L.; Chen, G. CrowdRecruiter: Selecting Participants for Piggyback Crowdsensing Under Probabilistic Coverage Constraint. In Proceedings of the 2014 ACM International Joint Conference on Pervasive and Ubiquitous Computing, Seattle, WA, USA, 13–17 September 2014; ACM: New York, NY, USA, 2014; pp. 703–714. [Google Scholar]
- Xu, L.; Hao, X.; Lane, N.; Liu, X.; Moscibroda, T. More with Less: Lowering User Burden in Mobile Crowdsourcing through Compressive Sensing. In Proceedings of the 2015 ACM International Joint Conference on Pervasive and Ubiquitous Computing (UbiComp’15), Osaka, Japan, 7–11 September 2015.
- Yang, K.M.; Cho, S.B. A Non-GPS Low-Power Context-Aware System using Modular Bayesian Networks. In Proceedings of the MOBILITY 2014, The Fourth International Conference on Mobile Services, Resources, and Users, Paris, France, 20–24 July 2014.
- Guo, B.; Chen, H.; Yu, Z.; Xie, X.; Huangfu, S.; Wang, Z. FlierMeet: Cross-space Public Information Reposting with Mobile Crowd Sensing. In Proceedings of the 2014 ACM International Joint Conference on Pervasive and Ubiquitous Computing: Adjunct Publication, Seattle, WA, USA, 13–17 September 2014; ACM: New York, NY, USA, 2014; pp. 59–62. [Google Scholar]
- Gorawski, M.; Grochla, K. The real-life mobility model: RLMM. In Proceedings of 2013 IEEE Second International Conference on Future Generation Communication Technology (FGCT), London, UK, 13–14 November 2013; pp. 201–206.
- BX Tracker. Available online: https://play.google.com/store/apps/details?id=com.bxlabs.tracker (accessed on 1 September 2015).
- Ester, M.; Kriegel, H.P.; Sander, J.; Xu, X. A density-based algorithm for discovering clusters in large spatial databases with noise. In Proceedings of the Second International Conference on Knowledge Discovery and Data Mining (KDD-96), Portland, OR, USA, 2–4 August 1996; Volume 96, pp. 226–231.
- Google Maps Geocoding. Available online: https://developers.google.com/maps/documentation/geocoding/ (accessed on 19 September 2014).
- Zang, H.; Bolot, J. Anonymization of location data does not work: A large-scale measurement study. In Proceedings of the 17th ACM Annual International Conference on Mobile Computing and Networking, Las Vegas, NV, USA, 19–23 September 2011; pp. 145–156.
- Google. Android Developers: Dashboards. Available online: https://developer.android.com/about/dashboards/index.html (accessed on 19 September 2014).
- Corporation, I.D. IDC: Smartphone OS Market Share 2014, 2013, 2012, and 2011. Available online: http://www.idc.com/prodserv/smartphone-os-market-share.jsp (accessed on 19 September 2014).
- Rana, R.K.; Chou, C.T.; Kanhere, S.S.; Bulusu, N.; Hu, W. Ear-phone: An end-to-end participatory urban noise mapping system. In Proceedings of the 9th ACM/IEEE International Conference on Information Processing in Sensor Networks, Stockholm, Sweden, 12–15 April 2010; pp. 105–116.
- Kadous, W.; Ganesh, J. Beyond the Blue Dot: New Features in Android Location. Available online: https://developers.google.com/events/io/sessions/325337477 (accessed on 19 September 2014).
- BX Labs. Available online: http://www.bx-labs.com/tracker (accessed on 1 September 2015).
- Rhee, I.; Shin, M.; Hong, S.; Lee, K.; Kim, S.; Chong, S. CRAWDAD data set ncsu/mobilitymodels. Available online: http://crawdad.org/ncsu/mobilitymodels/ (accessed on 19 September 2014).
- Ficek, M. CRAWDAD Data Set Ctu/personal. Available online: http://crawdad.org/ctu/personal/ (accessed on 19 September 2014).
- Chon, Y.; Talipov, E.; Shin, H.; Cha, H. CRAWDAD Data Set Yonsei/lifemap. Available online: http://crawdad.org/yonsei/lifemap/ (accessed on 19 September 2014).
- OpenStreetMap, Public GPS Traces. Available online: https://www.openstreetmap.org/traces (accessed on 15 October 2014).
- Isaacman, S.; Becker, R.; Cáceres, R.; Martonosi, M.; Rowland, J.; Varshavsky, A.; Willinger, W. Human Mobility Modeling at Metropolitan Scales. In Proceedings of the 10th International Conference on Mobile Systems, Applications, and Services, Ambleside, UK, 25–29 June 2012; ACM: New York, NY, USA, 2012; pp. 239–252. [Google Scholar]
- National Travel Survey: 2012. Available online: https://www.gov.uk/government/uploads/system/uploads/attachment_data/file/243957/nts2012-01.pdf (accessed on 14 October 2014).
- Galeana-Zapién, H.; Torres-Huitzil, C.; Rubio-Loyola, J. Mobile Phone Middleware Architecture for Energy and Context Awareness in Location-Based Services. Sensors 2014, 14, 23673–23696. [Google Scholar] [CrossRef] [PubMed]
- Kwapisz, J.R.; Weiss, G.M.; Moore, S.A. Activity recognition using cell phone accelerometers. ACM SigKDD Explor. Newsl. 2011, 12, 74–82. [Google Scholar] [CrossRef]
- Ravi, N.; Dandekar, N.; Mysore, P.; Littman, M.L. Activity recognition from accelerometer data. In Proceedings of the Seventeenth Annual Conference on Innovative Applications of Artificial Intelligence (IAAI-05), Pittsburgh, PA, USA, 9–13 July 2005; Volume 5, pp. 1541–1546.
- Brezmes, T.; Gorricho, J.L.; Cotrina, J. Activity recognition from accelerometer data on a mobile phone. In Distributed Computing, Artificial Intelligence, Bioinformatics, Soft Computing, and Ambient Assisted Living; Springer: Berlin, Germany, 2009; pp. 796–799. [Google Scholar]
- Shoaib, M.; Bosch, S.; Incel, O.D.; Scholten, H.; Havinga, P.J.M. Fusion of Smartphone Motion Sensors for Physical Activity Recognition. Sensors 2014, 14, 10146–10176. [Google Scholar] [CrossRef] [PubMed]
- Morillo, L.M.S.; Gonzalez-Abril, L.; Ramirez, J.A.O.; de la Concepcion, M.A.A. Low Energy Physical Activity Recognition System on Smartphones. Sensors 2015, 15, 5163–5196. [Google Scholar] [CrossRef] [PubMed]
- Khan, A.M.; Siddiqi, M.H.; Lee, S.W. Exploratory Data Analysis of Acceleration Signals to Select Light-Weight and Accurate Features for Real-Time Activity Recognition on Smartphones. Sensors 2013, 13, 13099–13122. [Google Scholar] [CrossRef] [PubMed]
- Google Activity Recognition. Available online: https://developer.android.com/reference/com/google/android/gms/location/DetectedActivity.html (accessed on 19 September 2014).
- GPS satellites. Available online: http://developer.android.com/reference/android/location/GpsSatellite.html#getSnr() (accessed on 19 September 2014).
- Foremski, P.; Grochla, K. LTE or WiFi? Client-side Internet link selection for smartphones. In Computer Networks; Springer International Publishing: Gewerbestrasse, Switzerland, 2015; pp. 43–53. [Google Scholar]
- Gorawski, M.; Grochla, K.; Polys, K. Variability of LTE Signal in Indoor Environment. In Proceedings of the Internet in the Information Society, 10th Scientific Conference, Dabrowa Gornicza, Poland, 24–25 September 2015.
- Gorawski, M.; Grochla, K.; Polys, K. Comparison of Measurements in Simulation Model of Indoor Signal Level Variation in LTE Networks. In Proceedings of the Eighth EAI International Conference on Simulation Tools and Techniques, Athens, Greece, 24–26 August 2015.
- Rhee, I.; Shin, M.; Hong, S.; Lee, K.; Chong, S. On the Levy-walk Nature of Human Mobility: Do Humans Walk like Monkeys? IEEE/ACM Trans. Netw. 2011, 9, 630–643. [Google Scholar] [CrossRef]
- Gorawski, M.; Grochla, K. Review of Mobility Models for Performance Evaluation of Wireless Networks. In Man-Machine Interactions 3; Springer International Publishing: Gewerbestrasse, Switzerland, 2014; pp. 567–577. [Google Scholar]
- Barcelo-Arroyo, F.; Gorawski, M.; Grochla, K.; Martín-Escalona, I.; Połys, K.; Ribeiro, A.G.; Sofia, R.; Zola, E. New Trends in Mobility Modelling and Handover Prediction. In Wireless Networking for Moving Objects; Springer International Publishing: Gewerbestrasse, Switzerland, 2014; pp. 88–114. [Google Scholar]
- Giambene, G.; Yahiya, T.A.; Grochla, K.; Połys, K. Resource Management and Cell Planning in LTE Systems. In Wireless Networking for Moving Objects; Springer International Publishing: Gewerbestrasse, Switzerland, 2014; pp. 177–197. [Google Scholar]
© 2015 by the authors; licensee MDPI, Basel, Switzerland. This article is an open access article distributed under the terms and conditions of the Creative Commons Attribution license (http://creativecommons.org/licenses/by/4.0/).
Share and Cite
Foremski, P.; Gorawski, M.; Grochla, K.; Polys, K. Energy-Efficient Crowdsensing of Human Mobility and Signal Levels in Cellular Networks. Sensors 2015, 15, 22060-22088. https://doi.org/10.3390/s150922060
Foremski P, Gorawski M, Grochla K, Polys K. Energy-Efficient Crowdsensing of Human Mobility and Signal Levels in Cellular Networks. Sensors. 2015; 15(9):22060-22088. https://doi.org/10.3390/s150922060
Chicago/Turabian StyleForemski, Paweł, Michał Gorawski, Krzysztof Grochla, and Konrad Polys. 2015. "Energy-Efficient Crowdsensing of Human Mobility and Signal Levels in Cellular Networks" Sensors 15, no. 9: 22060-22088. https://doi.org/10.3390/s150922060
APA StyleForemski, P., Gorawski, M., Grochla, K., & Polys, K. (2015). Energy-Efficient Crowdsensing of Human Mobility and Signal Levels in Cellular Networks. Sensors, 15(9), 22060-22088. https://doi.org/10.3390/s150922060