1. Introduction
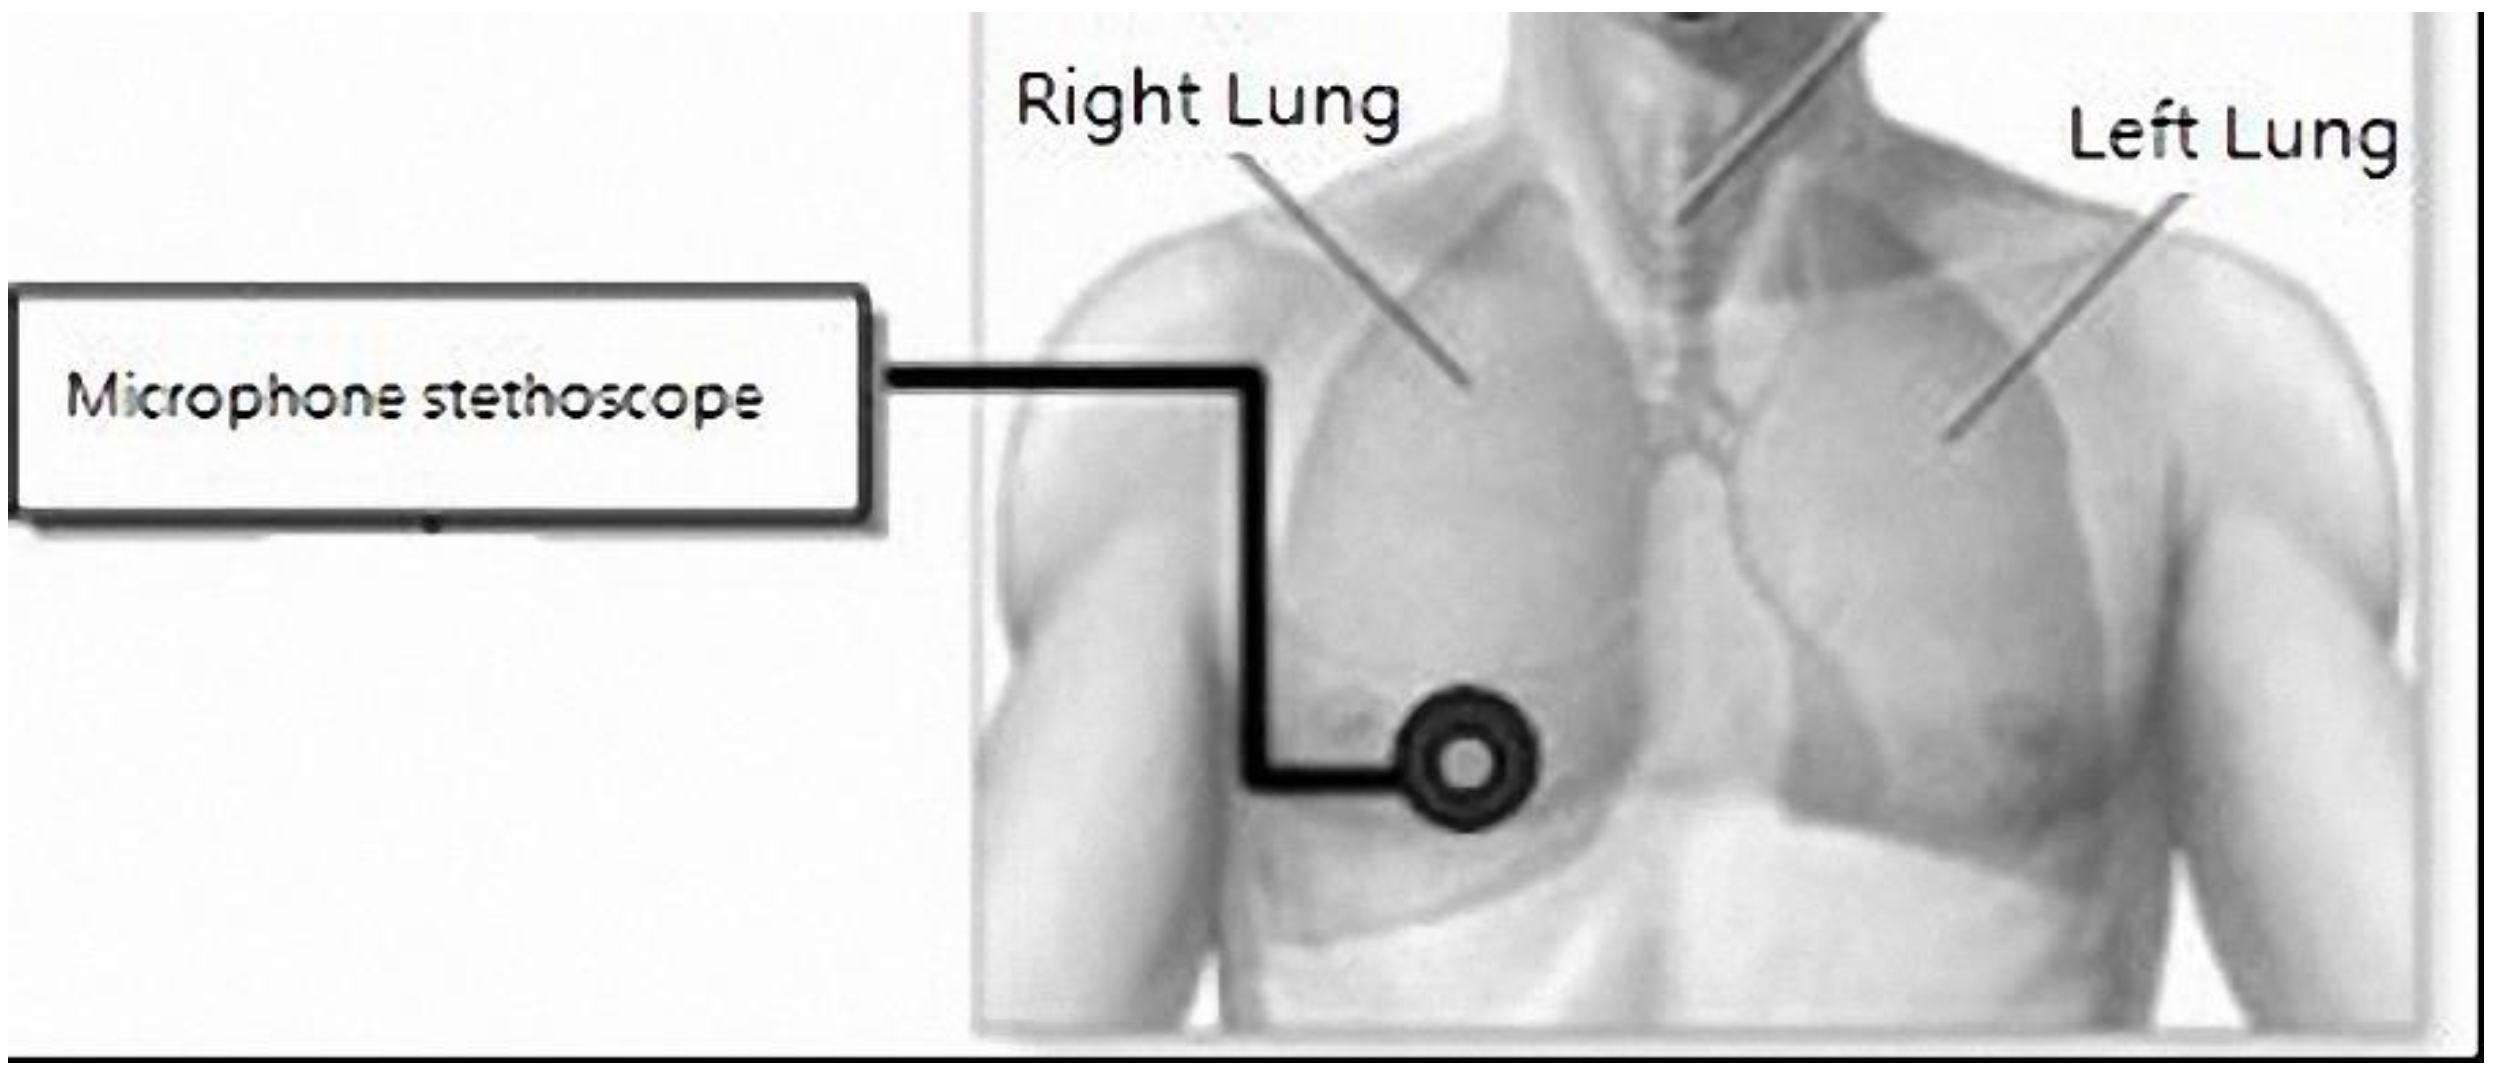
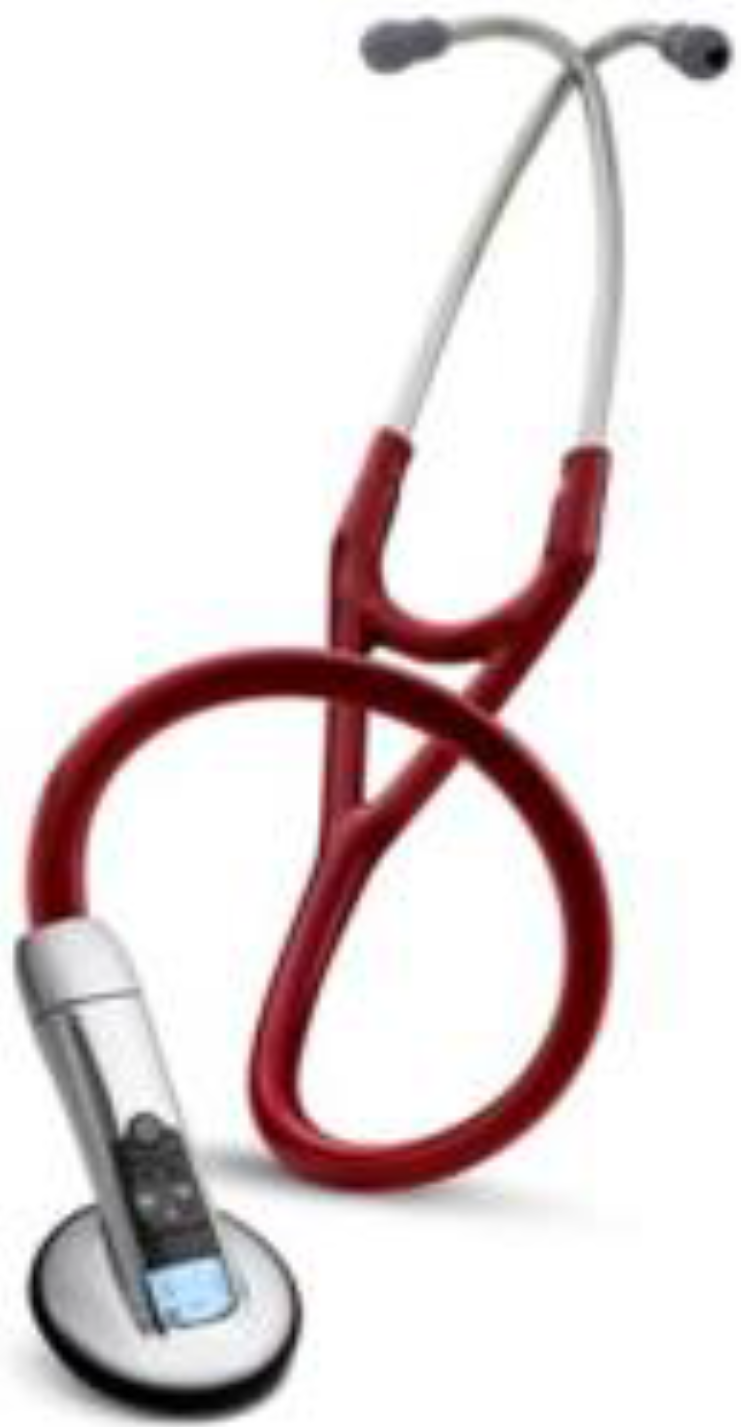
Lung auscultation is a diagnostic method used for checking the integrity of lung function. It is a standard preliminary examination for all patients at hospitals, whereby trained physicians use stethoscopes to listen for changes in lung sounds to assess whether a patient has any obvious lung abnormalities. Despite many advances in medical equipment, the traditional analog stethoscope remains the main diagnostic tool used by physicians in lung auscultation.
In modern society, factors such as air pollution, unbalanced diets, excessive stress, and abnormal sleep patterns have resulted in more people suffering from respiratory system diseases. According to recent Department of Health statistics, lung- and respiratory-related diseases ranked fourth and seventh among the top 10 leading causes of death. On average, one person dies from one of these two diseases every two hours [
1].
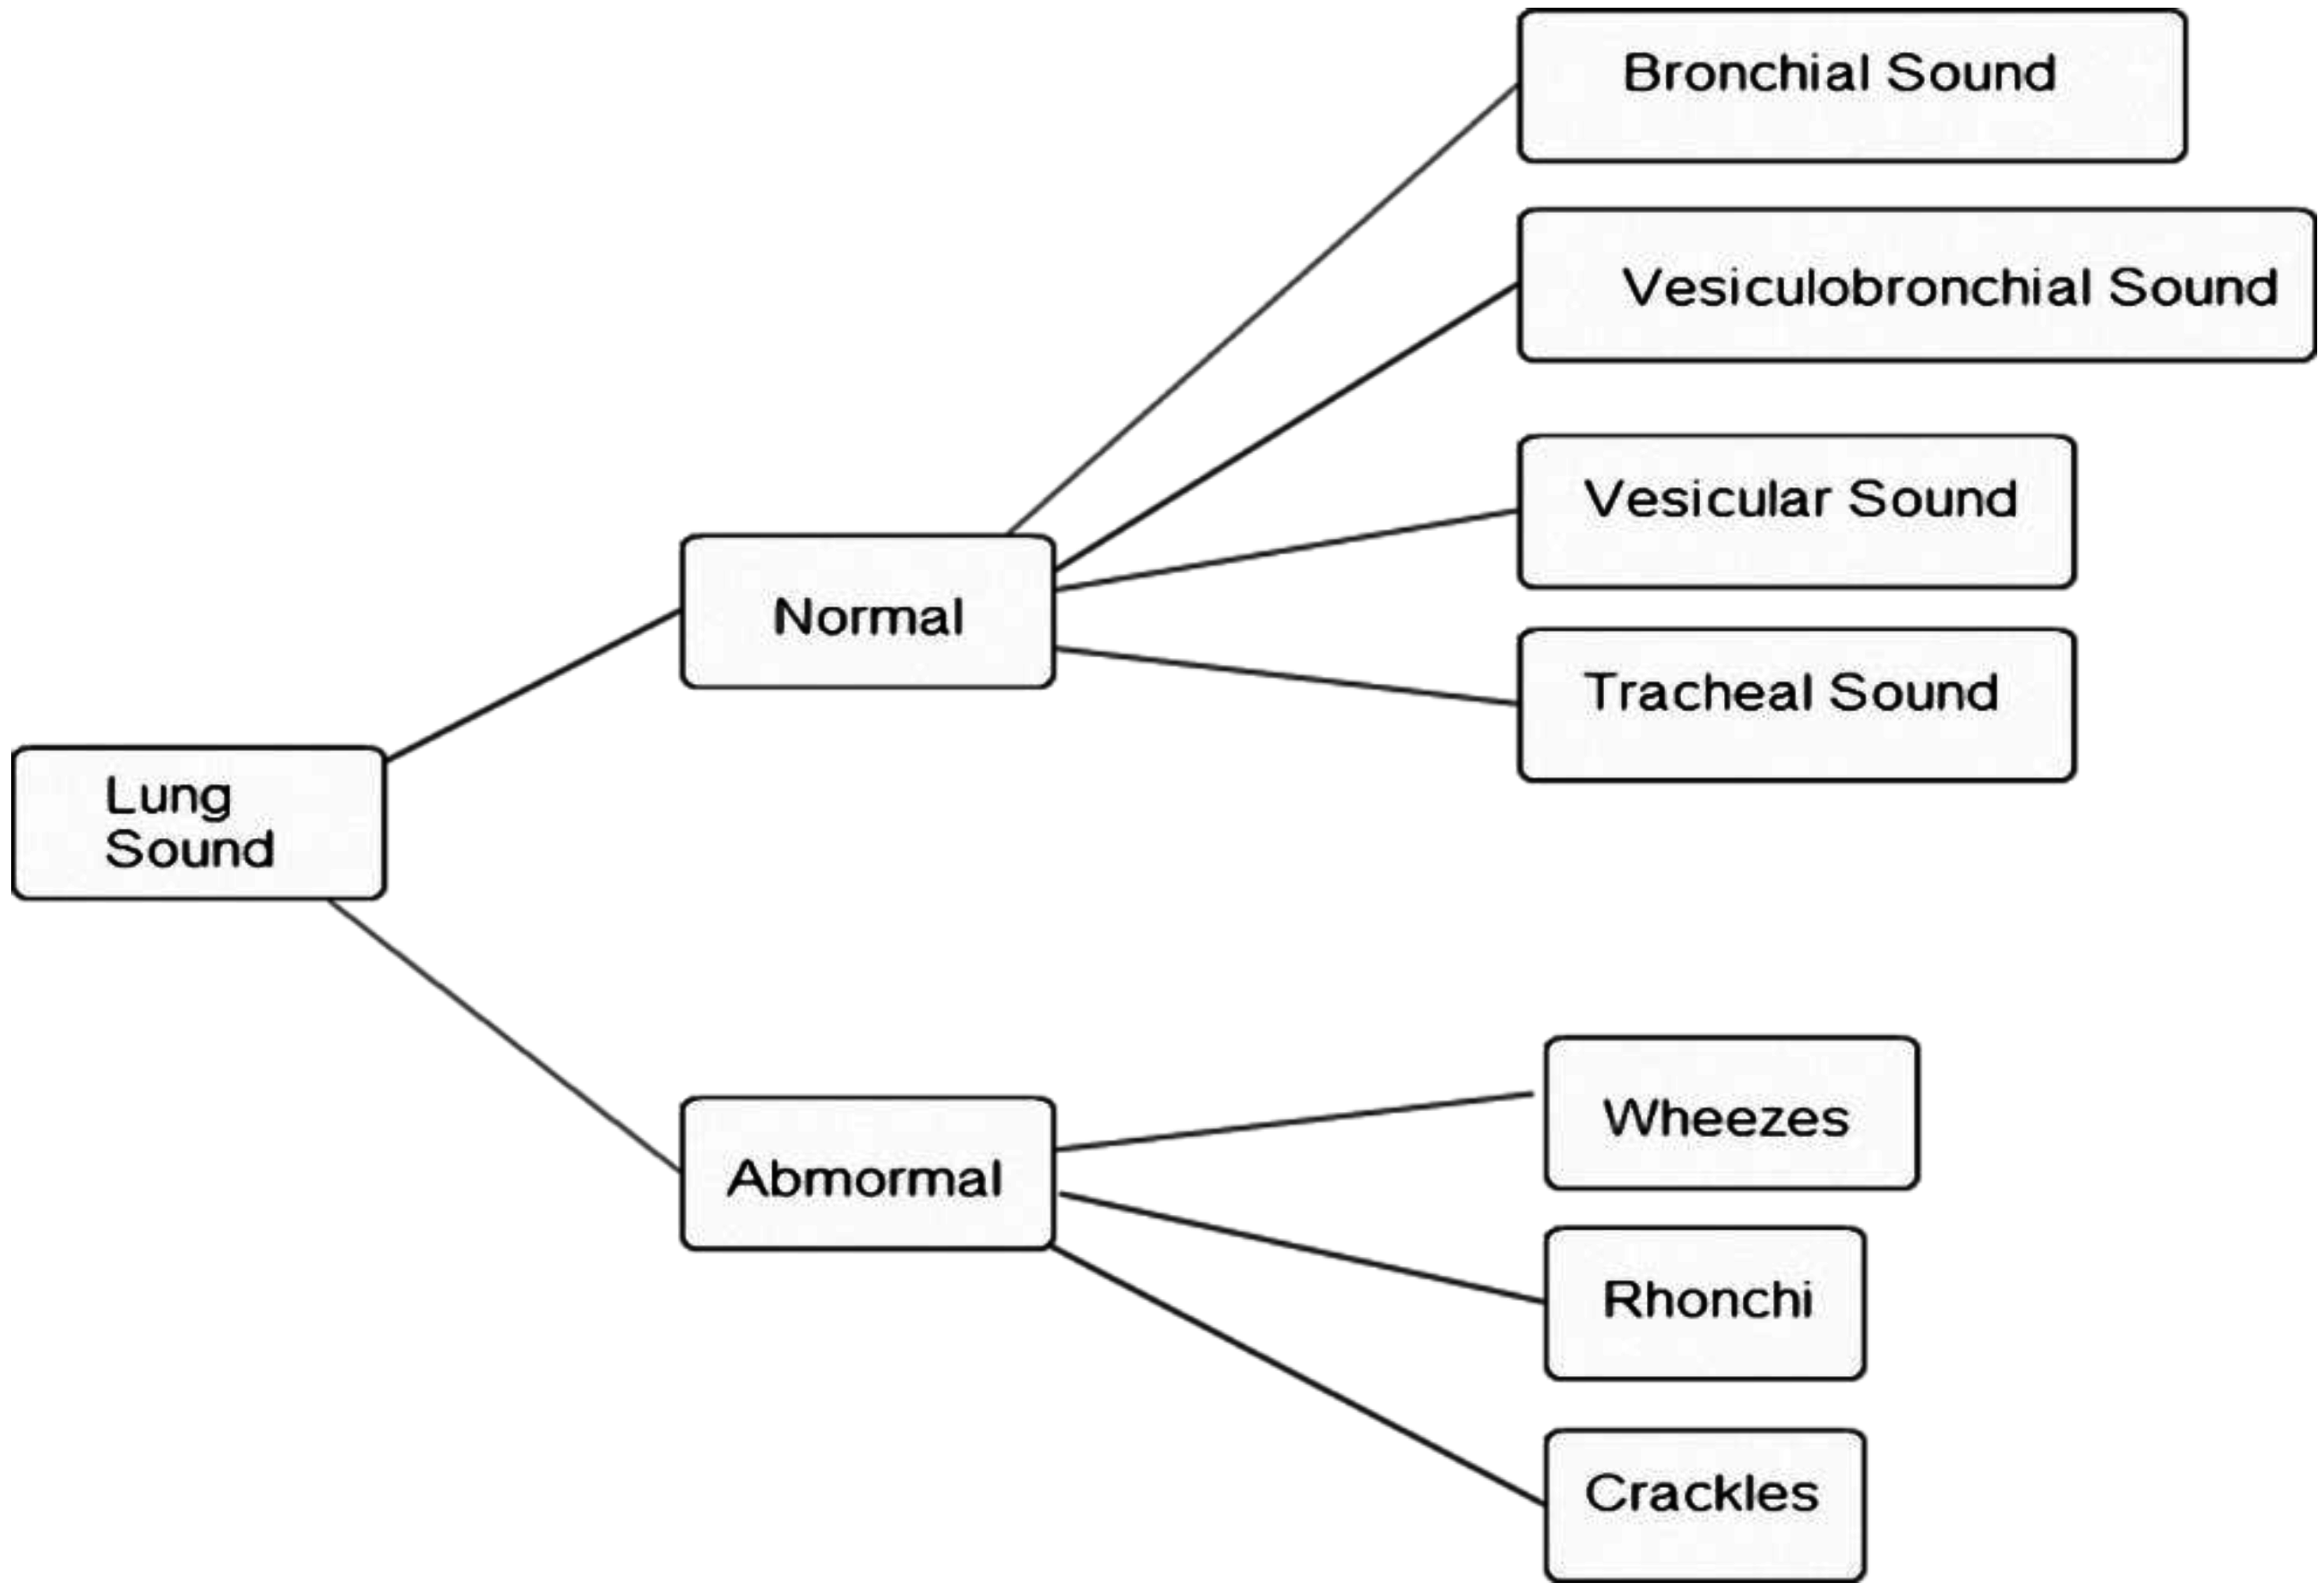
Figure 1.
Lung sound classification [
2].
Figure 1.
Lung sound classification [
2].
Lung sounds can be divided roughly into normal and abnormal sounds, as shown in
Figure 1 [
2]. Normal breath sounds can be divided into bronchial, vesicular-bronchial, vesicular, and tracheal sounds, while abnormal breath sounds can be divided into crackles, rhonchi, and wheezes. Patients with lung disease have abnormal breath sounds, so abnormal breath sounds are an important component in the diagnosis of lung diseases. Different lung diseases cause different lung sounds:
Table 1 lists some associations between abnormal lung sounds and lung diseases [
3]. Pneumonia, chronic bronchitis, bronchiectasis, congestive heart failure, and obstructive pulmonary disease produce crackles. Obstructive pulmonary disease, asthma, and bronchial stenosis produce wheezes. Pneumonia, chronic bronchitis, and congestive heart failure produce rhonchi. Researchers have found that the combined population of patients suffering from pneumonia, chronic bronchitis, bronchiectasis, congestive heart failure, obstructive pulmonary asthma, asthma, and bronchial stenosis accounts for about 30% of the global population [
4,
5,
6].
Table 1.
Associations between abnormal lung sounds and lung diseases [
2,
3].
Table 1.
Associations between abnormal lung sounds and lung diseases [2,3].
| Relevant Disease/Abnormal Lung Sound | Crackles | Wheezes | Rhonchi |
|---|
| Pneumonia | ● | | ● |
| Chronic bronchitis | ● | | ● |
| Bronchiectasis | ● | | |
| Congestive heart failure | ● | | ● |
| Obstructive pulmonary disease | | ● | |
| Asthma | | ● | |
| Bronchial stenosis | | ● | |
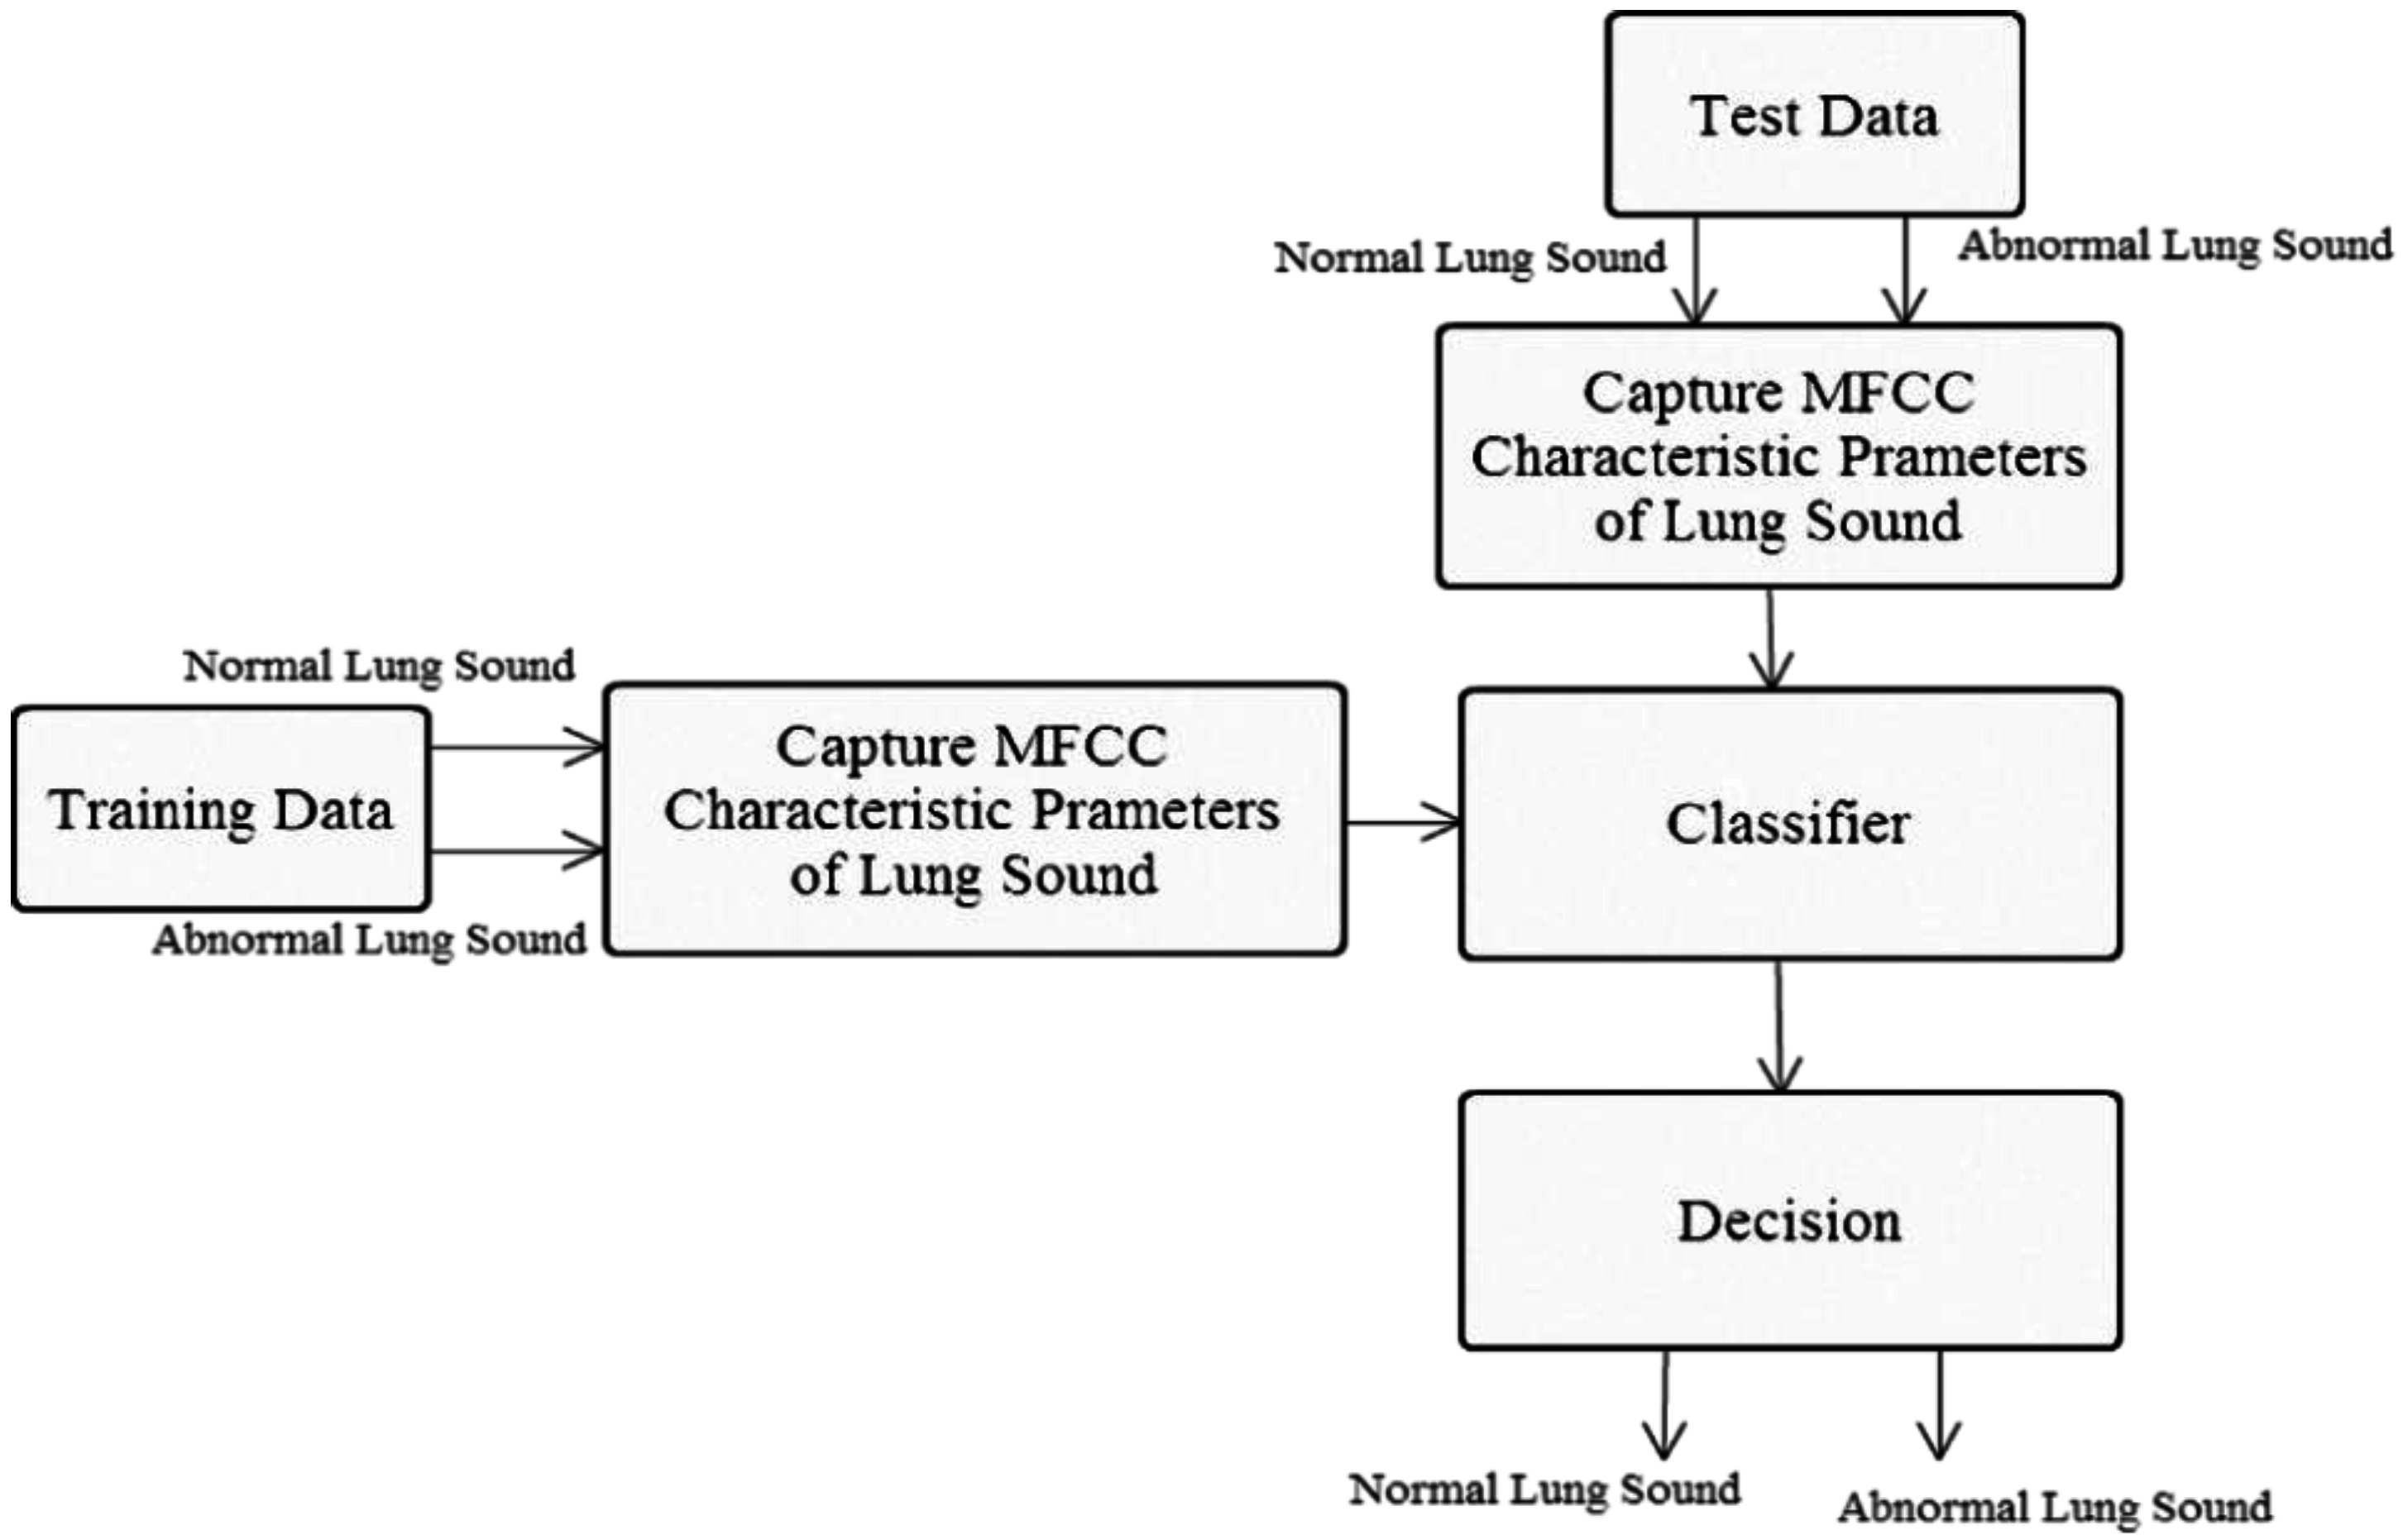
Many methods for analyzing lung sounds have been proposed. One involves converting lung sounds into a spectrogram: a wheeze-containing lung sound signal will appear as a continuous period of dark blocks in a spectrogram. Thus, an image processing method has been proposed to extract dark blocks to determine the existence of wheezes [
7]. Another method involves using mel-frequency cepstral coefficients (MFCCs) to establish normal lung sound and wheeze signal feature models, and to apply vector quantification in signal analysis to determine whether the signals include wheeze signals [
8]. A wavelet transformation of lung sound signals has also been proposed, in which eigenvalues are determined to analyze normal lung sound and wheeze signals through a Gaussian mixture model [
9]. Another method involves measuring lung sounds by an instrument and collecting breathing flow signals and then applying autoregressive model statistics combined with a nearest neighbor classification (Kth nearest neighbor) to analyze whether the lung sounds are abnormal [
10]. One method involves using MFCCs to establish abnormal lung sounds using acoustic feature models, using a Gaussian mixture model to determine whether the sounds are abnormal [
11]. With regard to instruments for collecting lung sounds, Suzuki proposed using two groups of condenser microphones to help eliminate background noise: one group of condenser microphones was used to record lung sounds and the other was used to record background noise; an adaptive filter was then used to eliminate background noise from lung sounds [
12].
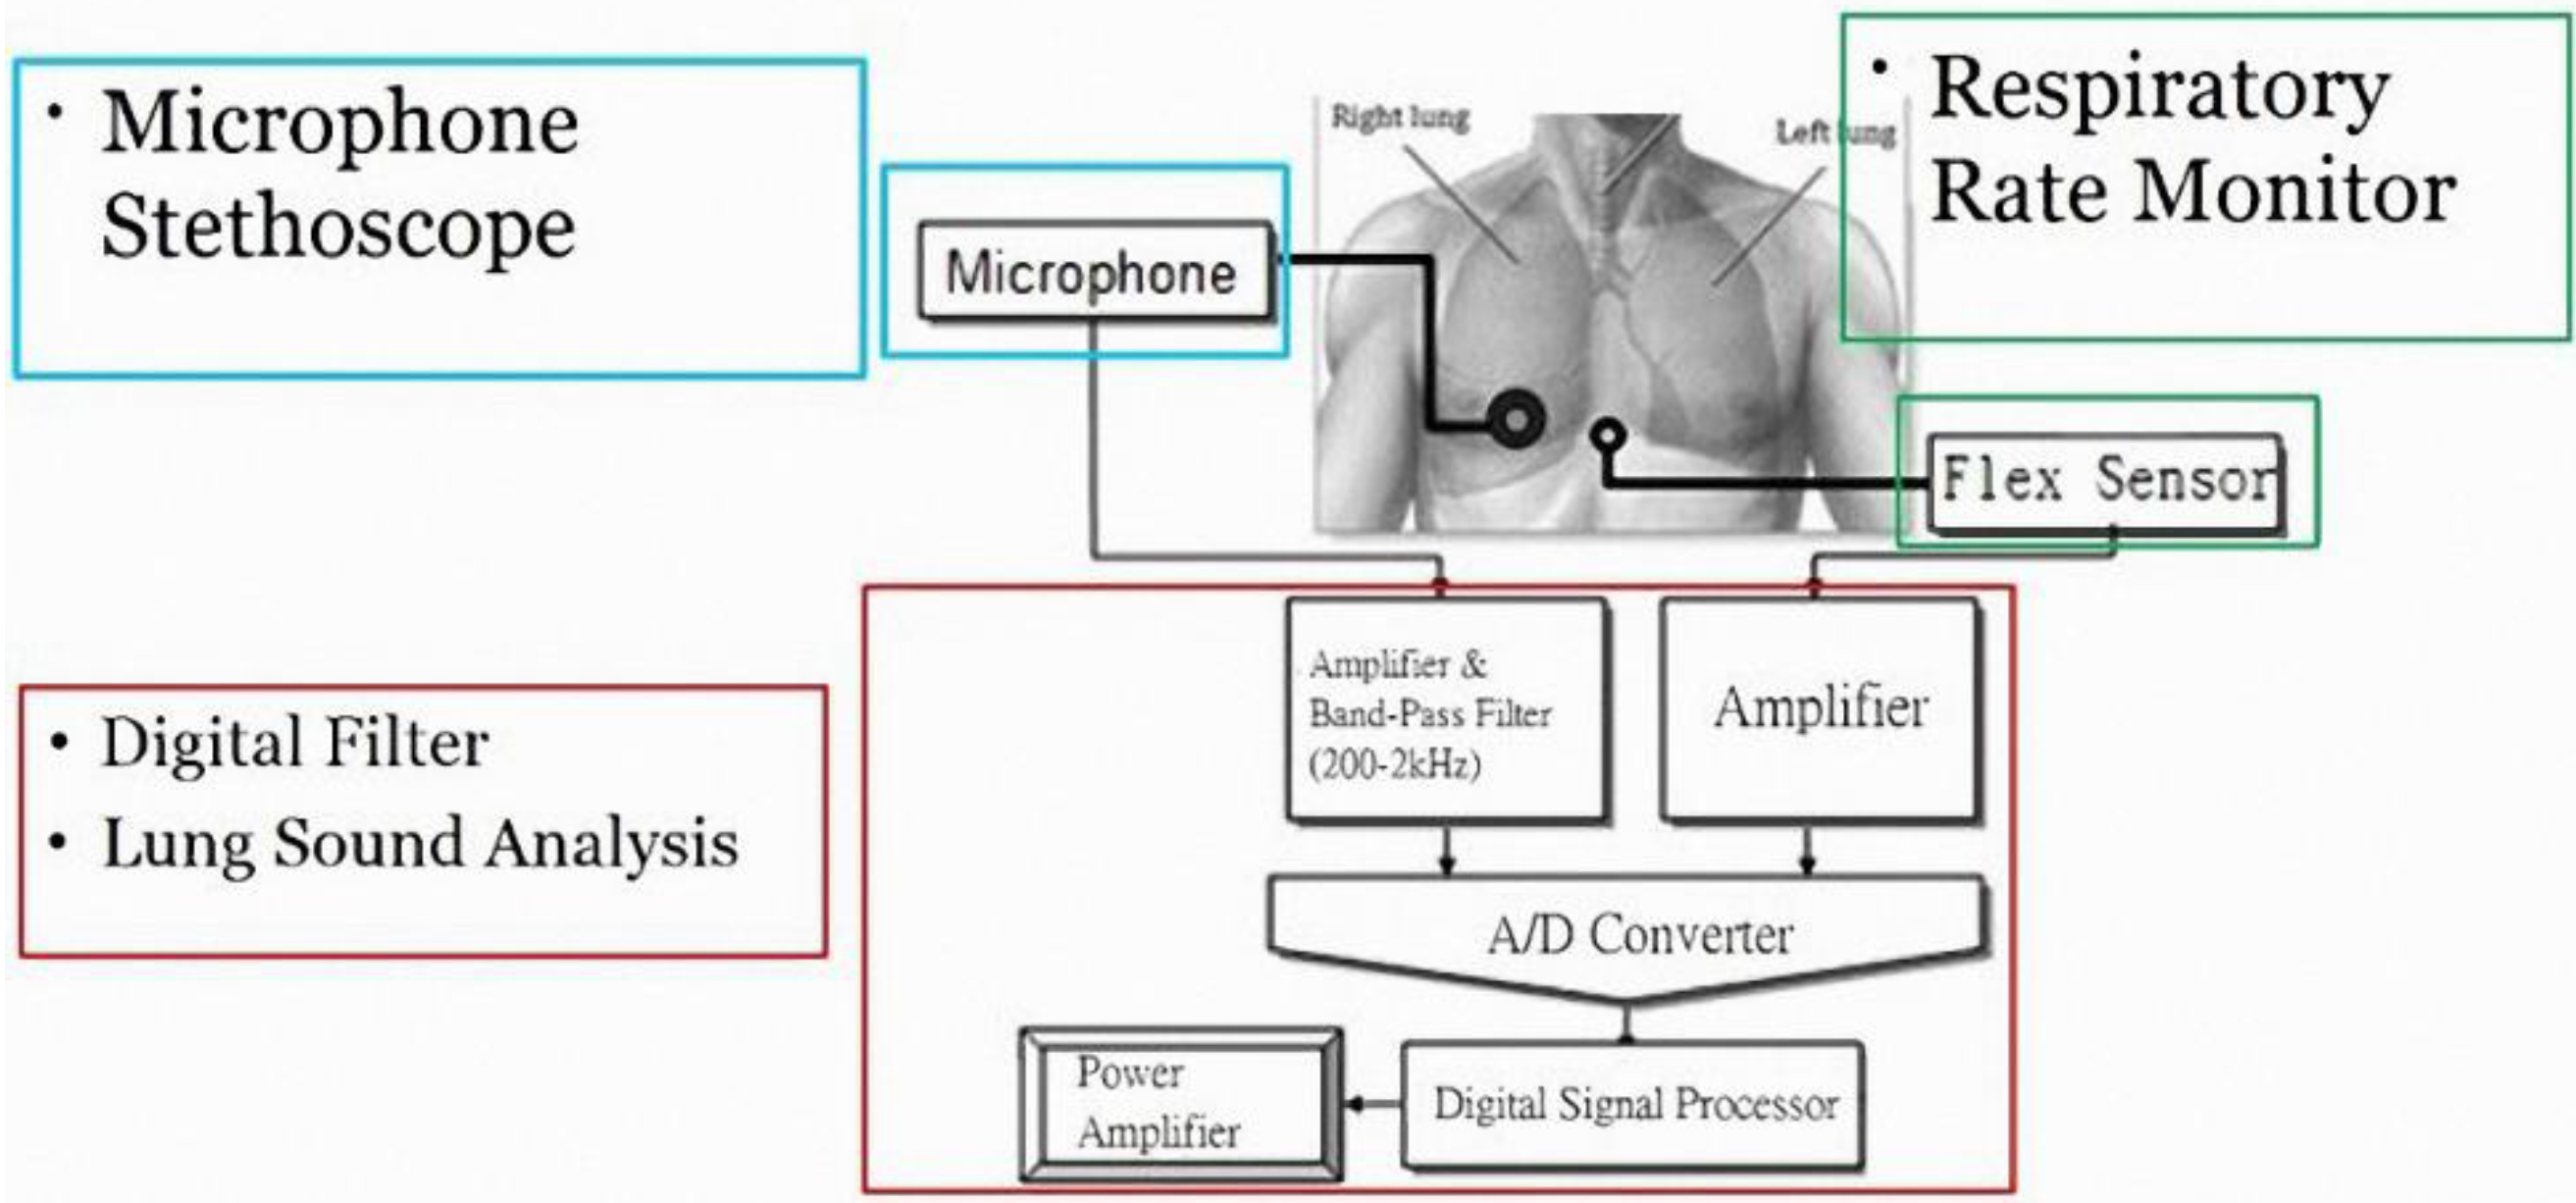
Lung sounds have been widely studied. One report proposed using a PC as a tool for acquisition and analysis, and establishing a user interface for physicians as a diagnostic tool. This hardware used a microphone circuit to sense lung sounds, and a respiratory phase detection circuit detected the breathing state using a thermistor to sense changes in nasal air temperature. The signals were captured by a PC sound card and recorded in the computer [
13]. With regard to signal analysis, an electronic stethoscope has been proposed for the auscultation of heart sounds and lung sounds [
14]. It uses a condenser microphone with an amplifier, band-pass filter circuit, and shift circuit, and a microprocessor to perform the analog-to-digital conversion. Data are transmitted via a RS232 port to a computer and the sound is played back through speakers. The software LabVIEW was used to develop a user interface to display the lung sound diagrams to provide a diagnosis reference for junior physicians. Another study proposed using computer software to establish wavelet transformations for eigenvalue computation and to identify abnormal breath sounds through an artificial neural network (ANN) [
15]. It established a system that could automatically judge relevant symptoms, and its user interface could display the current state of the lung to determine the abnormal lung sounds and symptoms. Another report proposed a digital electronic stethoscope, based on the commercially available digital Walkman [
16]. This is a Walkman with a stethoscope head containing an embedded condenser microphone and amplifying and filtering circuits to store a digital lung sound signal. In this system, methods of analysis including fast Fourier transform (FFT) and power spectral density were used to detect wheeze signals. Another study proposed using mel-frequency cepstral coefficients (MFCCs) to capture lung sound characteristics, and then using dynamic time warping to divide the lung sounds into normal sounds, wheezes, and crackles [
17]. By enhancing lung sound signals, a dual-sensor spectral subtraction algorithm was used to reduce interfering noise in lung sound identification when capturing the characteristics of lung sound signals in this system. Another study proposed using hidden Markov models to establish feature models of the collected lung sounds of emphysema patients and normal lung sounds [
18]. The differences were used to detect whether the abnormal threshold was reached. Other researchers have proposed using neural network (NN) classification technology for lung sound analysis [
19].
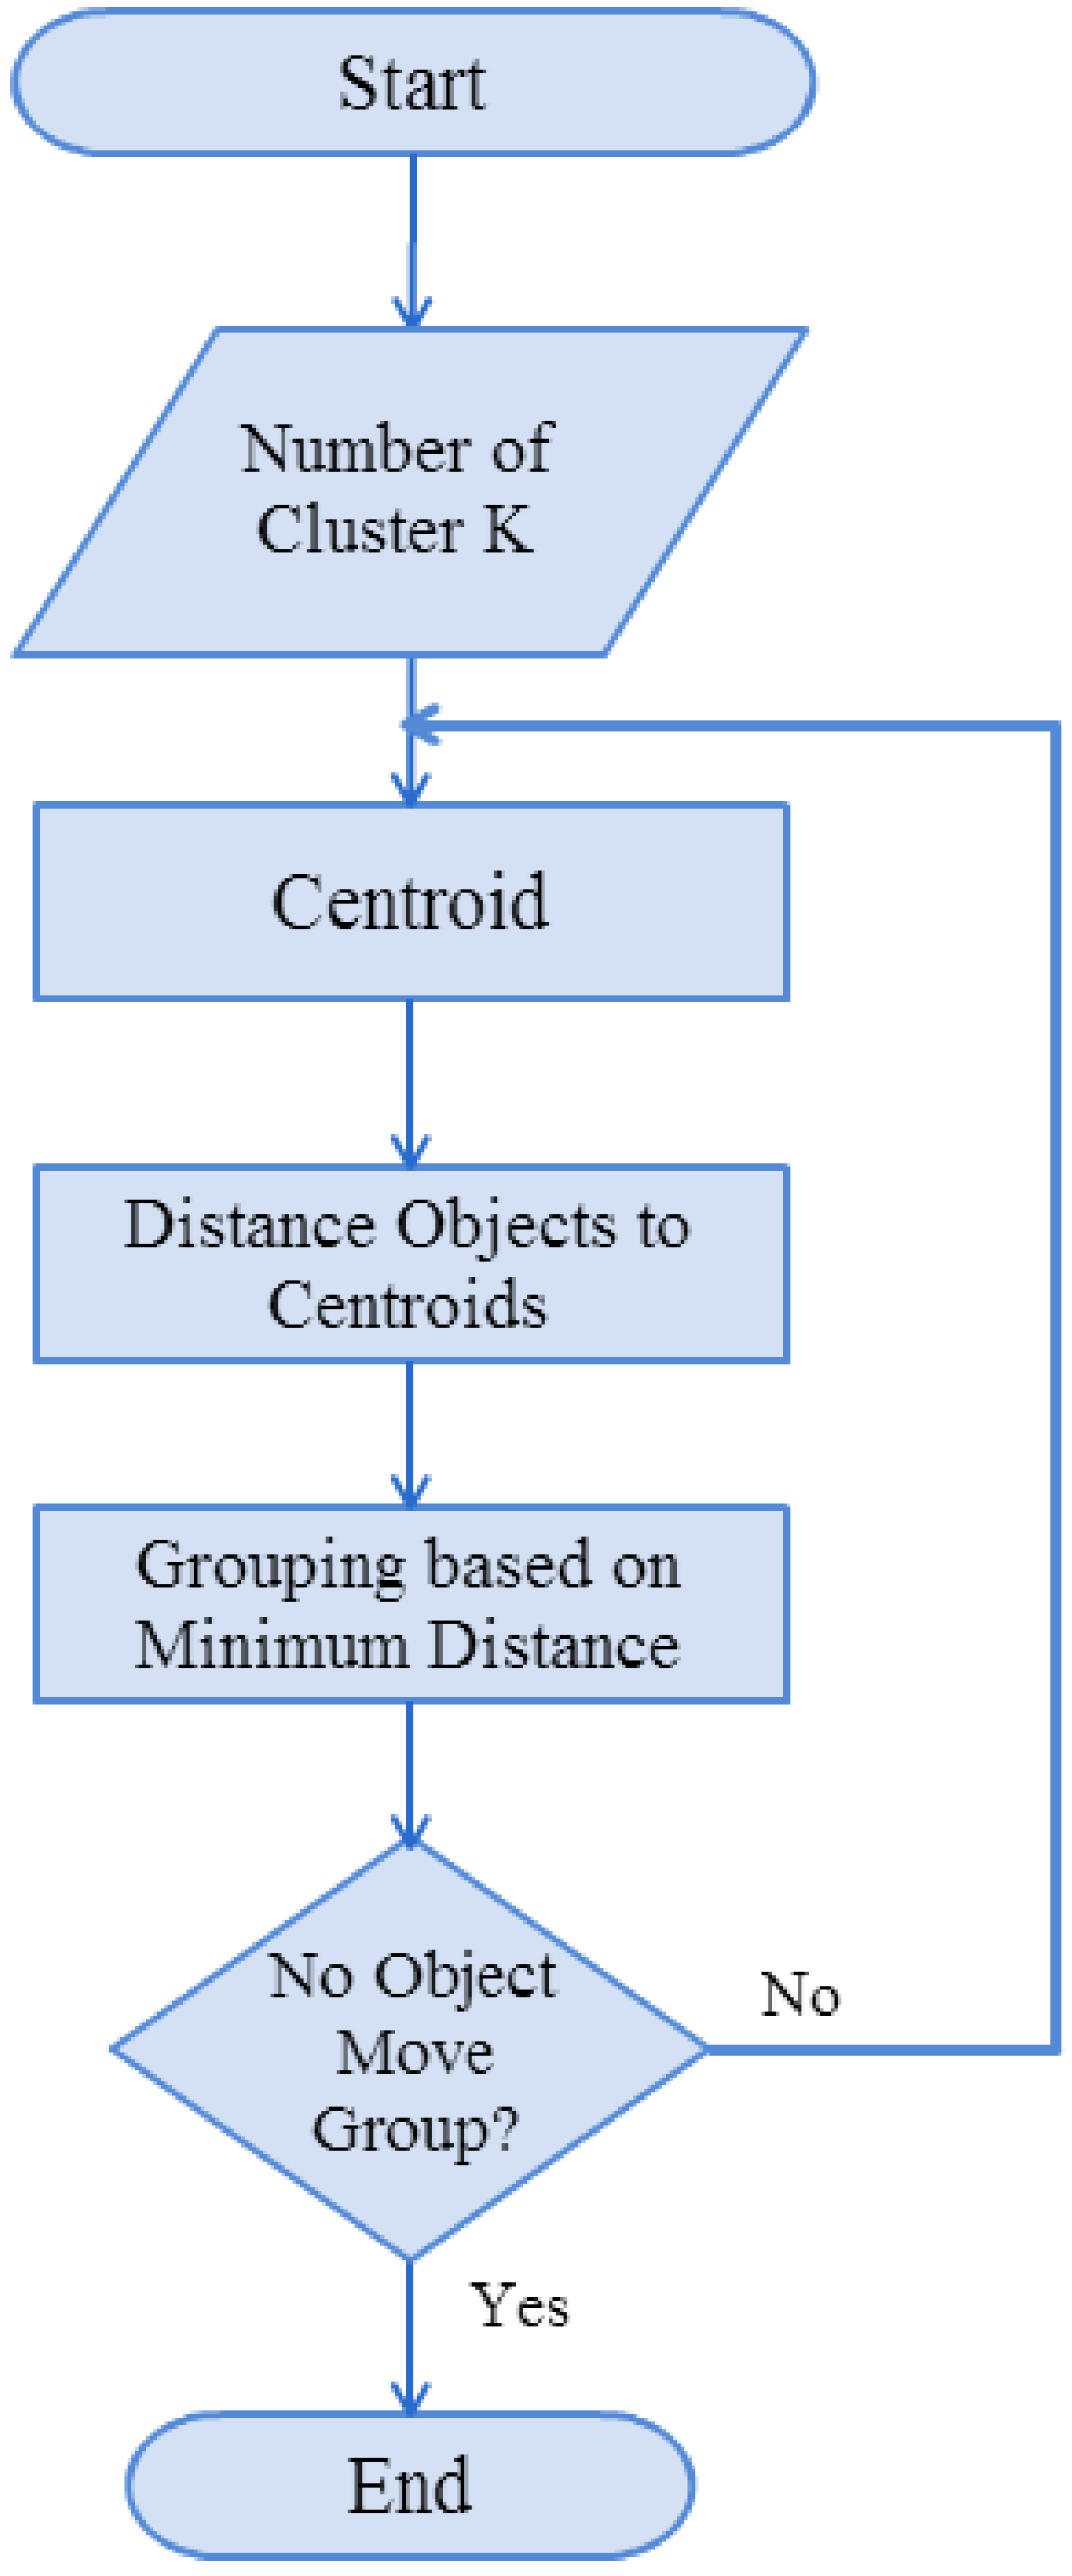
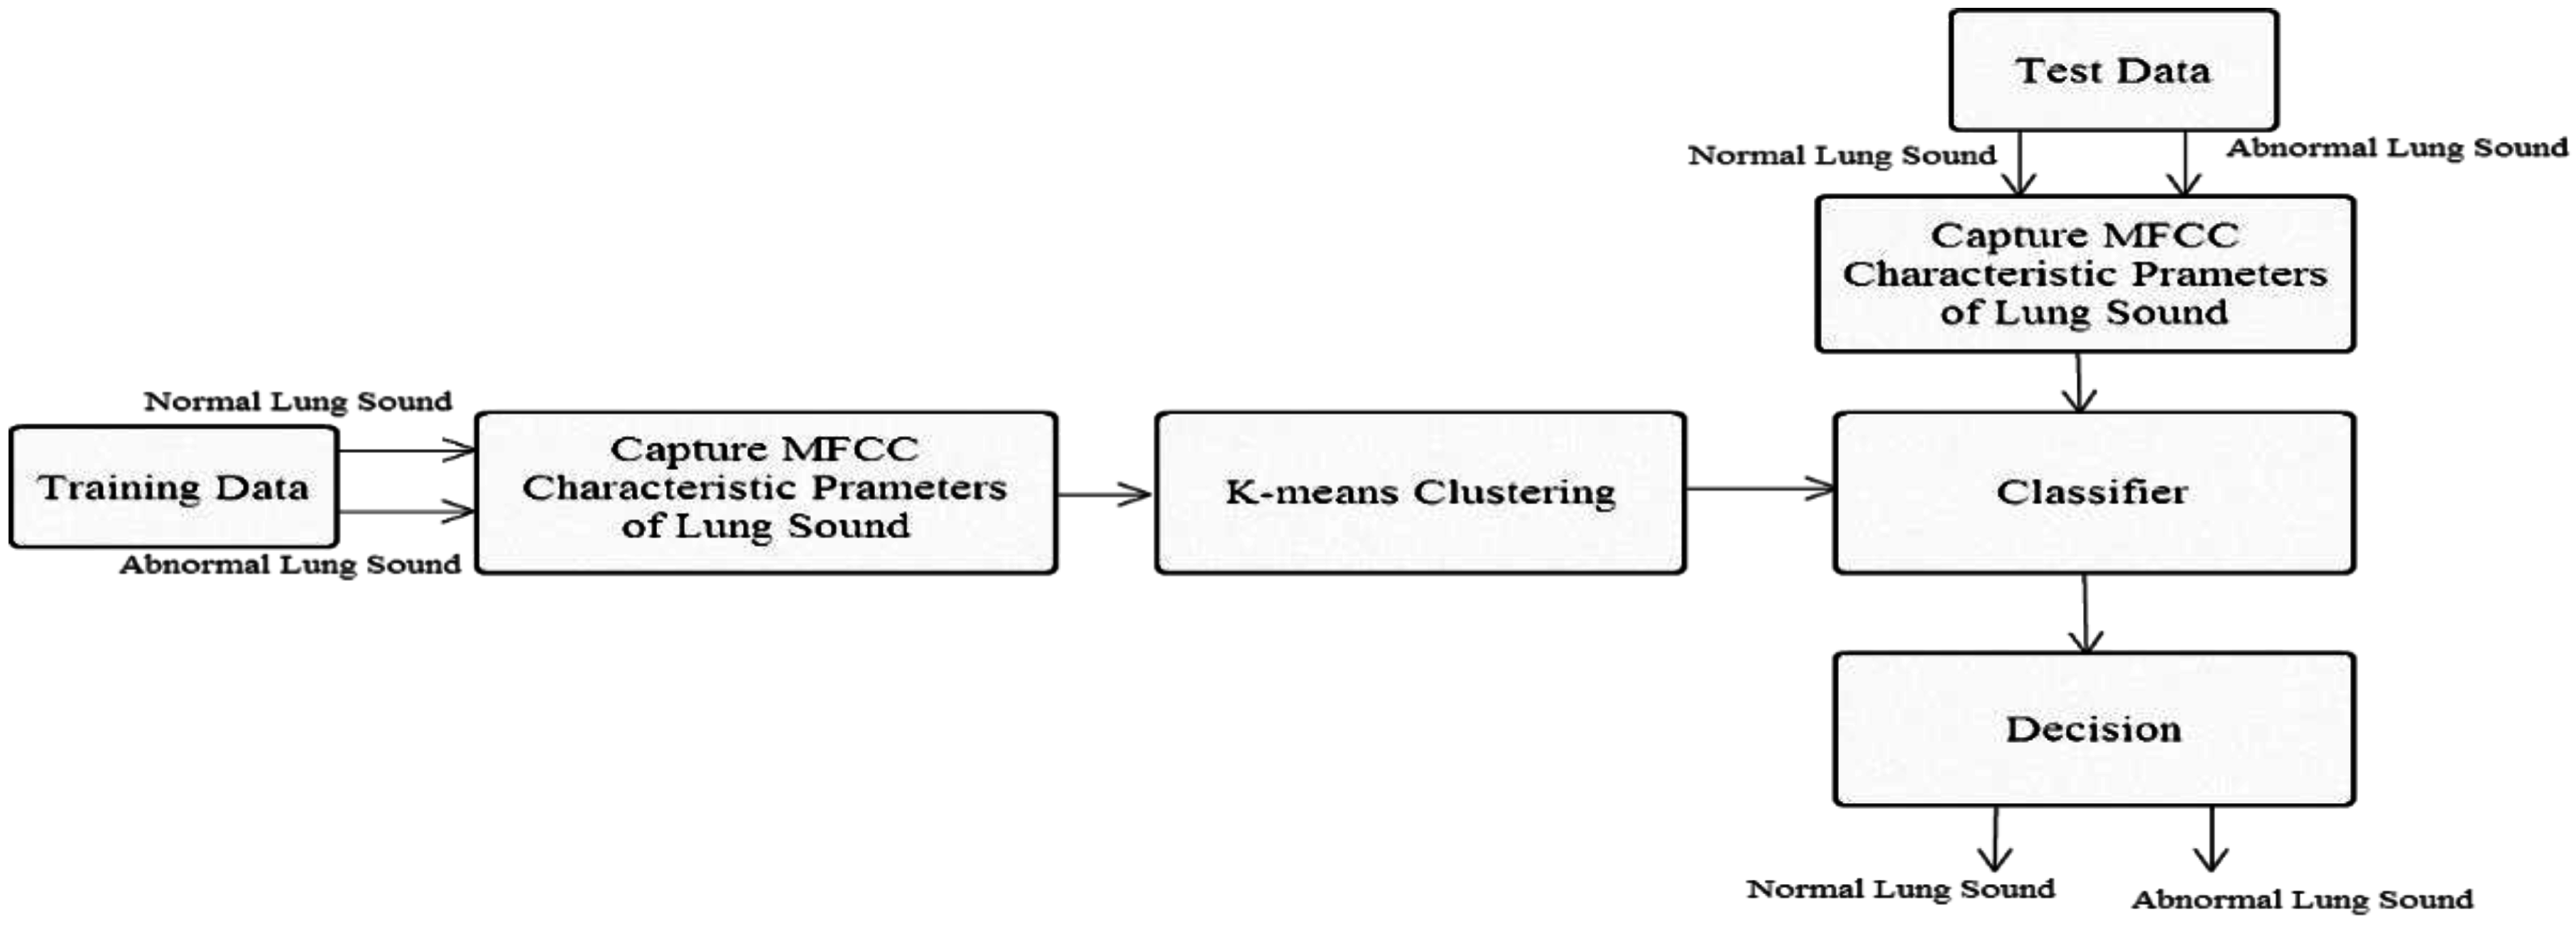
5. Conclusions
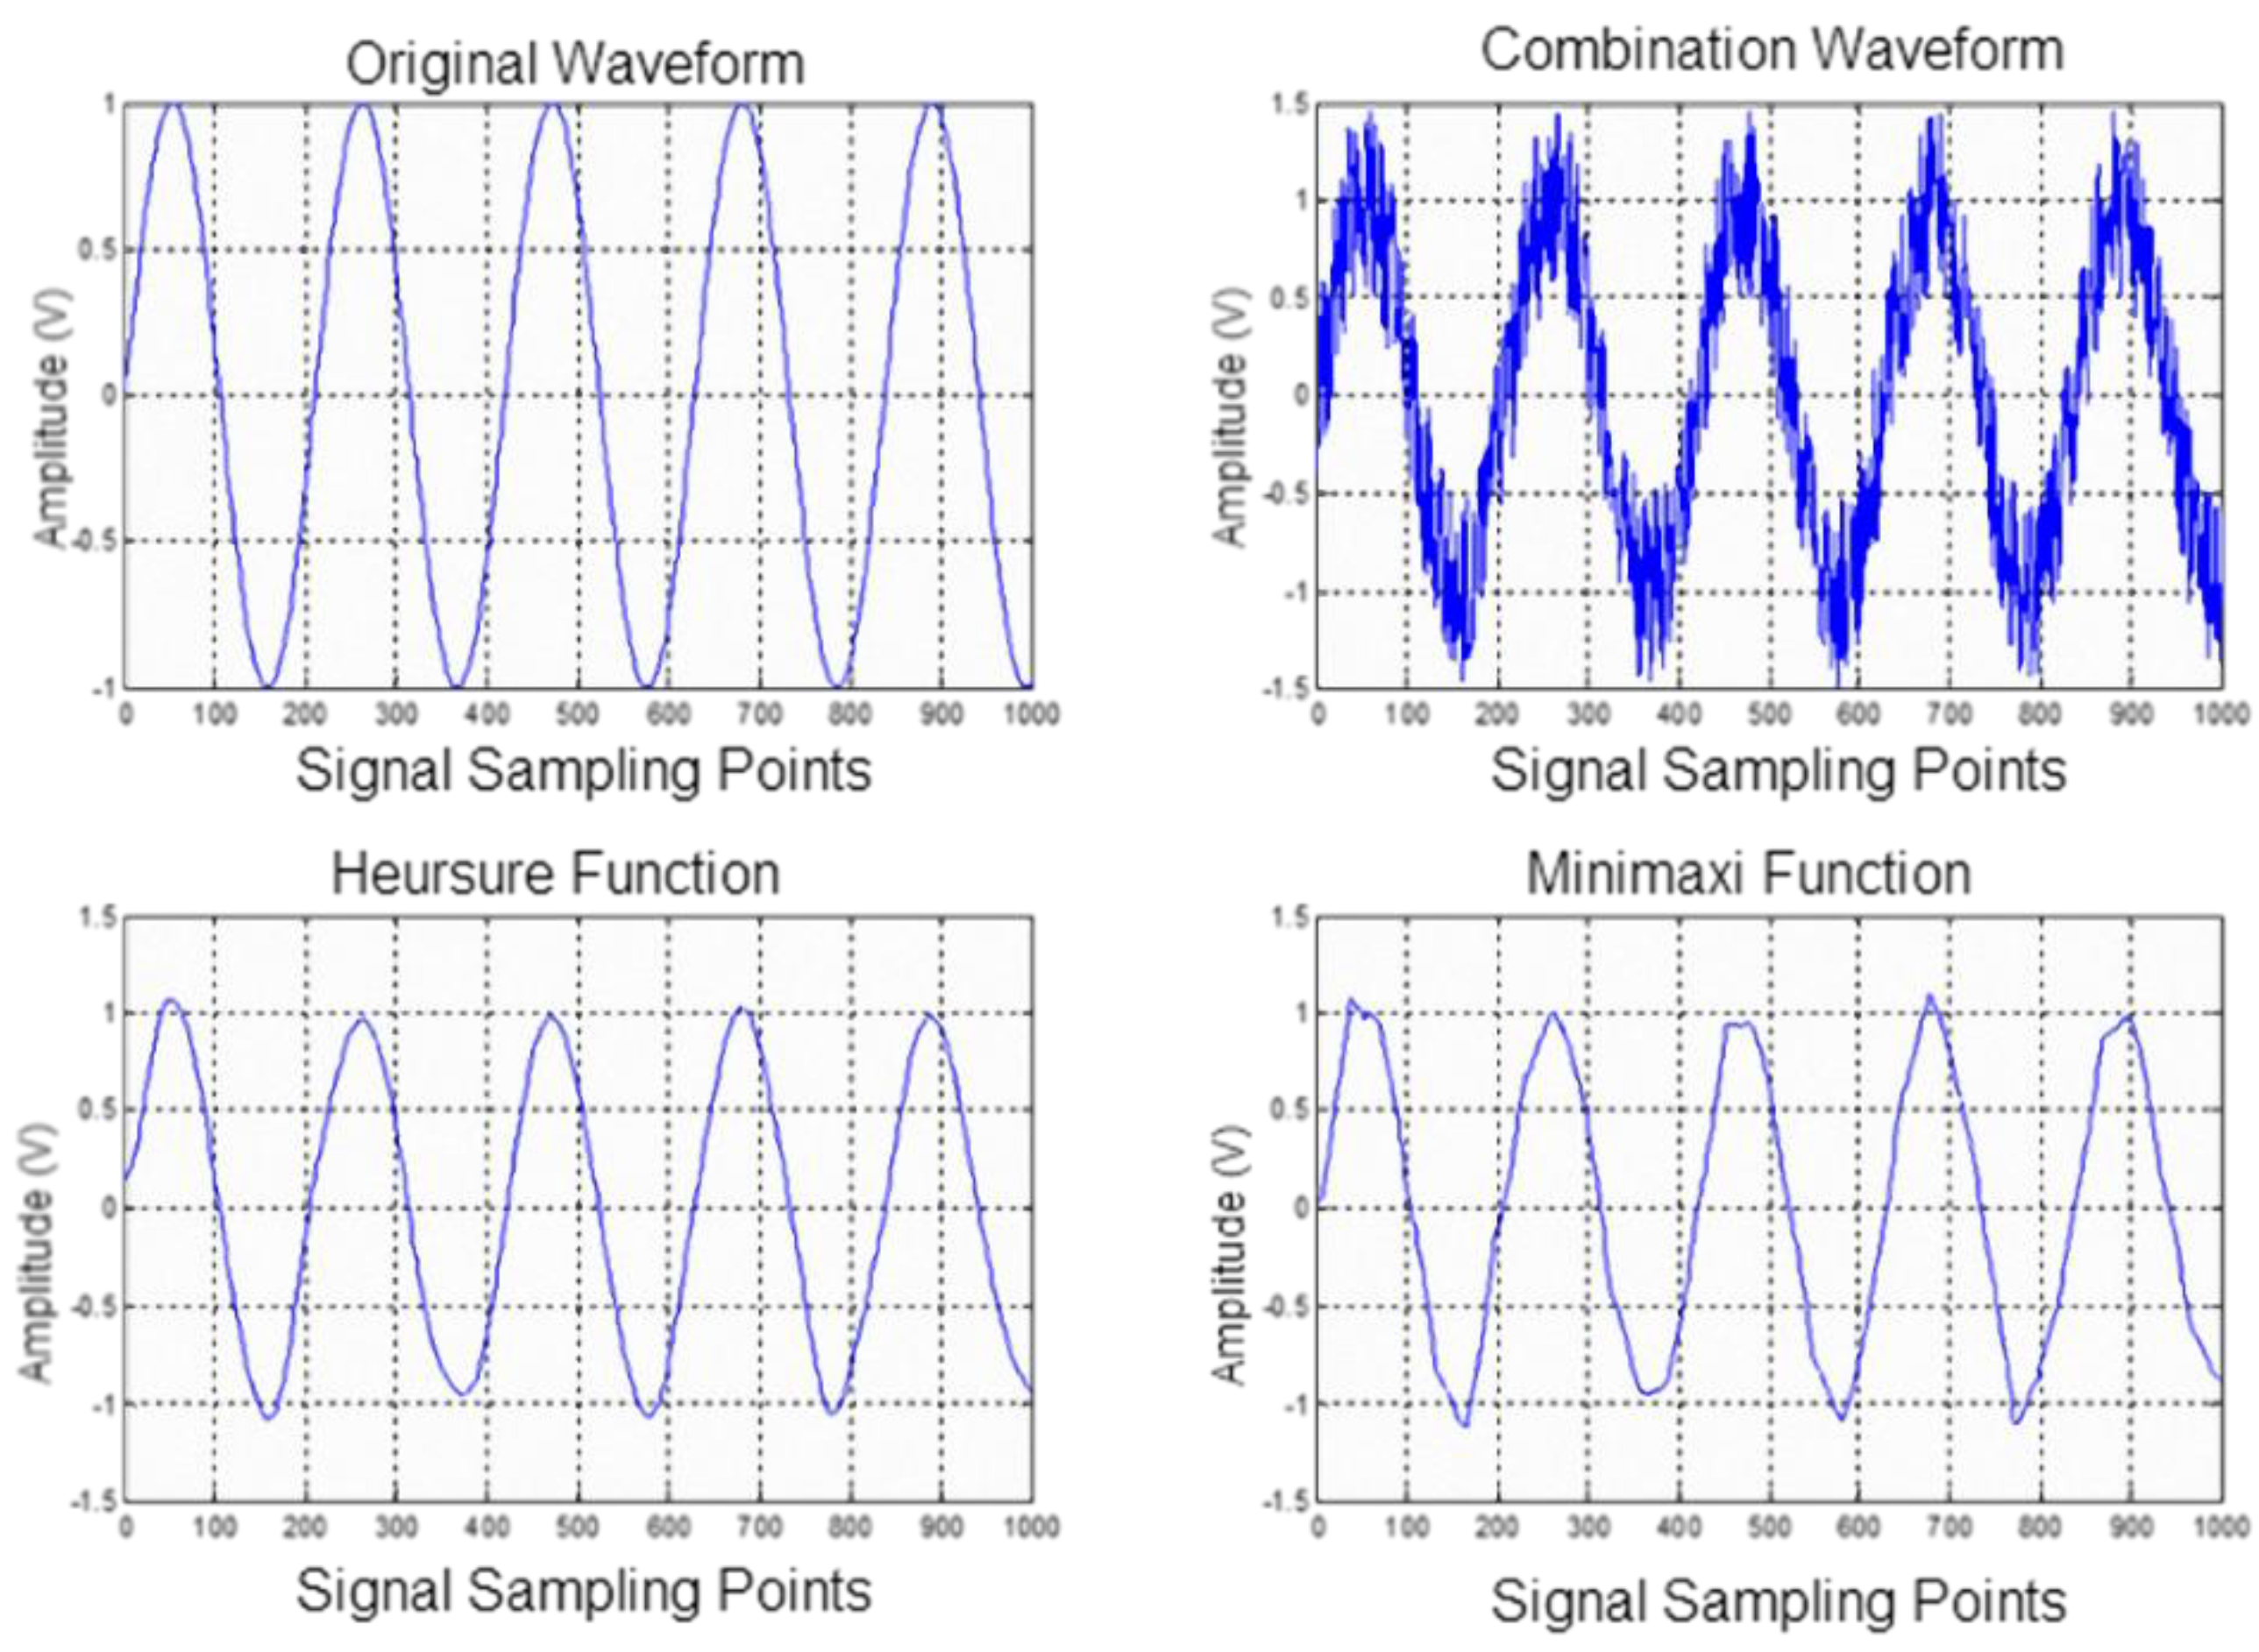
In this study, we used mel-frequency cepstral coefficients (MFCCs) to capture lung sound signal characteristic parameters, along with the K-means algorithm and nearest-neighbor classification (Kth nearest neighbor), to establish a stethoscope system for detecting abnormal lung sounds (crackles, wheezes, and rhonchi). Based on the experimental results, MFCC combined with the K-means algorithm was successfully able to identify lung sounds. In an ideal noiseless environment, the proposed system’s training data identification rate can be as high as 100%. The average identification rate of lung sound signals mixed with 20 dB white Gaussian noise was 92.25%., which is an improvement of ~8.6% compared with the results reported in [
19], and ~16% compared with the results reported in [
17]. We used a condenser microphone to modify a stethoscope. The difference in error rates between the proposed system and the commercially available 3M Littmann 3200 Bluetooth electronic stethoscope [
26] (
Table 9) was 4.4%. Then, compared with existing auscultation systems, our proposed system has the advantages, recording time, capturing function, and simple diagnosis, as shown in the results of
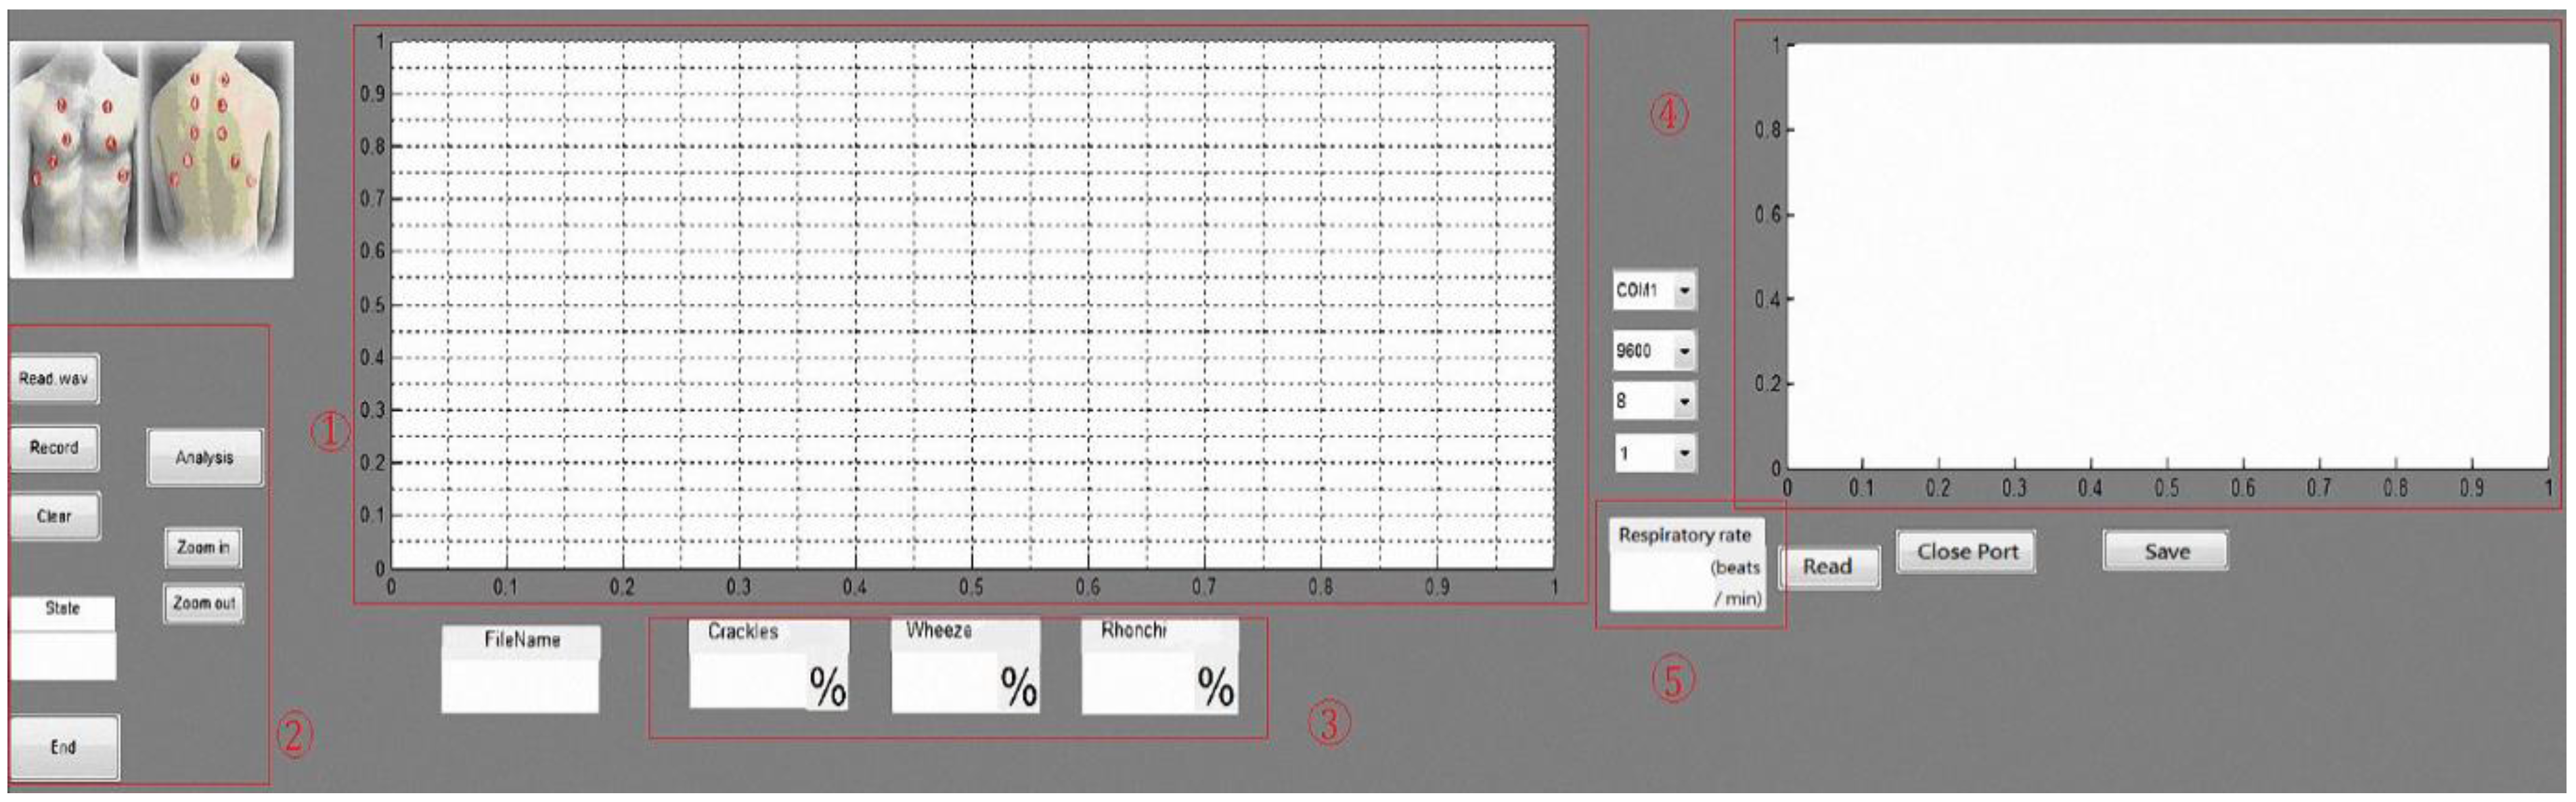
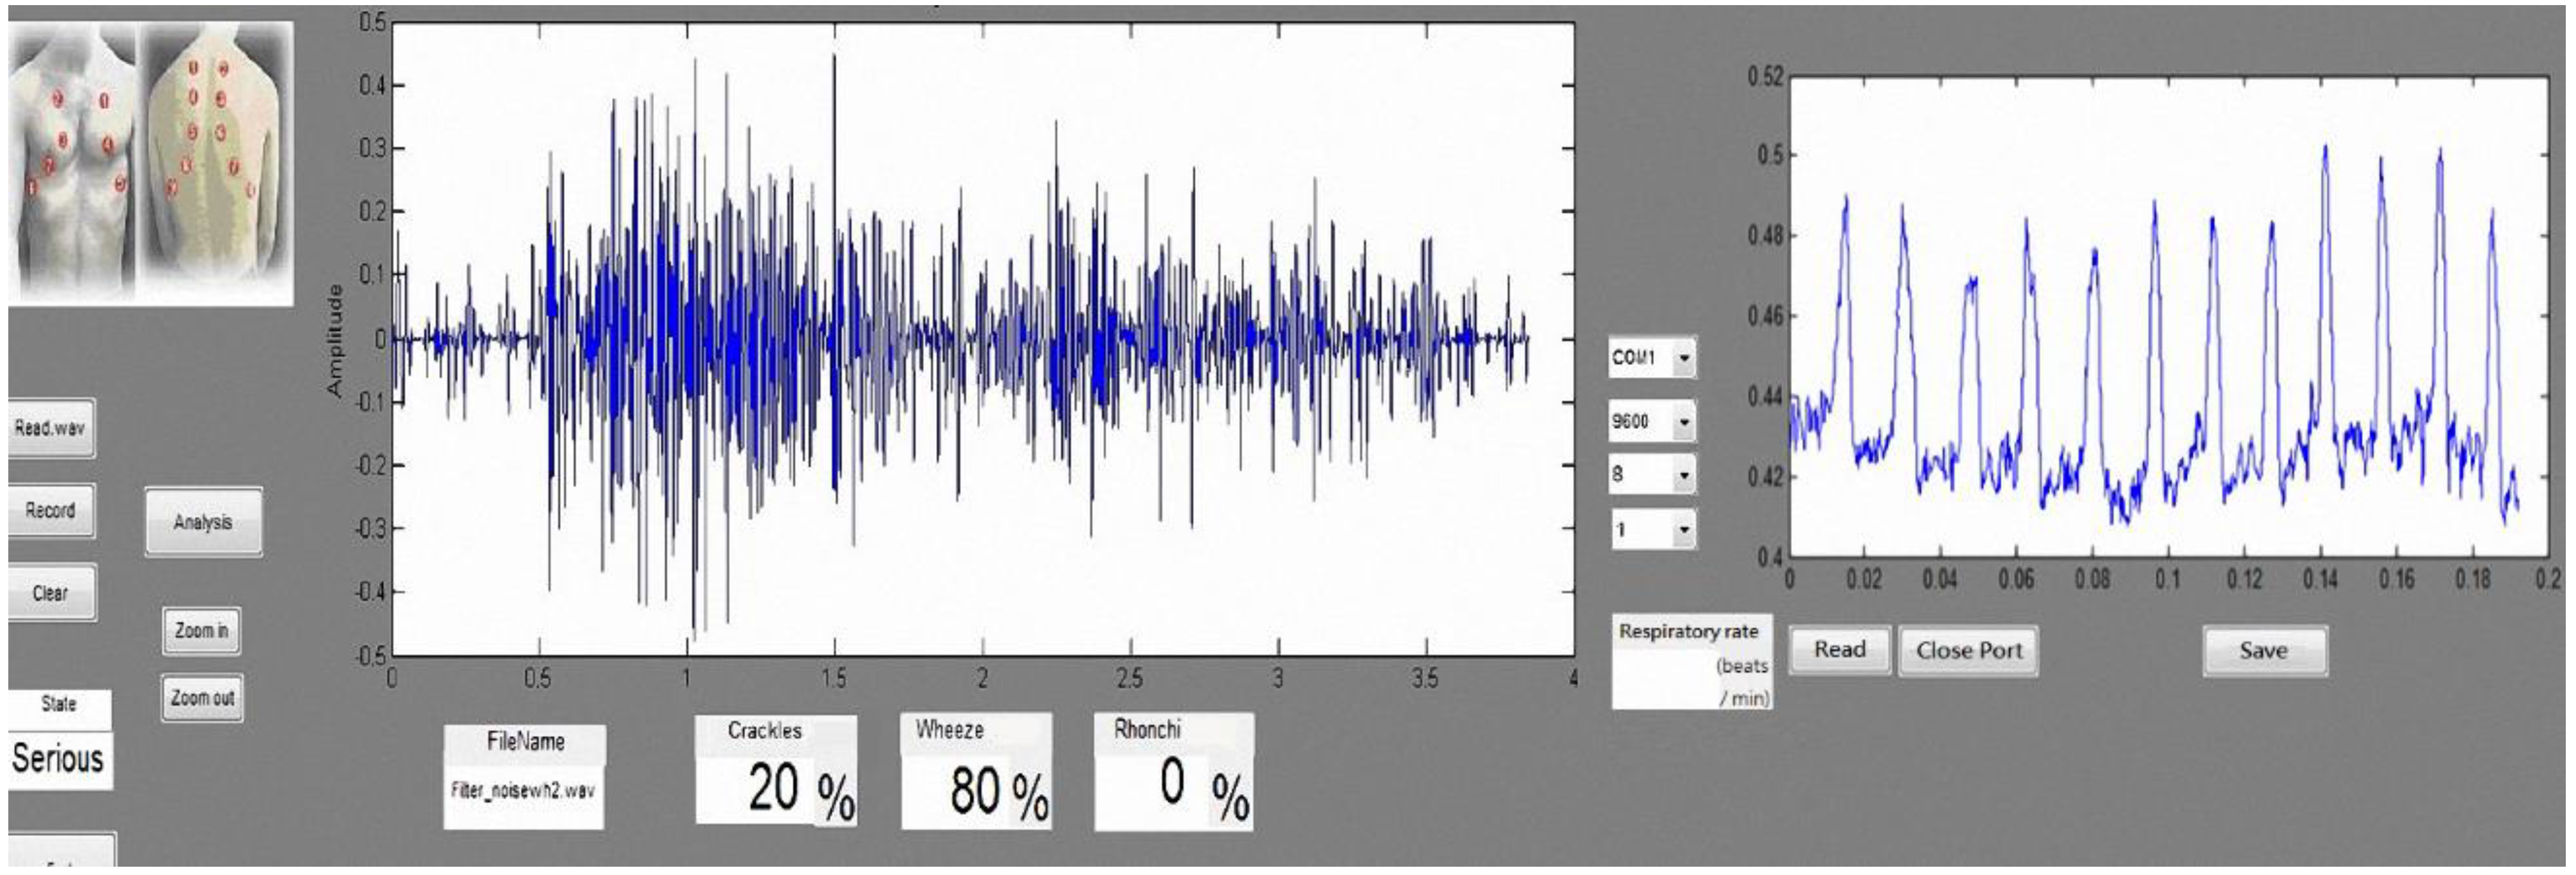
Table 15. Hence, our proposed system can be used for home diagnosis, because it provides lung sound signal sound frame identification results to grade lung sounds (Good, Warning, Bad, Serious). If lung sounds are classified as Warning (abnormal lung sounds accounting for 30% of signals), the system sends a warning message to the user to seek medical advice.
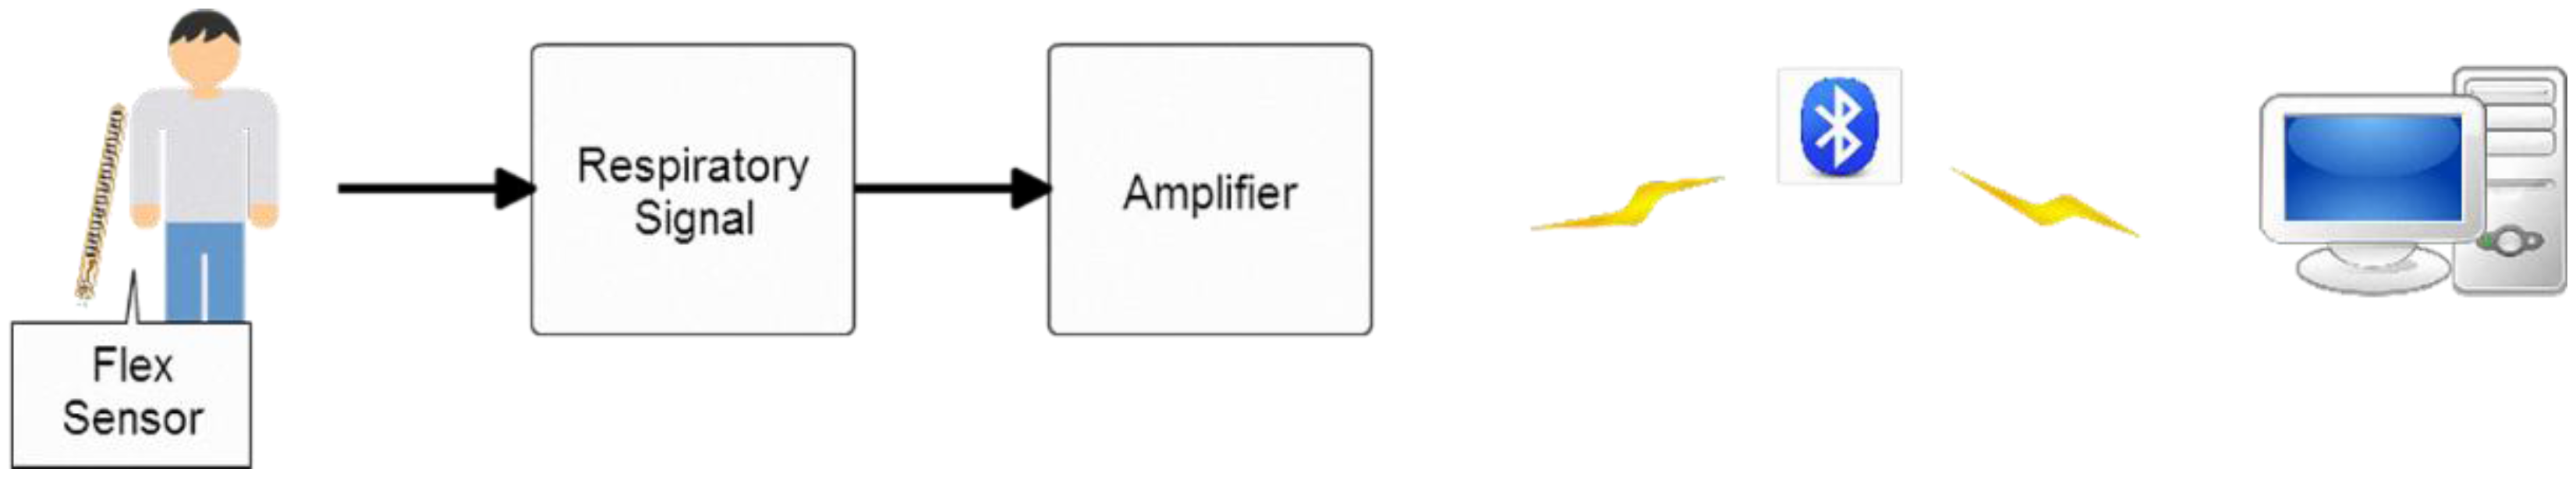
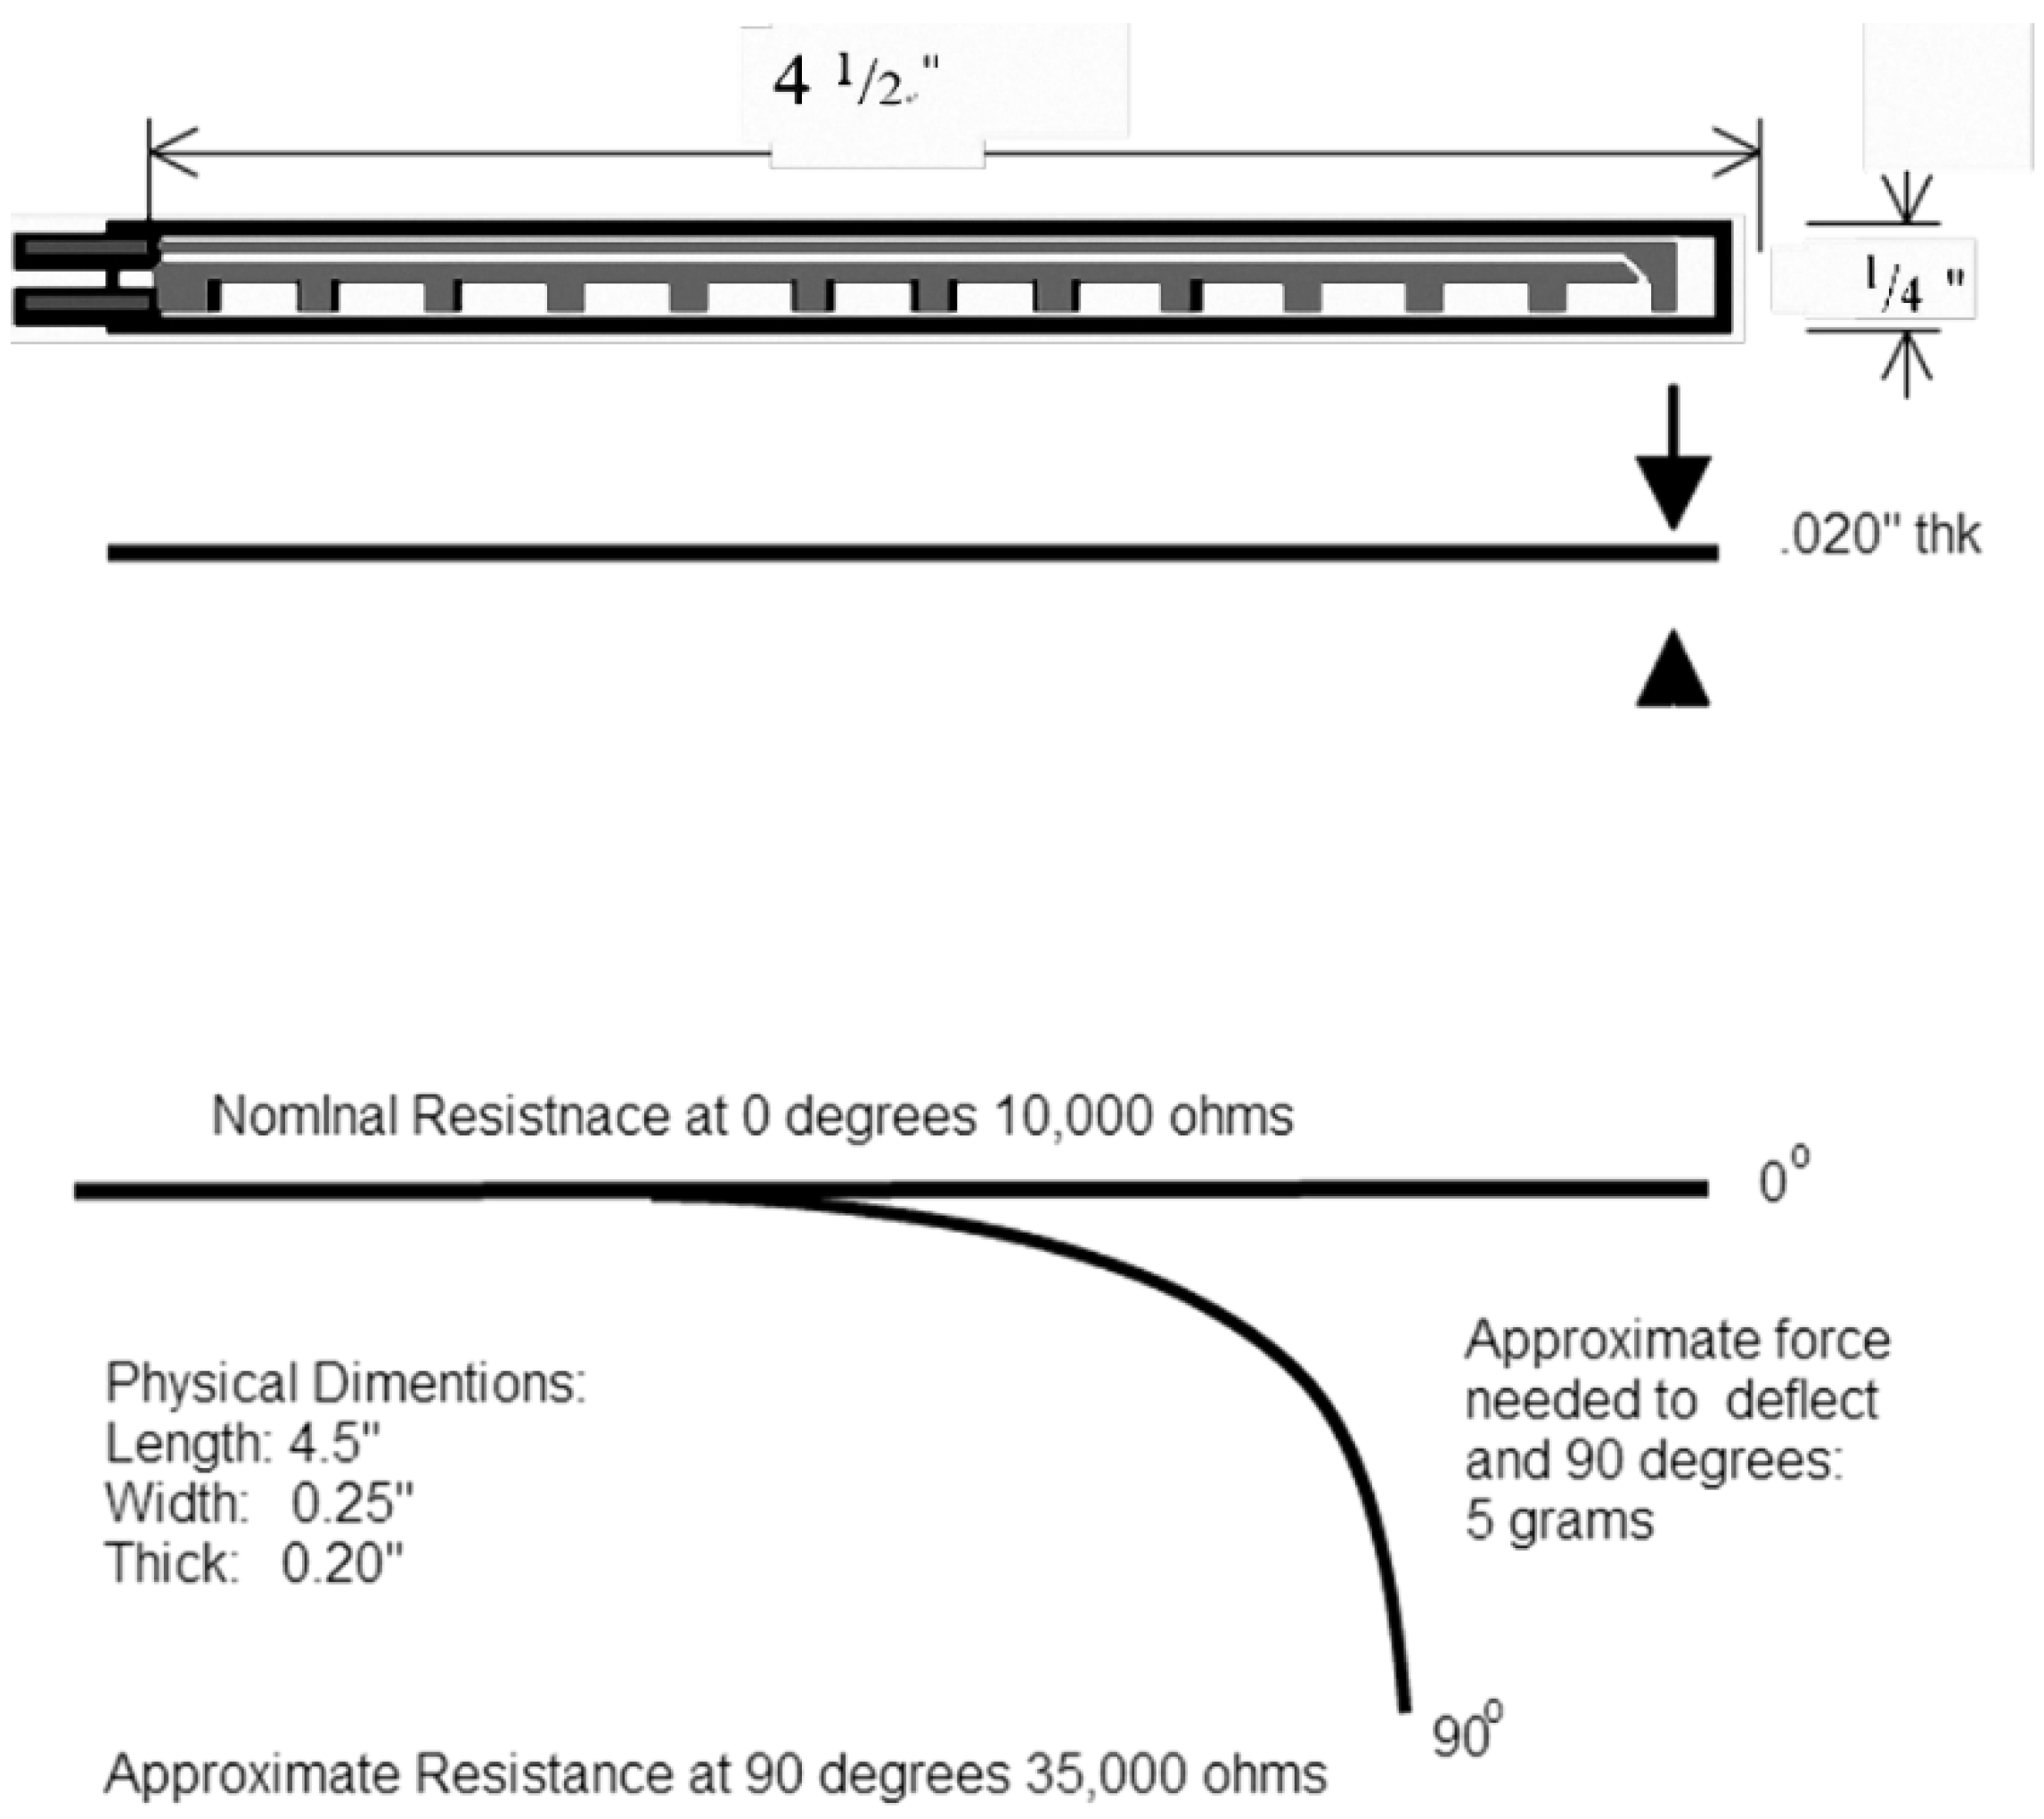
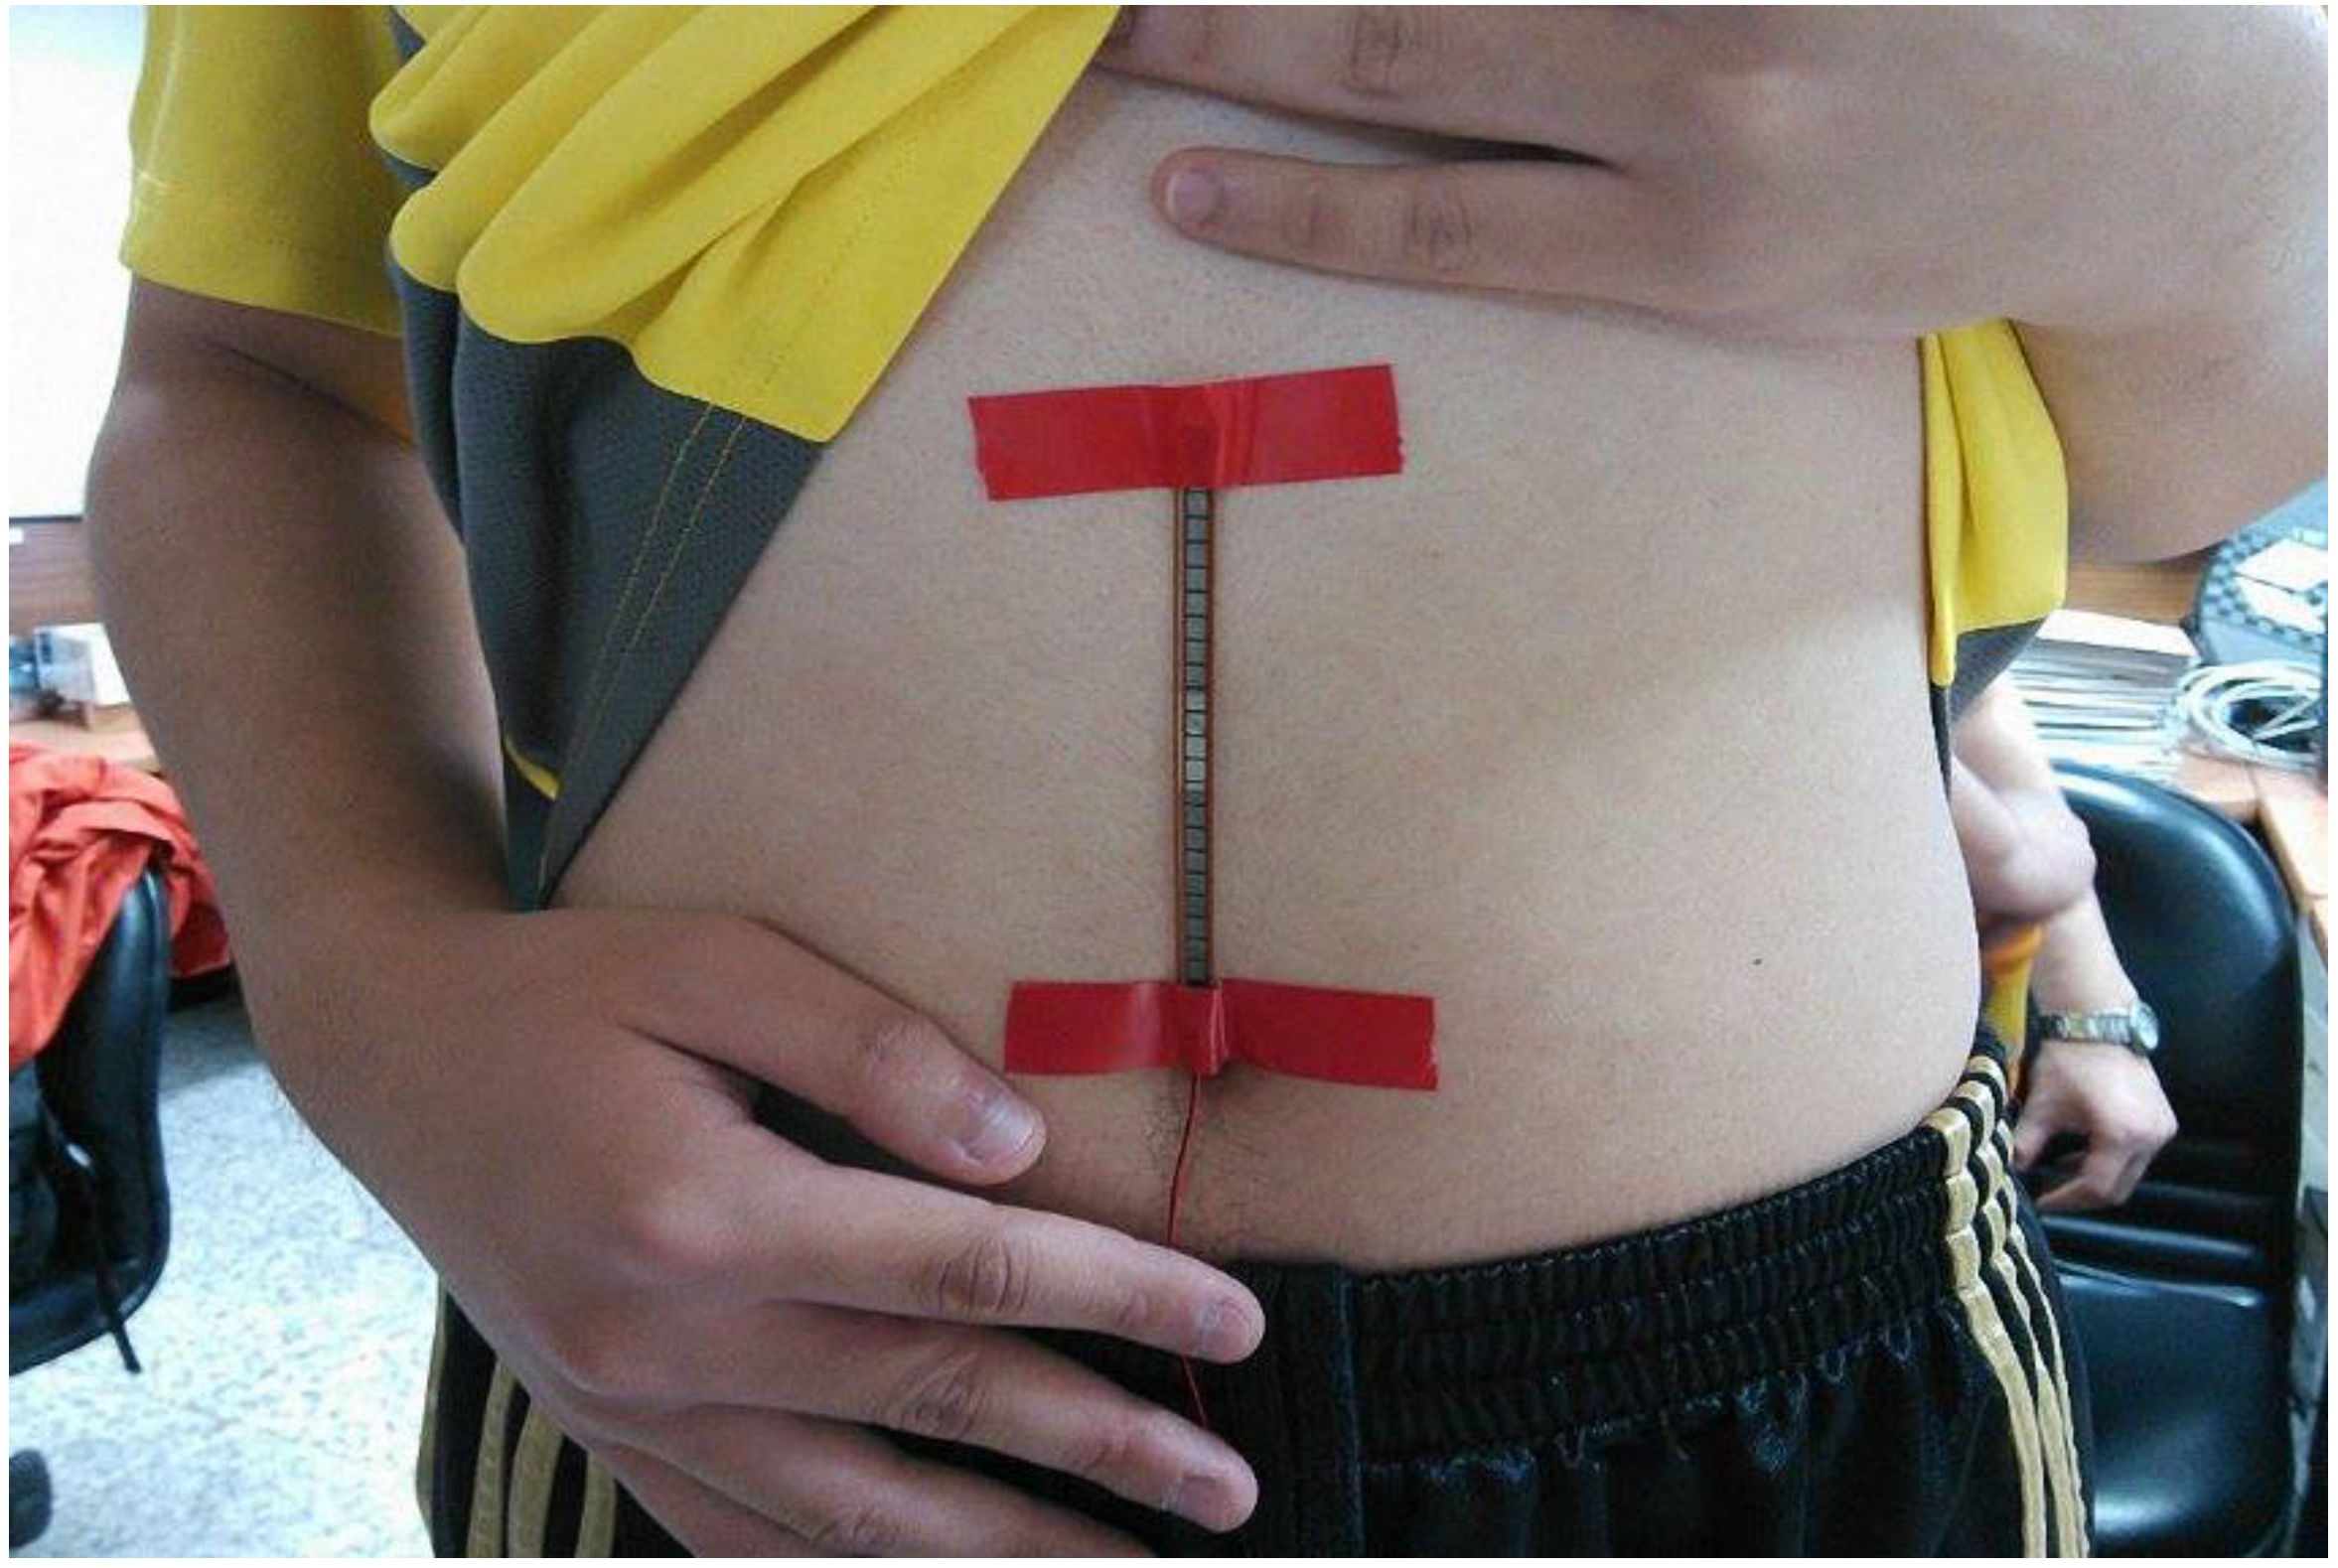
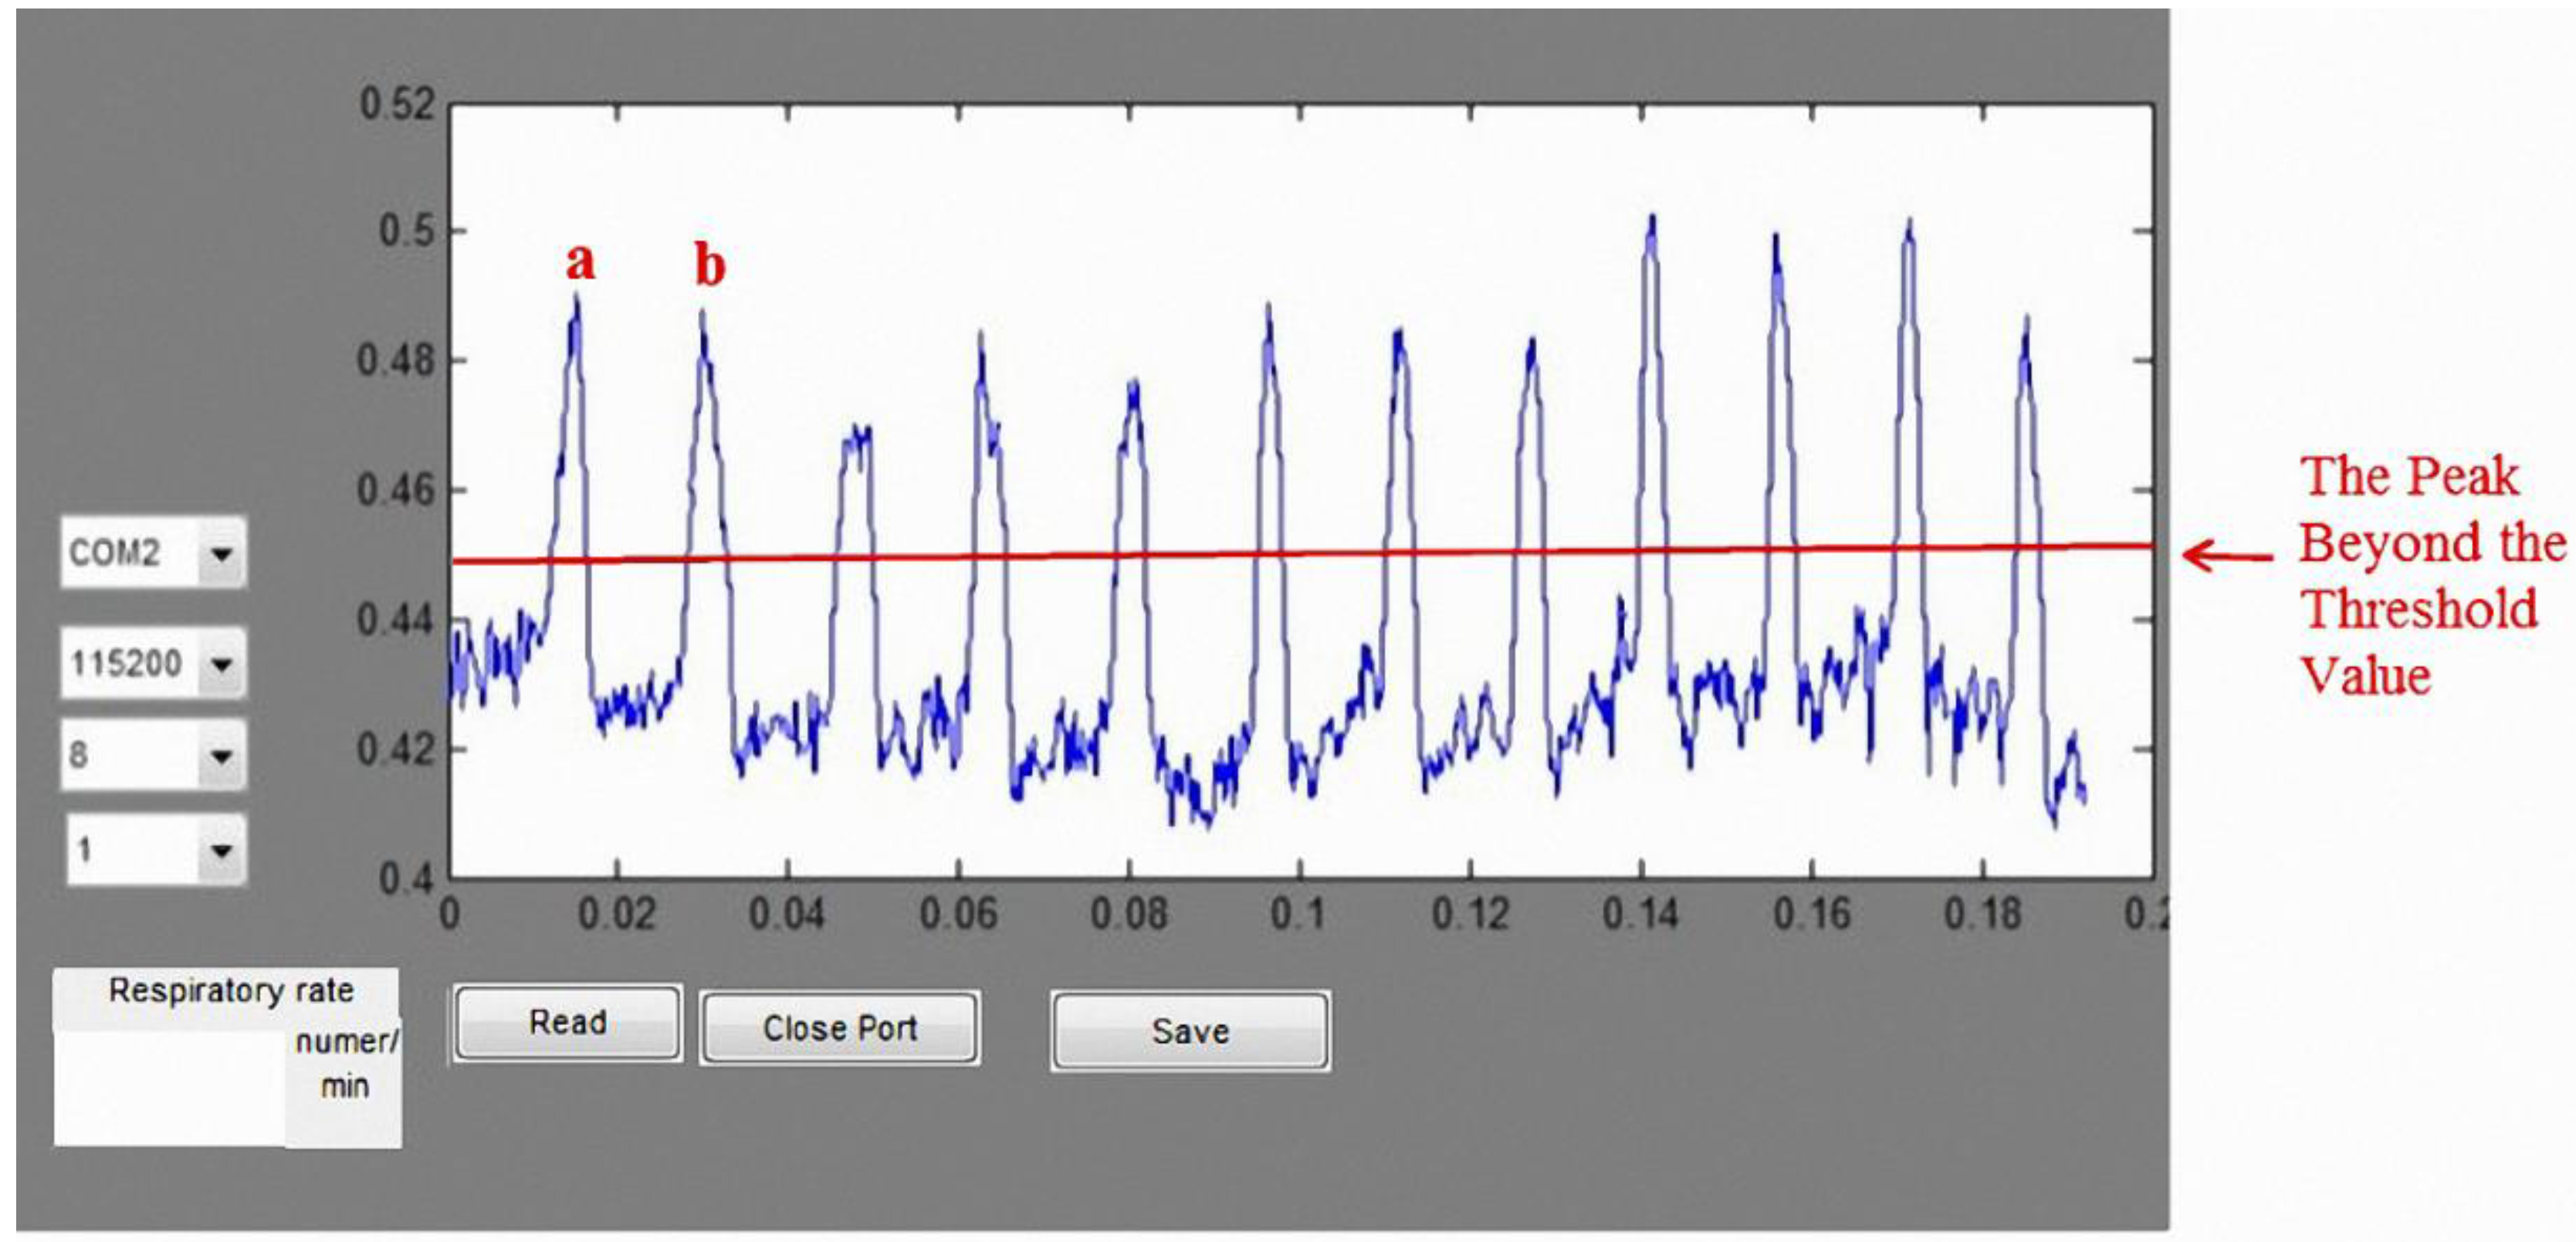
We also designed a bending-type sensor to detect the respiratory state of the subject. According to the benchmark of mean absolute percentage error (MAPE), as proposed in [
27], the proposed respiratory detection function is highly accurate: the error was ~6.8%. Data are transmitted to the computer through Bluetooth, where the respiratory cycle (times/min) is computed for real-time detection. The average respiratory rate of an adult is 12–20 times/min [
30]. Using the normal respiratory rate as a threshold, the system sends a warning to the user when it detects an abnormal respiratory cycle in an asthma patient. Together, these results confirm that the proposed lung sound abnormal diagnosis system and wireless respiratory detection system can help clinicians diagnose lung problems in patients.


