
Characterization of Wheat Varieties Using Terahertz Time-Domain Spectroscopy

Abstract
:
1. Introduction
2. Materials and Methods
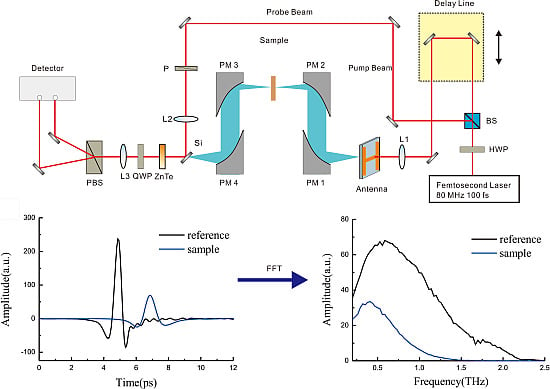
2.1. Experimental Setup
2.2. Sample Preparation

| No. | Wheat Variety | Bulk Density (g/L) | Crude Protein Content (%) | Water Content (%) | Imperfect Grain (%) | Gluten Content (%) |
|---|---|---|---|---|---|---|
| 1 | Zhengmai 9023 | 756 | 14.6 | 12.5 | 3.2 | 27.9 |
| 2 | Zhouyuan 9369 | 790 | 14.9 | 12.5 | 3.4 | 33.0 |
| 3 | Aobiao | 845 | 14.0 | 11.5 | 1.0 | 26.0 |
| 4 | DNS | 840 | 14.5 | 11.9 | 1.6 | 38.0 |
| 5 | Jiamai | 830 | 13.8 | 12.2 | 1.8 | 39.0 |
| 6 | Jinan 17 wheat | 773 | 15.6 | 11.5 | 3.0 | 34.0 |
| 7 | Zhoumai 27 | 798 | 13.2 | 12.1 | 3.8 | 33.0 |
| 8 | Yunong 416 | 787 | 14.3 | 12.5 | 4.0 | 32.5 |
2.3. Chemometrics Methods
3. Results and Discussion
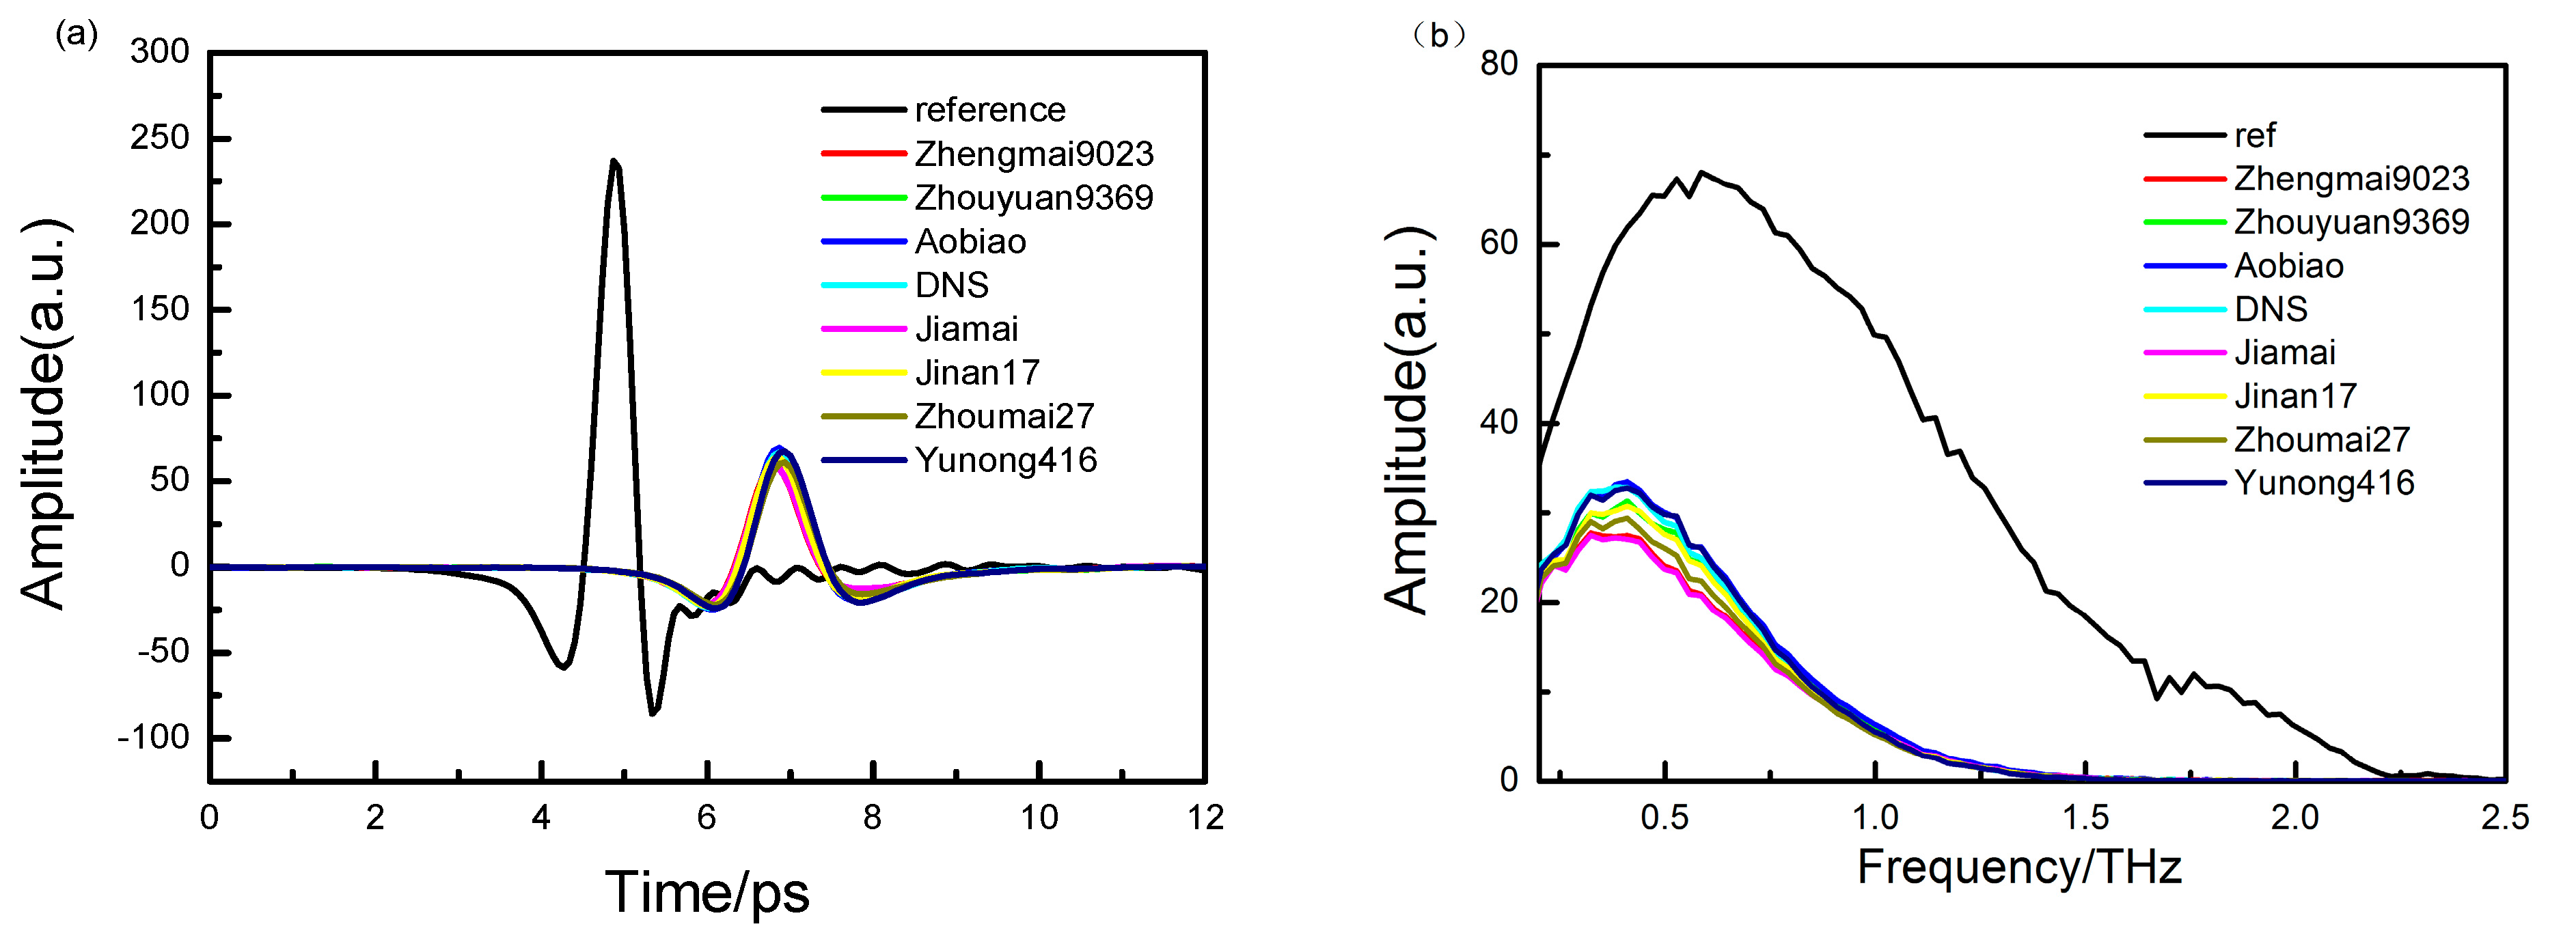
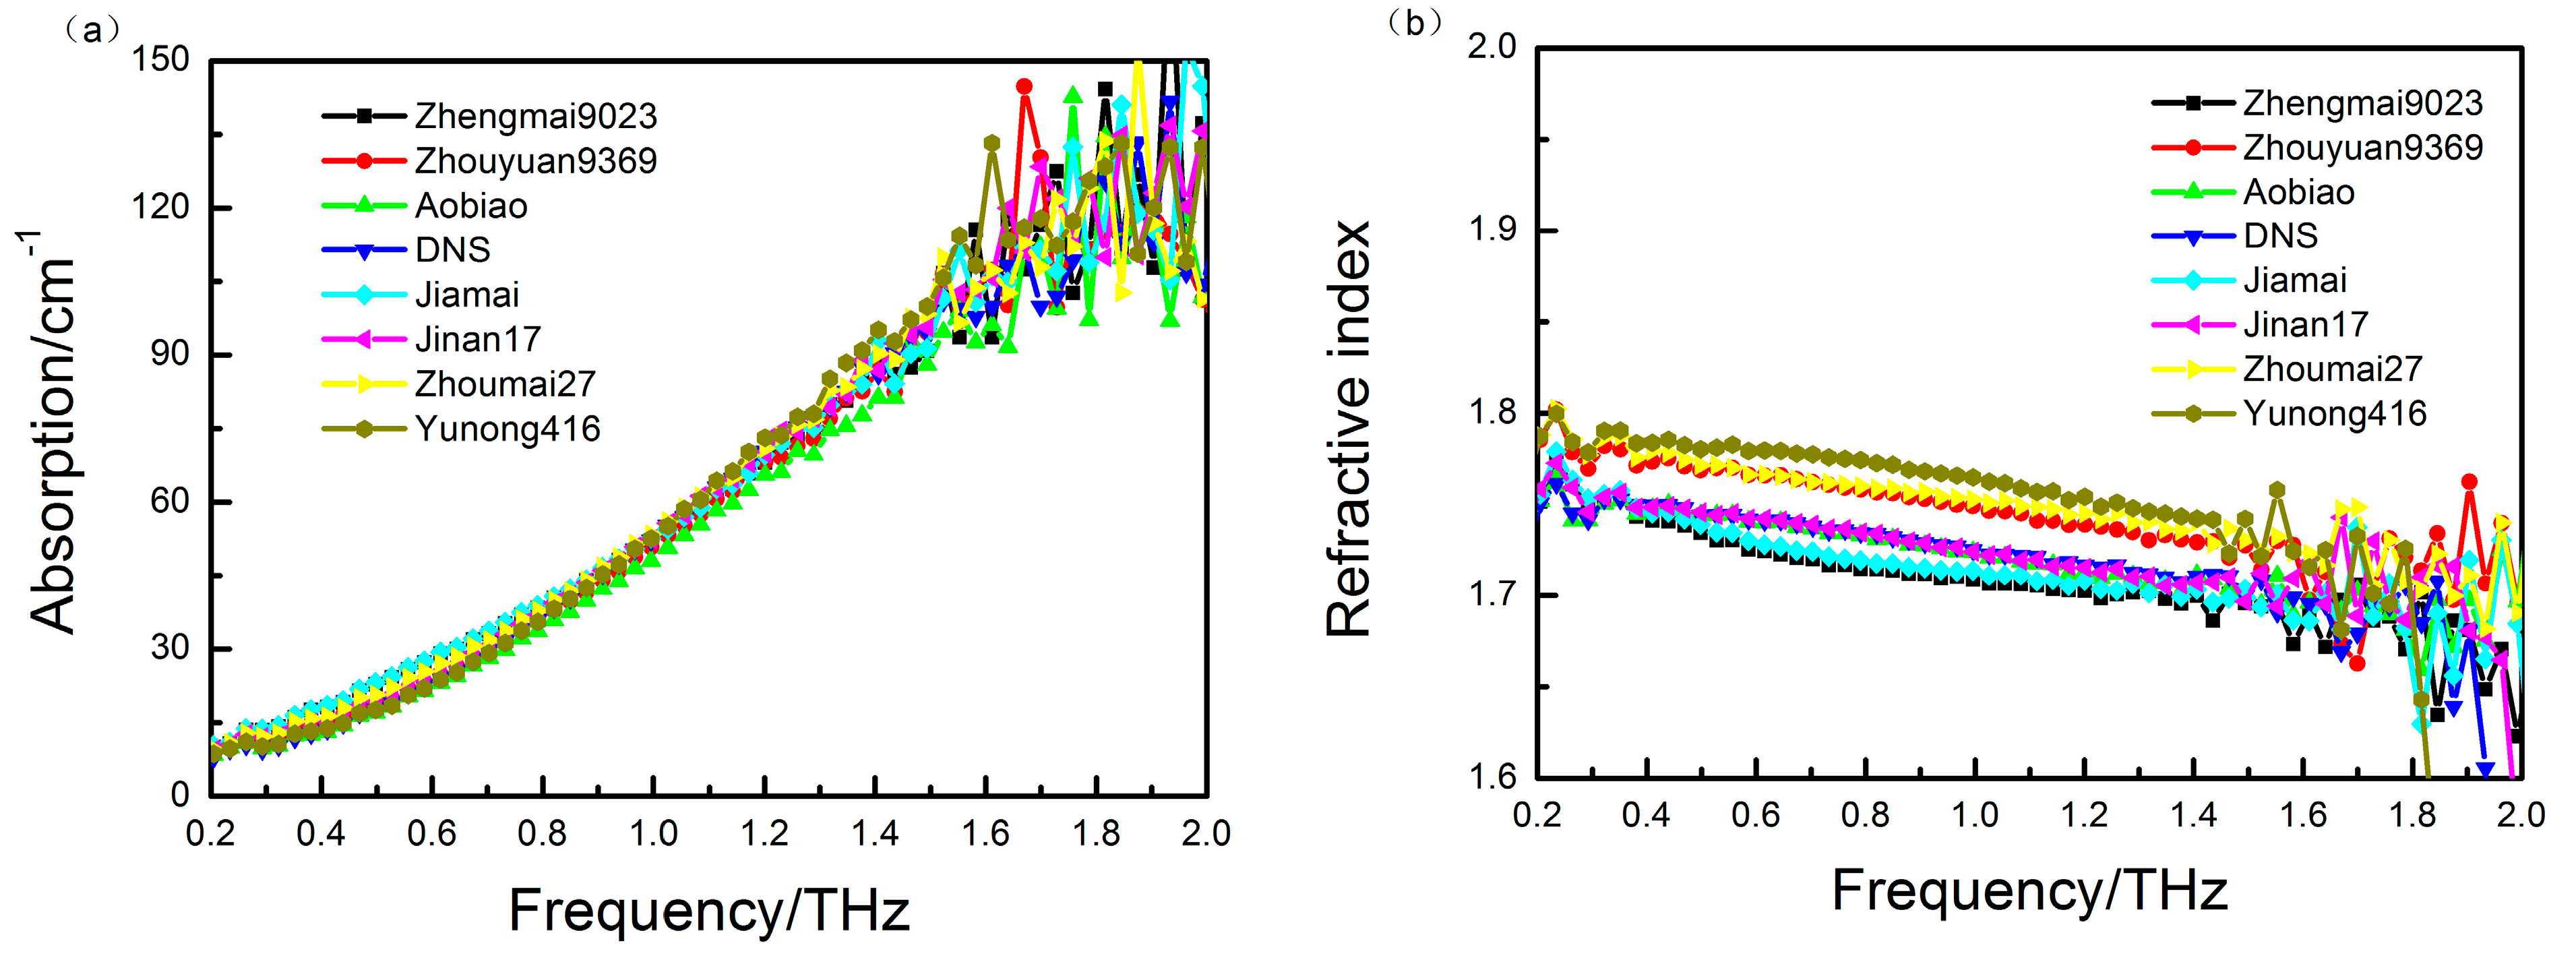
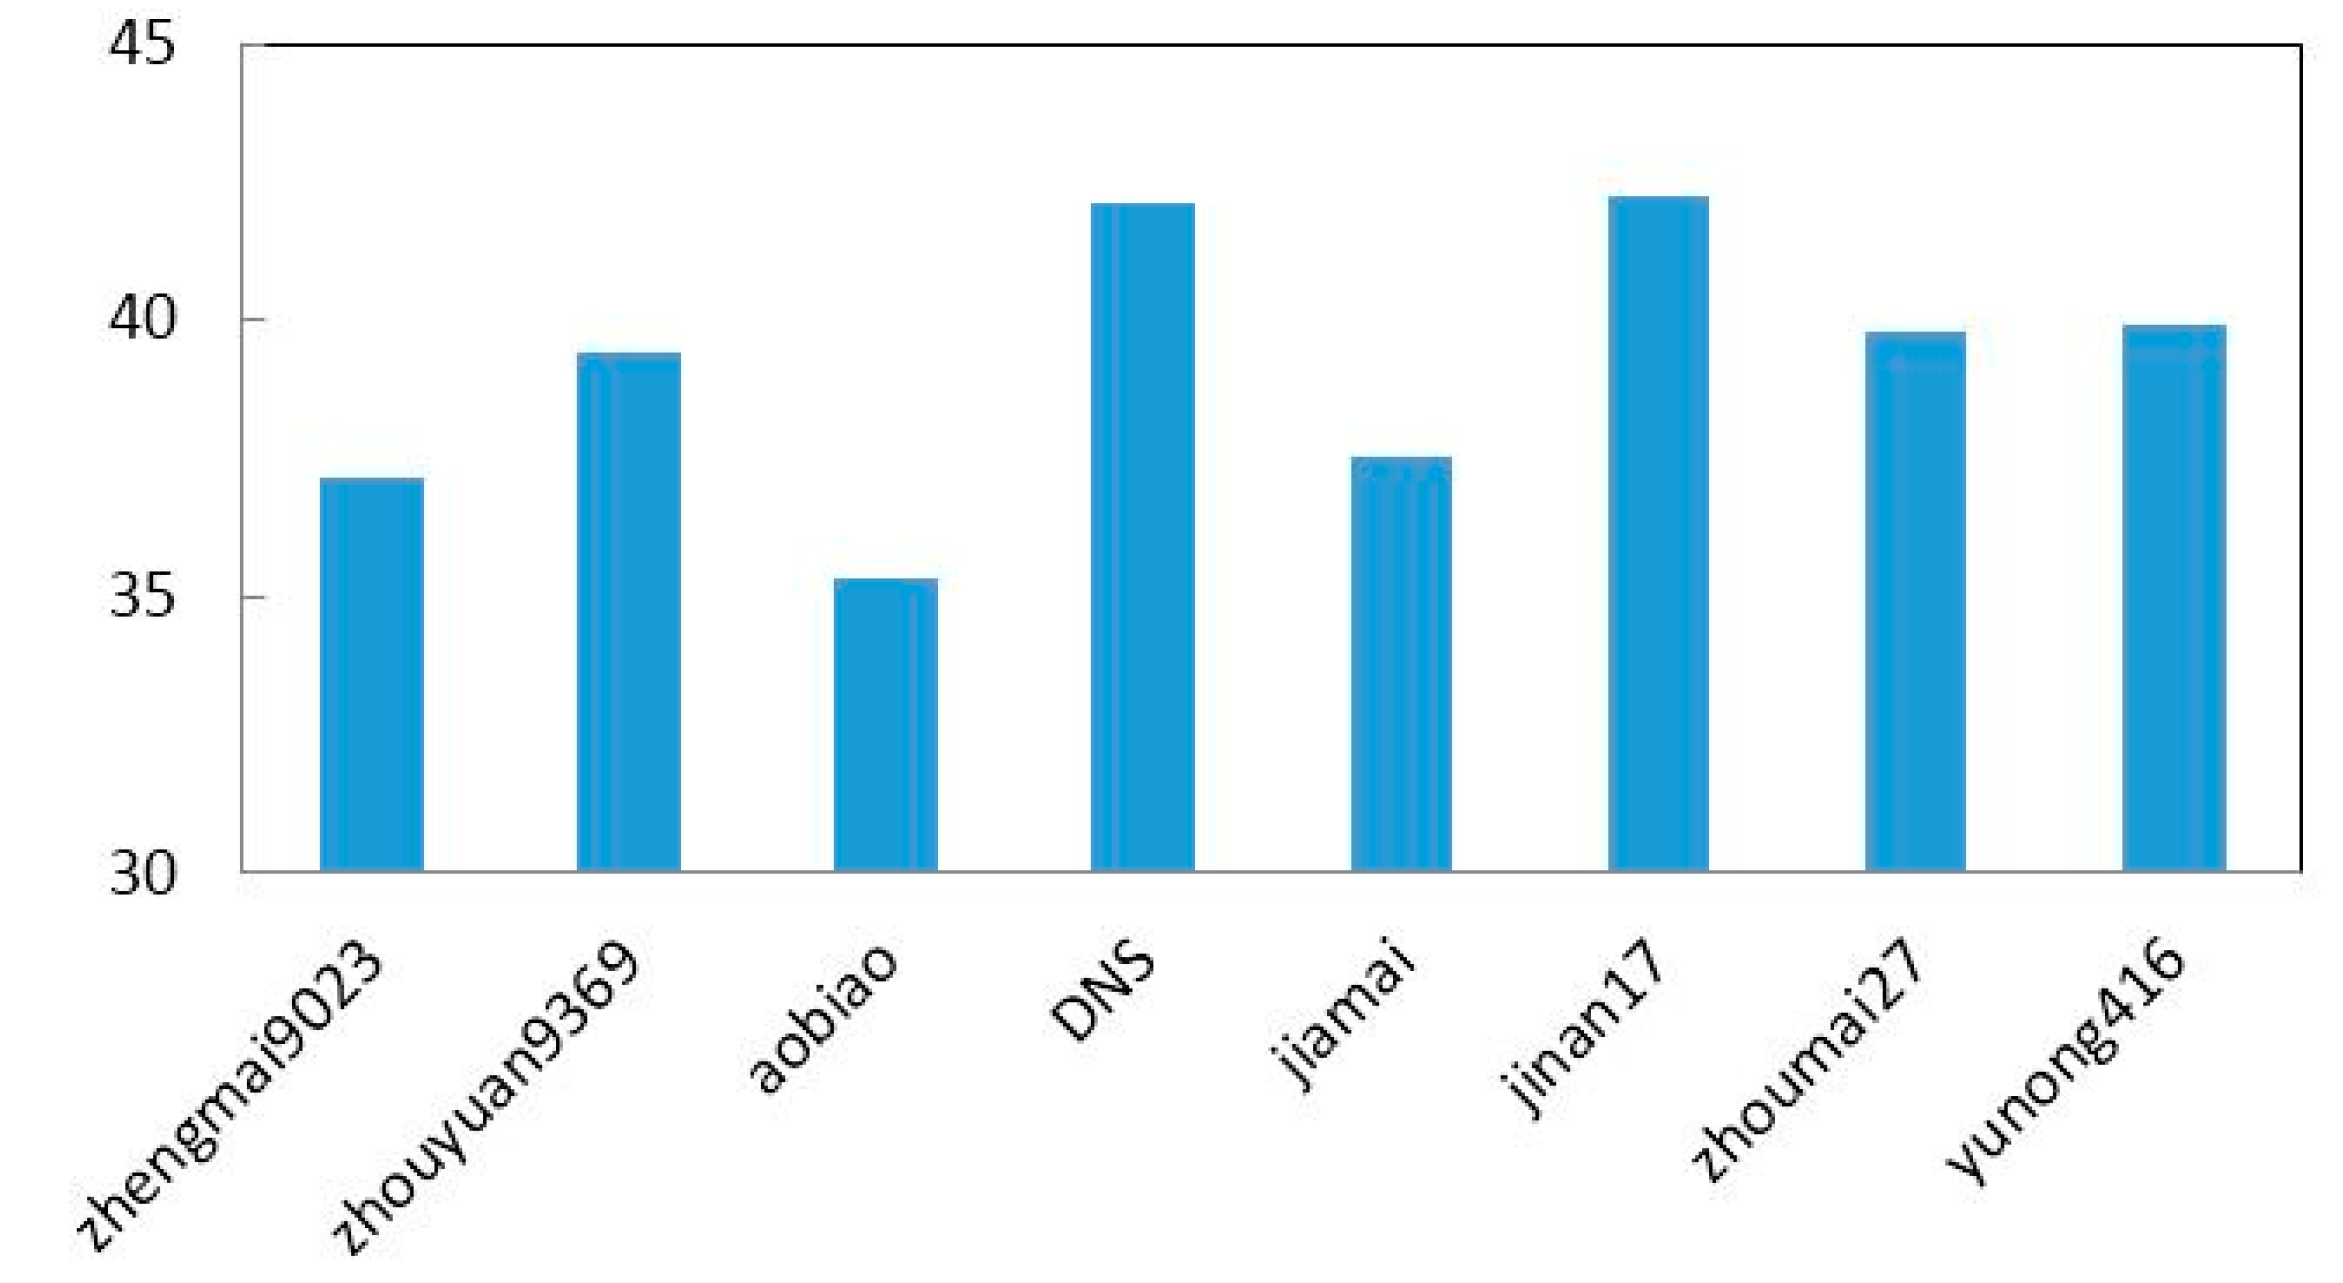
3.1. Spectra of Wheat Samples

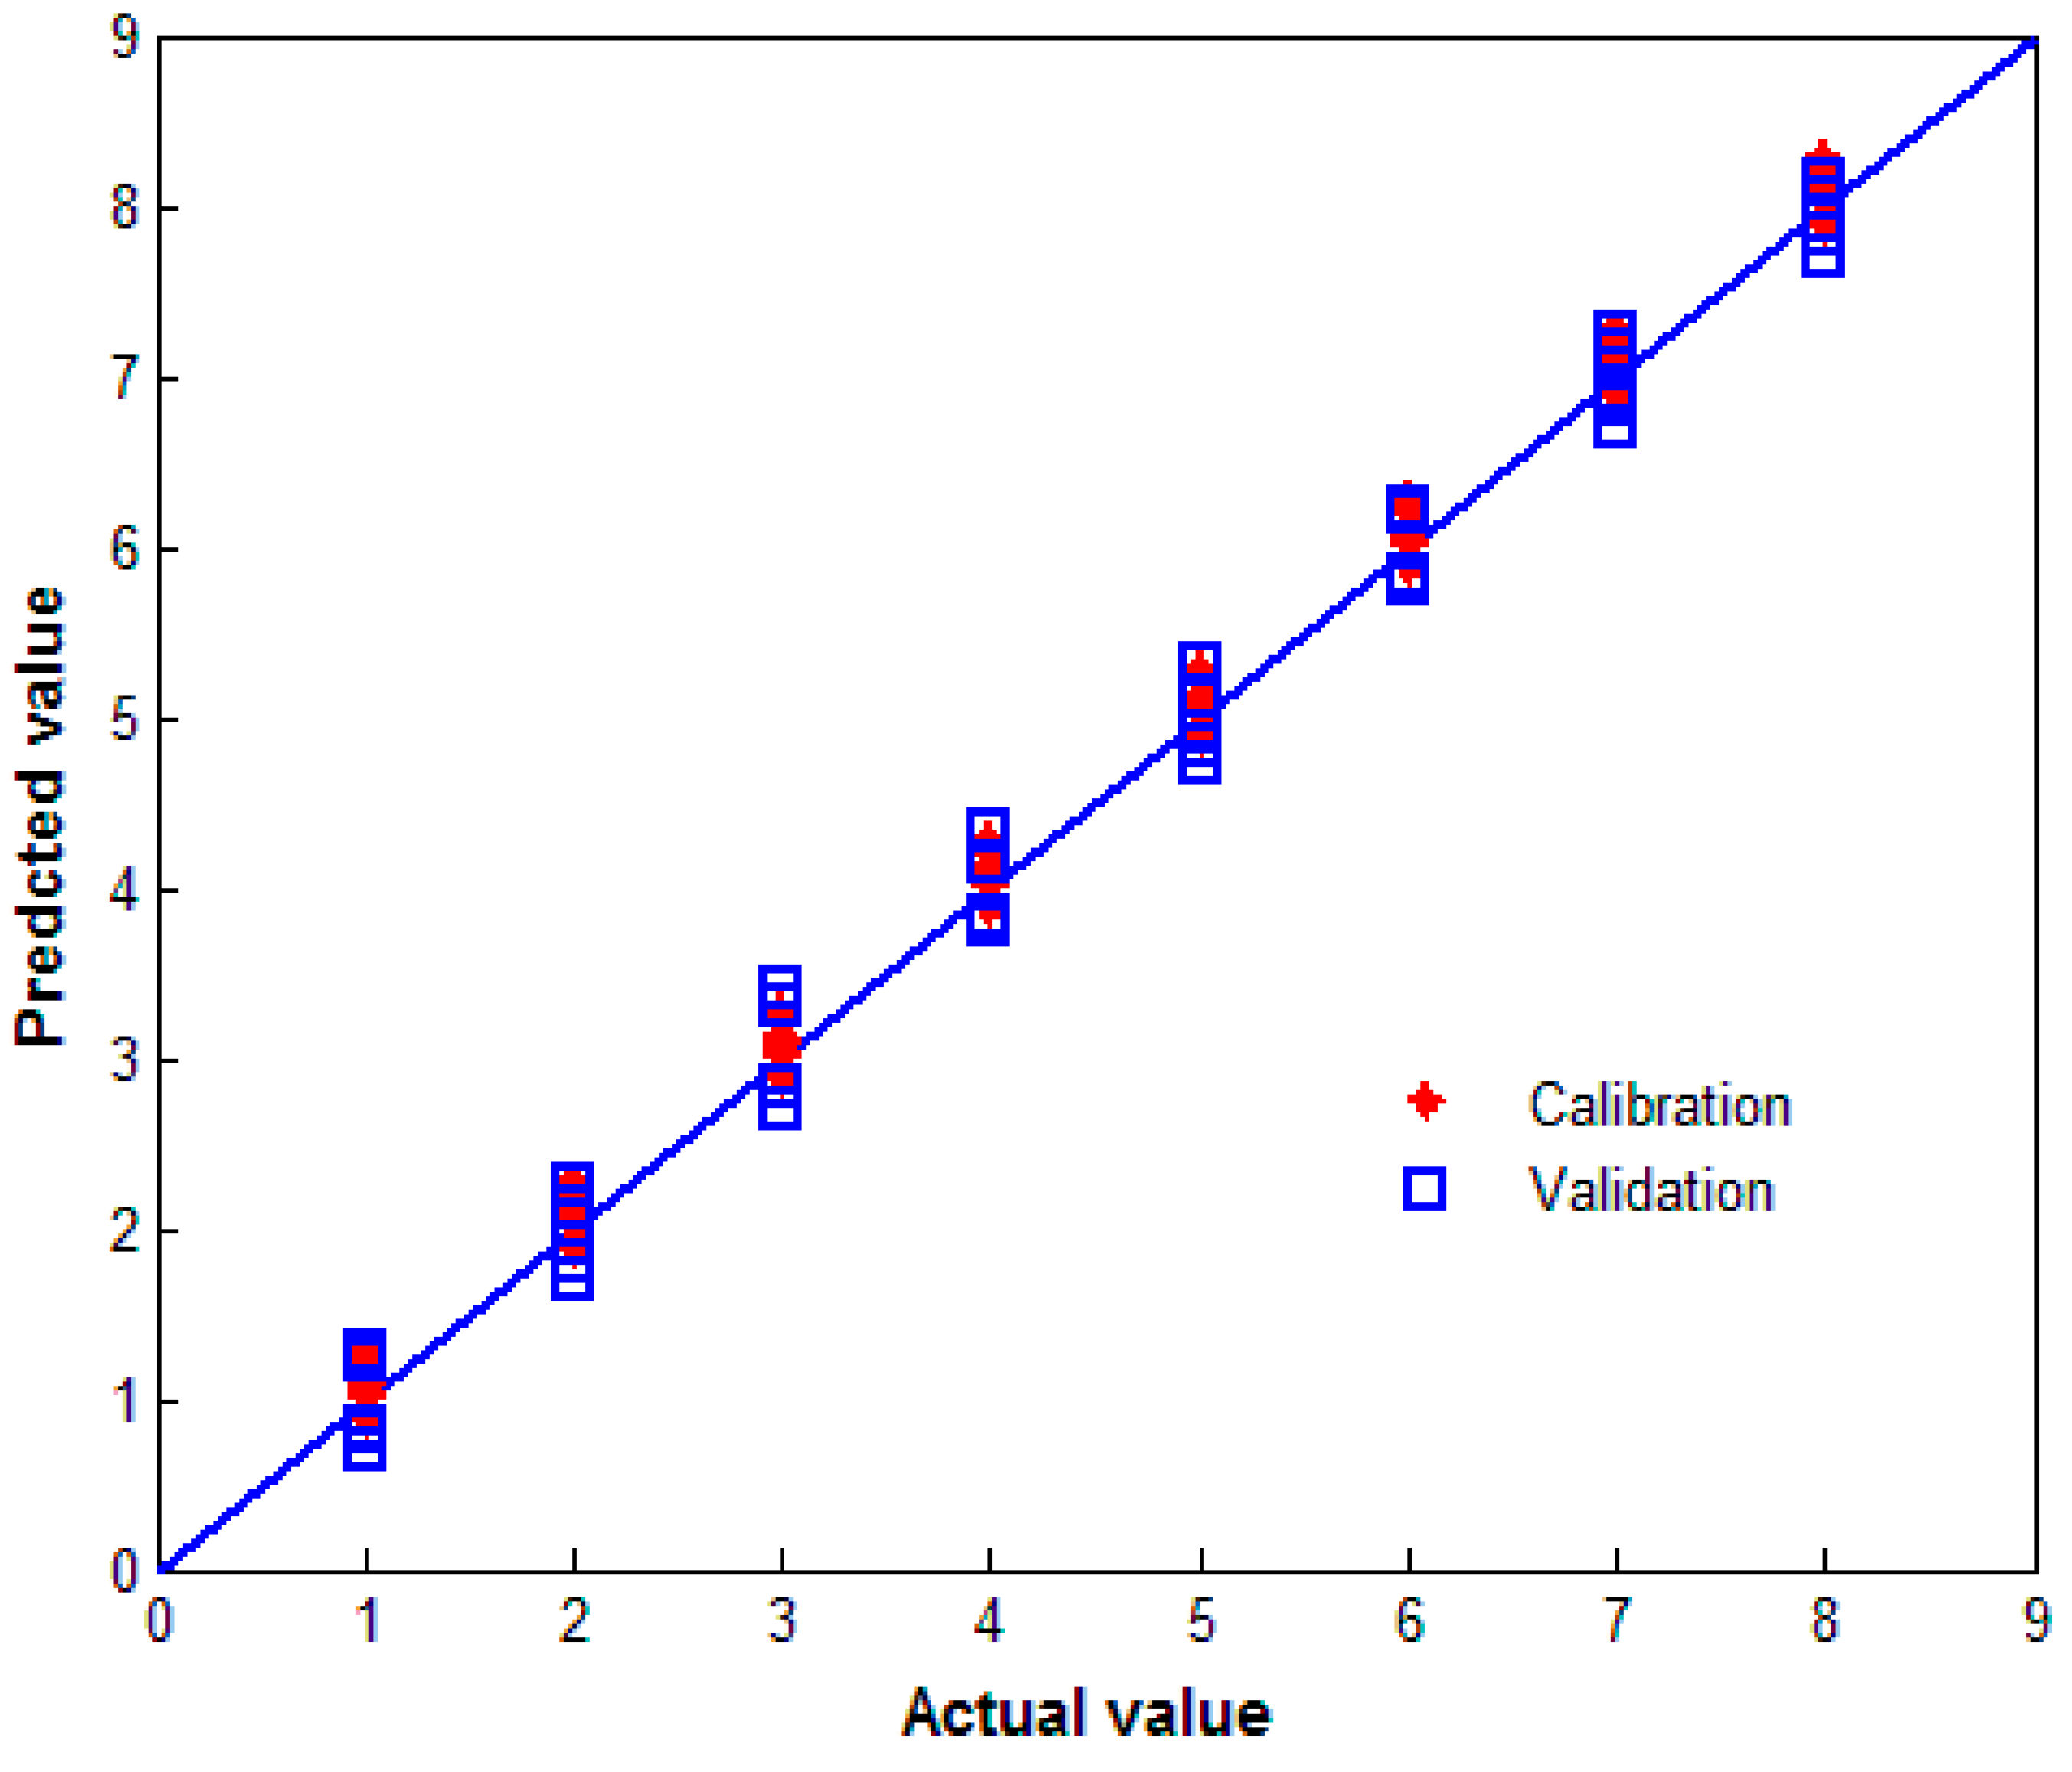
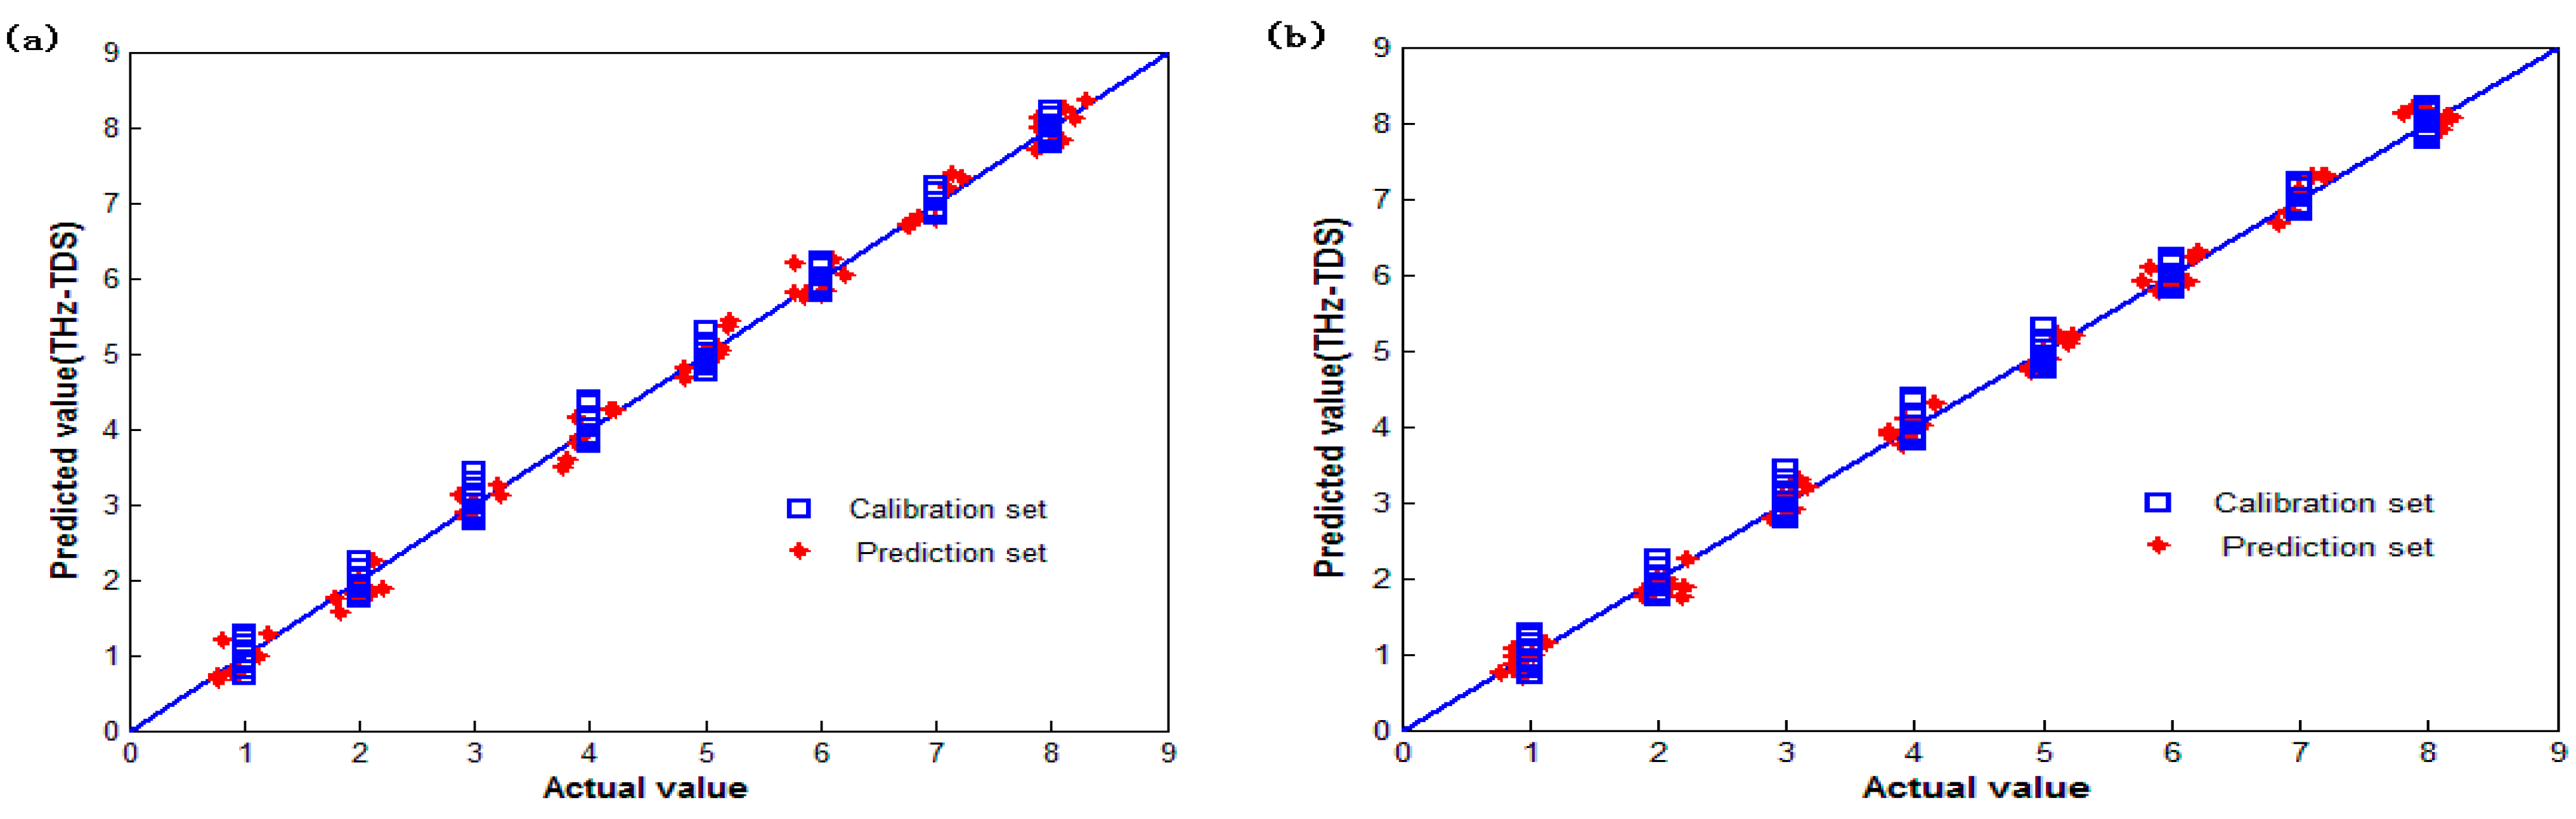
3.2. PLS Analysis
| Input Variable | Frequency Range (THz) | Factors | Calibration | Cross Validation | ||
|---|---|---|---|---|---|---|
| R | RMSEC | R | RMSECV | |||
| Absorption coefficient | 0.2–1.5 THz | 5 | 0.987 | 0.759 | 0.983 | 1.028 |
| Refractive index | 0.2–1.5 THz | 5 | 0.982 | 1.472 | 0.979 | 1.684 |

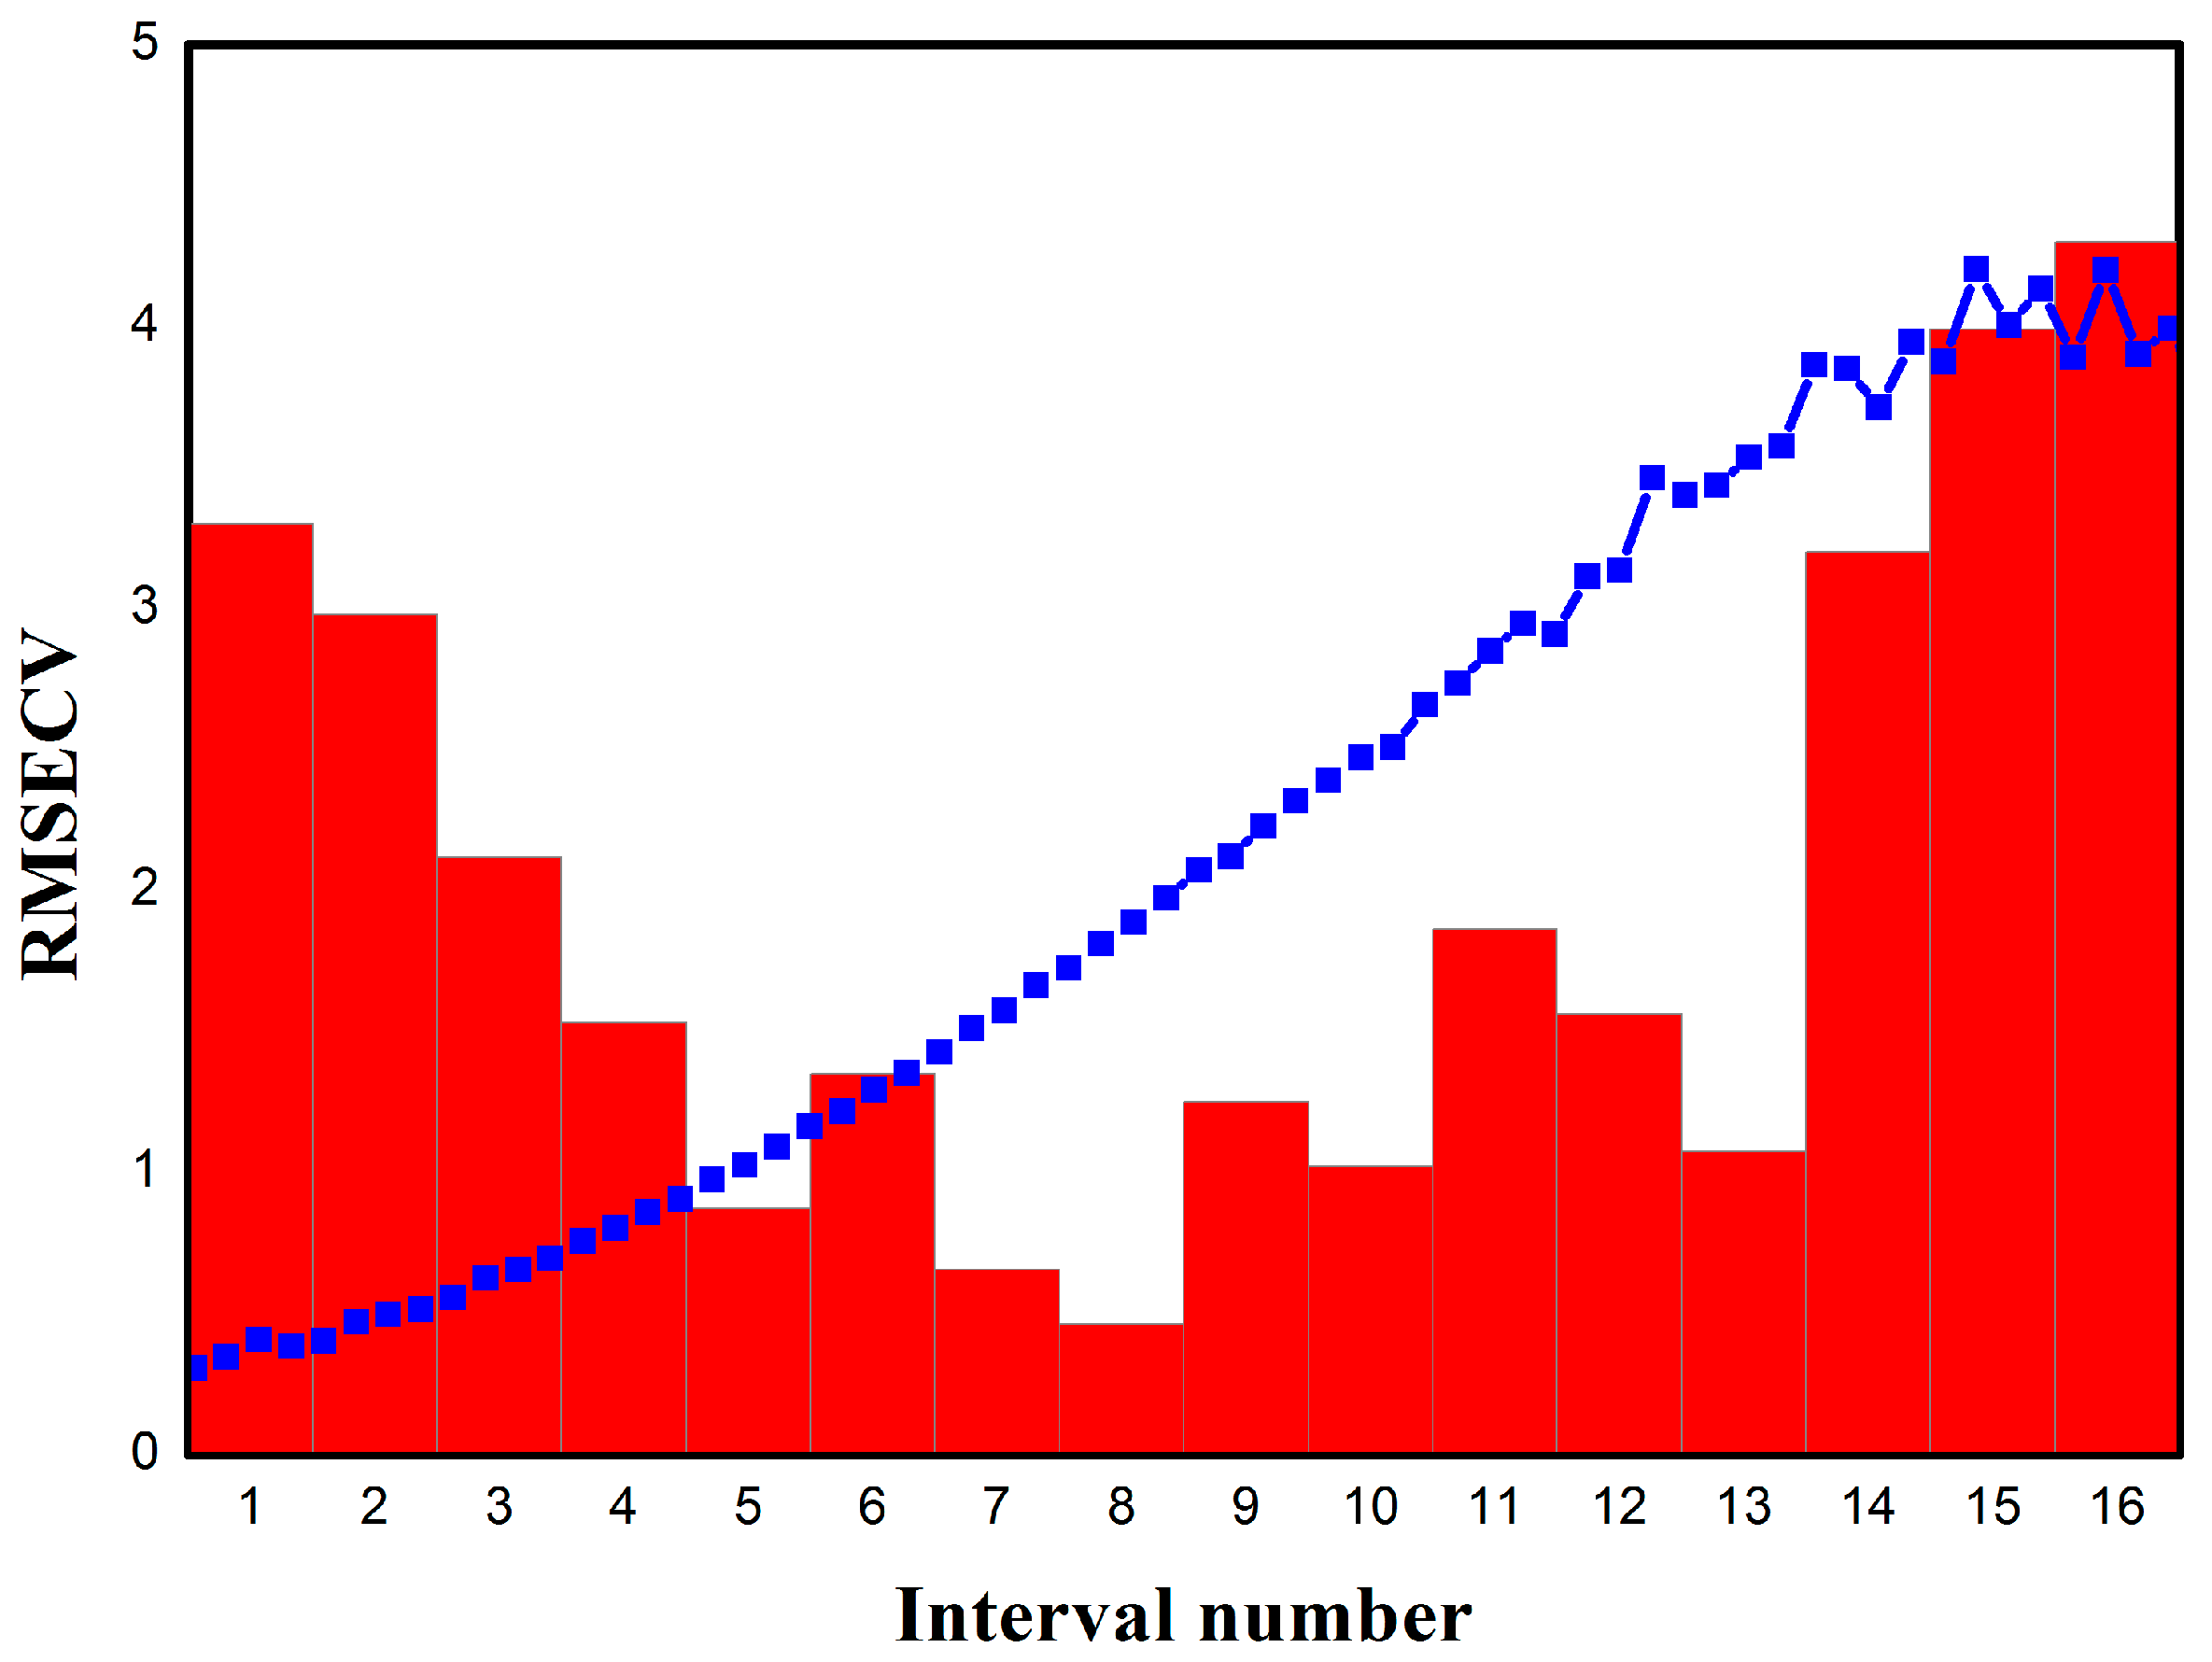
3.3. iPLS Analysis

| Interval Variables | Frequency Range | Rcal | RMSEC | RMSECV |
|---|---|---|---|---|
| 4 | 0.731–0.956 THz | 0.991 | 0.768 | 1.260 |
| 8 | 0.787–0.900 THz | 0.992 | 0.573 | 0.967 |
| 16 | 0.675–1 THz | 0.984 | 0.837 | 1.237 |
3.4. Discussion
4. Conclusions
Acknowledgments
Author Contributions
Conflicts of Interest
References
- Zapotoczny, P. Discrimination of wheat grain varieties using image analysis: Morphological features. Eur. Food Res. Technol. 2011, 233, 769–779. [Google Scholar] [CrossRef]
- Pourreza, A.; Pourreza, H.; Abbaspour-Fard, M.H.; Sadrnia, H. Identification of nine Iranian wheat seed varieties by textural analysis with image processing. Comput. Electron. Agric. 2012, 83, 102–108. [Google Scholar] [CrossRef]
- Levandi, T.; Pussa, T.; Vaher, M.; Ingver, A.; Koppel, R.; Kaljurand, M. Principal component analysis of HPLC-MS/MS patterns of wheat (Triticum aestivum) varieties. Proc. Est. Acad. Sci. 2014, 63, 86–92. [Google Scholar] [CrossRef]
- Paliwal, J.; Visen, N.S.; Jayas, D.S.; White, N.D.G. Cereal grain and dockage identification using machine vision. Biosyst. Eng. 2003, 85, 51–57. [Google Scholar] [CrossRef]
- Miralbes, C. Discrimination of European wheat varieties using near infrared reflectance spectroscopy. Food Chem. 2008, 106, 386–389. [Google Scholar] [CrossRef]
- Ferreira, D.S.; Galao, O.F.; Pallone, J.A.L.; Poppi, R.J. Comparison and application of near-infrared (NIR) and mid-infrared (MIR) spectroscopy for determination of quality parameters in soybean samples. Food Control 2014, 35, 227–232. [Google Scholar] [CrossRef]
- Dearing, T.I.; Thompson, W.J.; Rechsteiner, C.E.; Marquardt, B.J. Characterization of Crude Oil Products Using Data Fusion of Process Raman, Infrared, and Nuclear Magnetic Resonance (NMR) Spectra. Appl. Spectrosc. 2011, 65, 181–186. [Google Scholar] [CrossRef]
- Ferguson, B; Zhang, X.C. Materials for terahertz science and technology. Nat. Mater. 2002, 1, 26–33. [Google Scholar]
- Vieira, F.S.; Pasquini, C. Determination of Cellulose Crystallinity by Terahertz-Time Domain Spectroscopy. Anal. Chem. 2014, 86, 3780–3786. [Google Scholar] [CrossRef] [PubMed]
- Melinger, J.S.; Laman, N.; Grischkowsky, D. The underlying terahertz vibrational spectrum of explosives solids. Appl. Phys. Lett. 2008, 93. [Google Scholar] [CrossRef]
- Liang, M.Y.; Shen, J.L.; Wang, G.Q. Identification of illicit drugs by using SOM neural networks. J. Phys. D Appl. Phys. 2008, 41. [Google Scholar] [CrossRef]
- Ueno, Y.; Rungsawang, R.; Tomita, I.; Ajito, K. Quantitative measurements of amino acids by terahertz time-domain transmission spectroscopy. Anal. Chem. 2006, 78, 5424–5428. [Google Scholar]
- Ge, H.Y.; Jiang, Y.Y.; Xu, Z.H.; Lian, F.Y.; Zhang, Y.; Xia, S.H. Identification of wheat quality using THz spectrum. Opt. Express 2014, 22, 12533–12544. [Google Scholar] [CrossRef] [PubMed]
- Pupeza, I.; Wilk, R.; Koch, M. Highly accurate optical material parameter determination with THz time-domain spectroscopy. Opt. Express 2007, 15, 4335–4350. [Google Scholar] [CrossRef] [PubMed]
- Xiao-li, Z.; Jiu-sheng, L. Diagnostic techniques of talc powder in flour based on the THz spectroscopy. J. Phys. Conf. Ser. 2011, 276. [Google Scholar] [CrossRef]
- Zhang, Y.; Peng, X.H.; Chen, Y.; Chen, J.; Curioni, A.; Andreoni, W.; Nayak, S.K.; Zhang, X.C. A first principle study of terahertz (THz) spectra of acephate. Chem. Phys. Lett. 2008, 452, 59–66. [Google Scholar] [CrossRef]
- Dorney, T.D.; Baraniuk, R.G.; Mittleman, D.M. Material parameter estimation with terahertz time-domain spectroscopy. J. Opt. Soc. Am. A 2001, 18, 1562–1571. [Google Scholar] [CrossRef]
- Duvillaret, L.; Garet, F.; Coutaz, J.L. A reliable method for extraction of material parameters in terahertz time-domain spectroscopy. IEEE J. Sel. Top. Quantum Electron. 1996, 2, 739–746. [Google Scholar] [CrossRef]
- Nicolai, B.M.; Beullens, K.; Bobelyn, E.; Peirs, A.; Saeys, W.; Theron, K.I.; Lammertyn, J. Nondestructive measurement of fruit and vegetable quality by means of NIR spectroscopy: A review. Postharvest Biol. Technol. 2007, 46, 99–118. [Google Scholar] [CrossRef]
- Norgaard, L.; Saudland, A.; Wagner, J.; Nielsen, J.P.; Munck, L.; Engelsen, S.B. Interval partial least-squares regression (iPLS): A comparative chemometric study with an example from near-infrared spectroscopy. Appl. Spectrosc. 2000, 54, 413–419. [Google Scholar] [CrossRef]
- Kachrimanis, K.; Braun, D.E.; Griesser, U.J. Quantitative analysis of paracetamol polymorphs in powder mixtures by FT-Raman spectroscopy and PLS regression. J. Pharm. Biomed. 2007, 43, 407–412. [Google Scholar] [CrossRef] [PubMed]
- Hua, Y.F.; Zhang, H.J. Qualitative and Quantitative Detection of Pesticides with Terahertz Time-Domain Spectroscopy. IEEE Trans. Microw. Theory Tech. 2010, 58, 2064–2070. [Google Scholar]
- Naftaly, M.; Miles, R.E. Terahertz time-domain spectroscopy for material characterization. IEEE Proc. 2007, 95, 1658–1665. [Google Scholar] [CrossRef]
- Zhang, F.; Kambara, O.; Tominaga, K.; Nishizawa, J.; Sasaki, T.; Wang, H.W.; Hayashi, M. Analysis of vibrational spectra of solid-state adenine and adenosine in the terahertz region. R. Soc. Chem. Adv. 2014, 4, 269–278. [Google Scholar] [CrossRef]
- McIntosh, A.I.; Yang, B.; Goldup, S.M.; Watkinson, M.; Donnan, R.S. Crystallization of amorphous lactose at high humidity studied by terahertz time domain spectroscopy. Chem. Phys. Lett. 2013, 558, 104–108. [Google Scholar] [CrossRef]
- Andersen, C.M.; Bro, R. Variable selection in regression-a tutorial. J. Chemometr. 2010, 24, 728–737. [Google Scholar] [CrossRef]
- Withayachumnankul, W.; Fischer, B.M.; Lin, H.Y.; Abbott, D. Uncertainty in terahertz time-domain spectroscopy measurement. J. Opt. Soc. Am. B 2008, 25, 1059–1072. [Google Scholar] [CrossRef]
- Triboi, E.; Abad, A.; Michelena, A.; Lloveras, J.; Ollier, J.L.; Daniel, C. Environmental effects on the quality of two wheat genotypes: 1. quantitative and qualitative variation of storage proteins. Eur. J. Agron. 2000, 13, 47–64. [Google Scholar] [CrossRef]
© 2015 by the authors; licensee MDPI, Basel, Switzerland. This article is an open access article distributed under the terms and conditions of the Creative Commons Attribution license (http://creativecommons.org/licenses/by/4.0/).
Share and Cite
Ge, H.; Jiang, Y.; Lian, F.; Zhang, Y.; Xia, S. Characterization of Wheat Varieties Using Terahertz Time-Domain Spectroscopy. Sensors 2015, 15, 12560-12572. https://doi.org/10.3390/s150612560
Ge H, Jiang Y, Lian F, Zhang Y, Xia S. Characterization of Wheat Varieties Using Terahertz Time-Domain Spectroscopy. Sensors. 2015; 15(6):12560-12572. https://doi.org/10.3390/s150612560
Chicago/Turabian StyleGe, Hongyi, Yuying Jiang, Feiyu Lian, Yuan Zhang, and Shanhong Xia. 2015. "Characterization of Wheat Varieties Using Terahertz Time-Domain Spectroscopy" Sensors 15, no. 6: 12560-12572. https://doi.org/10.3390/s150612560
APA StyleGe, H., Jiang, Y., Lian, F., Zhang, Y., & Xia, S. (2015). Characterization of Wheat Varieties Using Terahertz Time-Domain Spectroscopy. Sensors, 15(6), 12560-12572. https://doi.org/10.3390/s150612560