
Tidal Volume Estimation Using the Blanket Fractal Dimension of the Tracheal Sounds Acquired by Smartphone

Abstract
:1. Introduction
2. Materials and Methods
2.1. Subjects
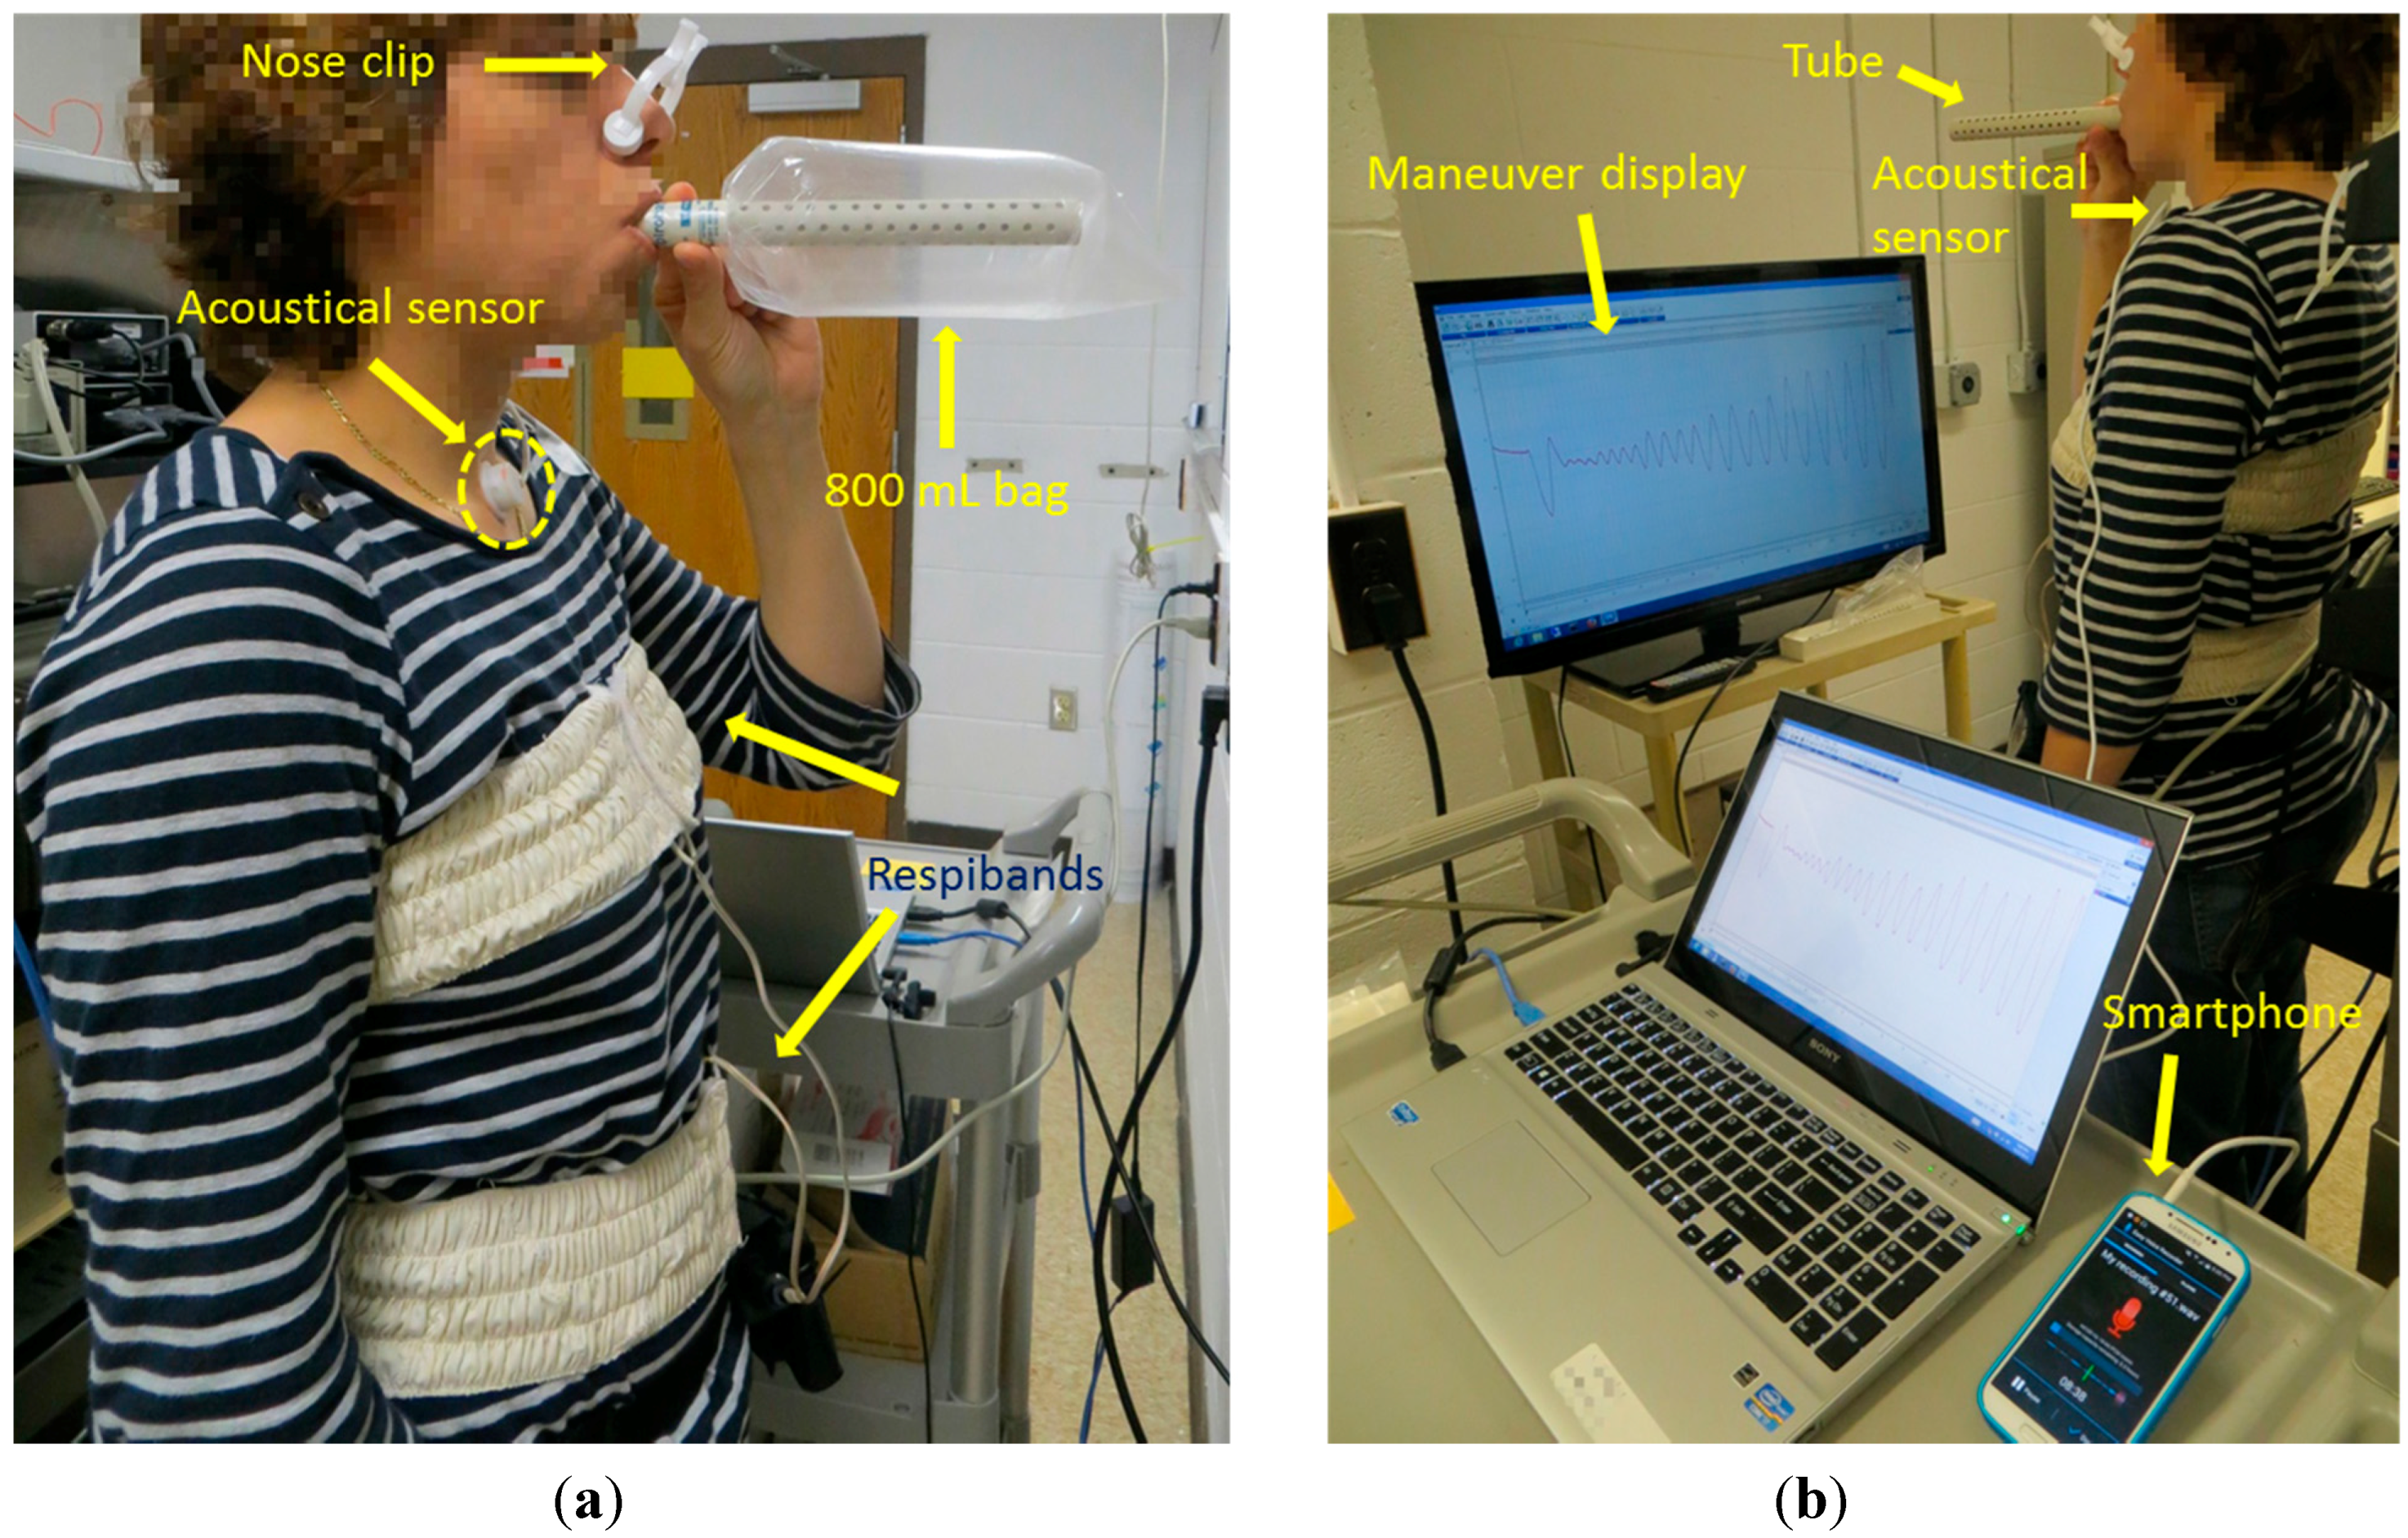
2.2. Equipment and Acquisition of the Signals
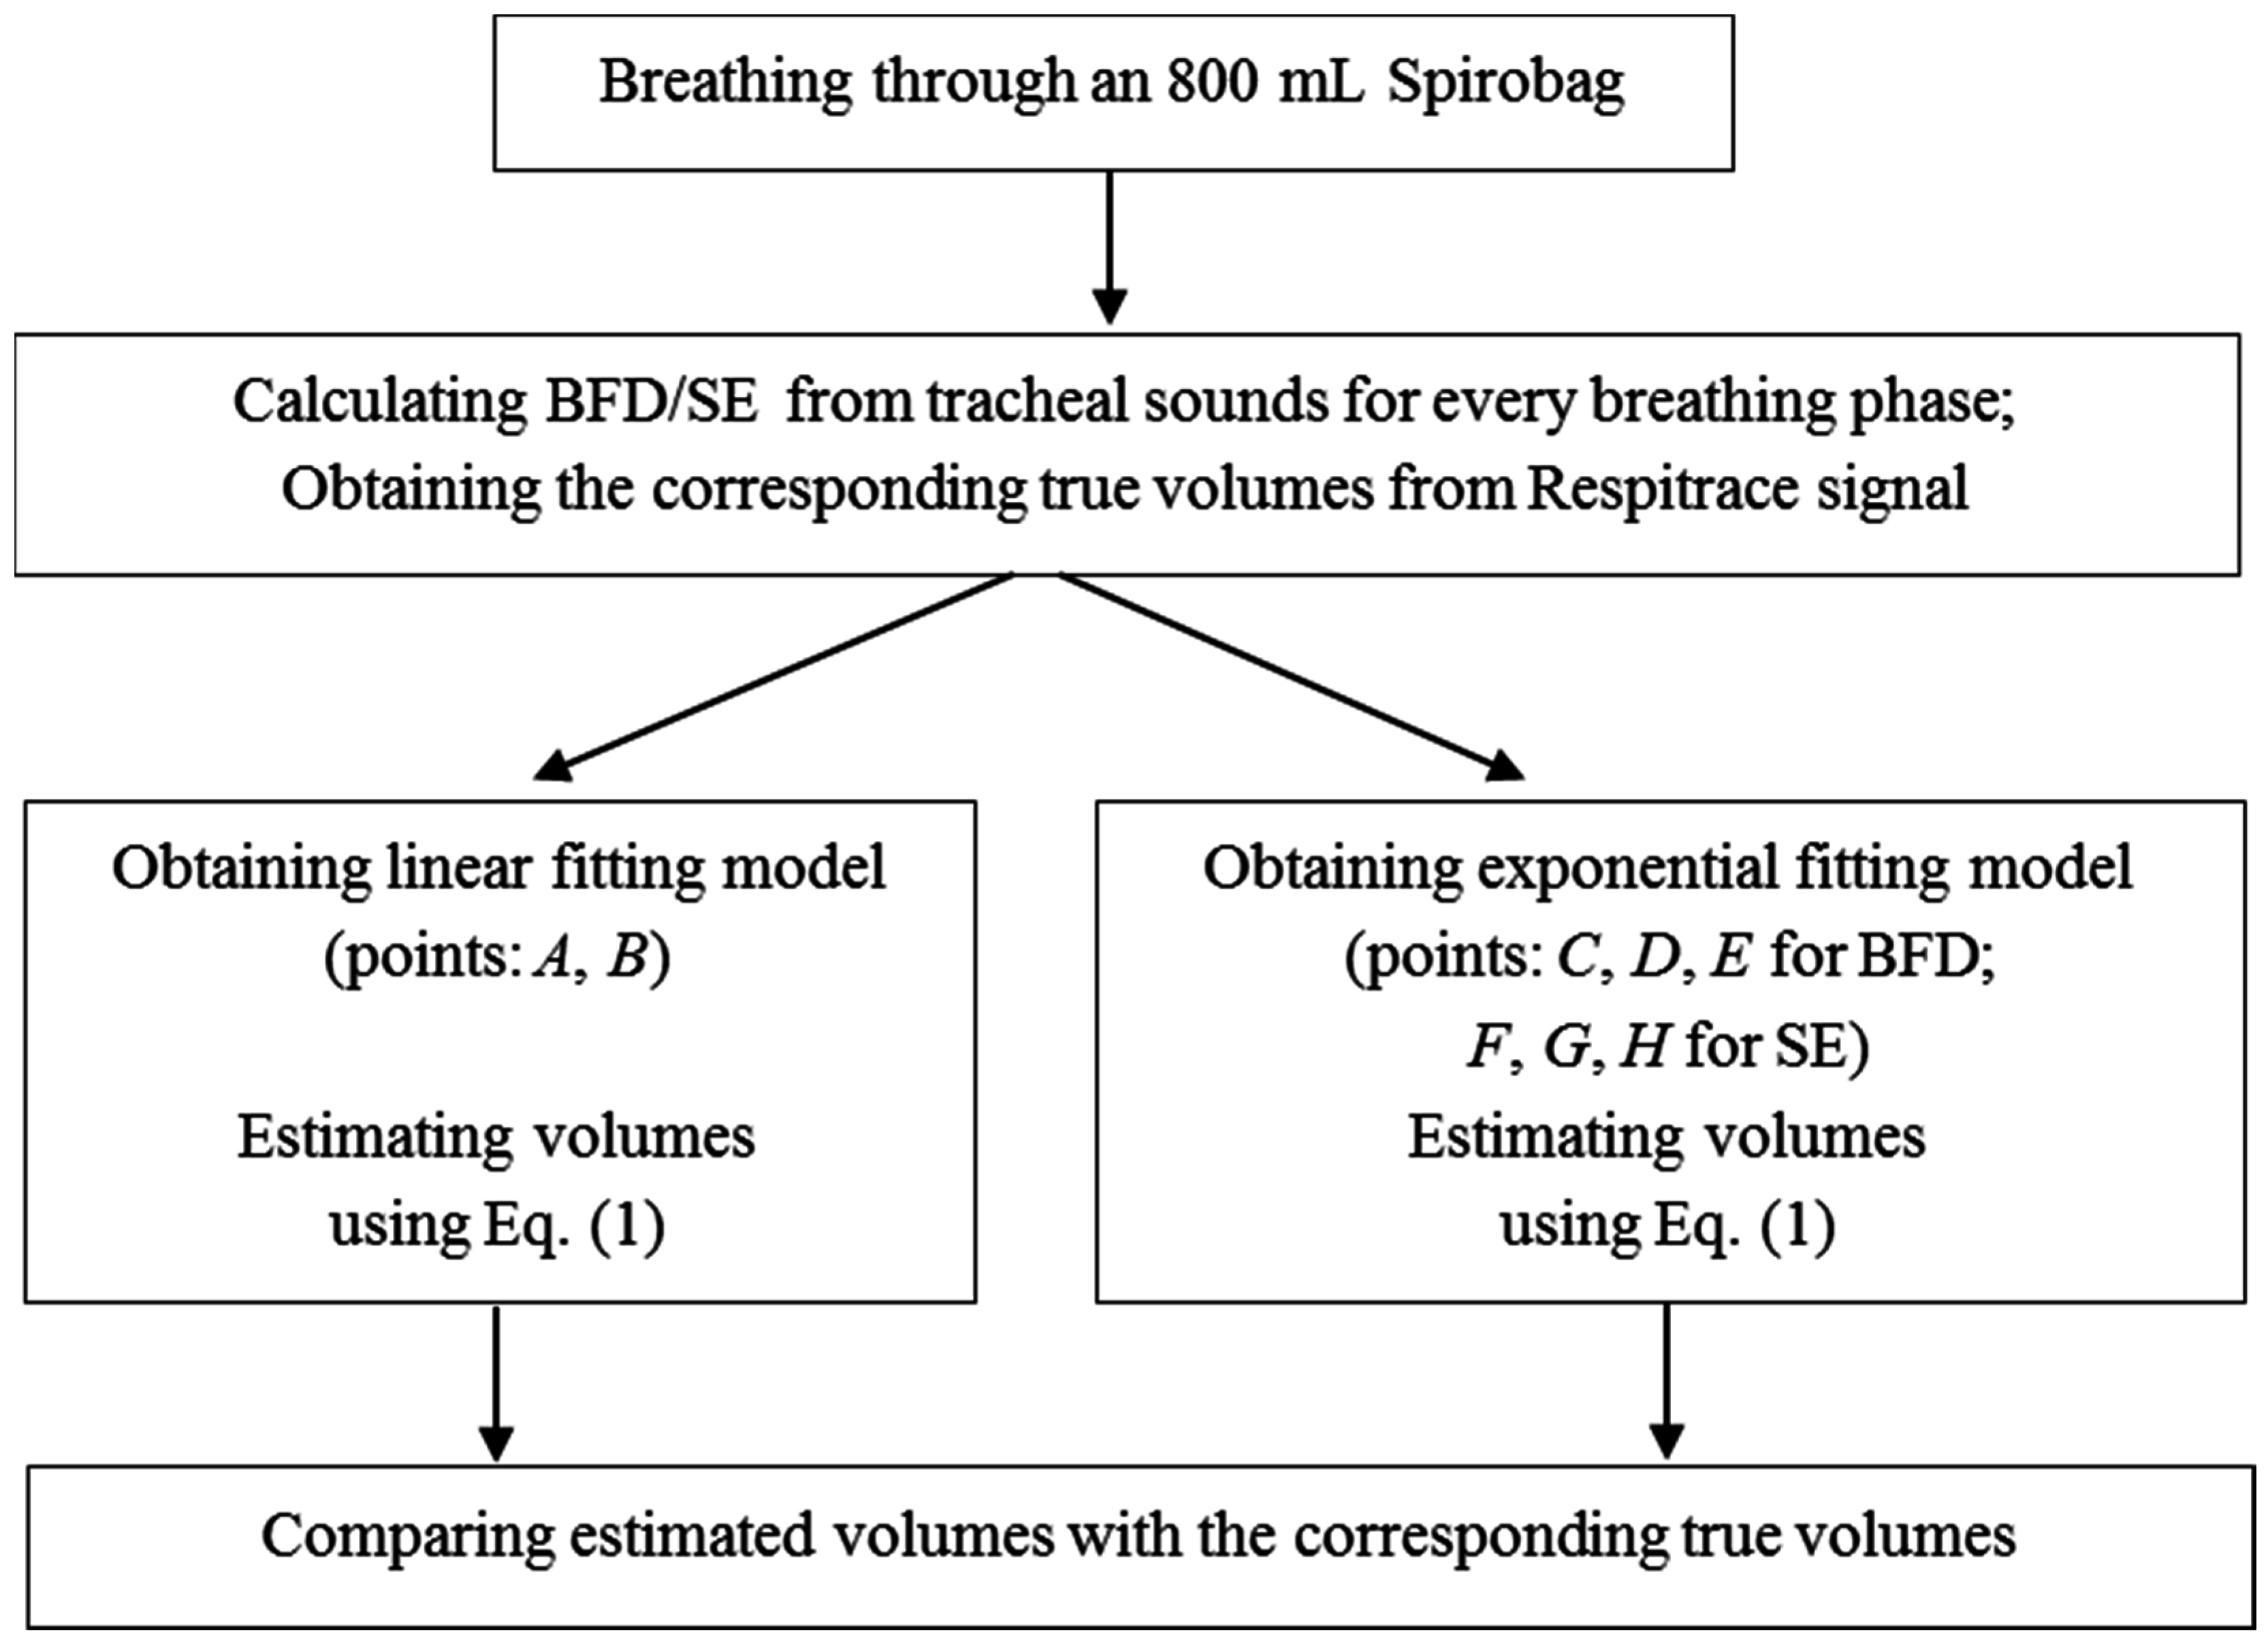
- Participants were asked to breathe through an 800 mL Spirobag (Ambulatory Monitoring, Inc., Ardsley, NY, USA) for about six respiratory cycles;
- Participants were asked to follow a maneuver that consisted of increasing tidal volumes and then decreasing with each breath, ranging from participant’s comfortable lowest to highest volume, while breathing through a paper tube (tube’s length: 20 cm, internal diameter: 1.5 cm, external diameter: 2 cm), for approximately 2 min;
- Participants were asked to repeat the same maneuver as in the second stage while breathing without the tube.
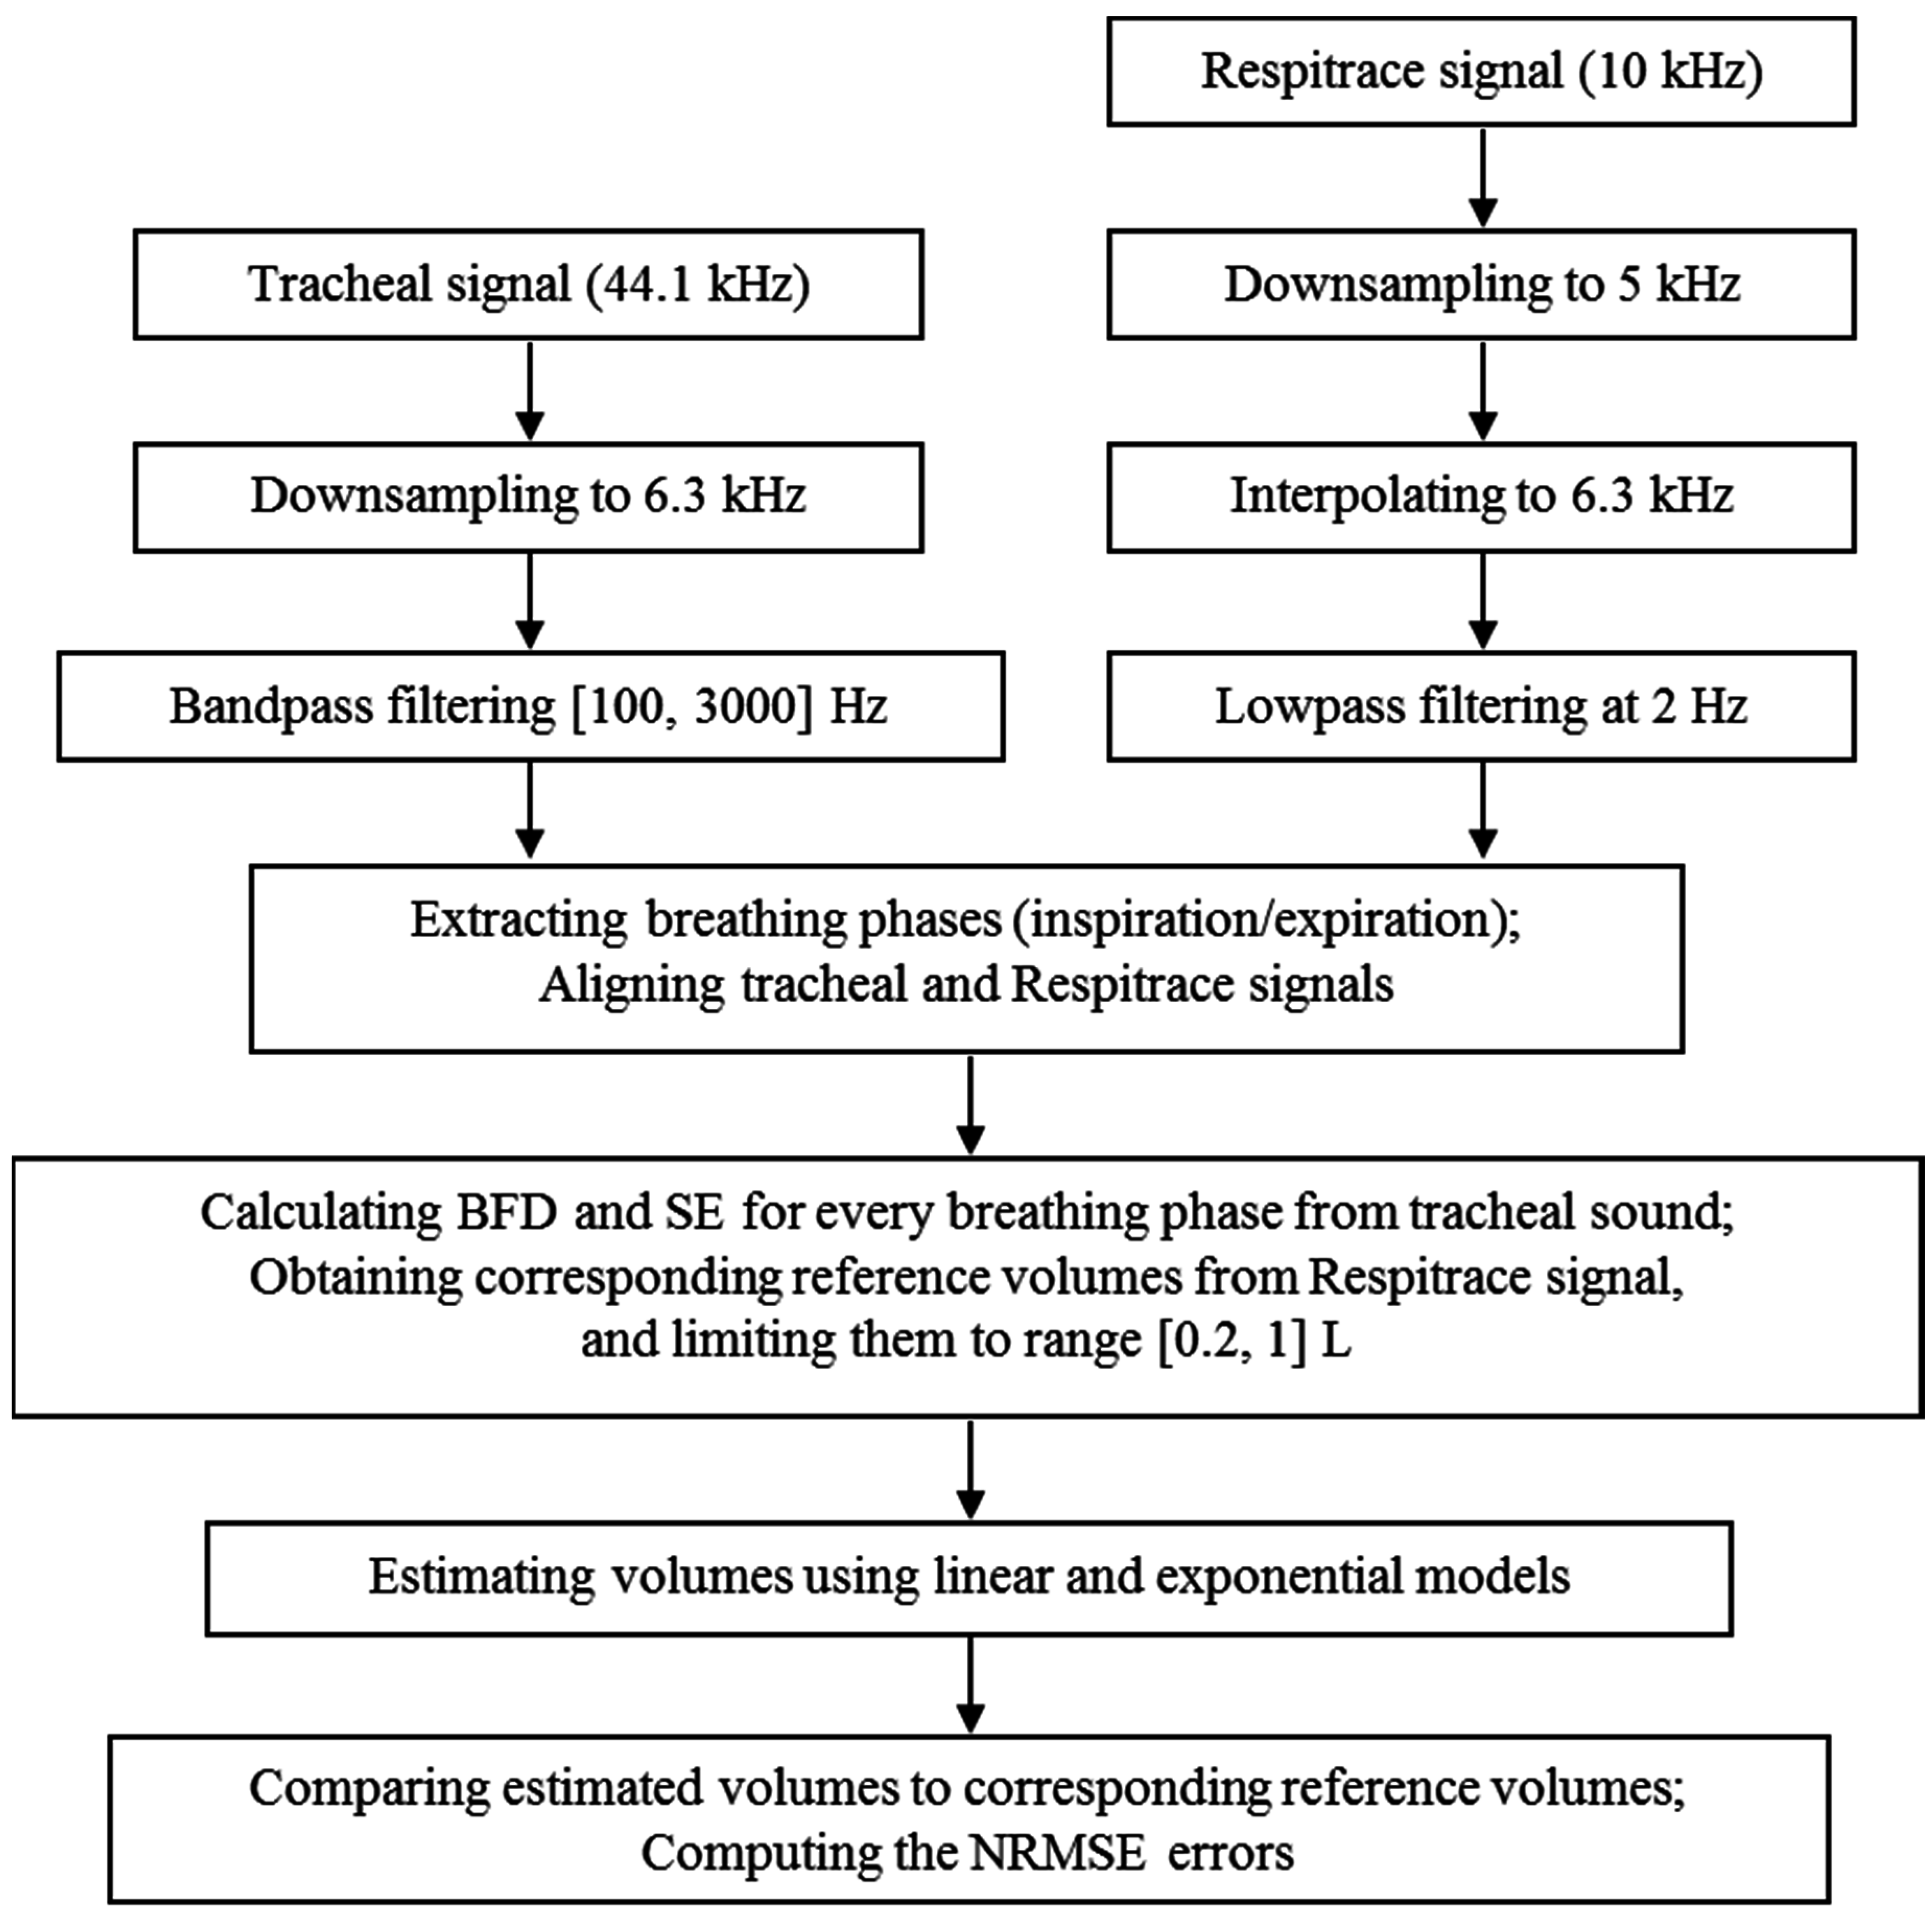
2.3. Data Processing
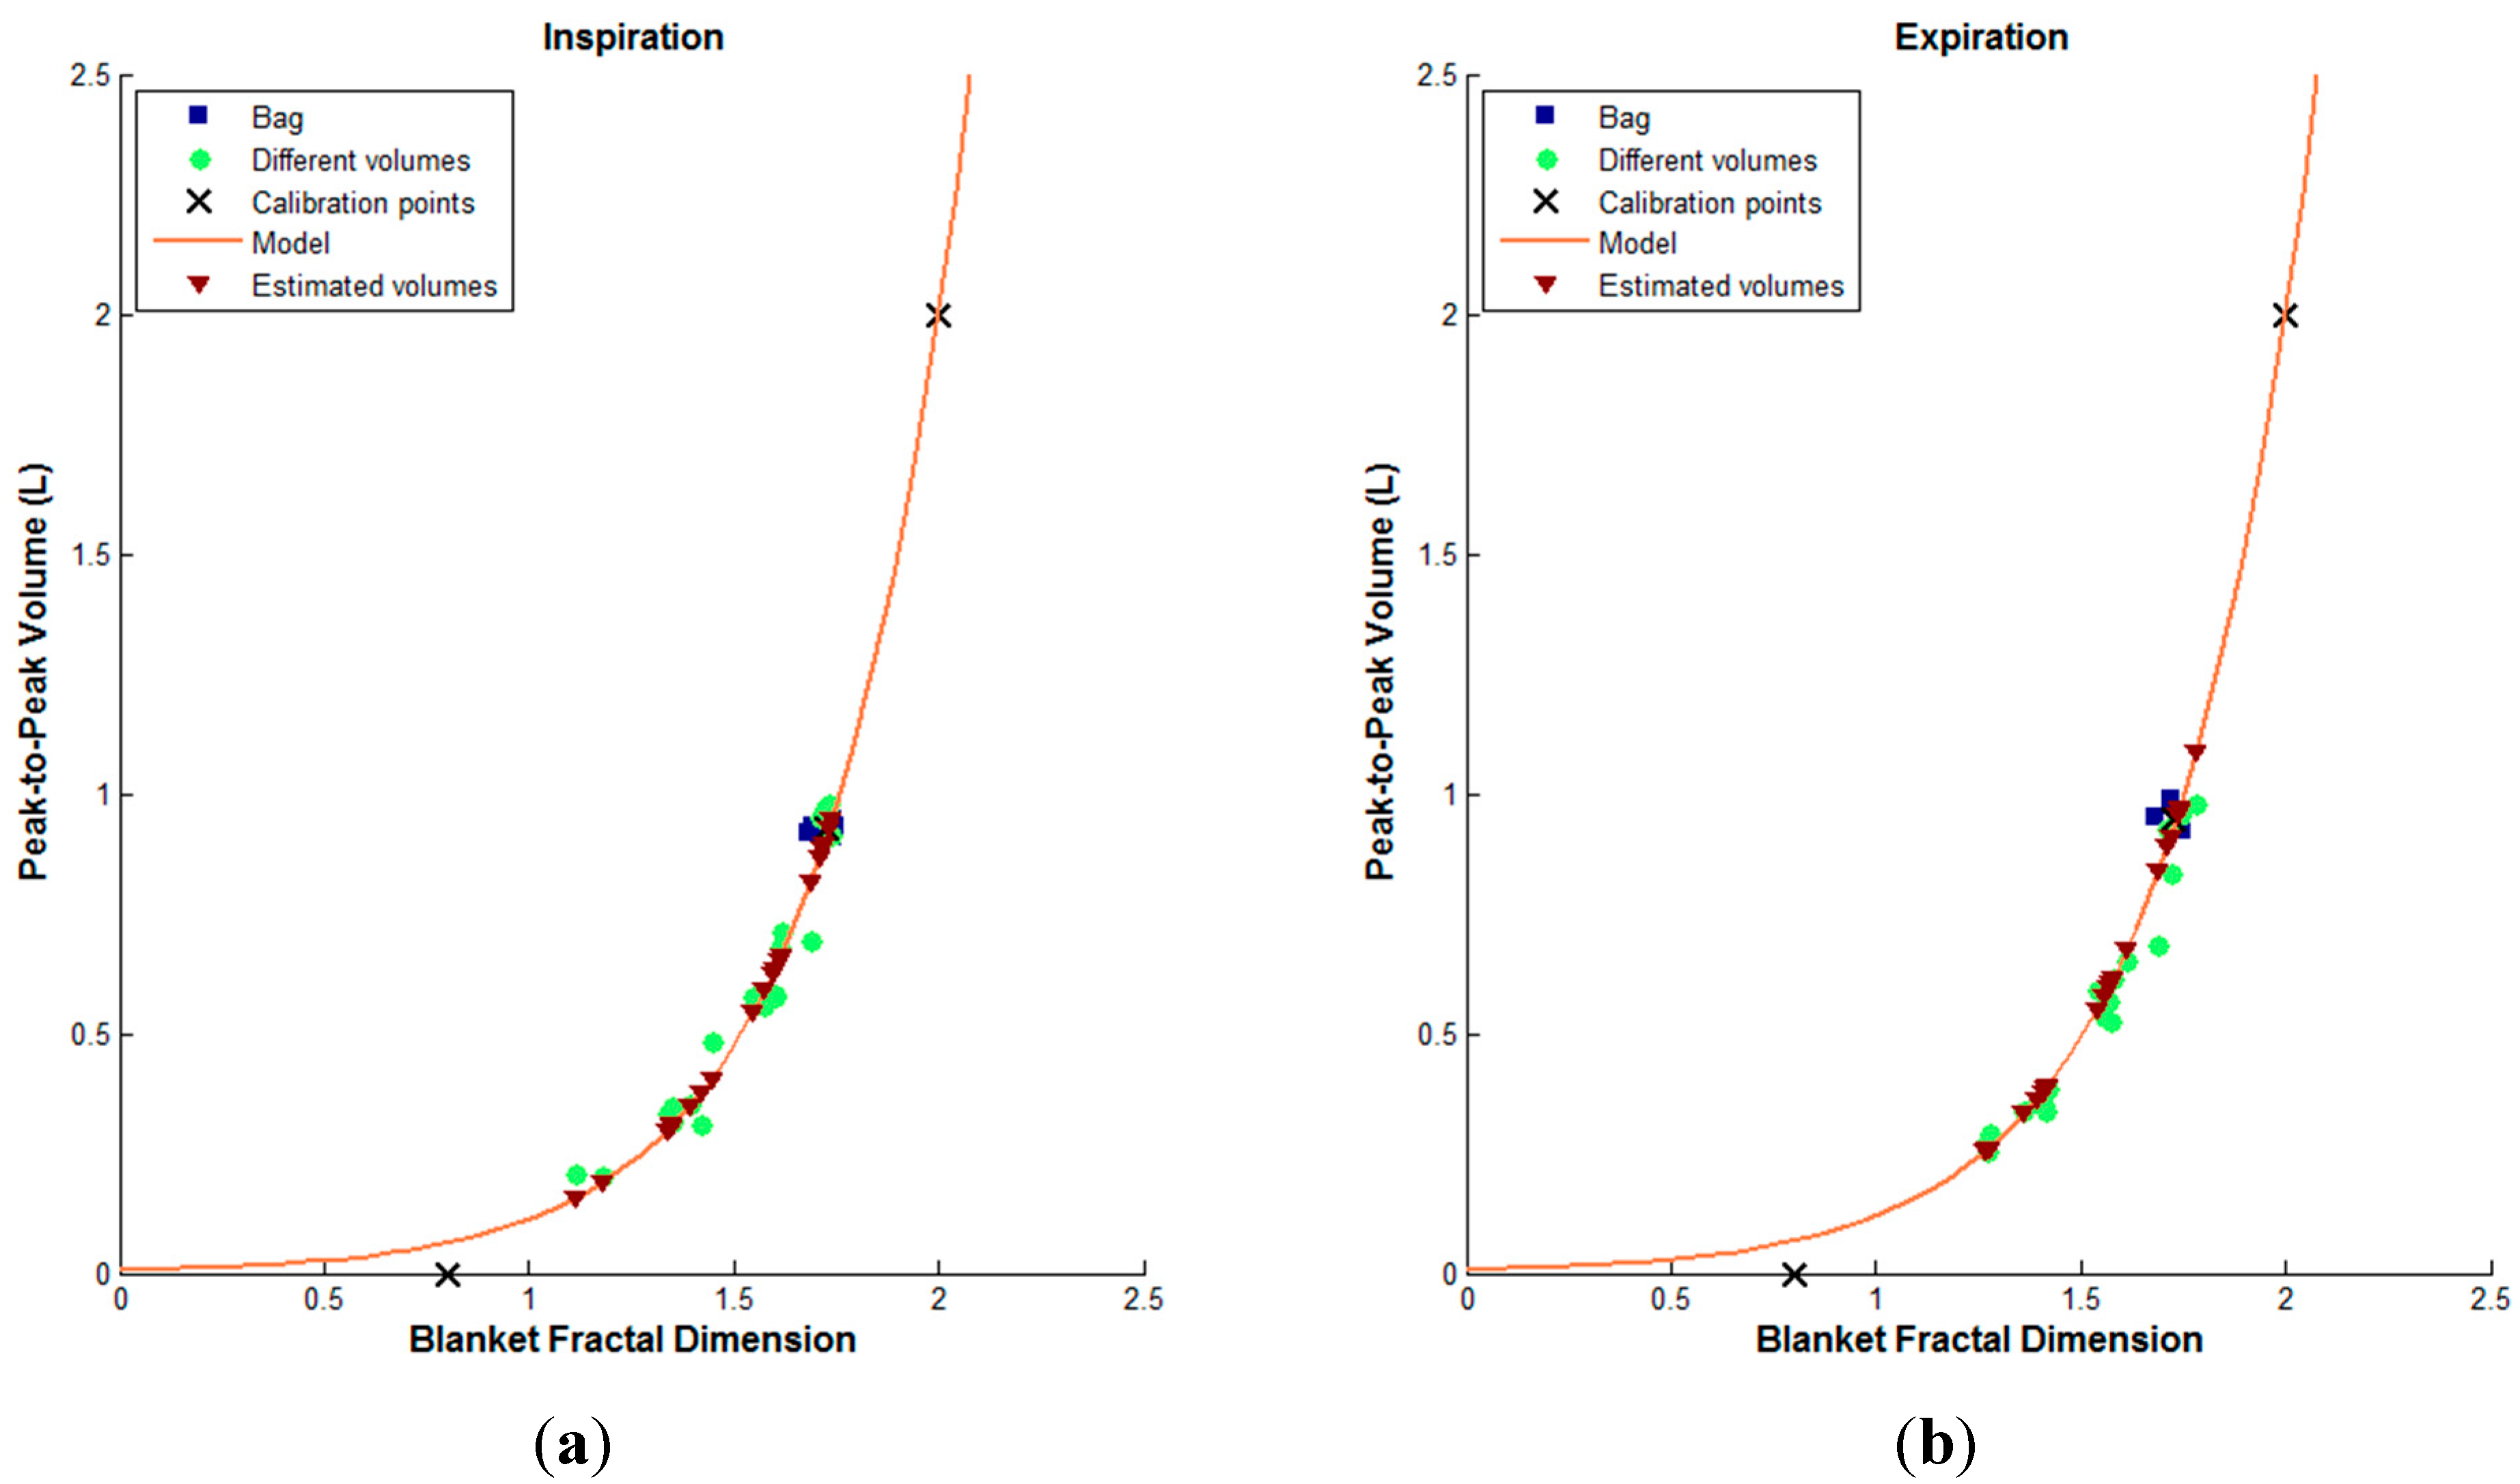
2.4. Blanket Fractal Dimension
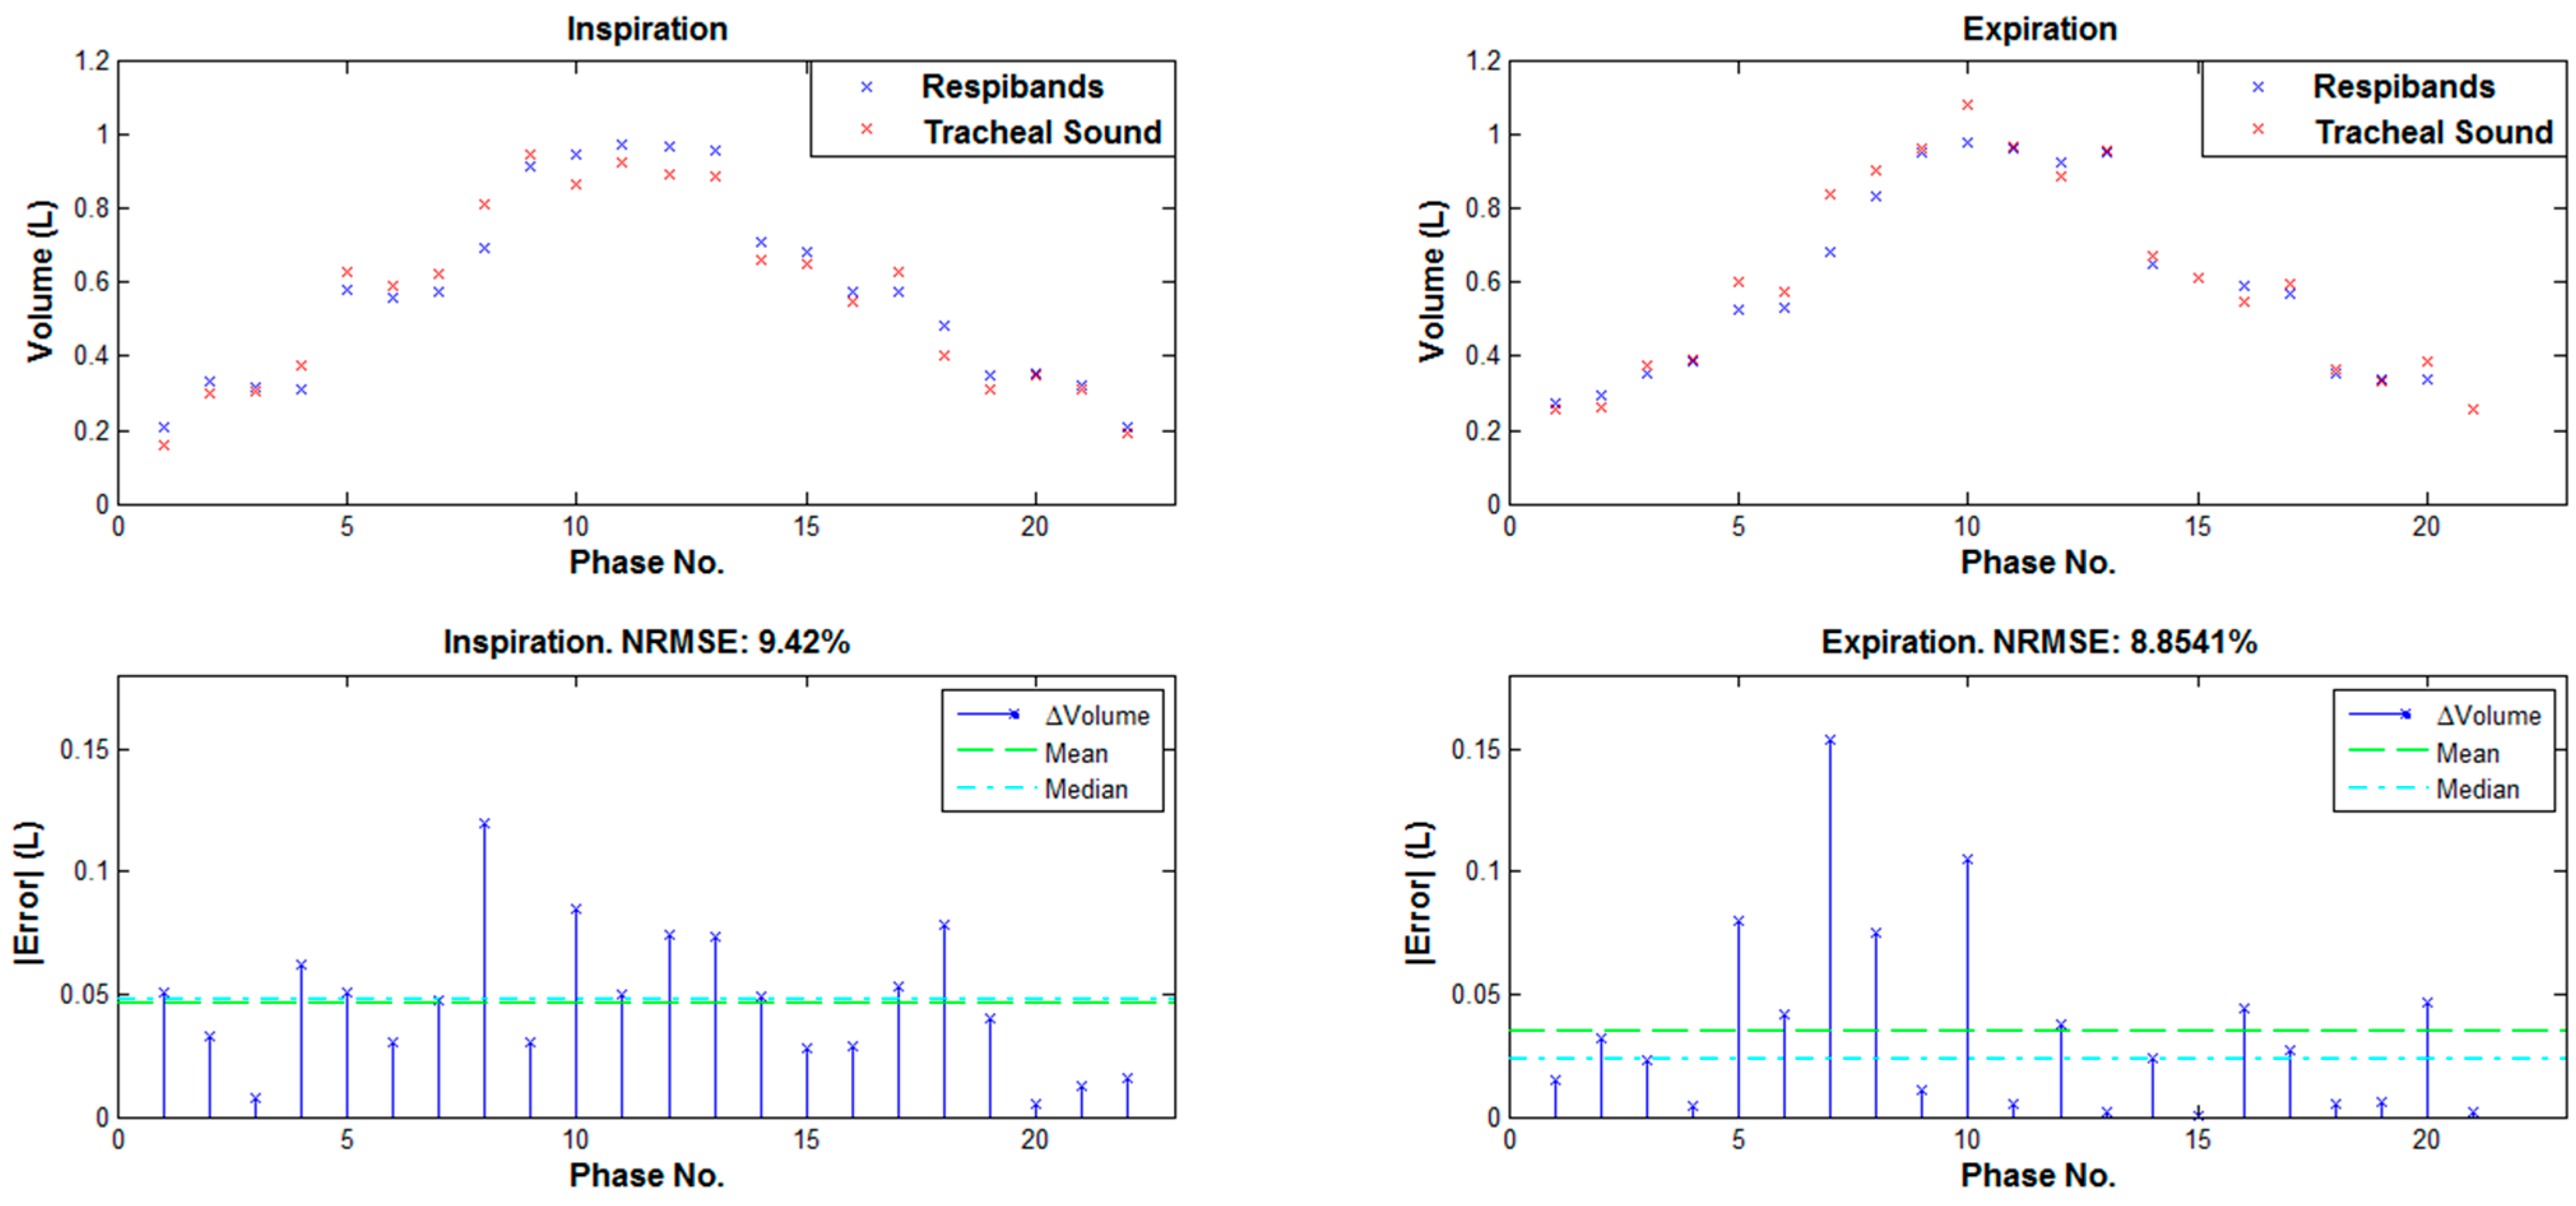
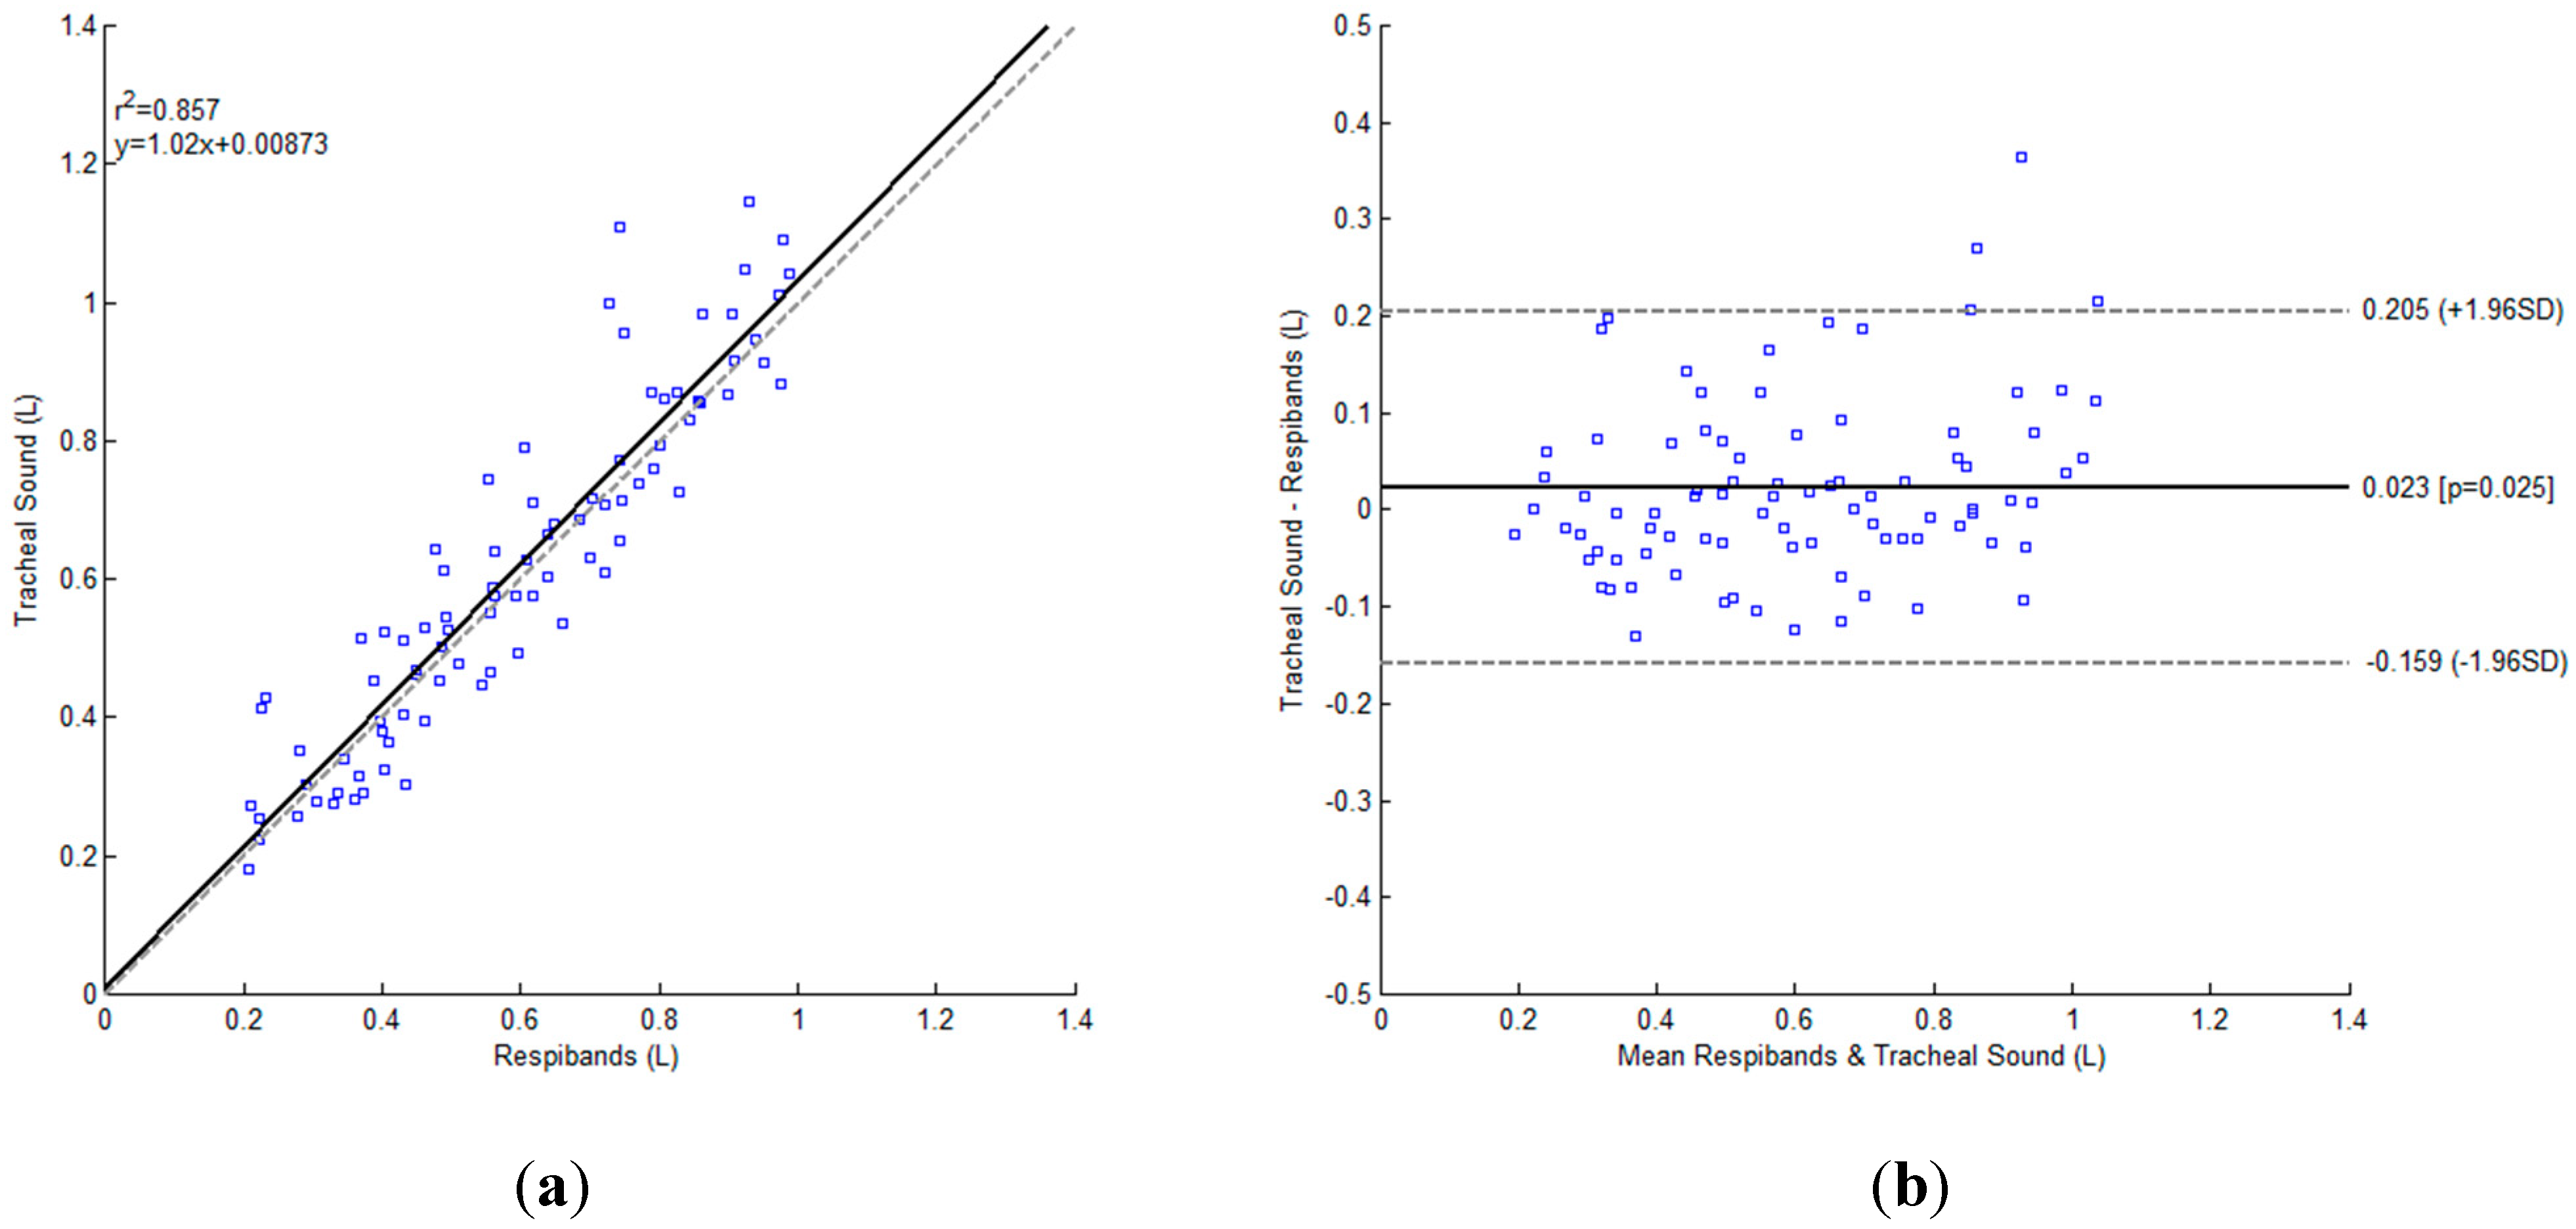
3. Results


| Type | Day | Conditions | p-value |
|---|---|---|---|
| BFD vs. SE | Test 4 | Exponential, tube, inspiration | 0.049 |
| Exponential, tube, expiration | 0.015 | ||
| Exponential, no tube, expiration | 0.011 | ||
| Linear, tube, inspiration | 0.037 | ||
| Linear, tube, expiration | 0.013 | ||
| Linear, no tube, expiration | 0.002 | ||
| Test 5 | Exponential, tube, expiration | 0.017 | |
| Linear, tube, expiration | 0.006 | ||
| Linear, no tube, expiration | 0.007 | ||
| Inspiration vs. Expiration | Test 1 | BFD, linear, tube | 0.033 |
| Test 4 | SE, linear, tube | 0.025 | |
| Test 5 | BFD, linear, tube | 0.022 | |
| SE, exponential, tube | 0.029 | ||
| SE, linear, tube | 0.031 | ||
| No tube vs. Tube | Training | SE, exponential, inspiration | 0.016 |
| Test 4 | BFD, linear, inspiration | 0.042 | |
| Test 5 | BFD, linear, inspiration | 0.033 | |
| Exponential vs. Linear | Training | BFD, tube, expiration | 0.008 |
| BFD, no tube, expiration | 0.038 | ||
| Test 4 | BFD, tube, expiration | 0.028 | |
| SE, tube, expiration | 0.018 | ||
| Test 5 | SE, tube, expiration | 0.028 |

4. Discussions and Conclusions
Acknowledgments
Author Contributions
Conflicts of Interest
References
- Sovijarvi, A.R.A.; Dalmasso, F.; Vanderschoot, J.; Malmberg, L.P.; Righini, G.; Stoneman, S.A.T. Definition of terms for applications of respiratory sounds. Eur. Respir. Rev. 2000, 10, 597–610. [Google Scholar]
- Moussavi, Z. Fundamentals of Respiratory Sounds and Analysis, 1st ed.; Morgan & Claypool Publishers: San Rafael, CA, USA, 2006. [Google Scholar]
- Sovijarvi, A.R.A.; Malmberg, L.P.; Charbonneau, G.; Vanderschoot, J.; Dalmasso, F.; Sacco, C.; Rossi, M.; Earis, J.E. Characteristics of breath sounds and adventitious respiratory sounds. Eur. Respir. Rev. 2000, 10, 591–596. [Google Scholar]
- Folke, M.; Cernerud, L.; Ekström, M.; Hök, B. Critical review of non-invasive respiratory monitoring in medical care. Med. Biol. Eng. Comput. 2003, 41, 377–383. [Google Scholar] [CrossRef] [PubMed]
- Kuratomi, Y.; Okazaki, N.; Ishihara, T.; Arai, T.; Kira, S. Variability of breath-by-breath tidal volume and its characteristics in normal and diseased subjects. Jpn. J. Med. 1985, 24, 141–149. [Google Scholar] [CrossRef] [PubMed]
- Chen, G.; de la Cruz, I.; Rodriguez-Villegas, E. Automatic lung tidal volumes estimation from tracheal sounds. In Proceedings of the 36th Annual International Conference of the IEEE Engineering in Medicine and Biology Society (EMBC), Chicago, IL, USA, 26–30 August 2014; pp. 1497–1500.
- Sherwood, L. Fundamentals of Human Physiology, 4th ed.; Cengage Learning: Boston, MA, USA, 2012. [Google Scholar]
- Semmes, B.J.; Tobin, M.J.; Snyder, J.V.; Grenvik, A. Subjective and objective measurement of tidal volume in critically ill patients. Chest 1985, 87, 577–579. [Google Scholar] [CrossRef] [PubMed]
- Grossman, P.; Spoerle, M.; Wilhelm, F.H. Reliability of respiratory tidal volume estimation by means of ambulatory inductive plethysmography. Biomed. Sci. Instrum. 2006, 42, 193–198. [Google Scholar] [PubMed]
- Sayadi, O.; Weiss, E.H.; Merchant, F.M.; Puppala, D.; Armoundas, A.A. An optimized method for estimating the tidal volume from intracardiac or body surface electrocardiographic signals: Implications for estimating minute ventilation. Am. J. Physiol. Heart Circ. Physiol. 2014, 307, H426–H436. [Google Scholar] [CrossRef] [PubMed]
- Corbishley, P.; Rodriguez-Villegas, E. Breathing detection: Towards a miniaturized, wearable, battery-operated monitoring system. IEEE Trans. Biomed. Eng. 2008, 55, 196–204. [Google Scholar] [CrossRef] [PubMed]
- Earis, J.E.; Cheetham, B.M.G. Future perspectives for respiratory sound research. Eur. Respir. Rev. 2000, 10, 641–646. [Google Scholar]
- Cala, S.J.; Kenyon, C.M.; Ferrigno, G.; Carnevali, P.; Aliverti, A.; Pedotti, A.; Macklem, P.T.; Rochester, D.F. Chest wall and lung volume estimation by optical reflectance motion analysis. J. Appl. Physiol. 1996, 81, 2680–2689. [Google Scholar] [PubMed]
- Petrovic, M.D.; Petrovic, J.; Danicic, A.; Vukcevic, M.; Bojovic, B.; Hadzievski, Lj.; Allsop, T.; Lloyd, G.; Webb, D.J. Non-invasive respiratory monitoring using long-period fiber grating sensors. Biomed. Opt. Express 2014, 5, 1136–1144. [Google Scholar] [CrossRef] [PubMed]
- Lee, Y.S.; Pathirana, P.N.; Steinfort, C.L.; Caelli, T. Monitoring and analysis of respiratory patterns using microwave doppler radar. IEEE J. Transl. Eng. Health Med. 2014, 2, 1–12. [Google Scholar]
- Scully, C.G.; Lee, J.; Meyer, J.; Gorbach, A.M.; Granquist-Fraser, D.; Mendelson, Y.; Chon, K.H. Physiological parameter monitoring from optical recordings with a mobile phone. IEEE Trans. Biomed. Eng. 2012, 59, 303–306. [Google Scholar] [CrossRef] [PubMed]
- Lee, J.; Reyes, B.A.; McManus, D.D.; Mathias, O.; Chon, K.H. Atrial fibrillation detection using an iPhone 4S. IEEE Trans. Biomed. Eng. 2013, 60, 203–206. [Google Scholar] [CrossRef] [PubMed]
- Reyes, B.A.; Reljin, N.; Chon, K.H. Tracheal sounds acquisition using smartphones. Sensors 2014, 14, 13830–13850. [Google Scholar] [CrossRef] [PubMed]
- Ahlstrom, C.; Johansson, A.; Hult, P.; Ask, P. Chaotic dynamics of respiratory sounds. Chaos Solitons Fractals 2006, 29, 1054–1062. [Google Scholar] [CrossRef]
- Yap, Y.L.; Moussavi, Z. Respiratory onset detection using variance fractal dimension. In Proceedings of 23rd Annual International Conference of the IEEE Engineering in Medicine and Biology Society, Istanbul, Turkey, 25–28 October 2001; pp. 1554–1556.
- Gnitecki, J.; Moussavi, Z. Variance fractal dimension trajectory as a tool for heart sound localization in lung sounds recordings. In Proceedings of 25th Annual International Conference of the IEEE Engineering in Medicine and Biology Society, Cancun, Mexico, 17–21 September 2003; pp. 2420–2423.
- Hadjileontiadis, L.J.; Rekanos, I.T. Detection of explosive lung and bowel sounds by means of fractal dimension. IEEE Signal Process. Lett. 2003, 10, 311–314. [Google Scholar] [CrossRef]
- Gnitecki, J.; Moussavi, Z. The fractality of lung sounds: A comparison of three waveform fractal dimension algorithms. Chaos Solitons Fractals 2005, 26, 1065–1072. [Google Scholar] [CrossRef]
- Hadjileontiadis, L.J. A novel technique for denoising explosive lung sounds: Empirical mode decomposition and fractal dimension filter. IEEE Eng. Med. Biol. Mag. 2007, 26, 30–39. [Google Scholar] [CrossRef] [PubMed]
- Charleston-Villalobos, S.; Albuerne-Sanchez, L.; Gonzalez-Camarena, R.; Mejia-Avila, M.; Carrillo-Rodriguez, G.; Aljama-Corrales, T. Linear and nonlinear analysis of base lung sound in extrinsic allergic alveolitis patients in comparison to healthy subjects. Methods Inf. Med. 2013, 52, 266–276. [Google Scholar] [CrossRef] [PubMed]
- Druzgalski, C.K.; Donnerberg, R.L.; Campbell, R.M. Techniques of recording respiratory sounds. J. Clin. Eng. 1980, 5, 321–330. [Google Scholar] [CrossRef]
- Pasterkamp, H.; Kraman, S.S.; Wodicka, G.R. Respiratory sounds: Advances beyond the stethoscope. Am. J. Respir. Crit. Care Med. 1997, 156, 974–987. [Google Scholar] [CrossRef] [PubMed]
- Charleston-Villalobos, S.; Martinez-Hernandez, G.; Gonzalez-Camarena, R.; Chi-Lem, G.; Carrillo, J.G.; Aljama-Corrales, T. Assessment of multichannel lung sounds parameterization for two-class classification in interstitial lung disease patients. Comput. Biol. Med. 2011, 41, 473–482. [Google Scholar] [CrossRef] [PubMed]
- Reichert, S.; Gass, R.; Brandt, C.; Andres, E. Analysis of respiratory sounds: State of the art. Clin. Med. Insights Circ. Respir. Pulm. Med. 2008, 2, 45–58. [Google Scholar]
- Papoulis, A.; Pillai, S.U. Probability, Random Variables, and Stochastic Processes; McGraw-Hill: New York, NY, USA, 2002. [Google Scholar]
- Yadollahi, A.; Moussavi, Z.M.K. A robust method for heart sounds localization using lung sounds entropy. IEEE Trans. Biomed. Eng. 2006, 53, 497–502. [Google Scholar] [CrossRef] [PubMed]
- Parzen, E. On estimation of a probability density function and mode. Ann. Math. Stat. 1962, 33, 1065–1076. [Google Scholar] [CrossRef]
- Duda, R.O.; Hart, P.E.; Stork, D.G. Pattern Classification, 2nd ed.; Wiley-Interscience: New York, NY, USA, 2000. [Google Scholar]
- Mandelbrot, B.B. How long is the coast of Britain? Statistical self-similarity and fractional dimension. Science 1967, 156, 636–638. [Google Scholar] [CrossRef] [PubMed]
- Mandelbrot, B.B. Stochastic models for the Earth’s relief, the shape and the fractal dimension of the coastlines, and the number-area rule for islands. Proc. Natl. Acad. Sci. 1975, 72, 3825–3828. [Google Scholar] [CrossRef] [PubMed]
- Mandelbrot, B.B. The Fractal Geometry of Nature; W. H. Freeman and Company: New York, NY, USA, 1982. [Google Scholar]
- Peitgen, H.-O.; Juergens, H.; Saupe, D. Chaos and Fractals, 2nd ed.; Springer: New York, NY, USA, 2004. [Google Scholar]
- Peleg, S.; Naor, J.; Hartley, R.; Avnir, D. Multiple resolution texture analysis and classification. IEEE Trans. Pattern Anal. Mach. Intell. 1984, PAMI-6, 518–523. [Google Scholar] [CrossRef]
- Paskas, M.P.; Gavrovska, A.M.; Reljin, N.B. Identification of fundamental heart sounds from PCG using blanket fractal dimension. In Proceedings of the 8th Conference of the European Study Group on Cardiovascular Oscillations, Trento, Italy, 25–28 May 2014; pp. 123–124.
- Turner, M.J.; Blackledge, J.M. Analysis of the limitations of fractal dimension texture segmentation for image characterisation. In Fractal Geometry: Mathematical Methods, Algorithms, Applications; Blackledge, J.M., Evans, A.K., Turner, M.J., Eds.; Horwood Publishing Limited: Chichester, England, 2002; pp. 114–137. [Google Scholar]
- Yadollahi, A.; Moussavi, Z.M.K. A robust method for estimating respiratory flow using tracheal sounds entropy. IEEE Trans. Biomed. Eng. 2006, 53, 662–668. [Google Scholar] [CrossRef] [PubMed]
- Que, C.-L.; Kolmaga, C.; Durand, L.-G.; Kelly, S.M.; Macklem, P.T. Phonospirometry for noninvasive measurement of ventilation: Methodology and preliminary results. J. Appl. Physiol. 2002, 93, 1515–1526. [Google Scholar] [CrossRef] [PubMed]
© 2015 by the authors; licensee MDPI, Basel, Switzerland. This article is an open access article distributed under the terms and conditions of the Creative Commons Attribution license (http://creativecommons.org/licenses/by/4.0/).
Share and Cite
Reljin, N.; Reyes, B.A.; Chon, K.H. Tidal Volume Estimation Using the Blanket Fractal Dimension of the Tracheal Sounds Acquired by Smartphone. Sensors 2015, 15, 9773-9790. https://doi.org/10.3390/s150509773
Reljin N, Reyes BA, Chon KH. Tidal Volume Estimation Using the Blanket Fractal Dimension of the Tracheal Sounds Acquired by Smartphone. Sensors. 2015; 15(5):9773-9790. https://doi.org/10.3390/s150509773
Chicago/Turabian StyleReljin, Natasa, Bersain A. Reyes, and Ki H. Chon. 2015. "Tidal Volume Estimation Using the Blanket Fractal Dimension of the Tracheal Sounds Acquired by Smartphone" Sensors 15, no. 5: 9773-9790. https://doi.org/10.3390/s150509773
APA StyleReljin, N., Reyes, B. A., & Chon, K. H. (2015). Tidal Volume Estimation Using the Blanket Fractal Dimension of the Tracheal Sounds Acquired by Smartphone. Sensors, 15(5), 9773-9790. https://doi.org/10.3390/s150509773