3.2. Detection Result of Human Area
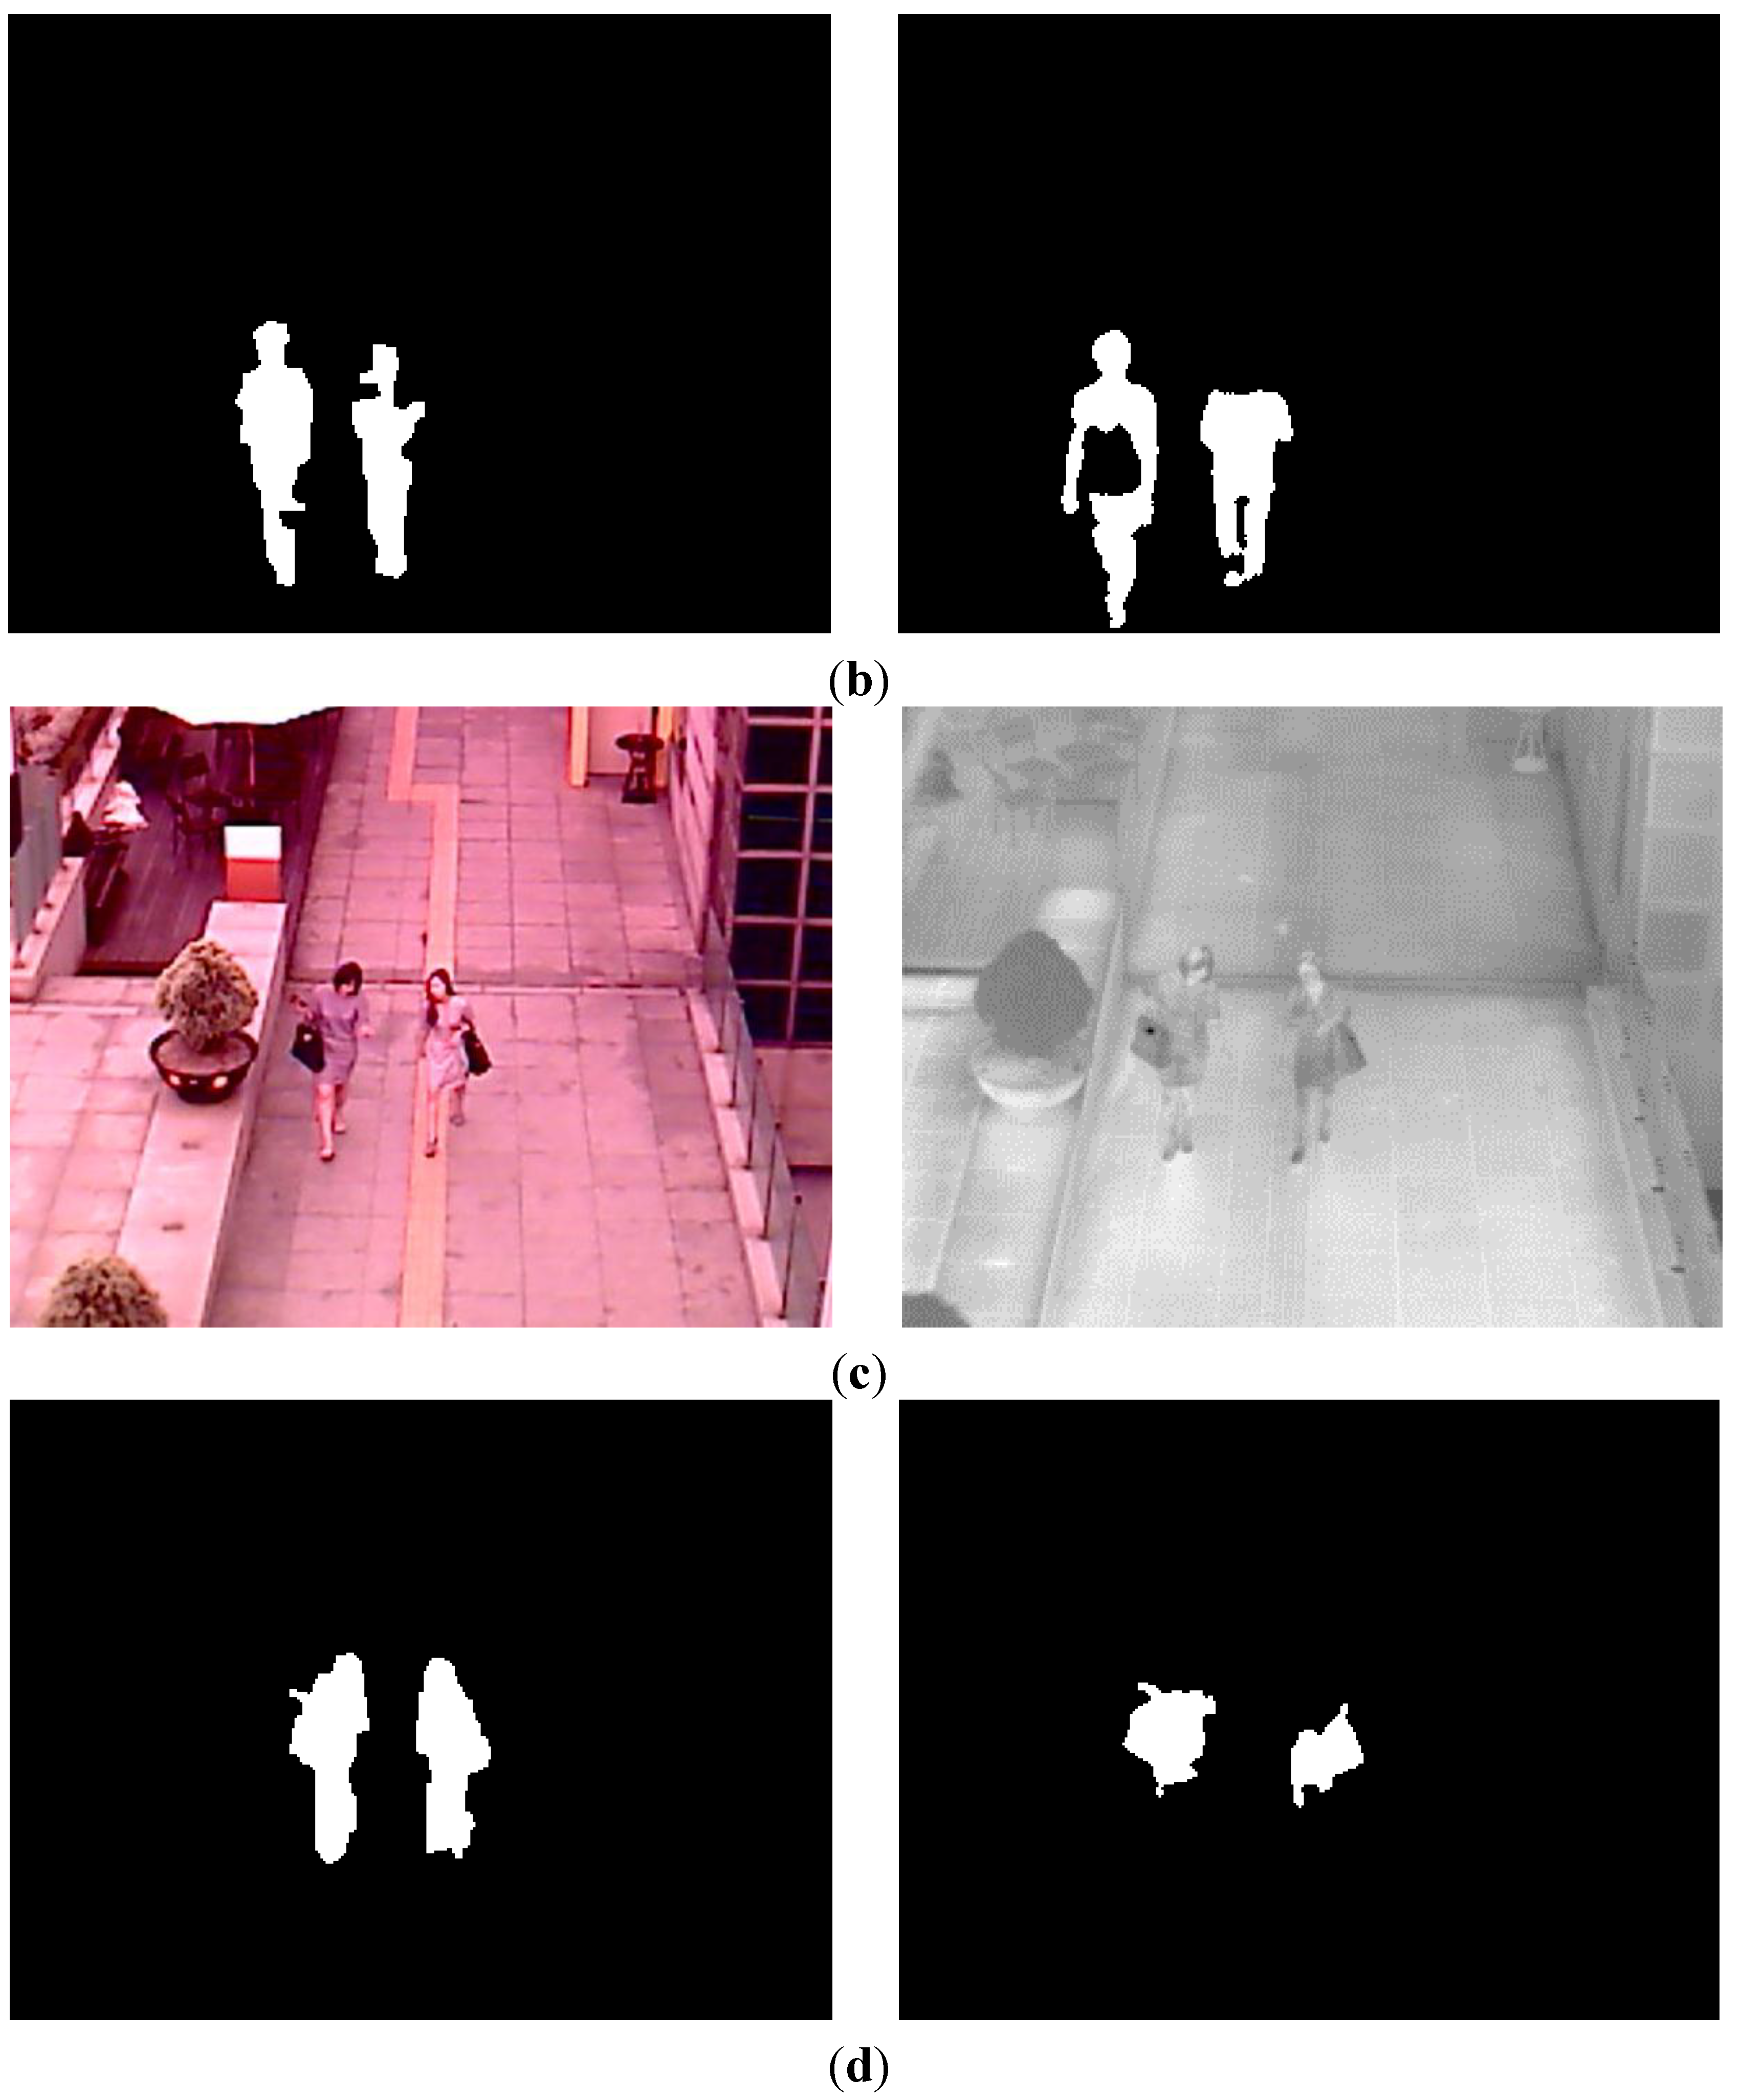
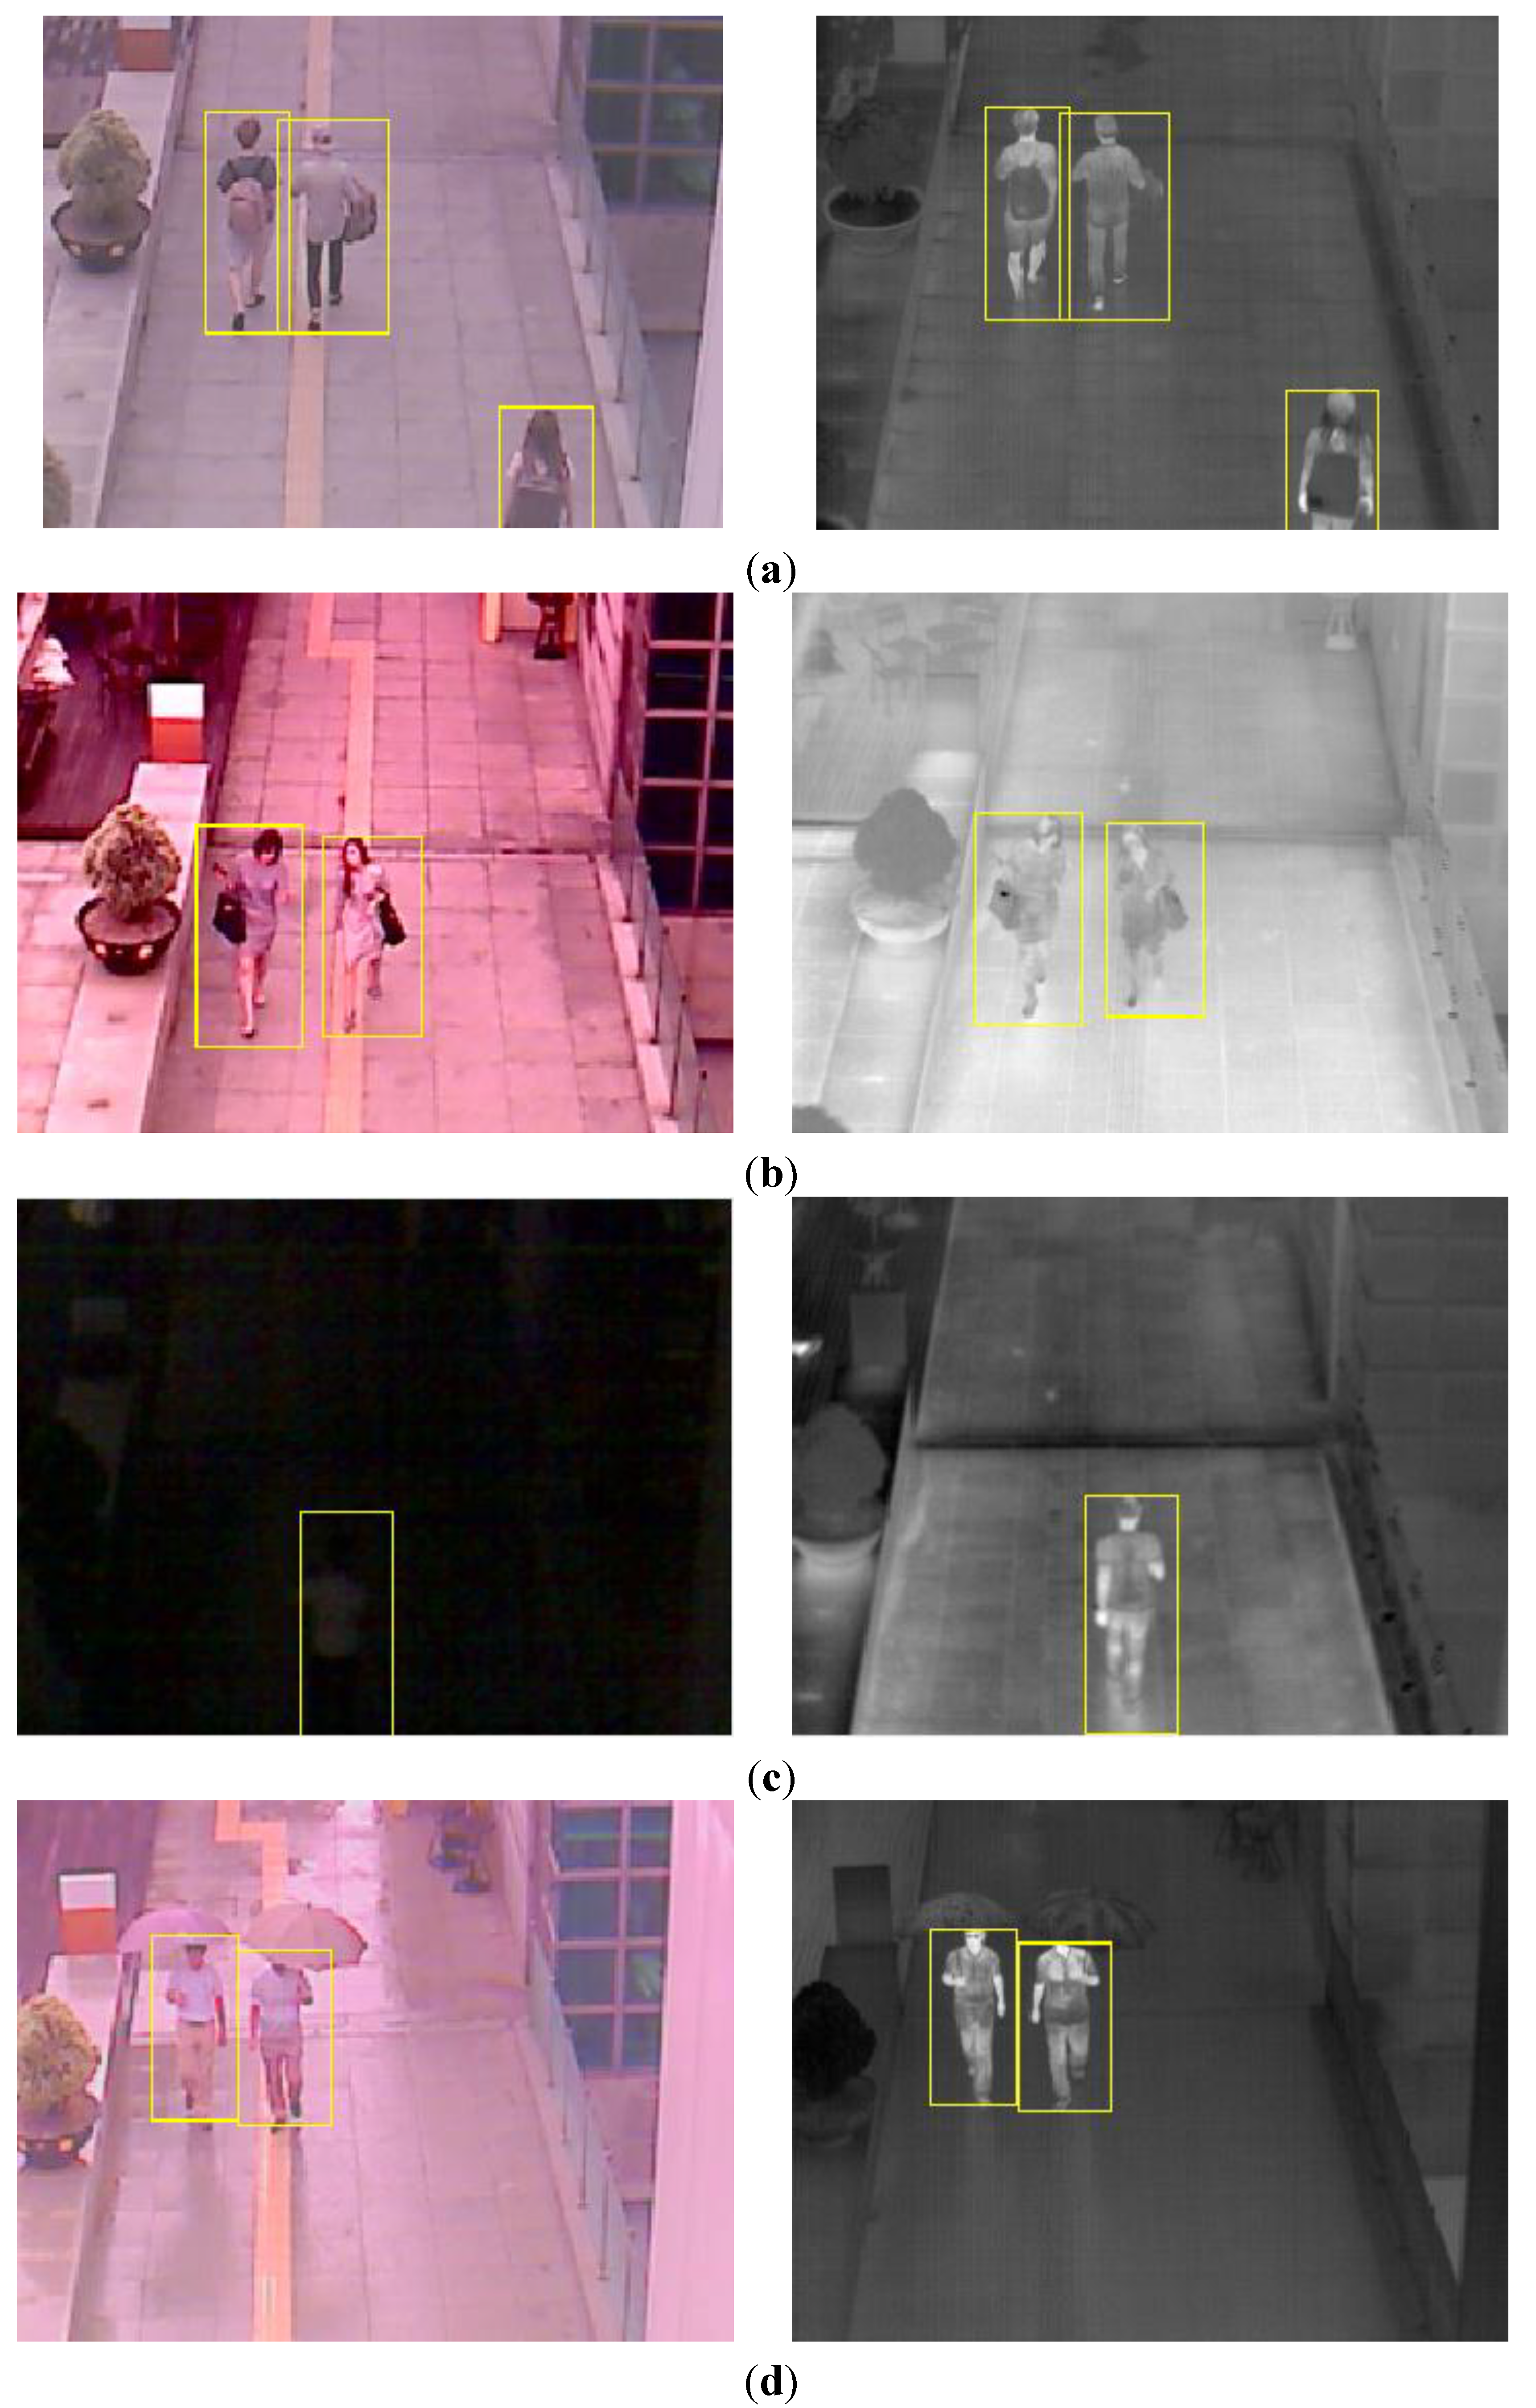
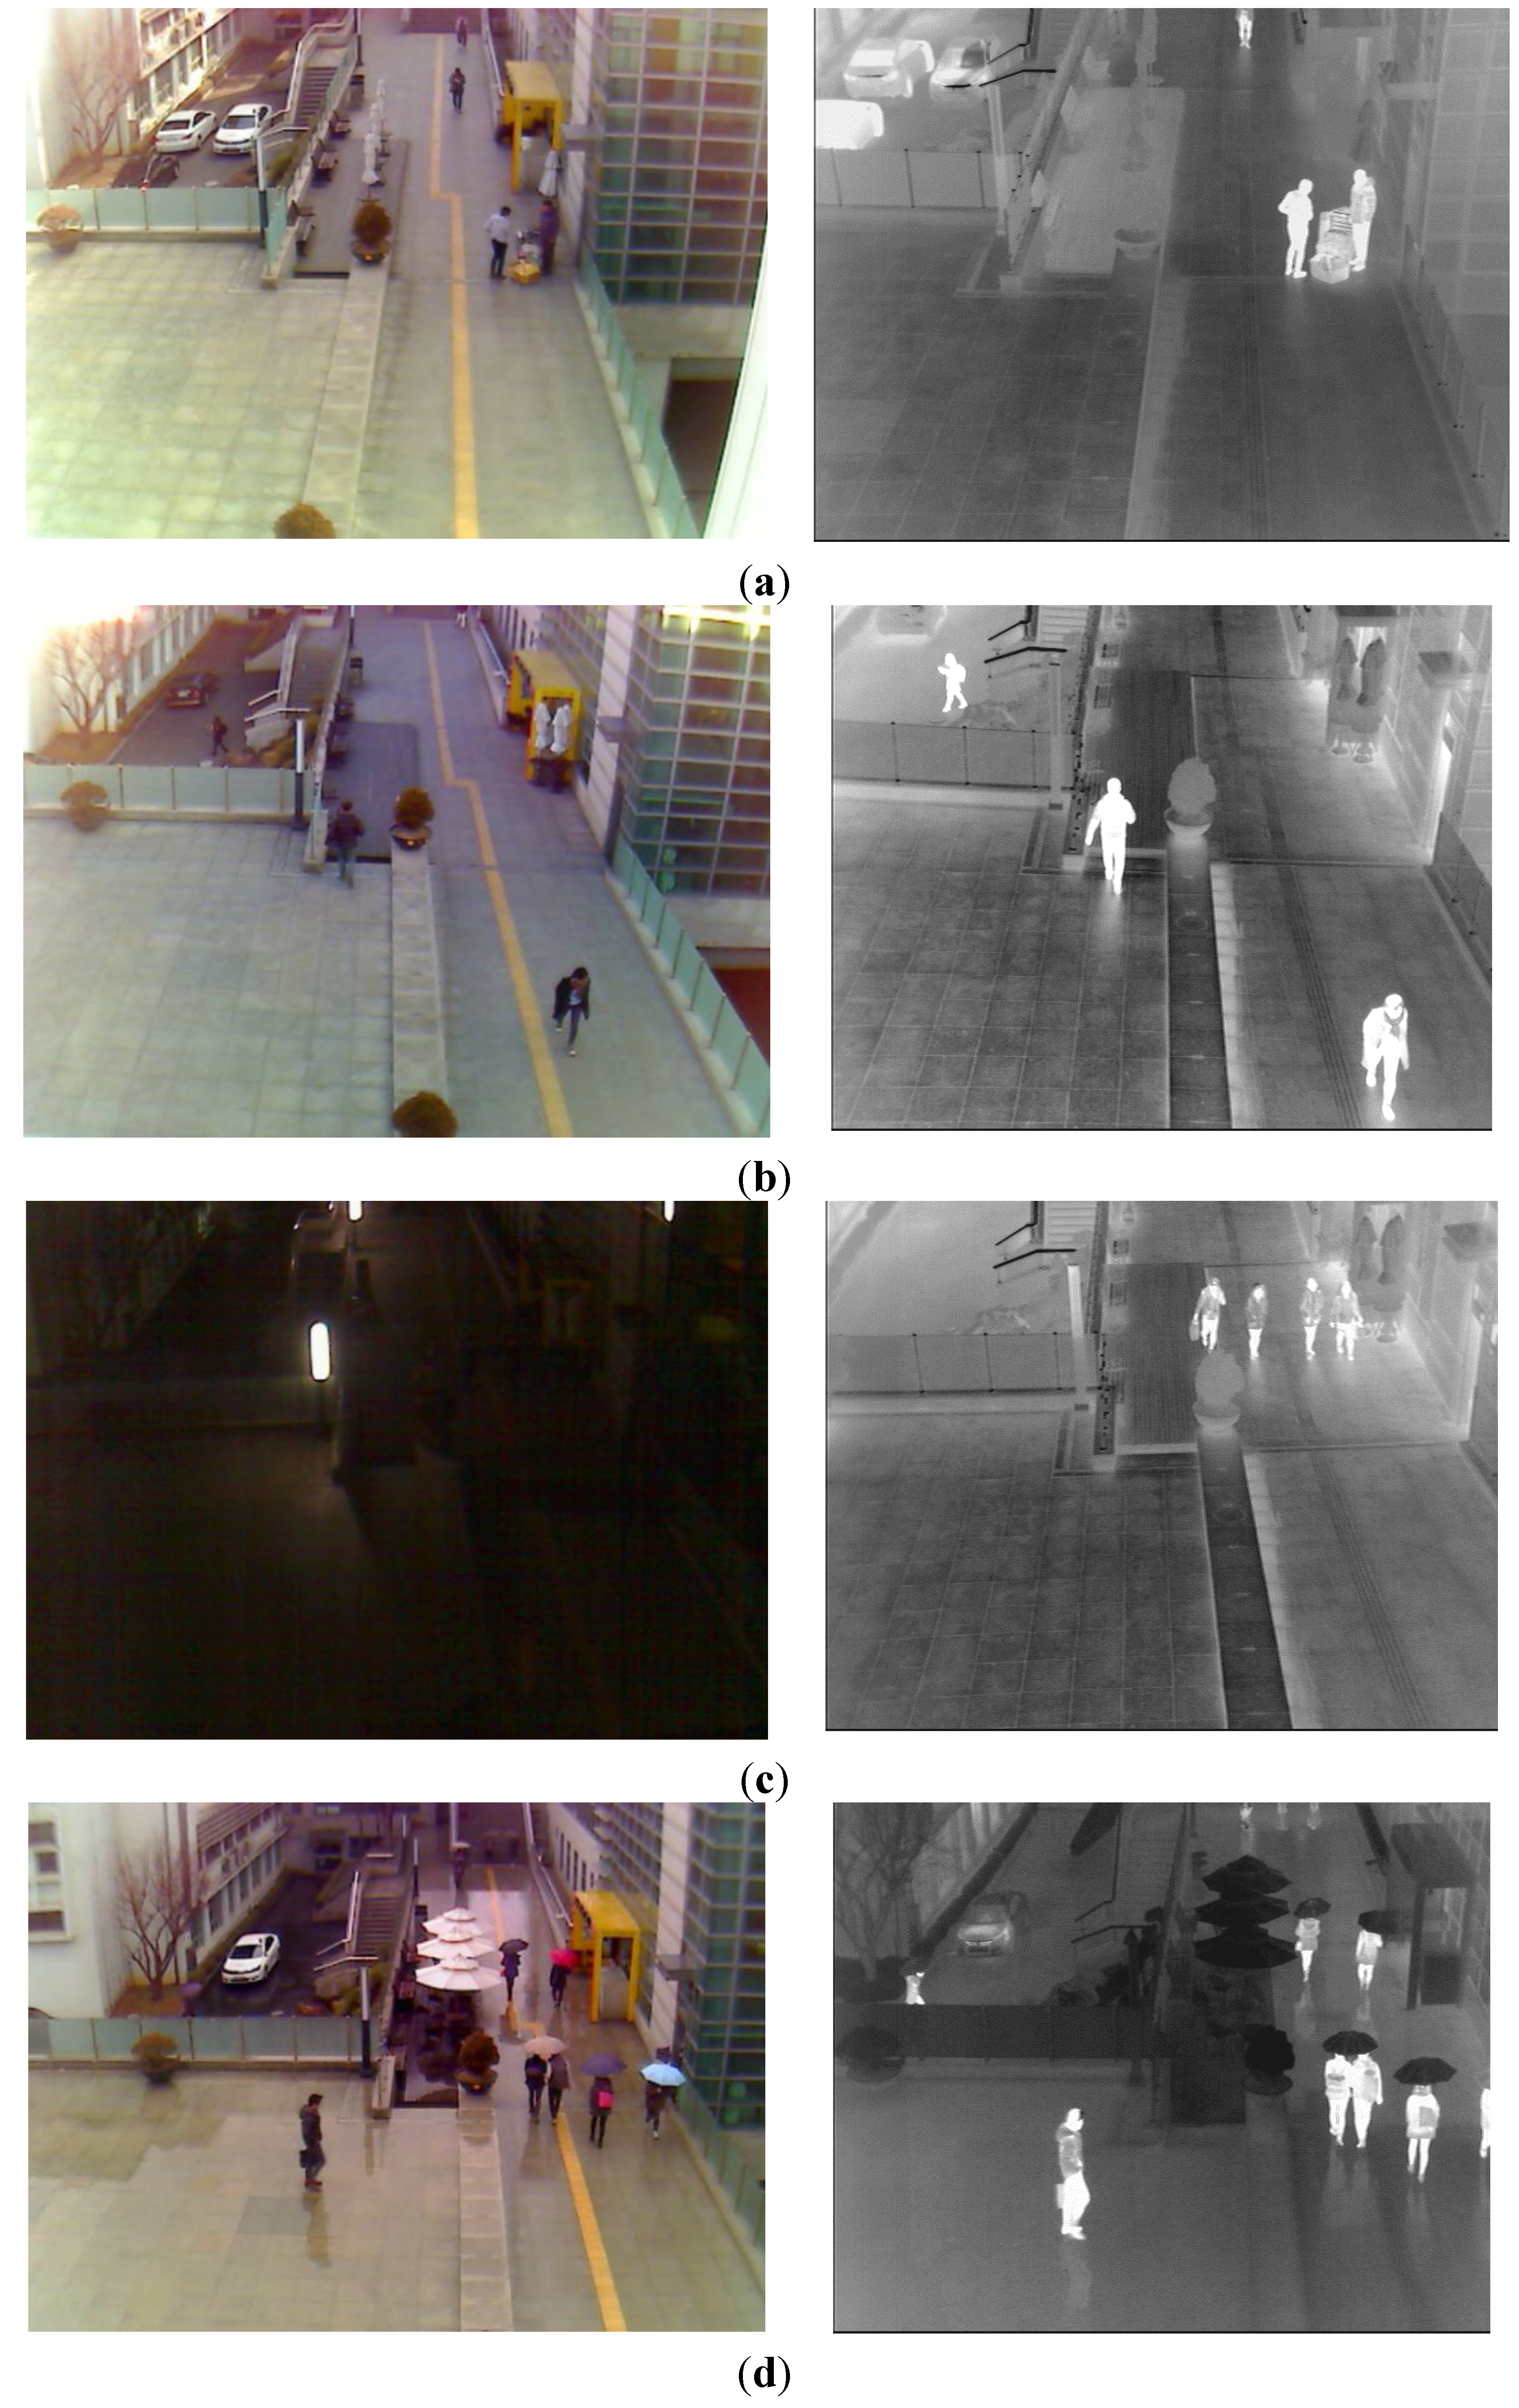
As the next experiment, we measured the accuracies of human detection. Some examples of human detection are shown in
Figure 12. In each
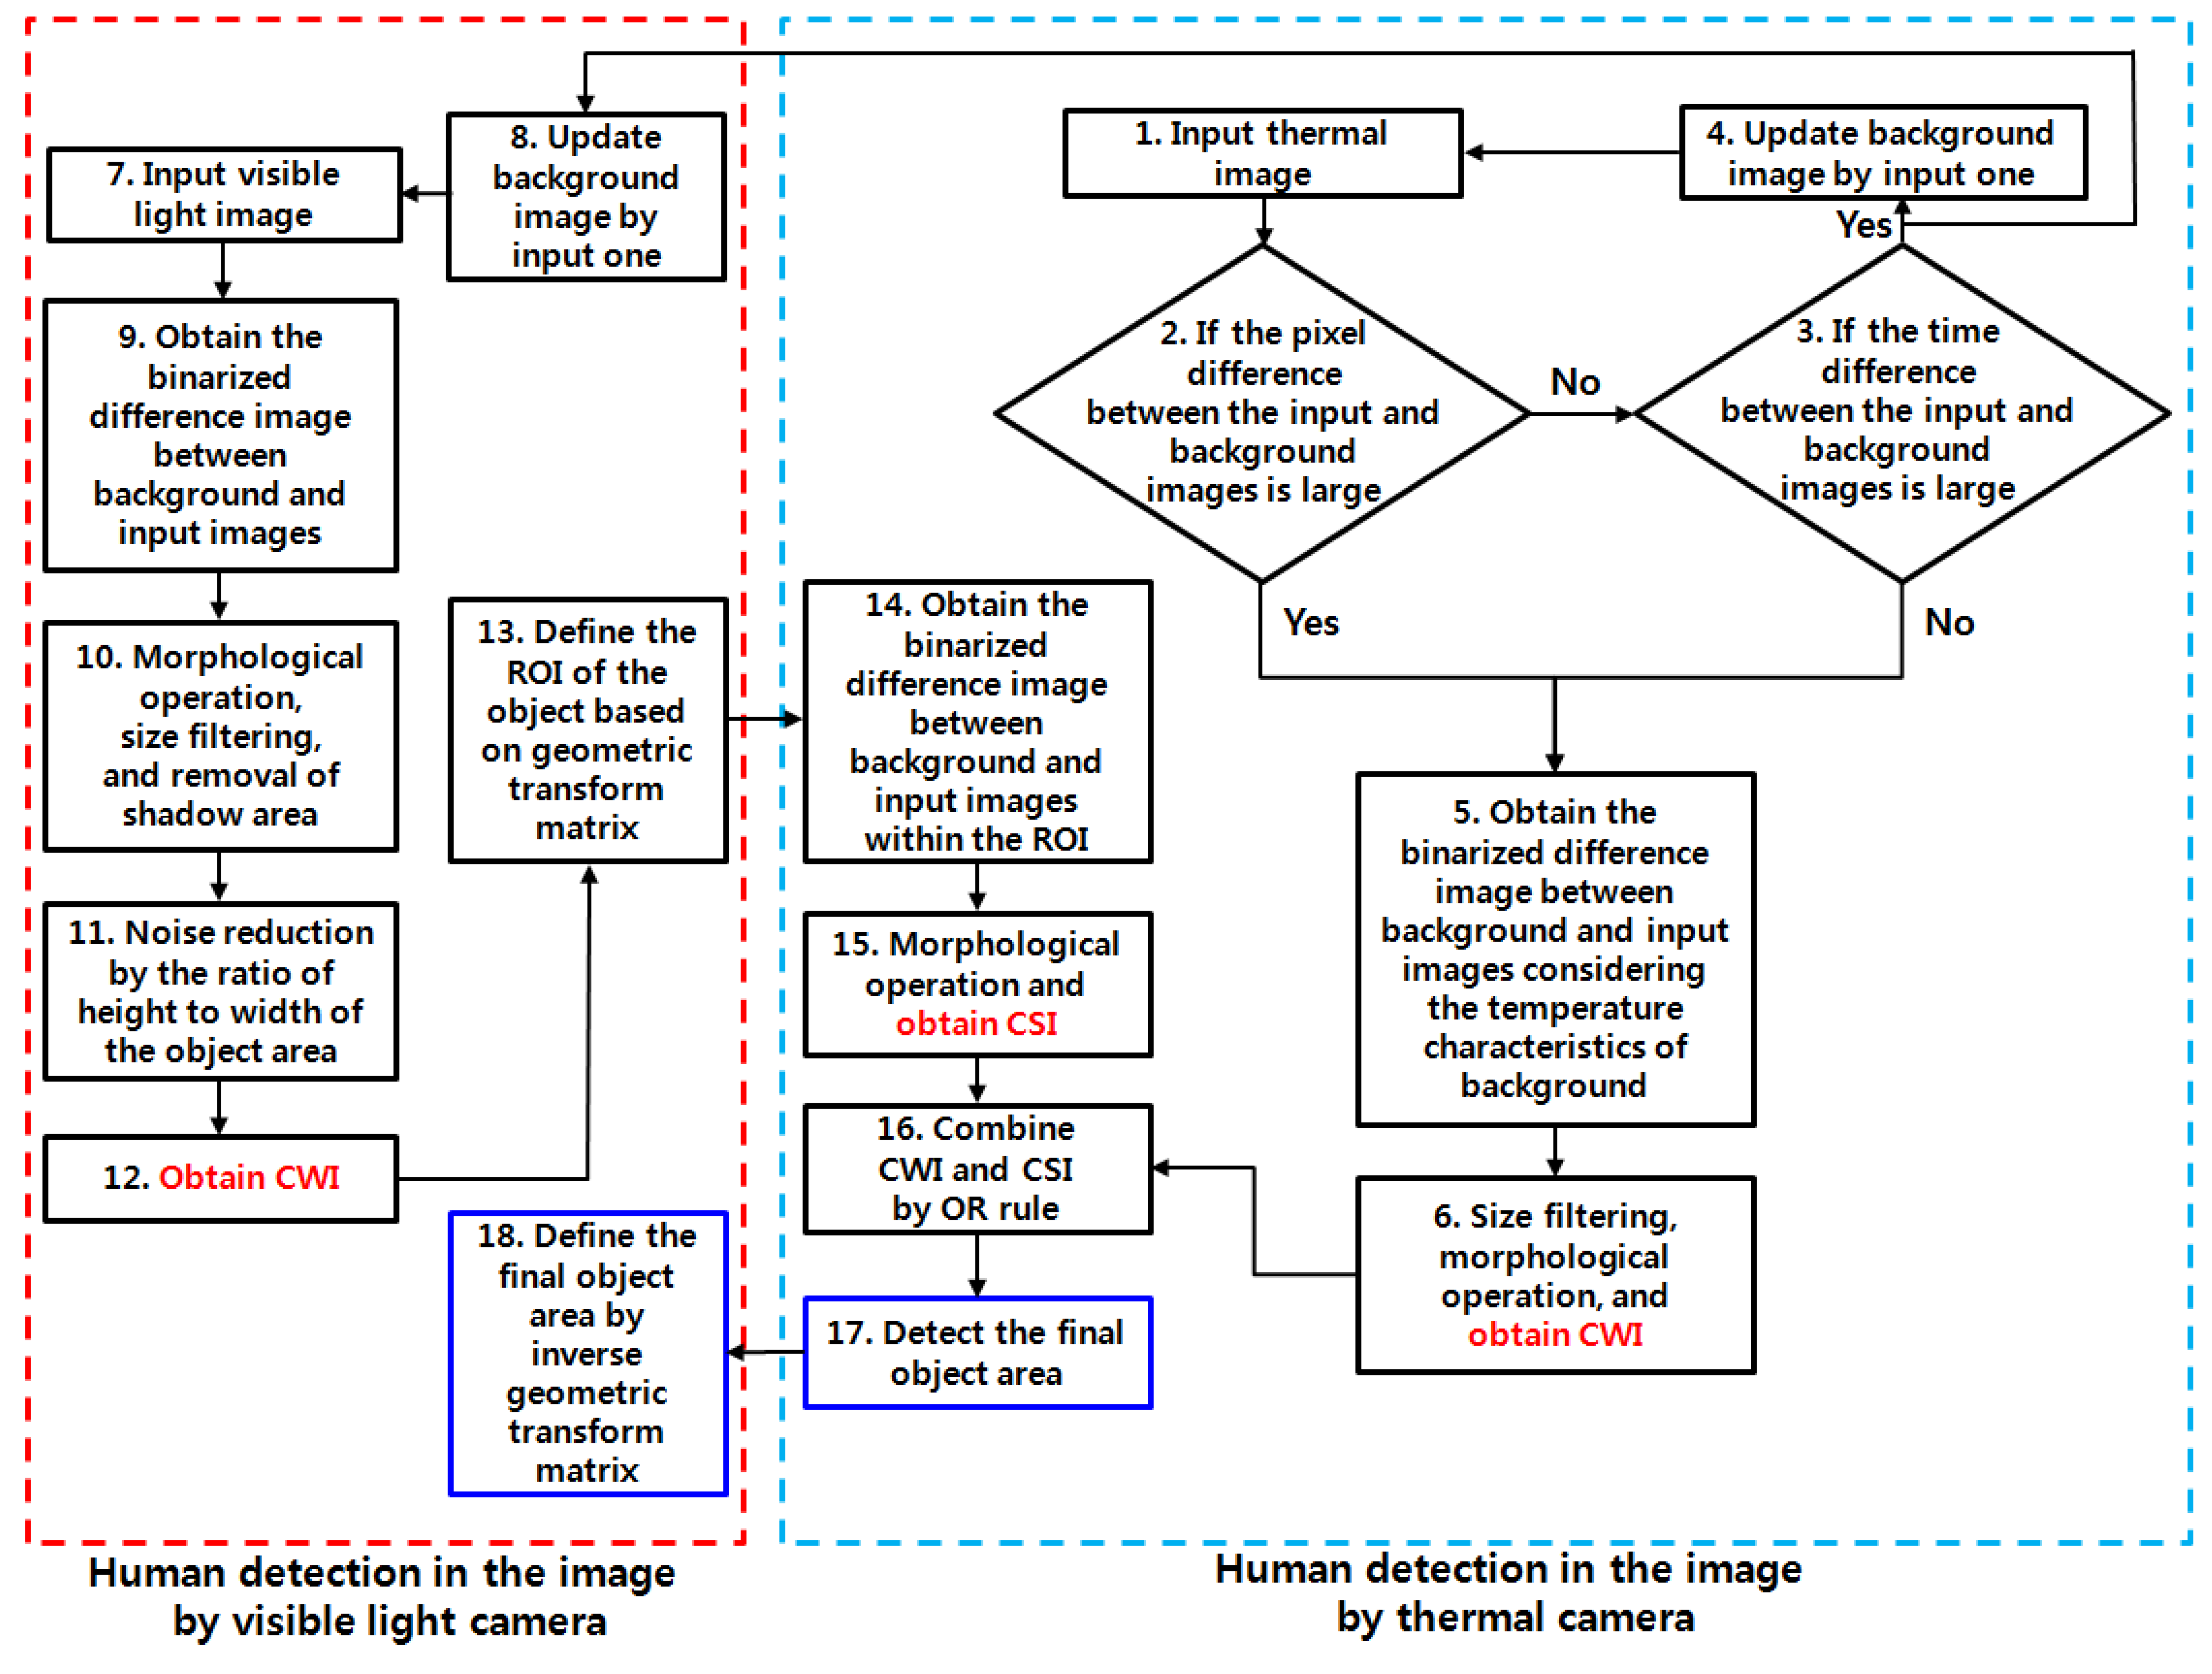
Figure 12a–d, the detected boxes of the left figure (visible light image) are shown by the inverse geometric transform matrix and the detected results of thermal image as shown in the Step (18) of
Figure 3. As shown in
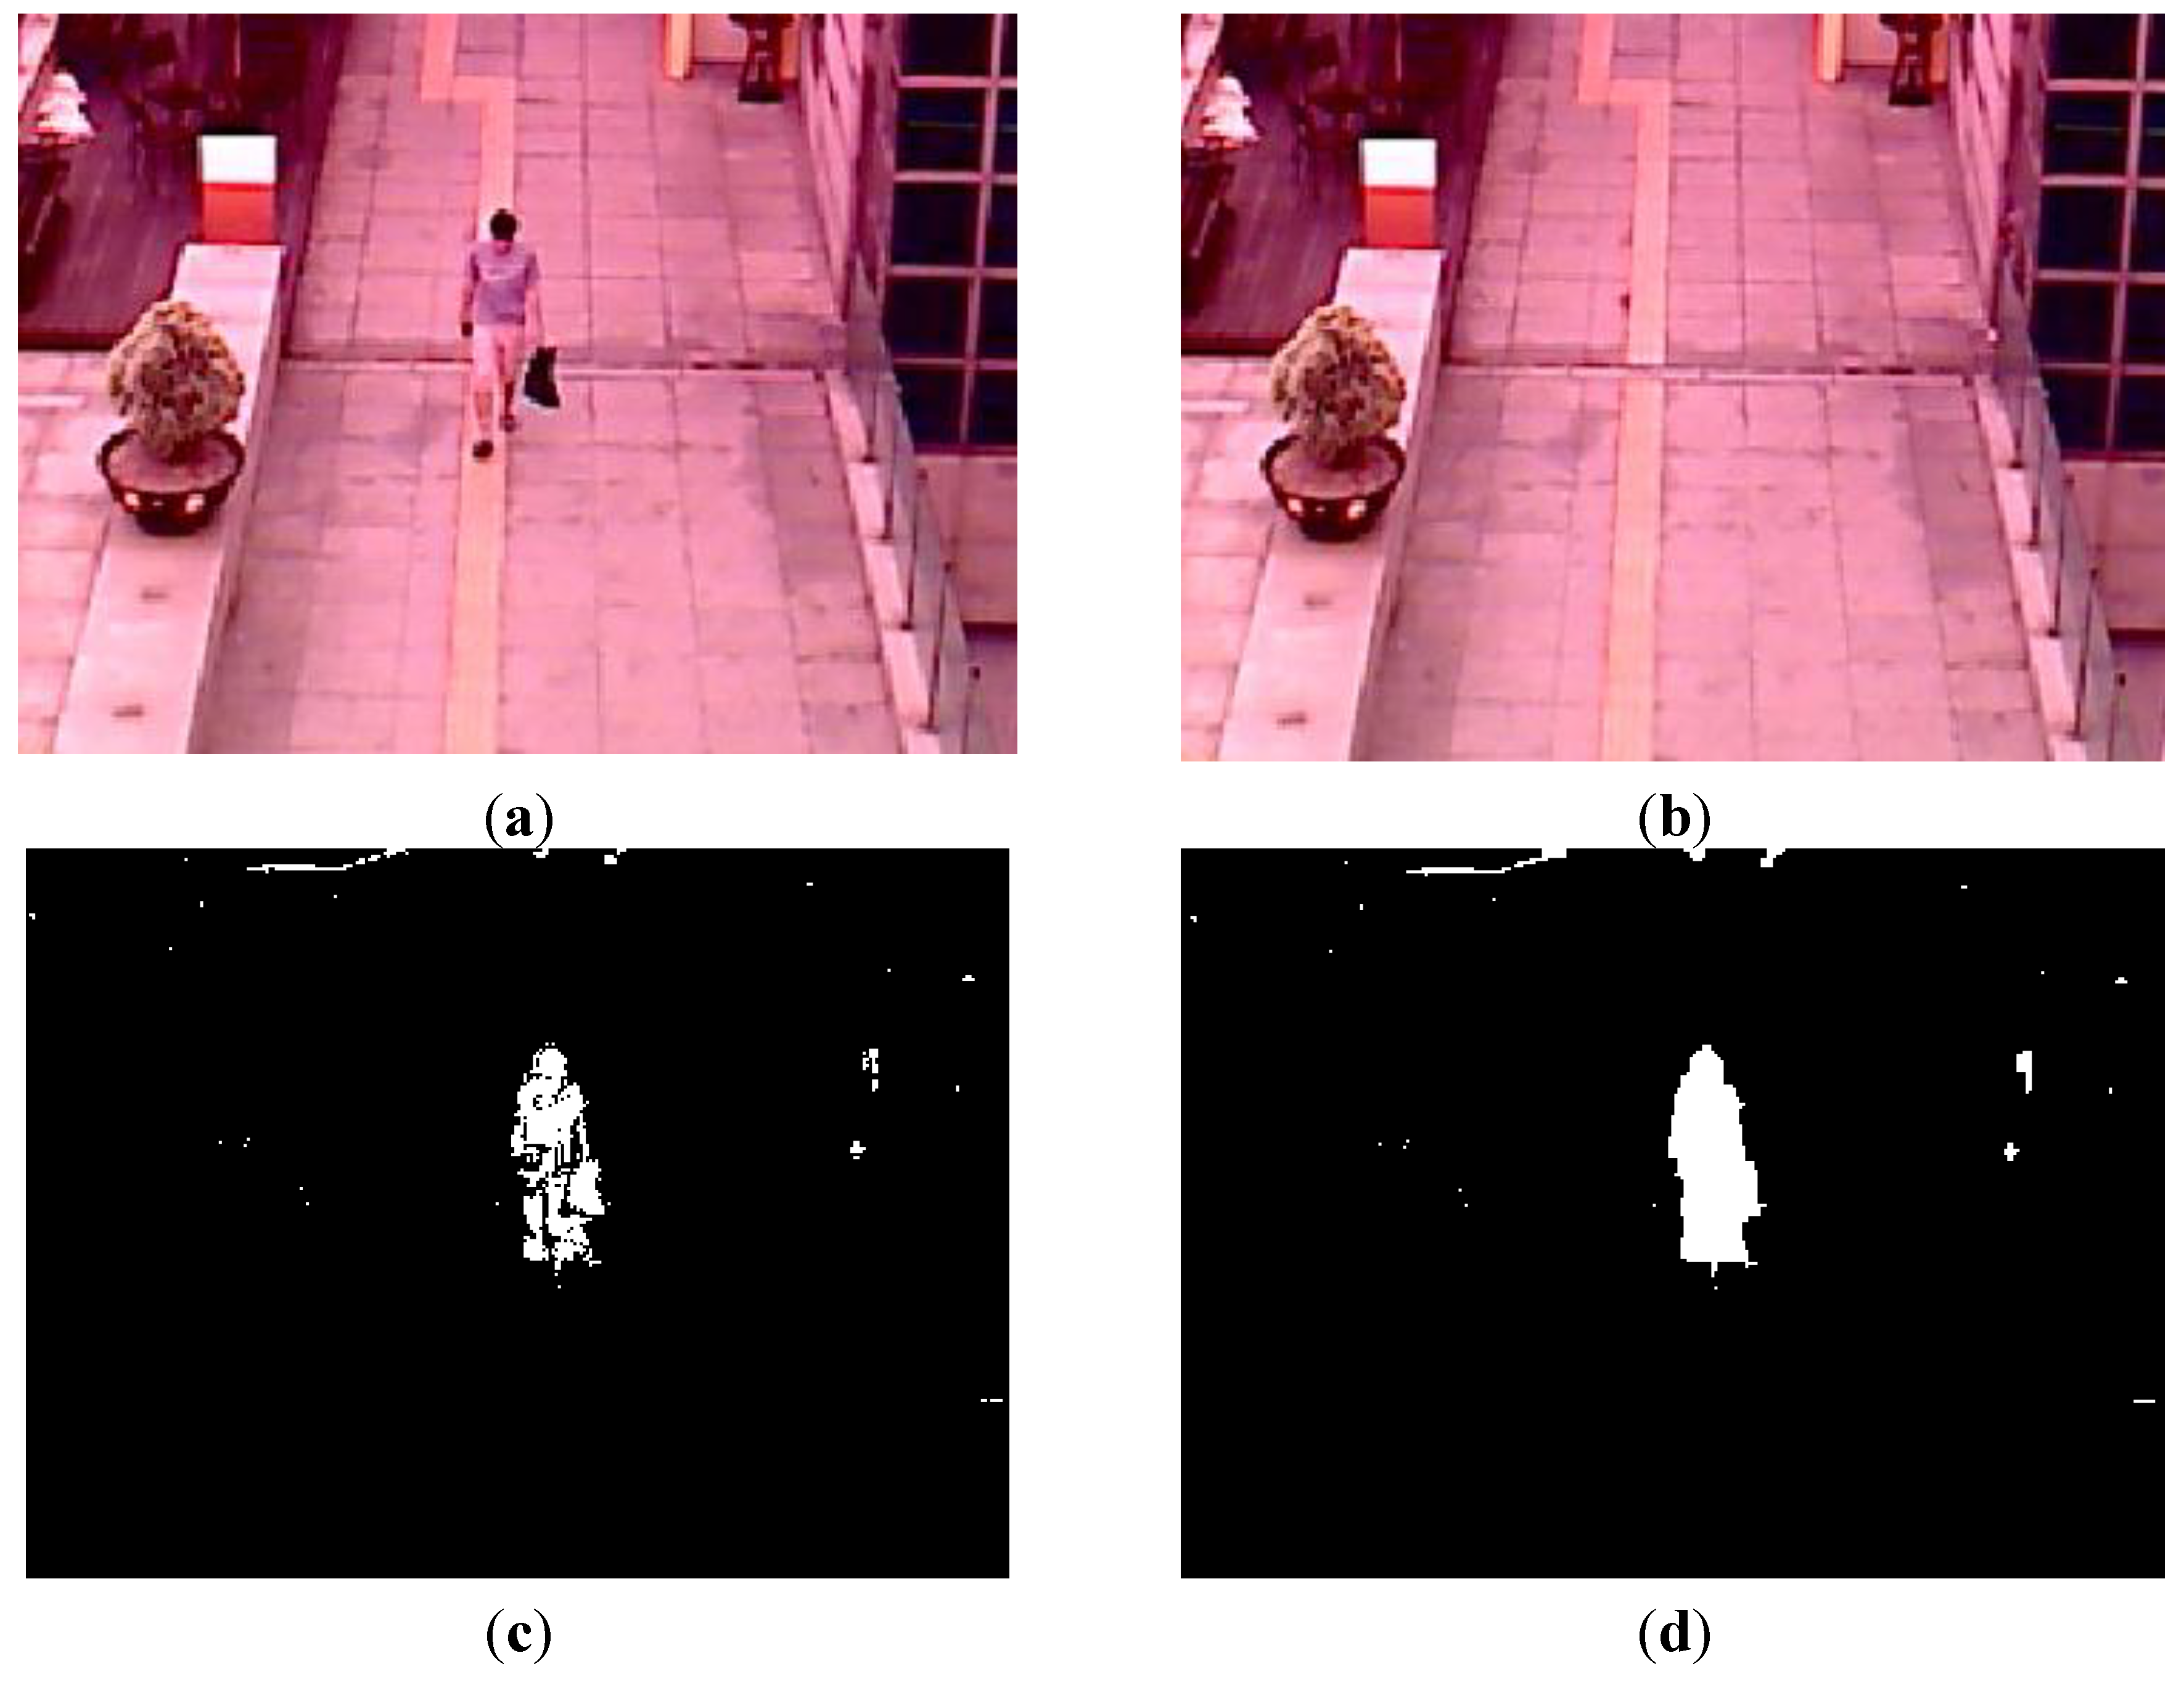
Figure 12, we can find that our system detects humans in various environments. Even in the case when the human is not seen in the image by the visible light camera at night as shown in the left image of
Figure 12c, our system can detect the human area successfully.
Figure 12.
Example of detection results in various environments. (a) Detection result in the morning; (b) Detection result in the afternoon; (c) Detection result at night; (d) Detection result on a rainy day.
Figure 12.
Example of detection results in various environments. (a) Detection result in the morning; (b) Detection result in the afternoon; (c) Detection result at night; (d) Detection result on a rainy day.
As the next experiment, we quantitatively measured the accuracy of human detection. For this, the bounding boxes of the human areas were manually depicted in the images as ground truth regions. The detection results were evaluated based on Pascal Criteria [
13,
35], which determine the true or false positives by calculating the overlap of the bounding box and a ground truth box as shown in Equation (10).
where
denotes the box detected by our system.
is the ground truth box.
denotes the intersection of
and
.
is their union [
35].
Based on Equation (9), we obtain the true positive (TP) and false positive (FP) of the detection. The TP is the case that the human region is correctly located as a human. The FP is the case that the background region is incorrectly located as a human. We quantitatively measured the accuracies of the human detection based on precision and recall as shown in Equations (11) and (12) [
8,
36].
where #TP, #FP and #human regions in all the images show the number of TP cases, FP cases, and human regions in all the images, respectively. As shown in Equations (11) and (12), the maximum and minimum values of both precision and recall are 1 and 0, respectively. The higher values (closed to 1) represent a higher accuracy of human detection. In
Table 4, we can see that the accuracies of human detection in our system are high for various environments. However, the recall at night is comparatively lower than that of the other cases because no information from visible light image can be obtained, as shown in the left image of
Figure 12c.
Table 4.
Detection results using dual camera systems.
Table 4.
Detection results using dual camera systems.
| Environment | #Frame | #People | #TP | #FP | Recall (%) | Precision (%) |
|---|
| Morning | 500 | 899 | 786 | 15 | 87.43 | 98.13 |
| Afternoon | 500 | 730 | 677 | 5 | 92.74 | 99.27 |
| Night | 500 | 698 | 561 | 27 | 80.37 | 95.41 |
| Rainy day | 500 | 559 | 544 | 2 | 97.32 | 99.63 |
| Total | 2000 | 2886 | 2568 | 49 | 88.98 | 98.13 |
In addition, we compared the accuracies of our system of dual cameras with those of only visible light or thermal cameras; the results are shown in
Table 4,
Table 5 and
Table 6. As shown in
Table 4,
Table 5 and
Table 6, the accuracies of our system are much higher than those of only visible light or thermal cameras for all the cases, namely, mornings, afternoons, nights, and rainy days.
In
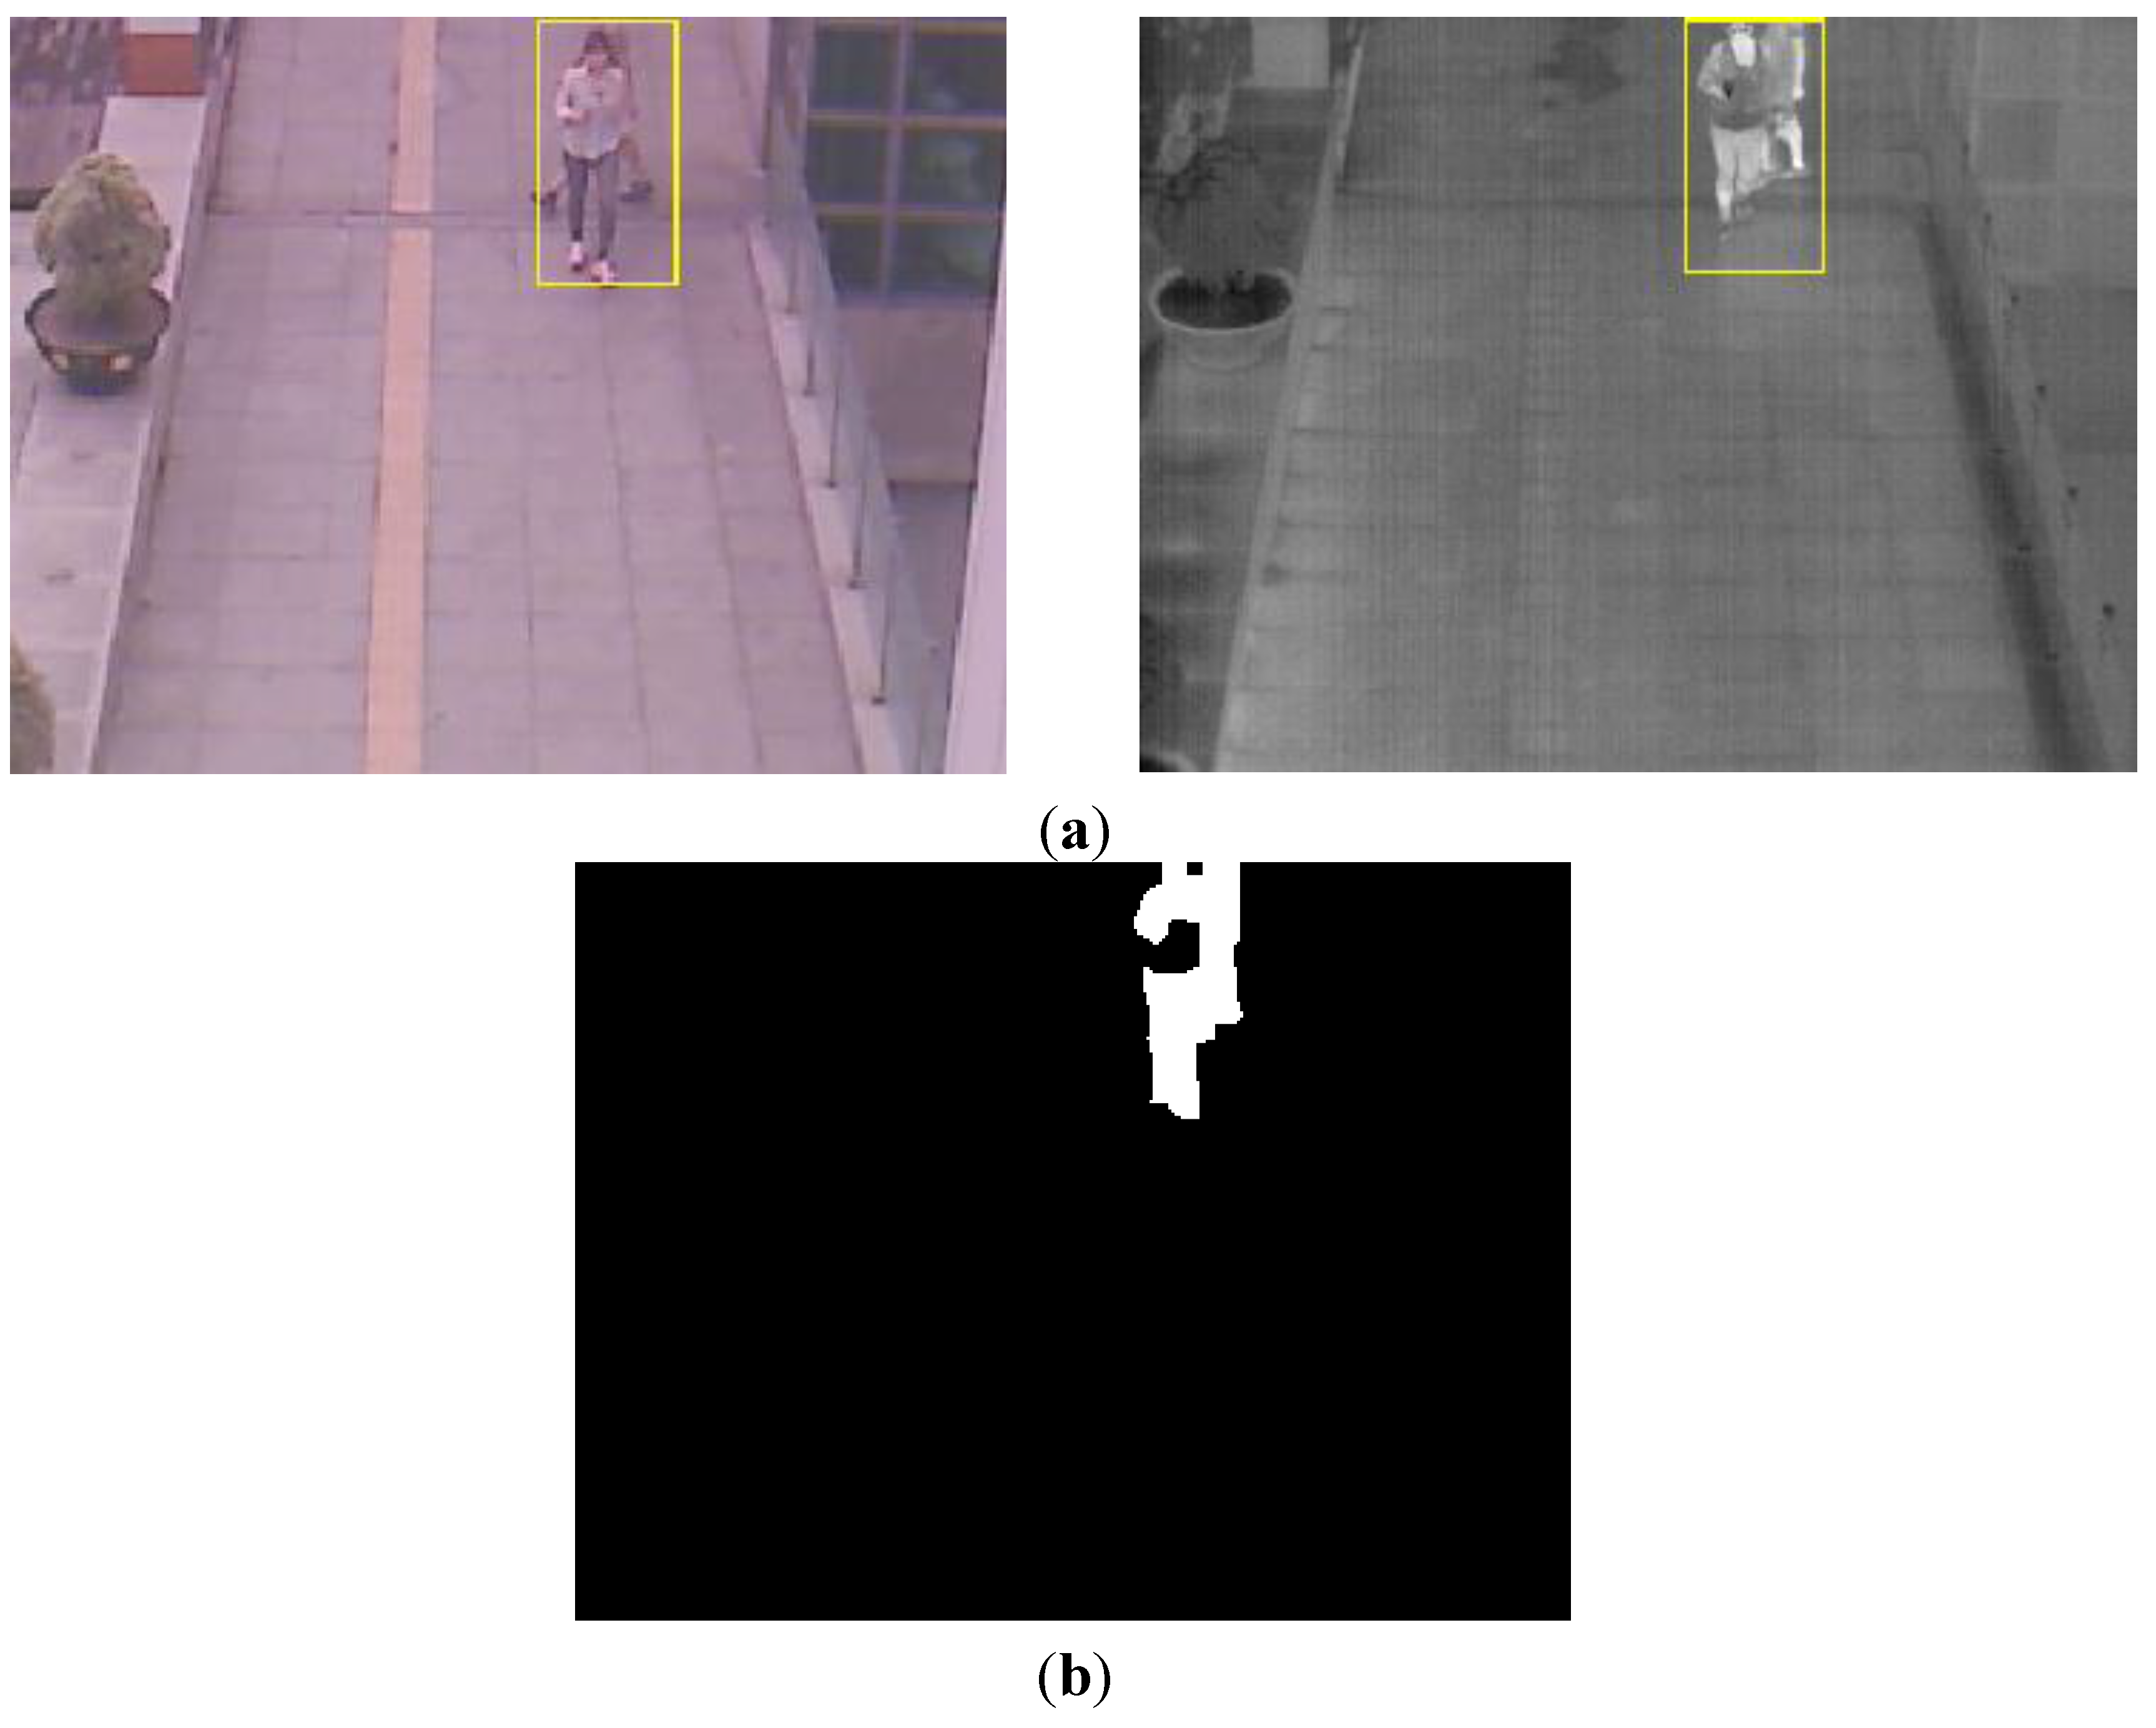
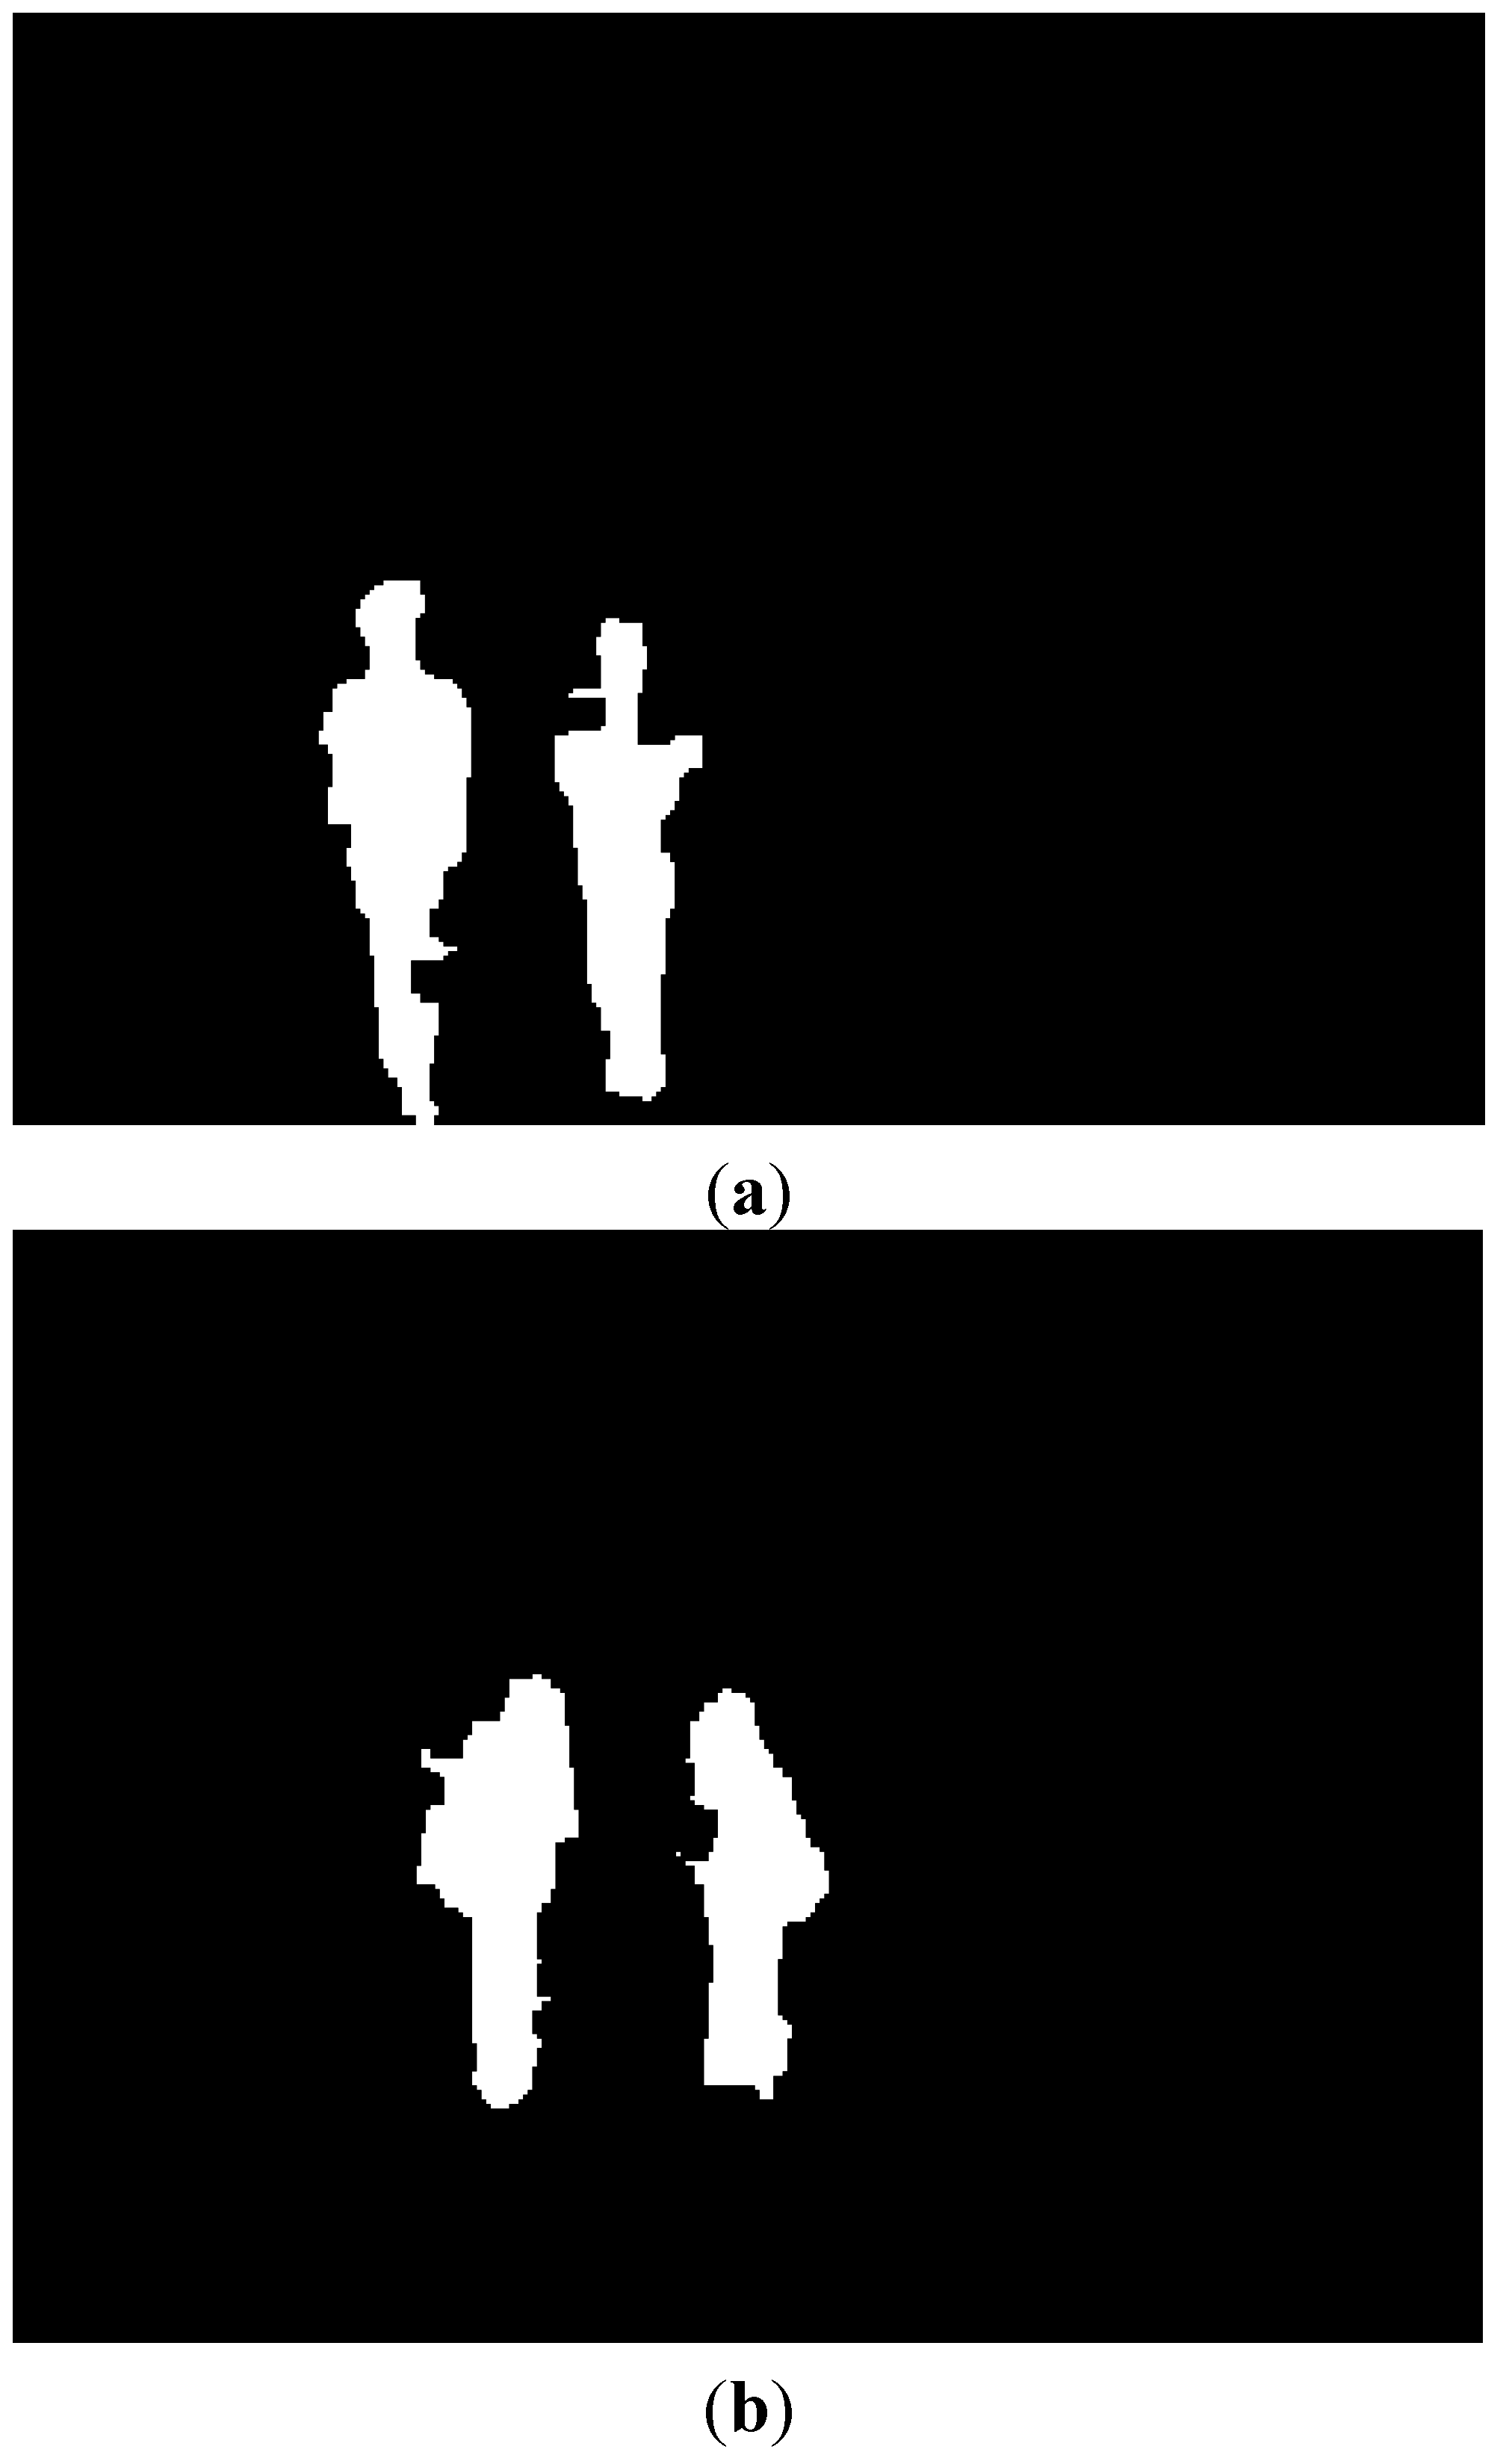
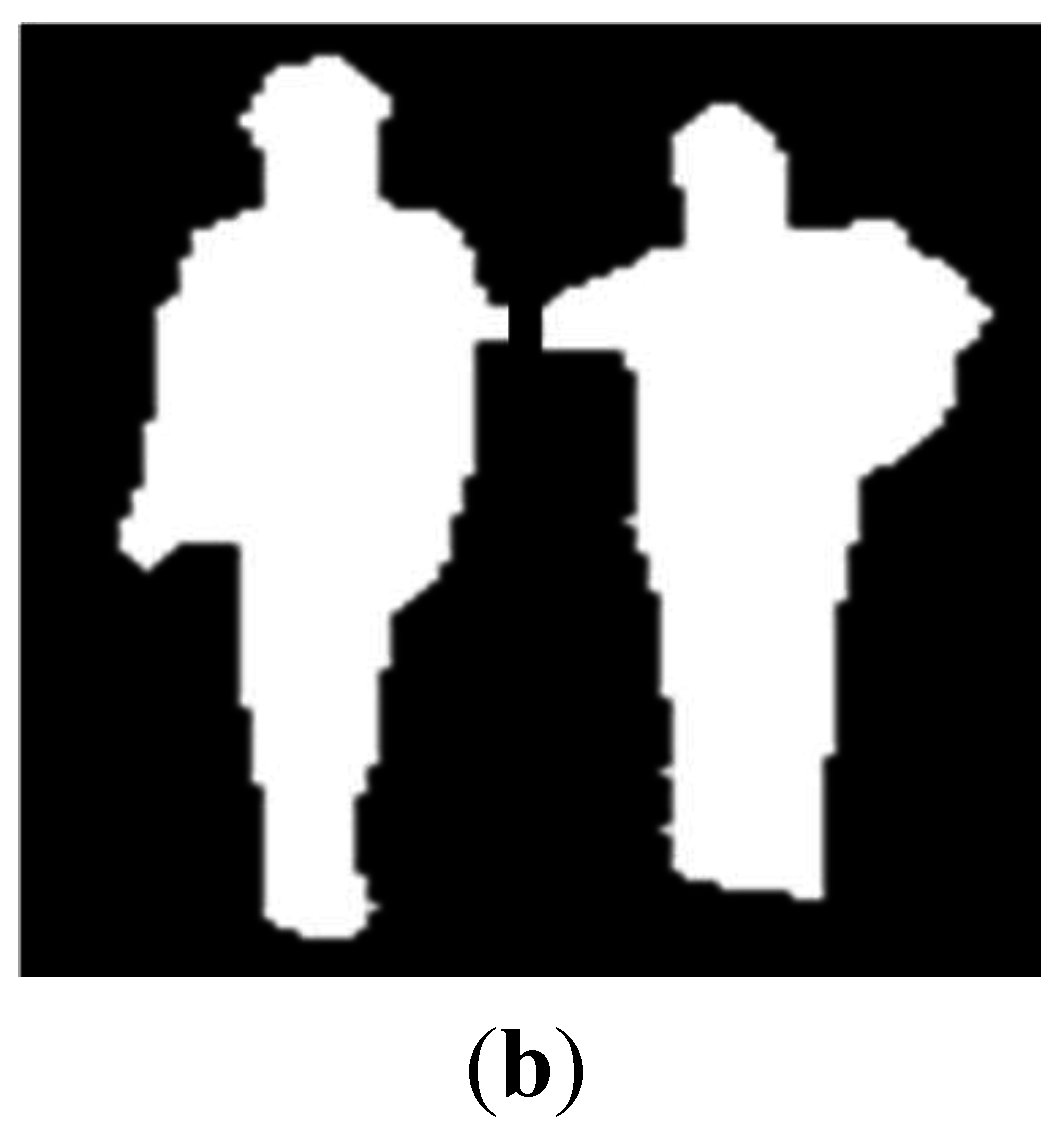
Figure 13, we show the detection error case by the proposed method. As shown in
Figure 13, the error cases happen when occlusion by two pedestrians exists, which would be solved by using tracking information as future work.
Table 5.
Detection result using only visible light camera.
Table 5.
Detection result using only visible light camera.
| Environment | #Frame | #People | #TP | #FP | Recall (%) | Precision (%) |
|---|
| Morning | 500 | 899 | 556 | 11 | 61.85 | 98.06 |
| Afternoon | 500 | 730 | 594 | 9 | 81.37 | 98.51 |
| Night | 500 | 698 | 0 | 0 | 0 | Cannot be calculated |
| Rainy day | 500 | 559 | 254 | 523 | 45.44 | 32.69 |
| Total | 2000 | 2886 | 1404 | 543 | 48.65 | 72.11 |
Table 6.
Detection result using only thermal camera.
Table 6.
Detection result using only thermal camera.
| Environment | #Frame | #People | #TP | #FP | Recall (%) | Precision (%) |
|---|
| Morning | 500 | 899 | 759 | 22 | 84.43 | 97.18 |
| Afternoon | 500 | 730 | 252 | 2 | 34.52 | 99.21 |
| Night | 500 | 698 | 554 | 64 | 79.37 | 89.64 |
| Rainy day | 500 | 559 | 543 | 2 | 97.14 | 99.63 |
| Total | 2000 | 2886 | 2108 | 90 | 73.04 | 95.91 |
As the next experiment, we measured the processing time of our method as shown in
Table 7. As shown in
Table 7, the total processing time is about 23.13 ms and we find that our system can be operated at the speed of about 43.23 frames/s (1000/23.13).
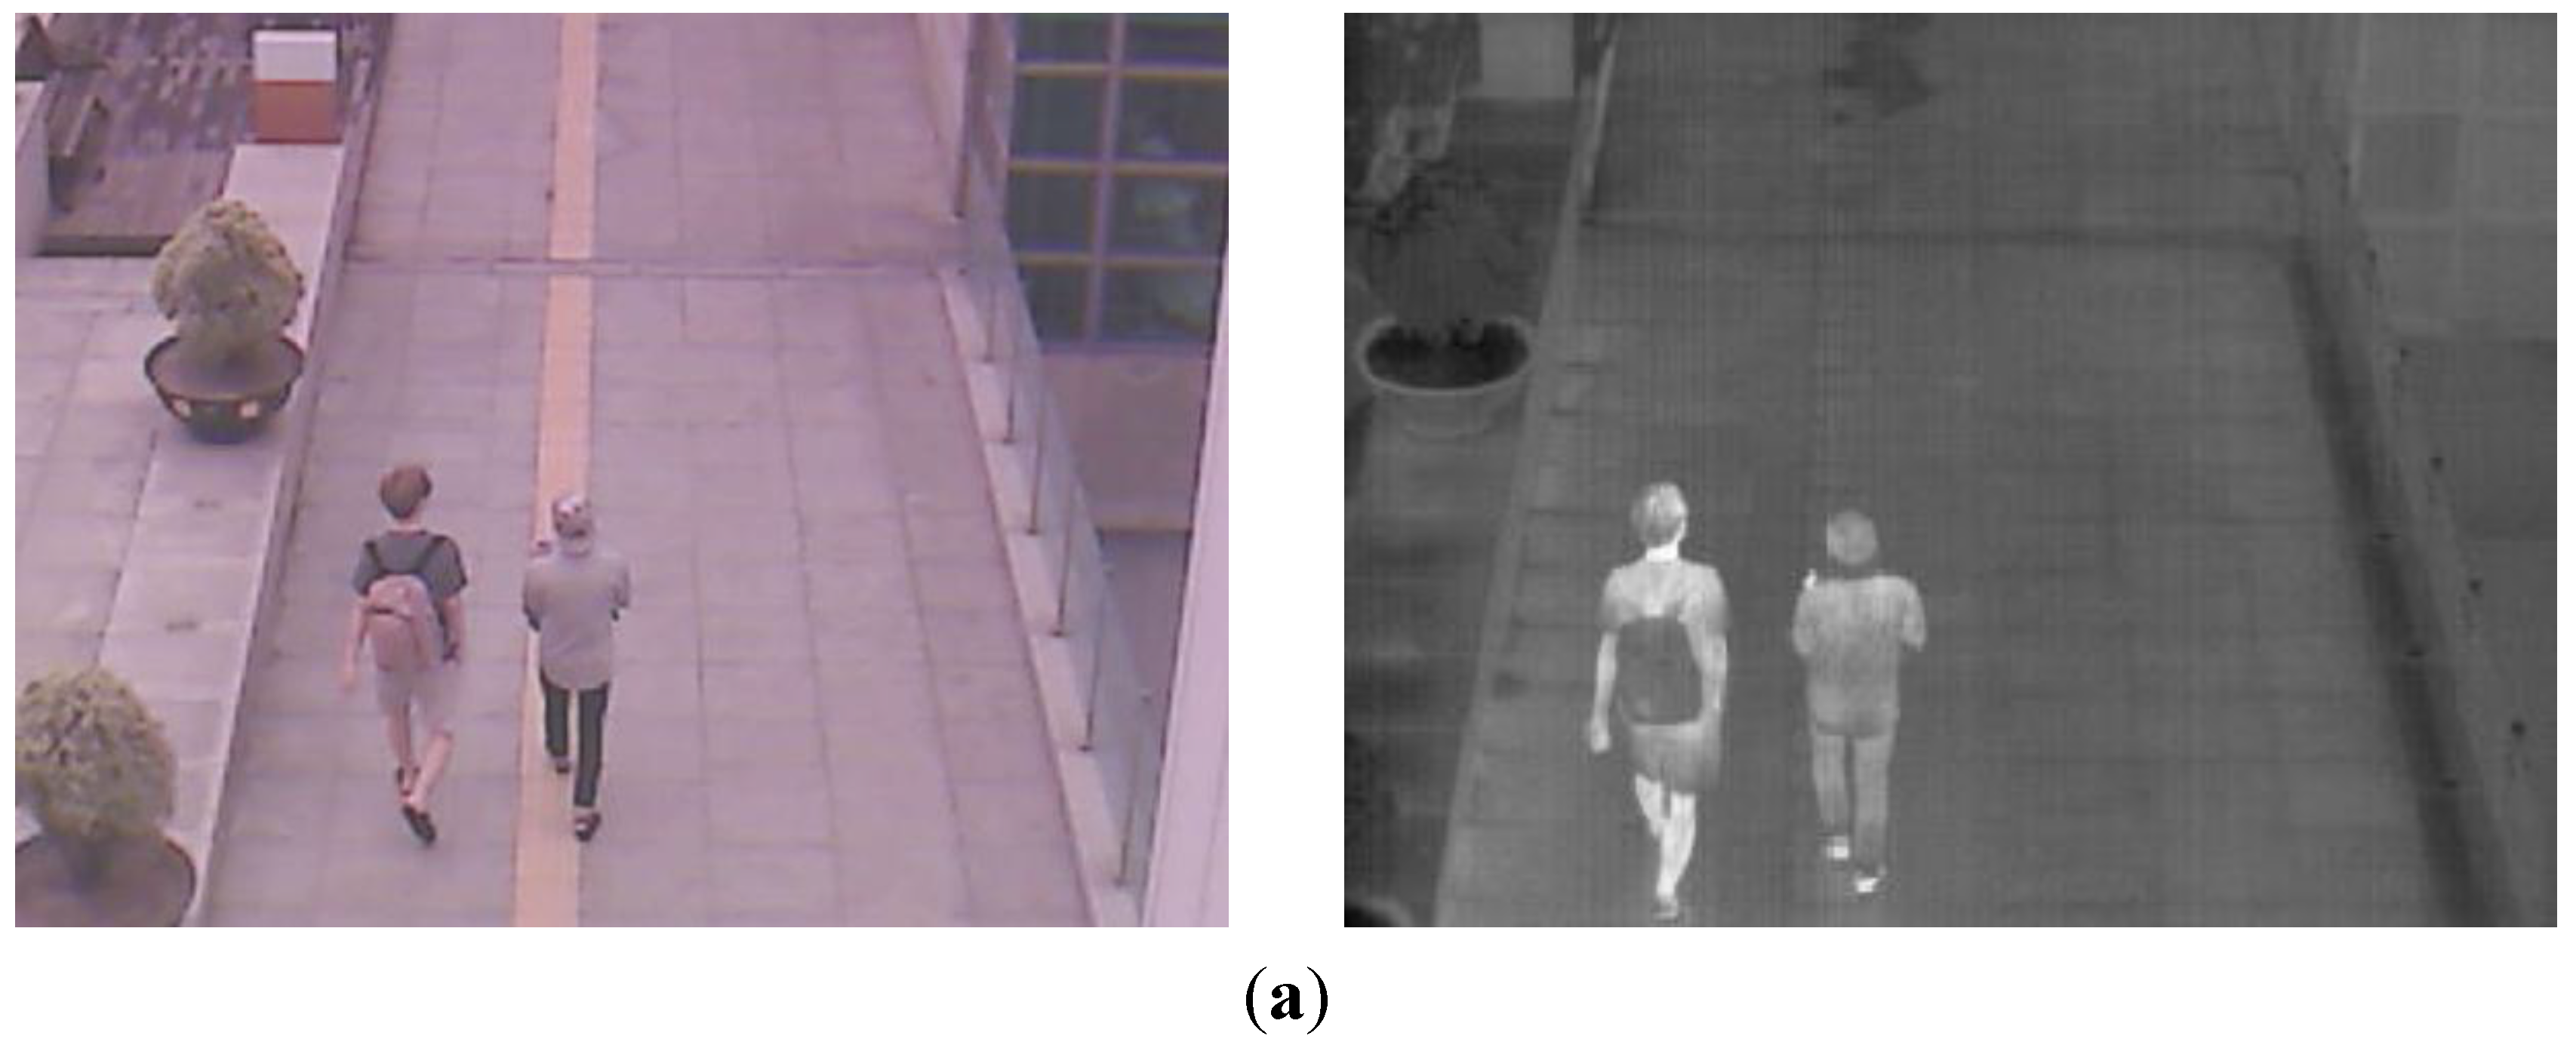
Figure 13.
Detection error case in our database: (
a) The example of the current input images by visible light (left figure) and thermal cameras (right figure); (
b) Result image (of Step (17) of
Figure 3).
Figure 13.
Detection error case in our database: (
a) The example of the current input images by visible light (left figure) and thermal cameras (right figure); (
b) Result image (of Step (17) of
Figure 3).
Table 7.
Processing time of our method.
Table 7.
Processing time of our method.
| Steps of Figure 3 | Processing Time (ms) |
|---|
| Steps (1)–(4), (7) and (8) | 16.05 |
| Steps (5) and (6) | 2.44 |
| Steps (9)–(12) | 2.25 |
| Step (13) | 0.25 |
| Steps (14) and (15) | 0.72 |
| Steps (16)–(18) | 1.42 |
| Total | 23.13 |
As the next test, we compare our algorithm with other already published methods [
8,
14,
22]. Although HOG detector [
8,
14] and other detector using shape-based and appearance-based features [
22] have been used in previous researches, the former method [
8,
14] has the disadvantage that it takes processing time for extracting the gradient information of various directions. In addition, the additional classifier based on SVM should be used with the HOG features, which requires additional (time-consuming) procedure of training [
8,
14]. The latter method [
22] has the disadvantage that it takes processing time for extracting the skeleton information as the shape-based feature. In addition, the additional (time-consuming) procedure of training for principal component analysis (PCA) is required for extracting the appearance-based feature [
22]. In all these methods, the training procedures of SVM and PCA makes the performance of system affected by the training data, also.
Because their method is for the pedestrian detection and tracking in thermal image [
22], we compared the performance by our method in thermal image (
Table 6) and that by their method. As shown in
Table 6 and
Table 8, average recall and precision by our method are higher than those by previous method [
22]. In addition, we compared the processing time of our method with that by previous method [
22]. The total processing time of our method is 23.13 ms (
Table 7) which is smaller than that by previous method (48.54 ms). From these results, we can confirm that our method outperforms the previous one [
22].
Table 8.
Detection result using only thermal camera by previous method [
22].
Table 8.
Detection result using only thermal camera by previous method [22].
| Environment | #Frame | #People | #TP | #FP | Recall (%) | Precision (%) |
|---|
| Morning | 500 | 899 | 785 | 57 | 87.32 | 93.23 |
| Afternoon | 500 | 730 | 247 | 27 | 33.84 | 90.15 |
| Night | 500 | 698 | 517 | 131 | 74.07 | 79.78 |
| Rainy day | 500 | 559 | 541 | 37 | 96.78 | 93.60 |
| Total | 2000 | 2886 | 2090 | 252 | 72.42 | 89.24 |
In the next experiment, we compared the performance by our method with that by previous method [
8,
14]. Because their method can be applied to both the visible light and thermal images [
8,
14], we compared the performances by our method in visible light (
Table 5) and thermal image (
Table 6) and those by their method. As shown in
Table 5 and
Table 9, average recall and precision in visible light image by our method are higher than those by previous method [
8,
14]. In addition, as shown in
Table 6 and
Table 10, average recall and precision in thermal image by our method are higher than those by previous method [
8,
14]. In addition, we compared the processing time of our method with that by previous method [
8,
14]. The total processing time of our method is 23.13 ms (
Table 7) which is smaller than that by previous method (42.57 ms). From these results, we can confirm that our method outperforms the previous one [
8,
14].
Table 9.
Detection result using only visible light camera by previous method [
8,
14].
Table 9.
Detection result using only visible light camera by previous method [8,14].
| Environment | #Frame | #People | #TP | #FP | Recall (%) | Precision (%) |
|---|
| Morning | 500 | 899 | 579 | 33 | 64.40 | 94.61 |
| Afternoon | 500 | 730 | 560 | 46 | 76.71 | 92.41 |
| Night | 500 | 698 | 0 | 0 | 0 | Cannot be calculated |
| Rainy day | 500 | 559 | 248 | 501 | 44.36 | 33.11 |
| Total | 2000 | 2886 | 1387 | 580 | 48.06 | 70.51 |
Table 10.
Detection result using only thermal camera by previous method [
8,
14].
Table 10.
Detection result using only thermal camera by previous method [8,14].
| Environment | #Frame | #People | #TP | #FP | Recall (%) | Precision (%) |
|---|
| Morning | 500 | 899 | 626 | 7 | 69.63 | 98.89 |
| Afternoon | 500 | 730 | 242 | 61 | 33.15 | 79.87 |
| Night | 500 | 698 | 507 | 10 | 72.64 | 98.07 |
| Rainy day | 500 | 559 | 429 | 2 | 76.74 | 99.54 |
| Total | 2000 | 2886 | 1804 | 80 | 62.51 | 95.75 |
In addition, we compared the background subtraction by our method with that based on Gaussian background-subtraction approach which has been widely used [
37]. For fair comparisons, only the background update and subtraction (Steps (1)–(5) and (7)–(9) of
Figure 3) are replaced by [
37] when measuring the performance by previous method [
37]. Because their method can be applied to both the visible light and thermal images, we compared the performances by our method in visible light (
Table 5) and thermal image (
Table 6) and those by their method.
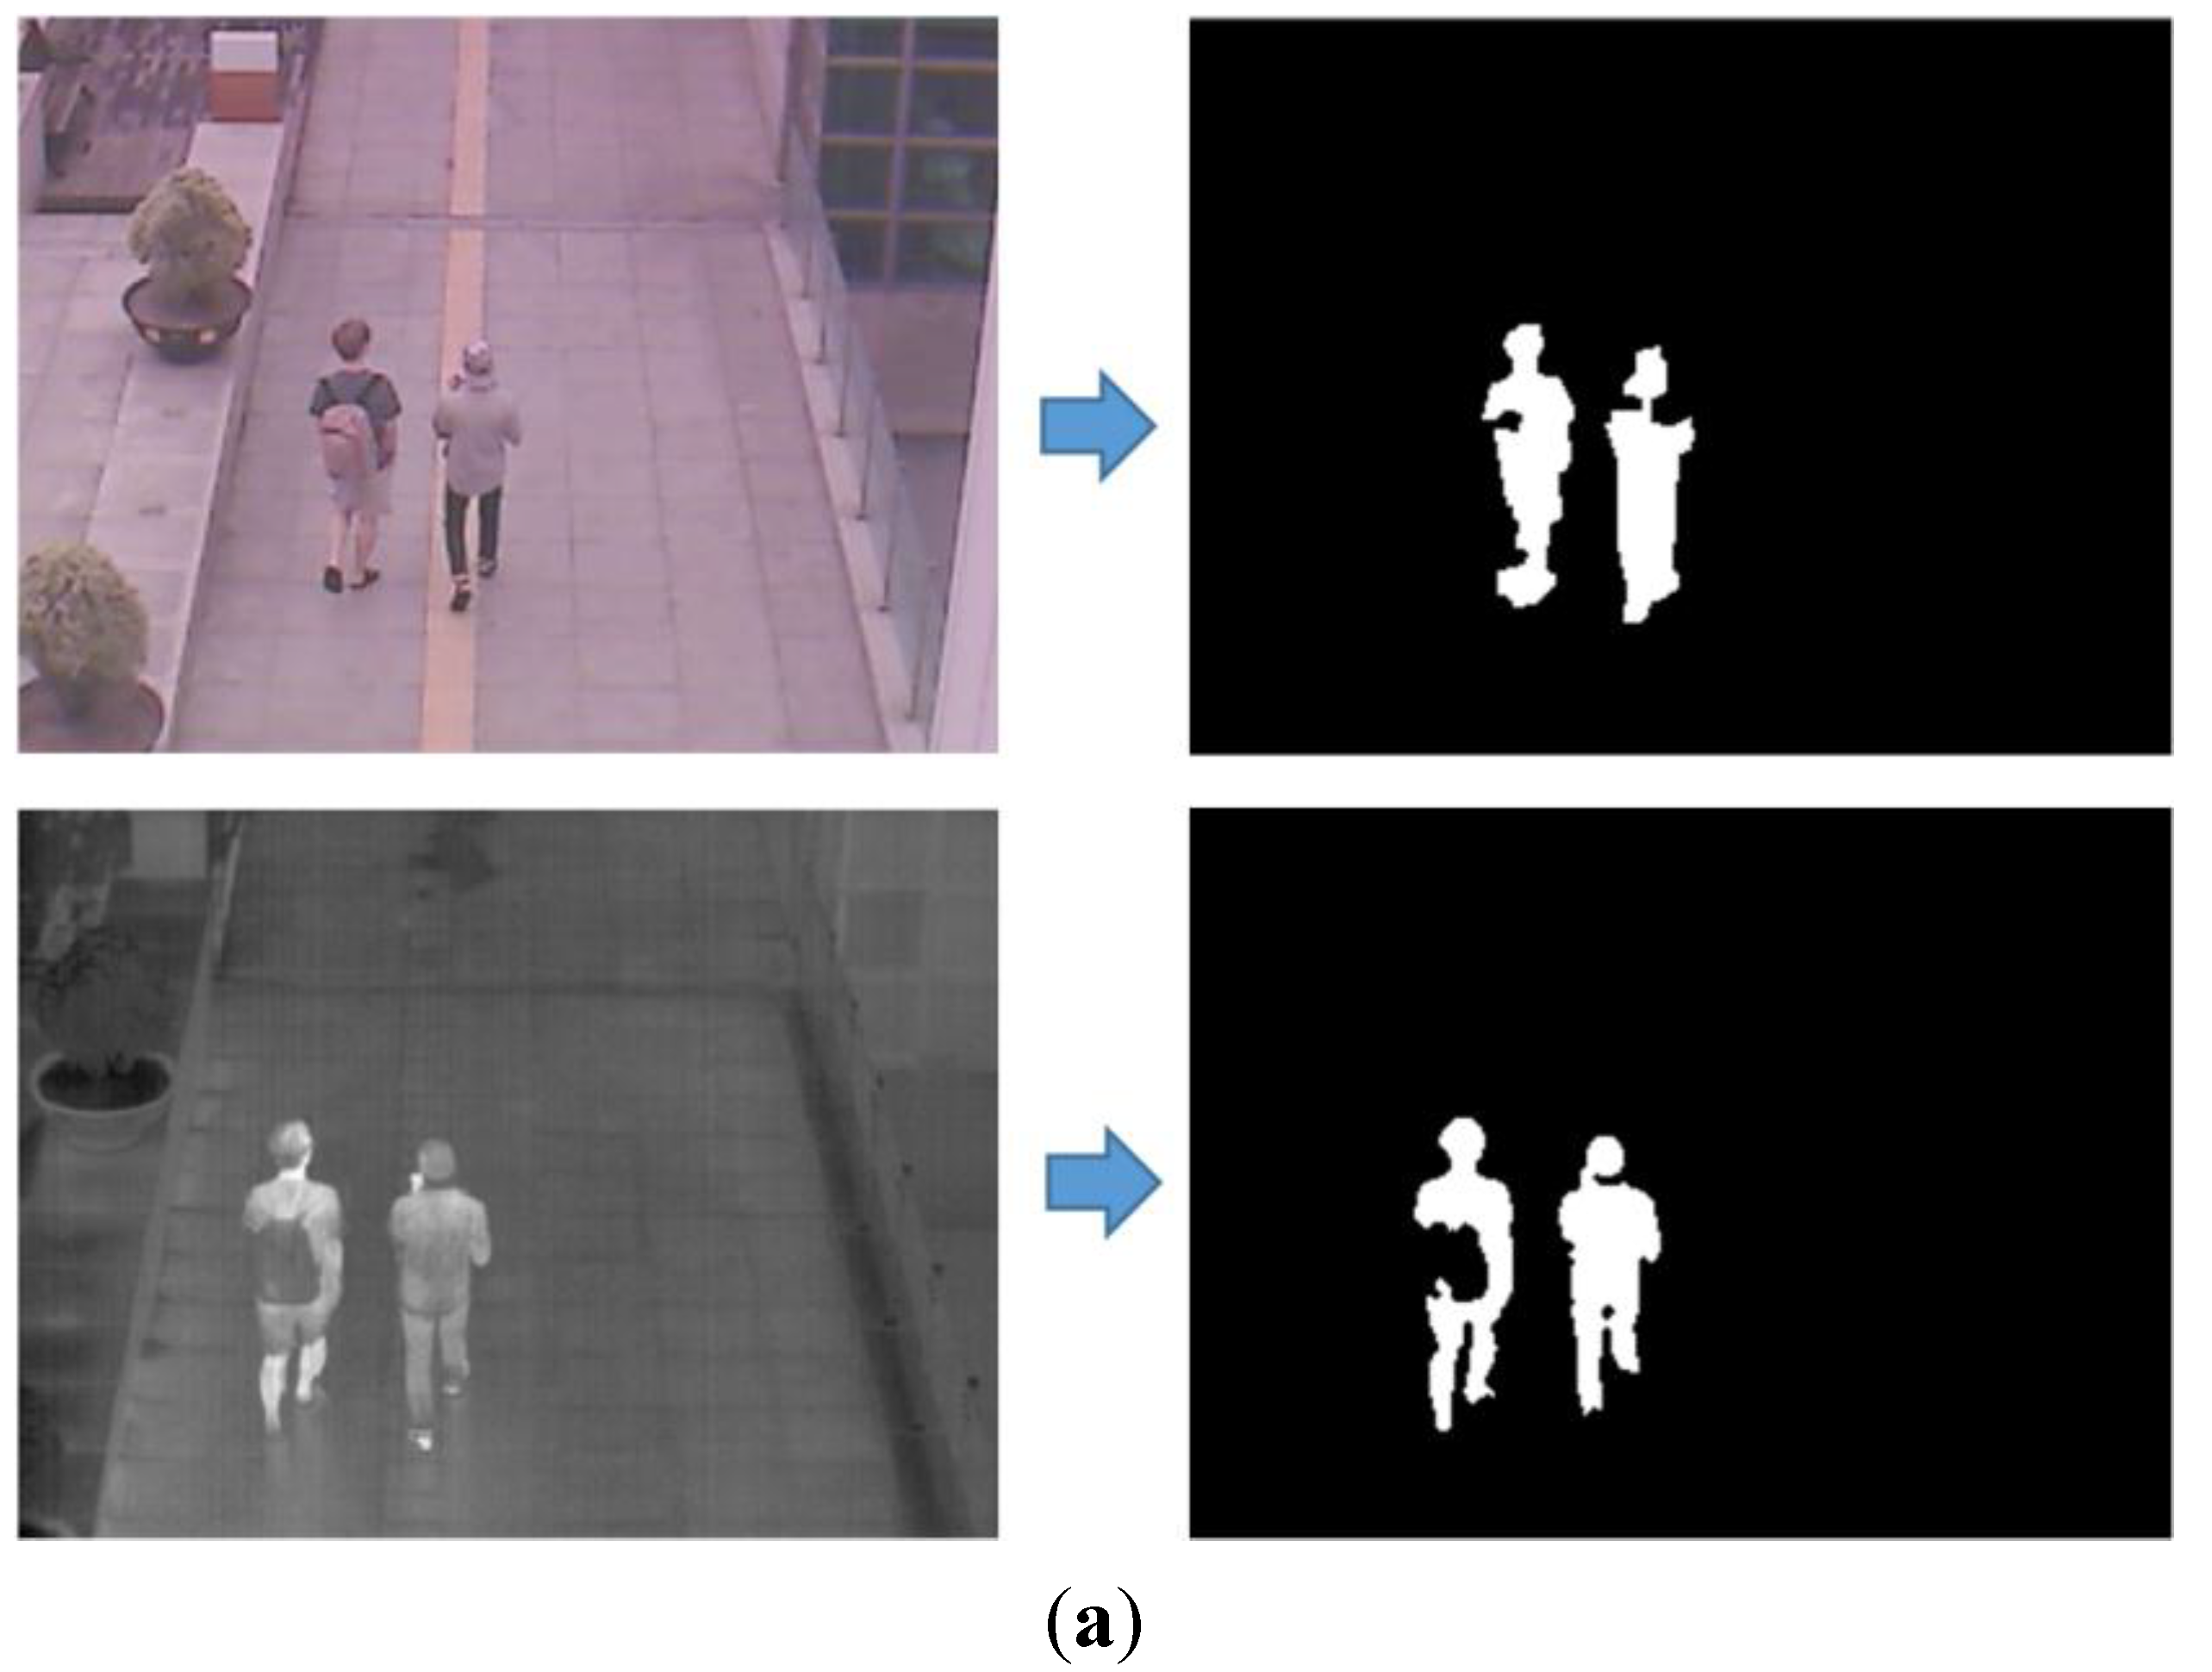
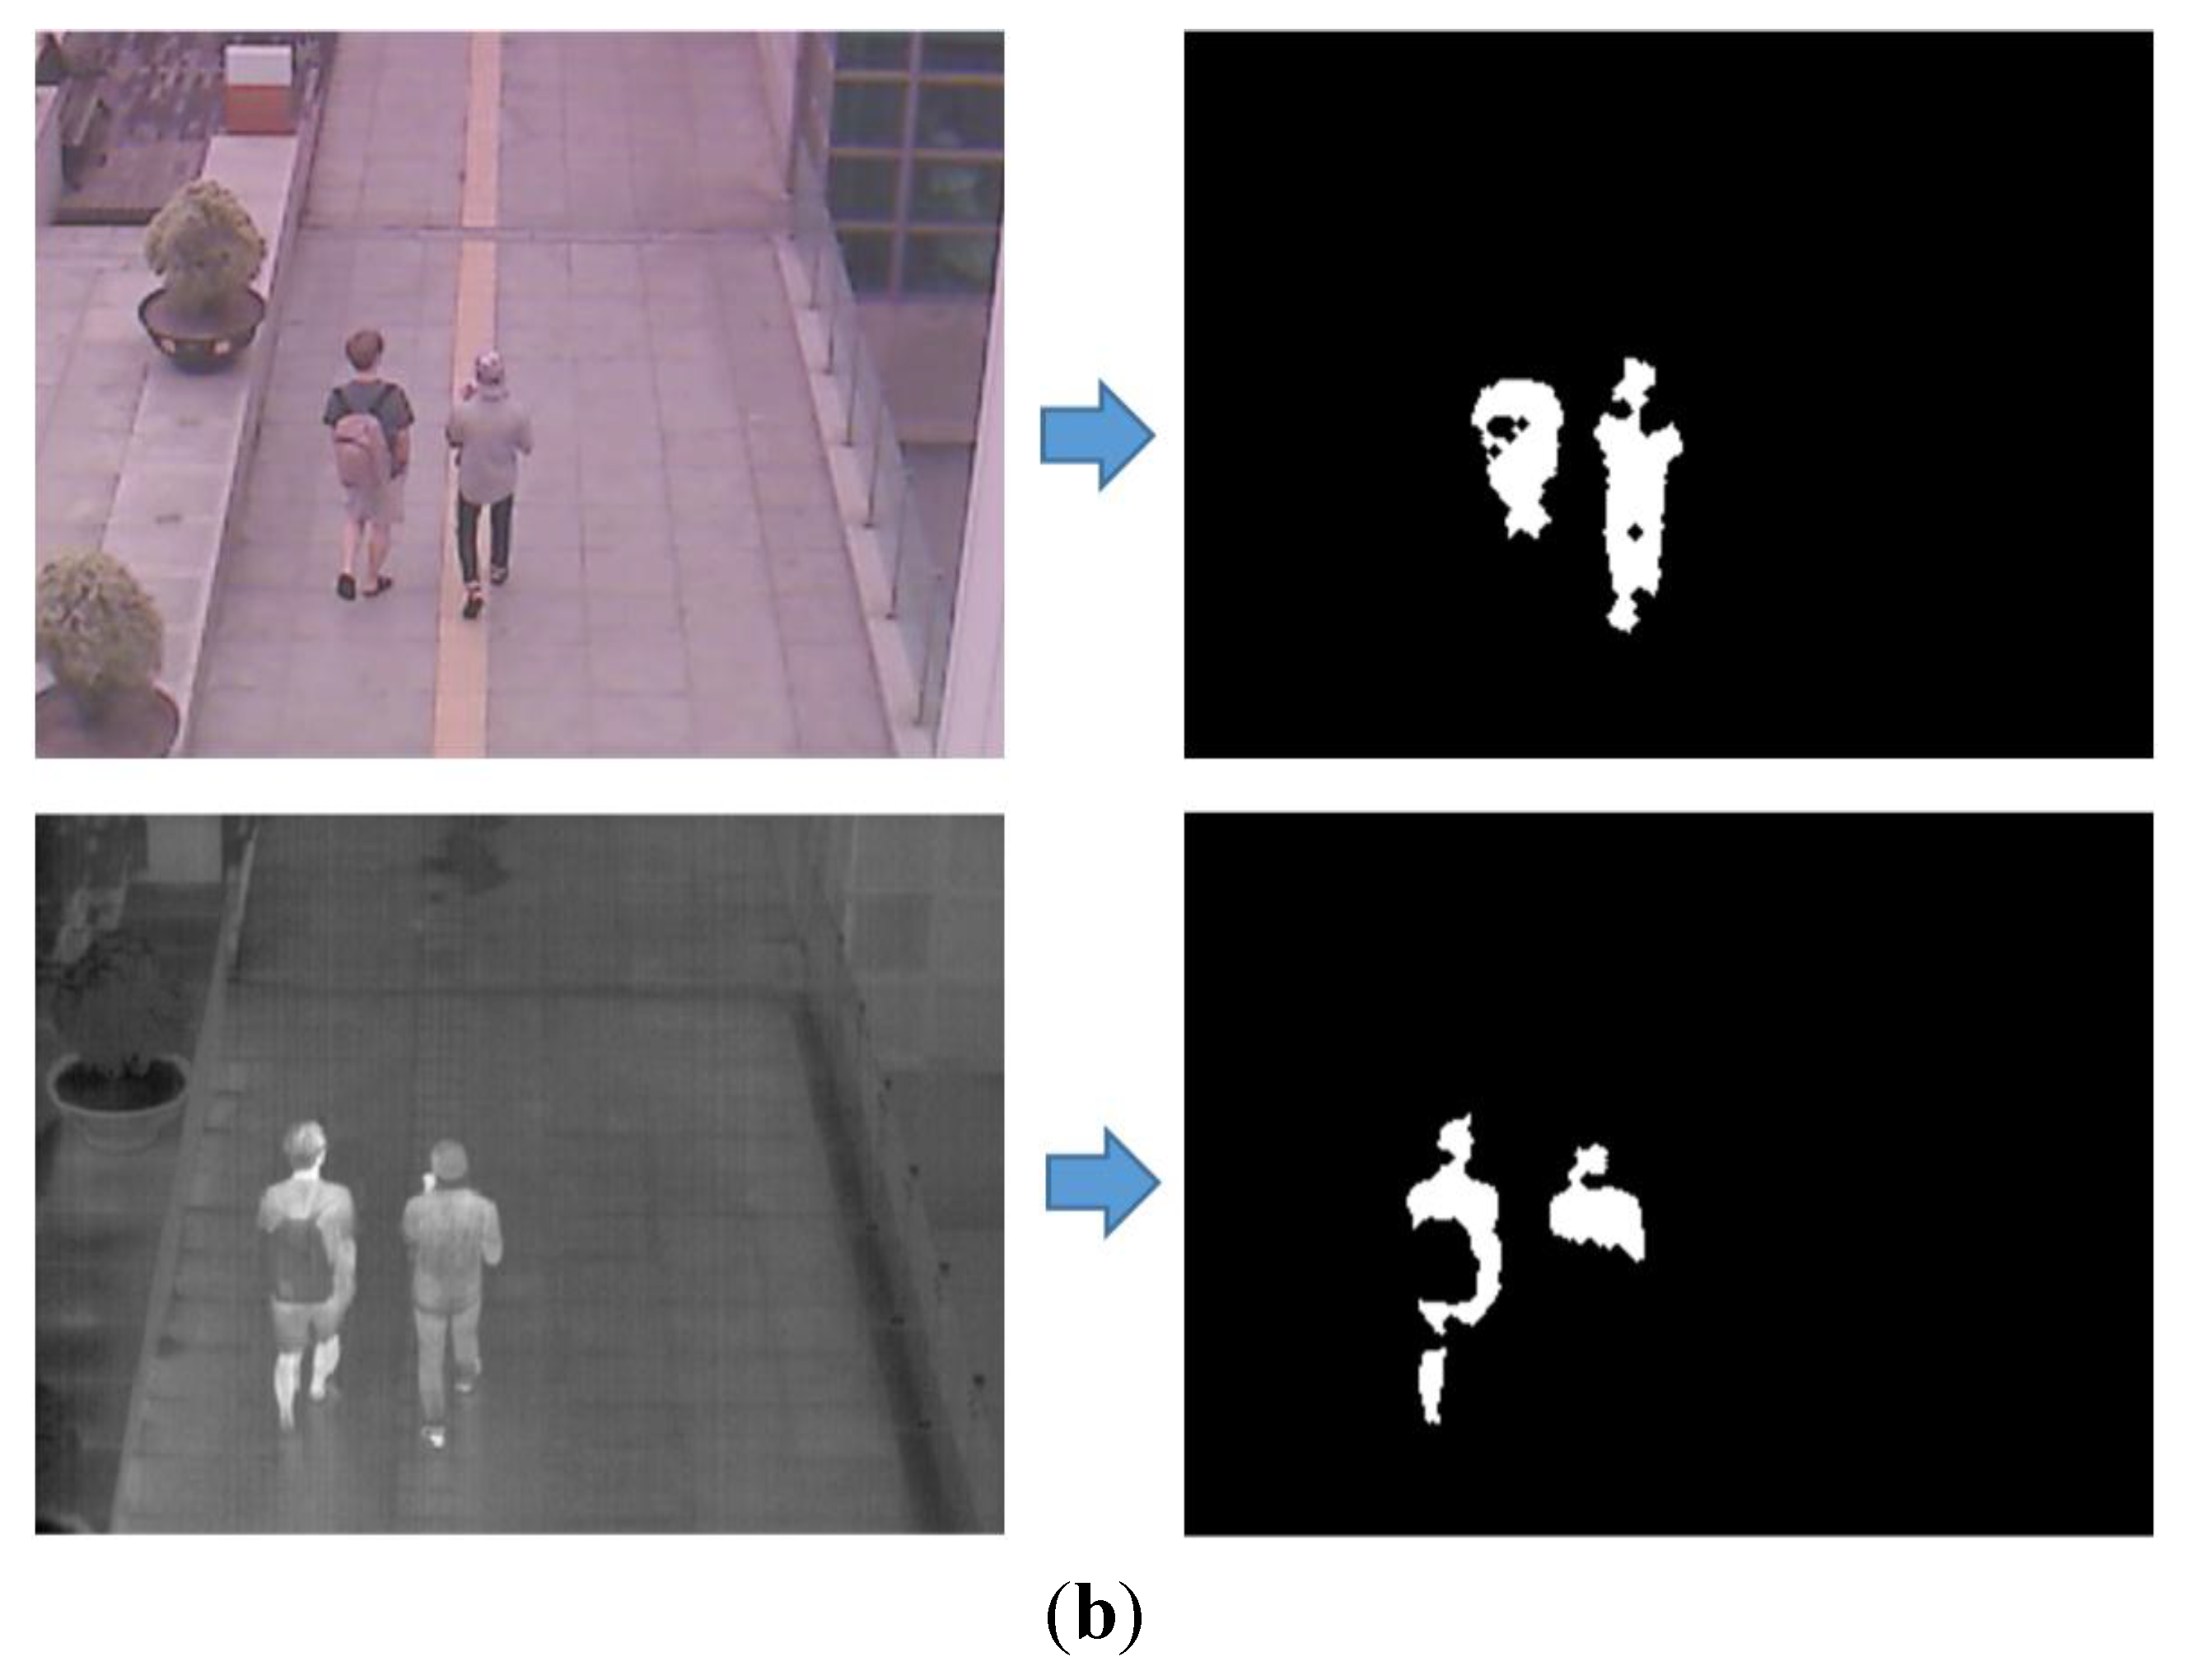
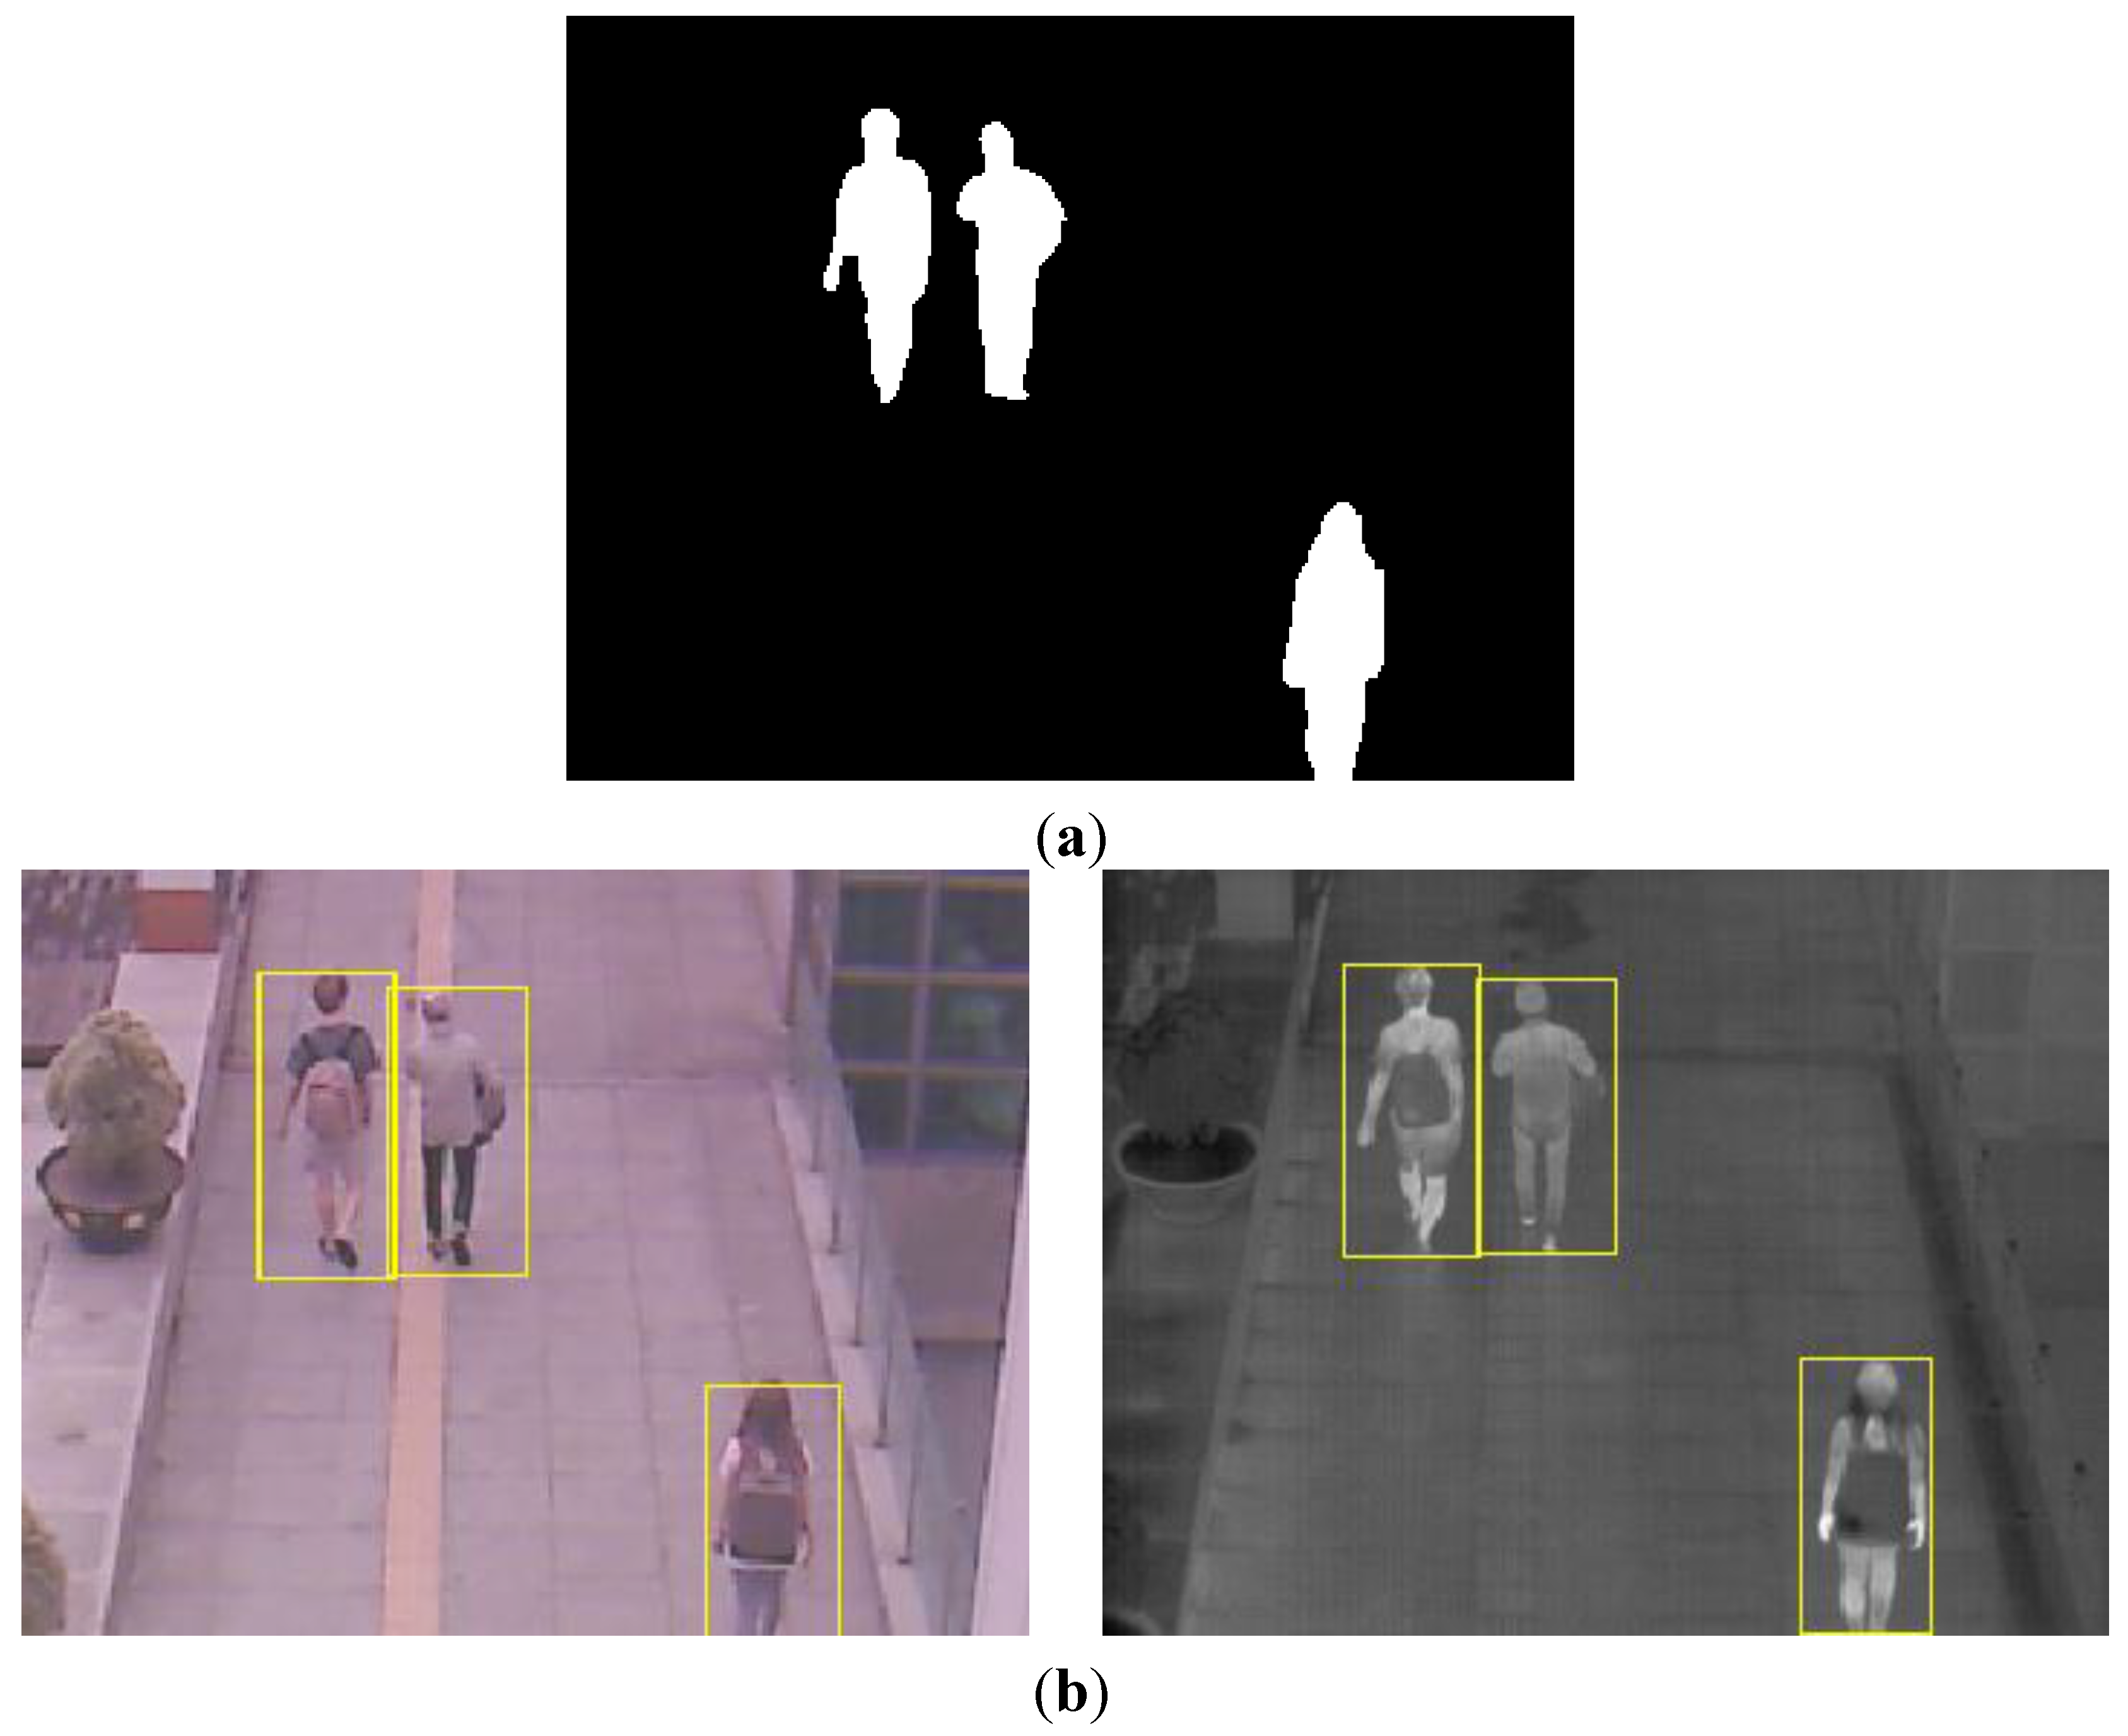
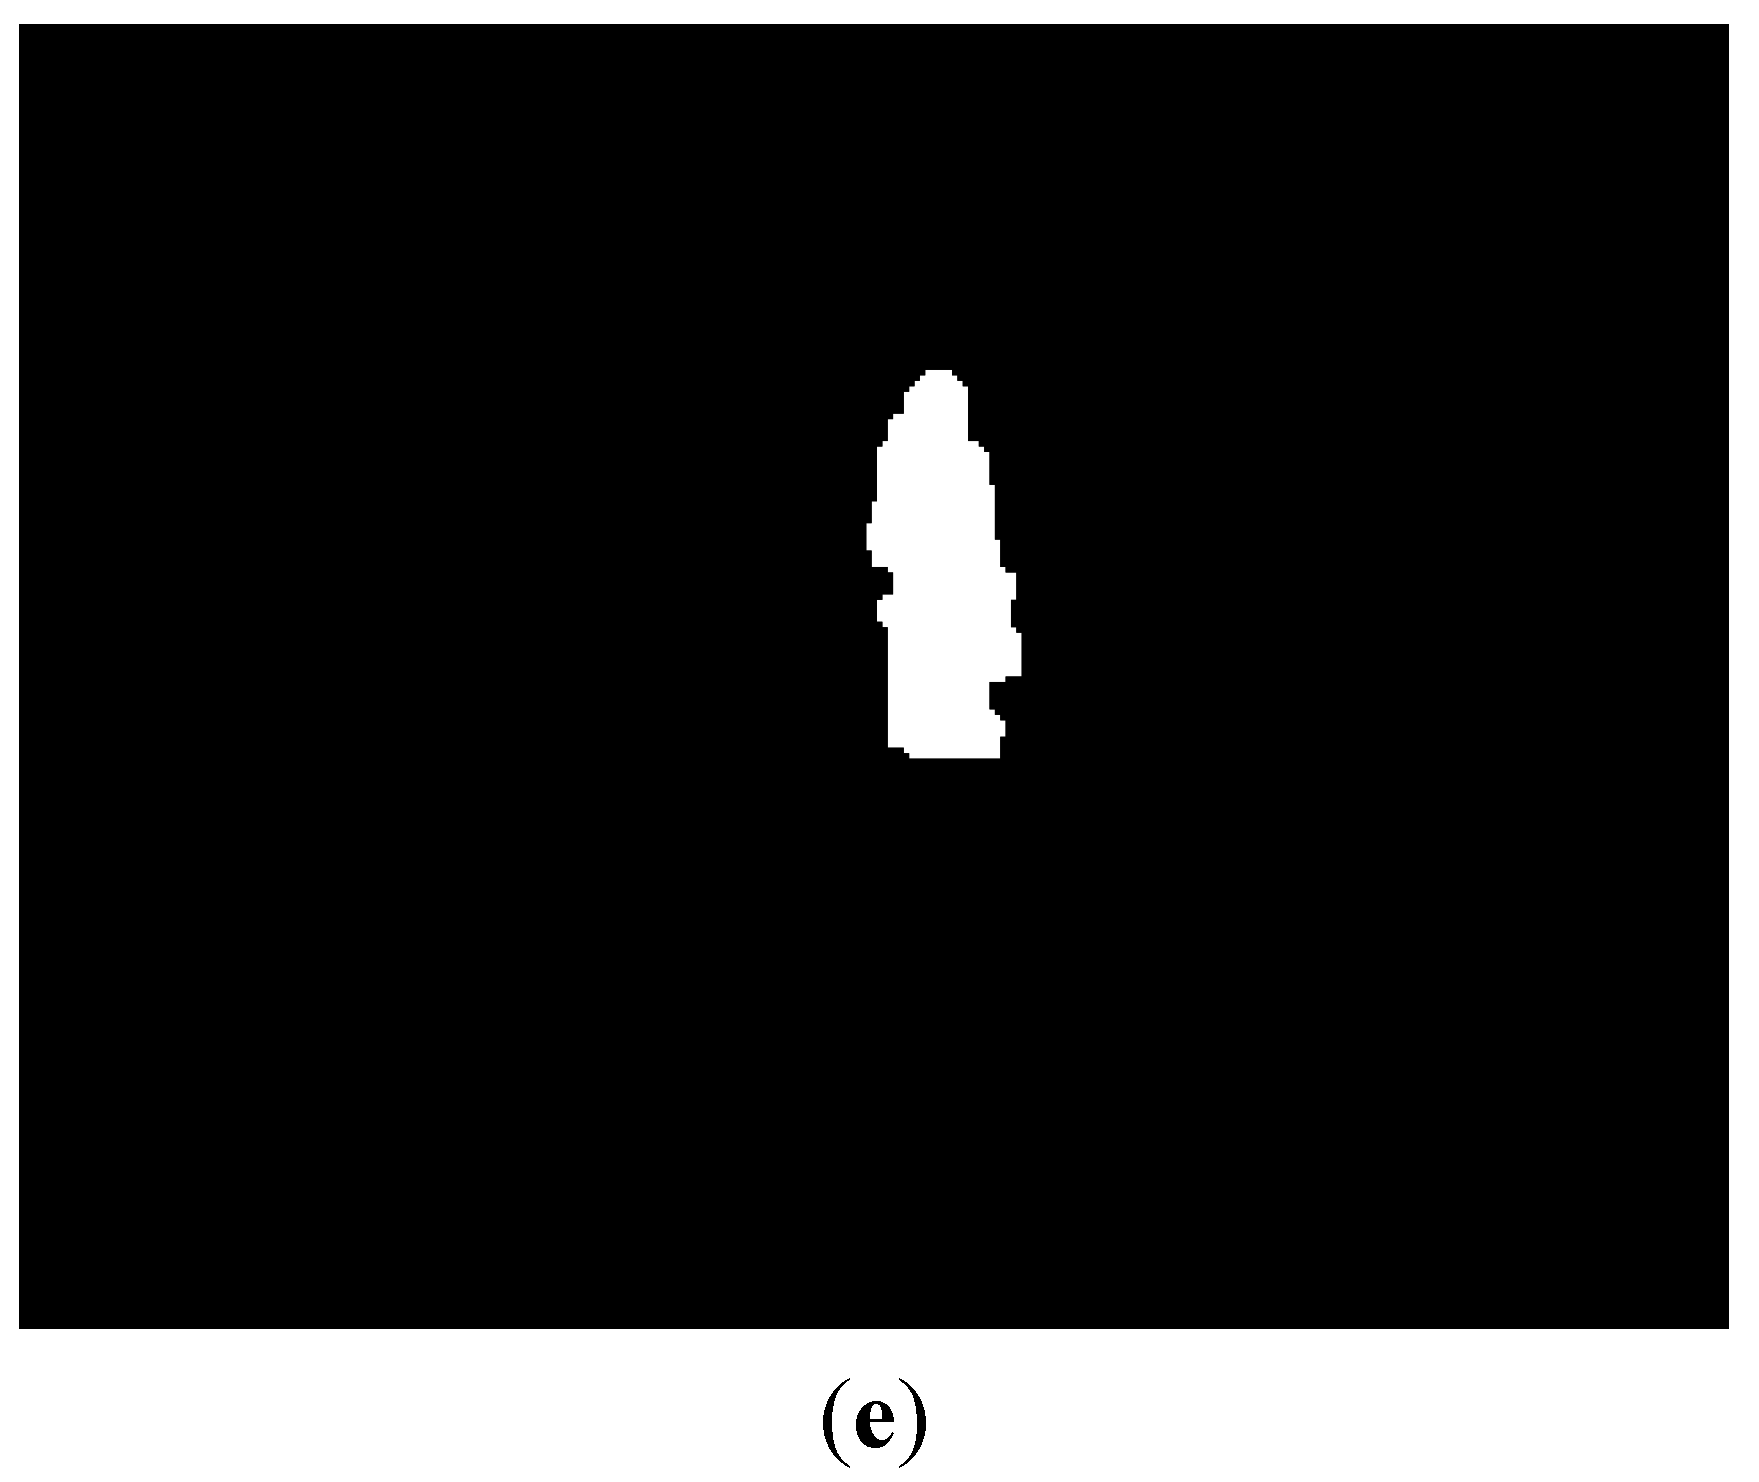
Figure 14 shows the results of background subtraction by our method and previous one [
37]. As shown in this figure, we can find that our background subtraction method outperforms the previous one [
37].
Figure 14.
The results of background subtraction by our method and previous one [
37]. Upper and lower figures of (
a,
b) are the results with the visible light and thermal images, respectively: (
a) Results by our method; (
b) Results by previous method [
37].
Figure 14.
The results of background subtraction by our method and previous one [
37]. Upper and lower figures of (
a,
b) are the results with the visible light and thermal images, respectively: (
a) Results by our method; (
b) Results by previous method [
37].
As shown in
Table 5 and
Table 11, average recall and precision in visible light image by our background subtraction method are higher than those by previous method [
37]. In addition, as shown in
Table 6 and
Table 12, average recall and precision in thermal image by our background subtraction method are higher than those by previous method [
37]. In addition, we compared the processing time of our background subtraction method with that by previous method [
37]. The total processing time of our method is 16.84 ms (Steps (1)–(5), and (7)–(9) of
Table 7) which is smaller than that by previous method (26.27 ms) [
37]. From these results, we can confirm that our background subtraction method outperforms the previous one [
37].
Table 11.
Detection result using only visible light camera by previous method [
37].
Table 11.
Detection result using only visible light camera by previous method [37].
| Environment | #Frame | #People | #TP | #FP | Recall (%) | Precision (%) |
|---|
| Morning | 500 | 899 | 464 | 32 | 51.61 | 93.55 |
| Afternoon | 500 | 730 | 573 | 17 | 78.49 | 97.12 |
| Night | 500 | 698 | 0 | 0 | 0 | Cannot be calculated |
| Rainy day | 500 | 559 | 143 | 445 | 25.58 | 24.32 |
| Total | 2000 | 2886 | 1180 | 494 | 40.89 | 70.49 |
Table 12.
Detection result using only thermal camera by previous method [
37].
Table 12.
Detection result using only thermal camera by previous method [37].
| Environment | #Frame | #People | #TP | #FP | Recall (%) | Precision (%) |
|---|
| Morning | 500 | 899 | 500 | 379 | 55.62 | 56.88 |
| Afternoon | 500 | 730 | 406 | 109 | 55.62 | 78.84 |
| Night | 500 | 698 | 590 | 43 | 84.53 | 93.21 |
| Rainy day | 500 | 559 | 109 | 653 | 19.50 | 14.30 |
| Total | 2000 | 2886 | 1605 | 1184 | 55.61 | 57.55 |
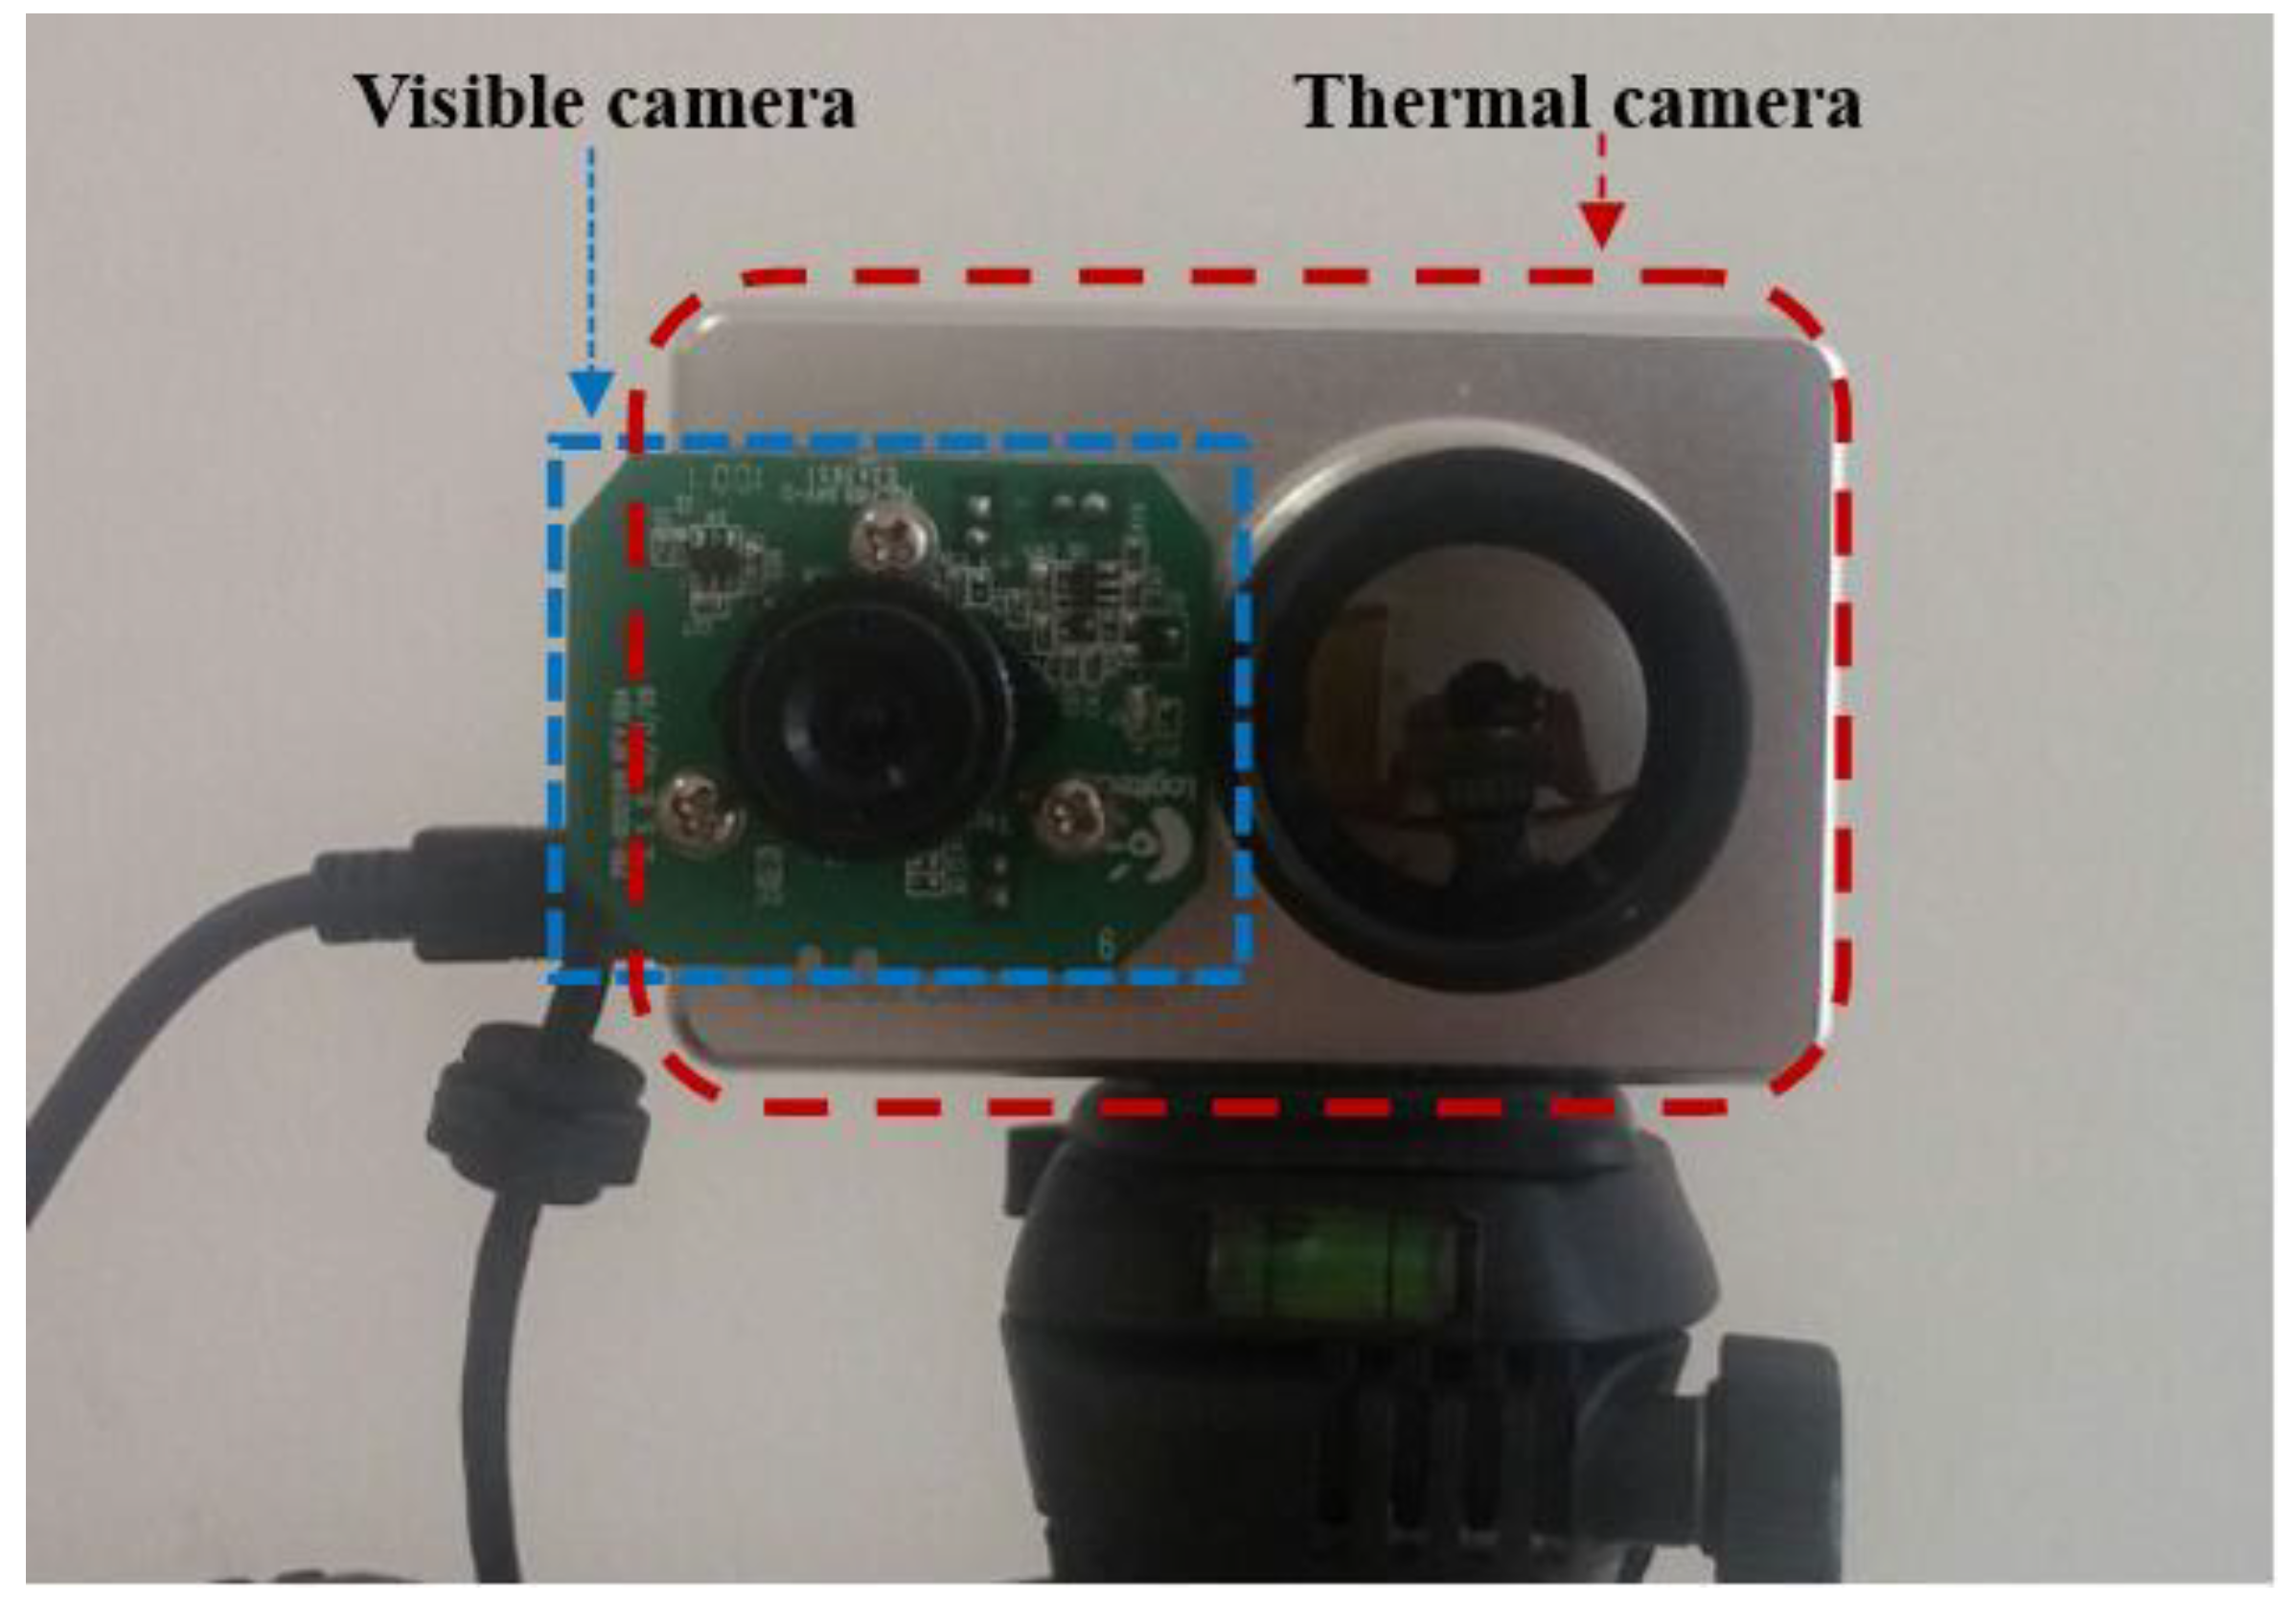
In order to prove that our method is robust to the kinds of camera and database, we measured the performance by our method with another database. This additional database (database II) is collected by a new dual camera system as shown in
Figure 15. The total number of images used in the experiment (database II) was 800. These images were obtained in various environments such as mornings of 2.9 °C (200 images), afternoons of 4.7 °C (200 images), nights of 1.2 °C (200 images), and rainy days of 2.8 °C with precipitation of 5.5 mm (200 images). We captured the images where people naturally move without any instruction from us. Therefore, there exist various cases that some people are close together, cluttered, separated,
etc. in our database.
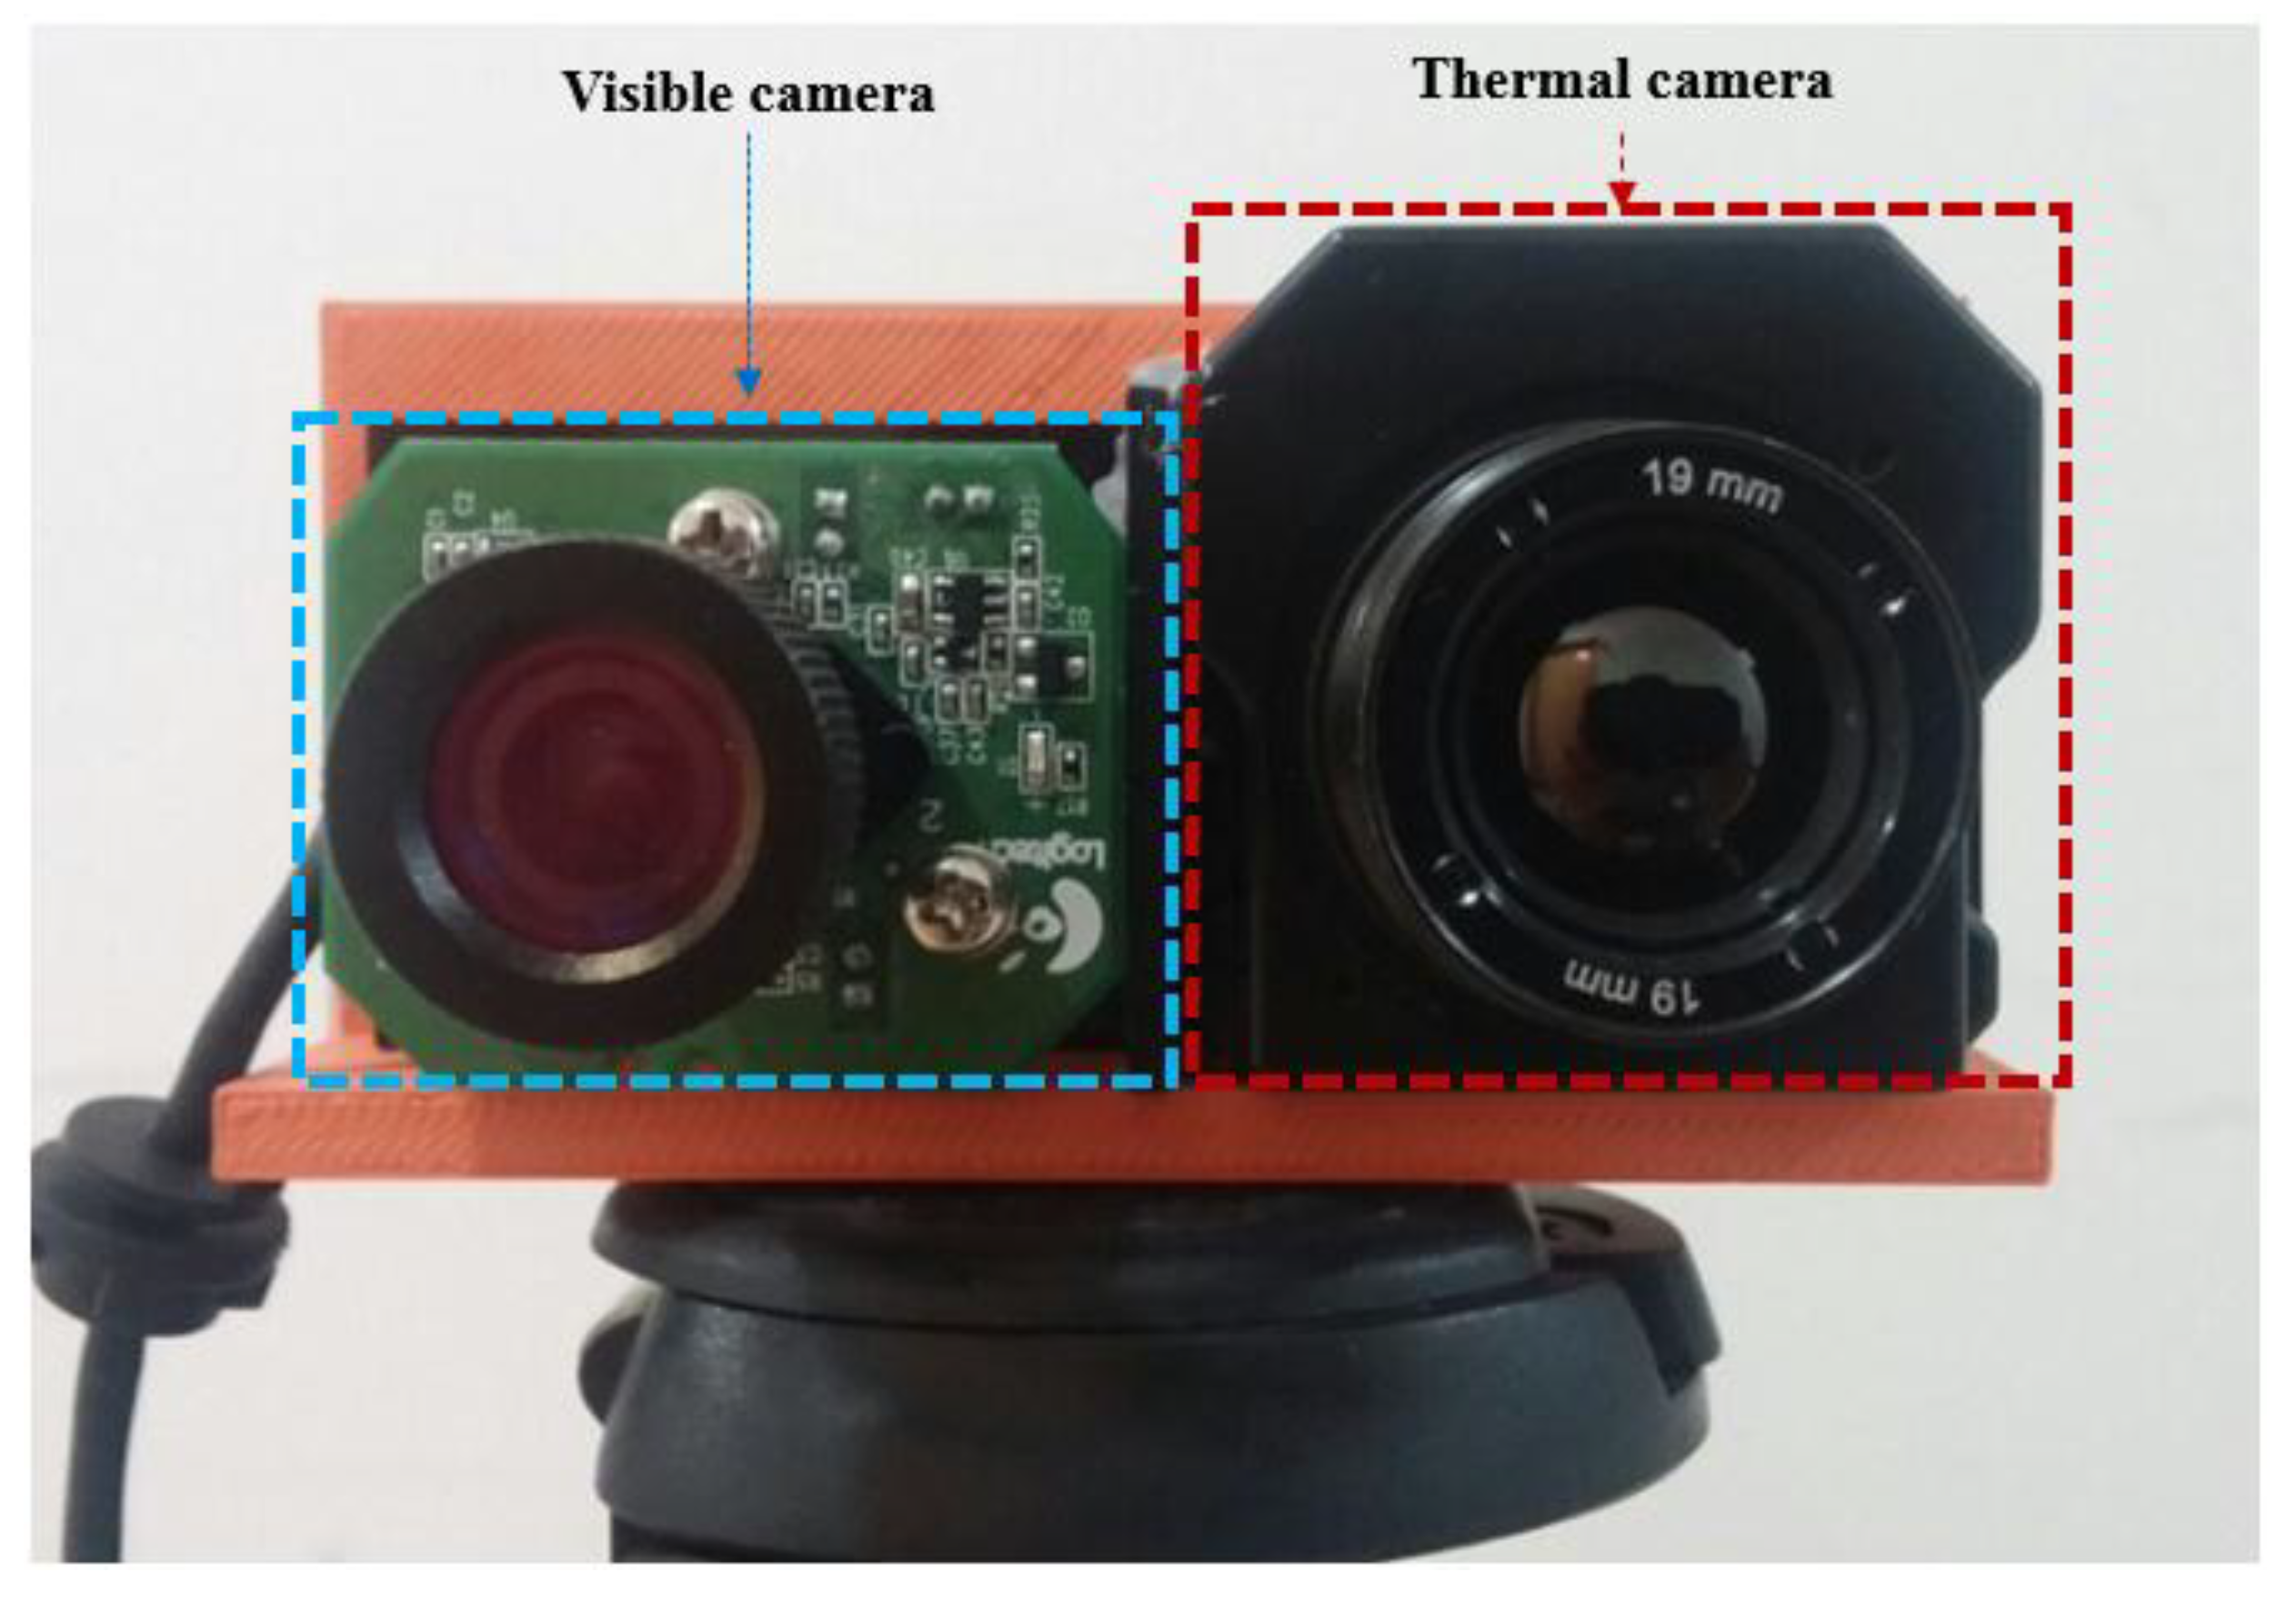
Figure 15.
Proposed dual camera system which is used for collecting database II.
Figure 15.
Proposed dual camera system which is used for collecting database II.
Like the first system of dual cameras in
Figure 1, we implement the dual camera system by combining visible light and thermal cameras in order to collect database II. A commercial thermal camera of FLIR Tau2 is used [
38]. It can capture an image of 640 × 480 pixels having a resolution of 8 bits in the wavelength range of 7.5–13.5 μm. A 19 mm lens is used in the thermal camera, and the field of view (FOV) of the thermal camera is 32° and 26° in the horizontal and vertical directions, respectively. The dimension (height × width × depth) and weight of the thermal camera are 1.75" × 1.75" × 1.18" and approximately 70 g, respectively.
The same web-camera of
Figure 1 is used as the visible light camera [
30]. The FOV of the visible light camera using a 6 mm lens is 42° and 32° in the horizontal and vertical directions, respectively, which is much wider than that of the visible light camera of
Figure 1. Our system acquires both the visible light image of 800 × 600 pixels and the thermal image of 640 × 480 pixel at the capturing speed of 30 frames per sec. By using the lenses of wider FOV for the visible light and thermal cameras of
Figure 15 than those of
Figure 1, our additional database (database II) includes the images of wider FOV compared to those by the system of
Figure 1 as shown in
Figure 12 (database I) and
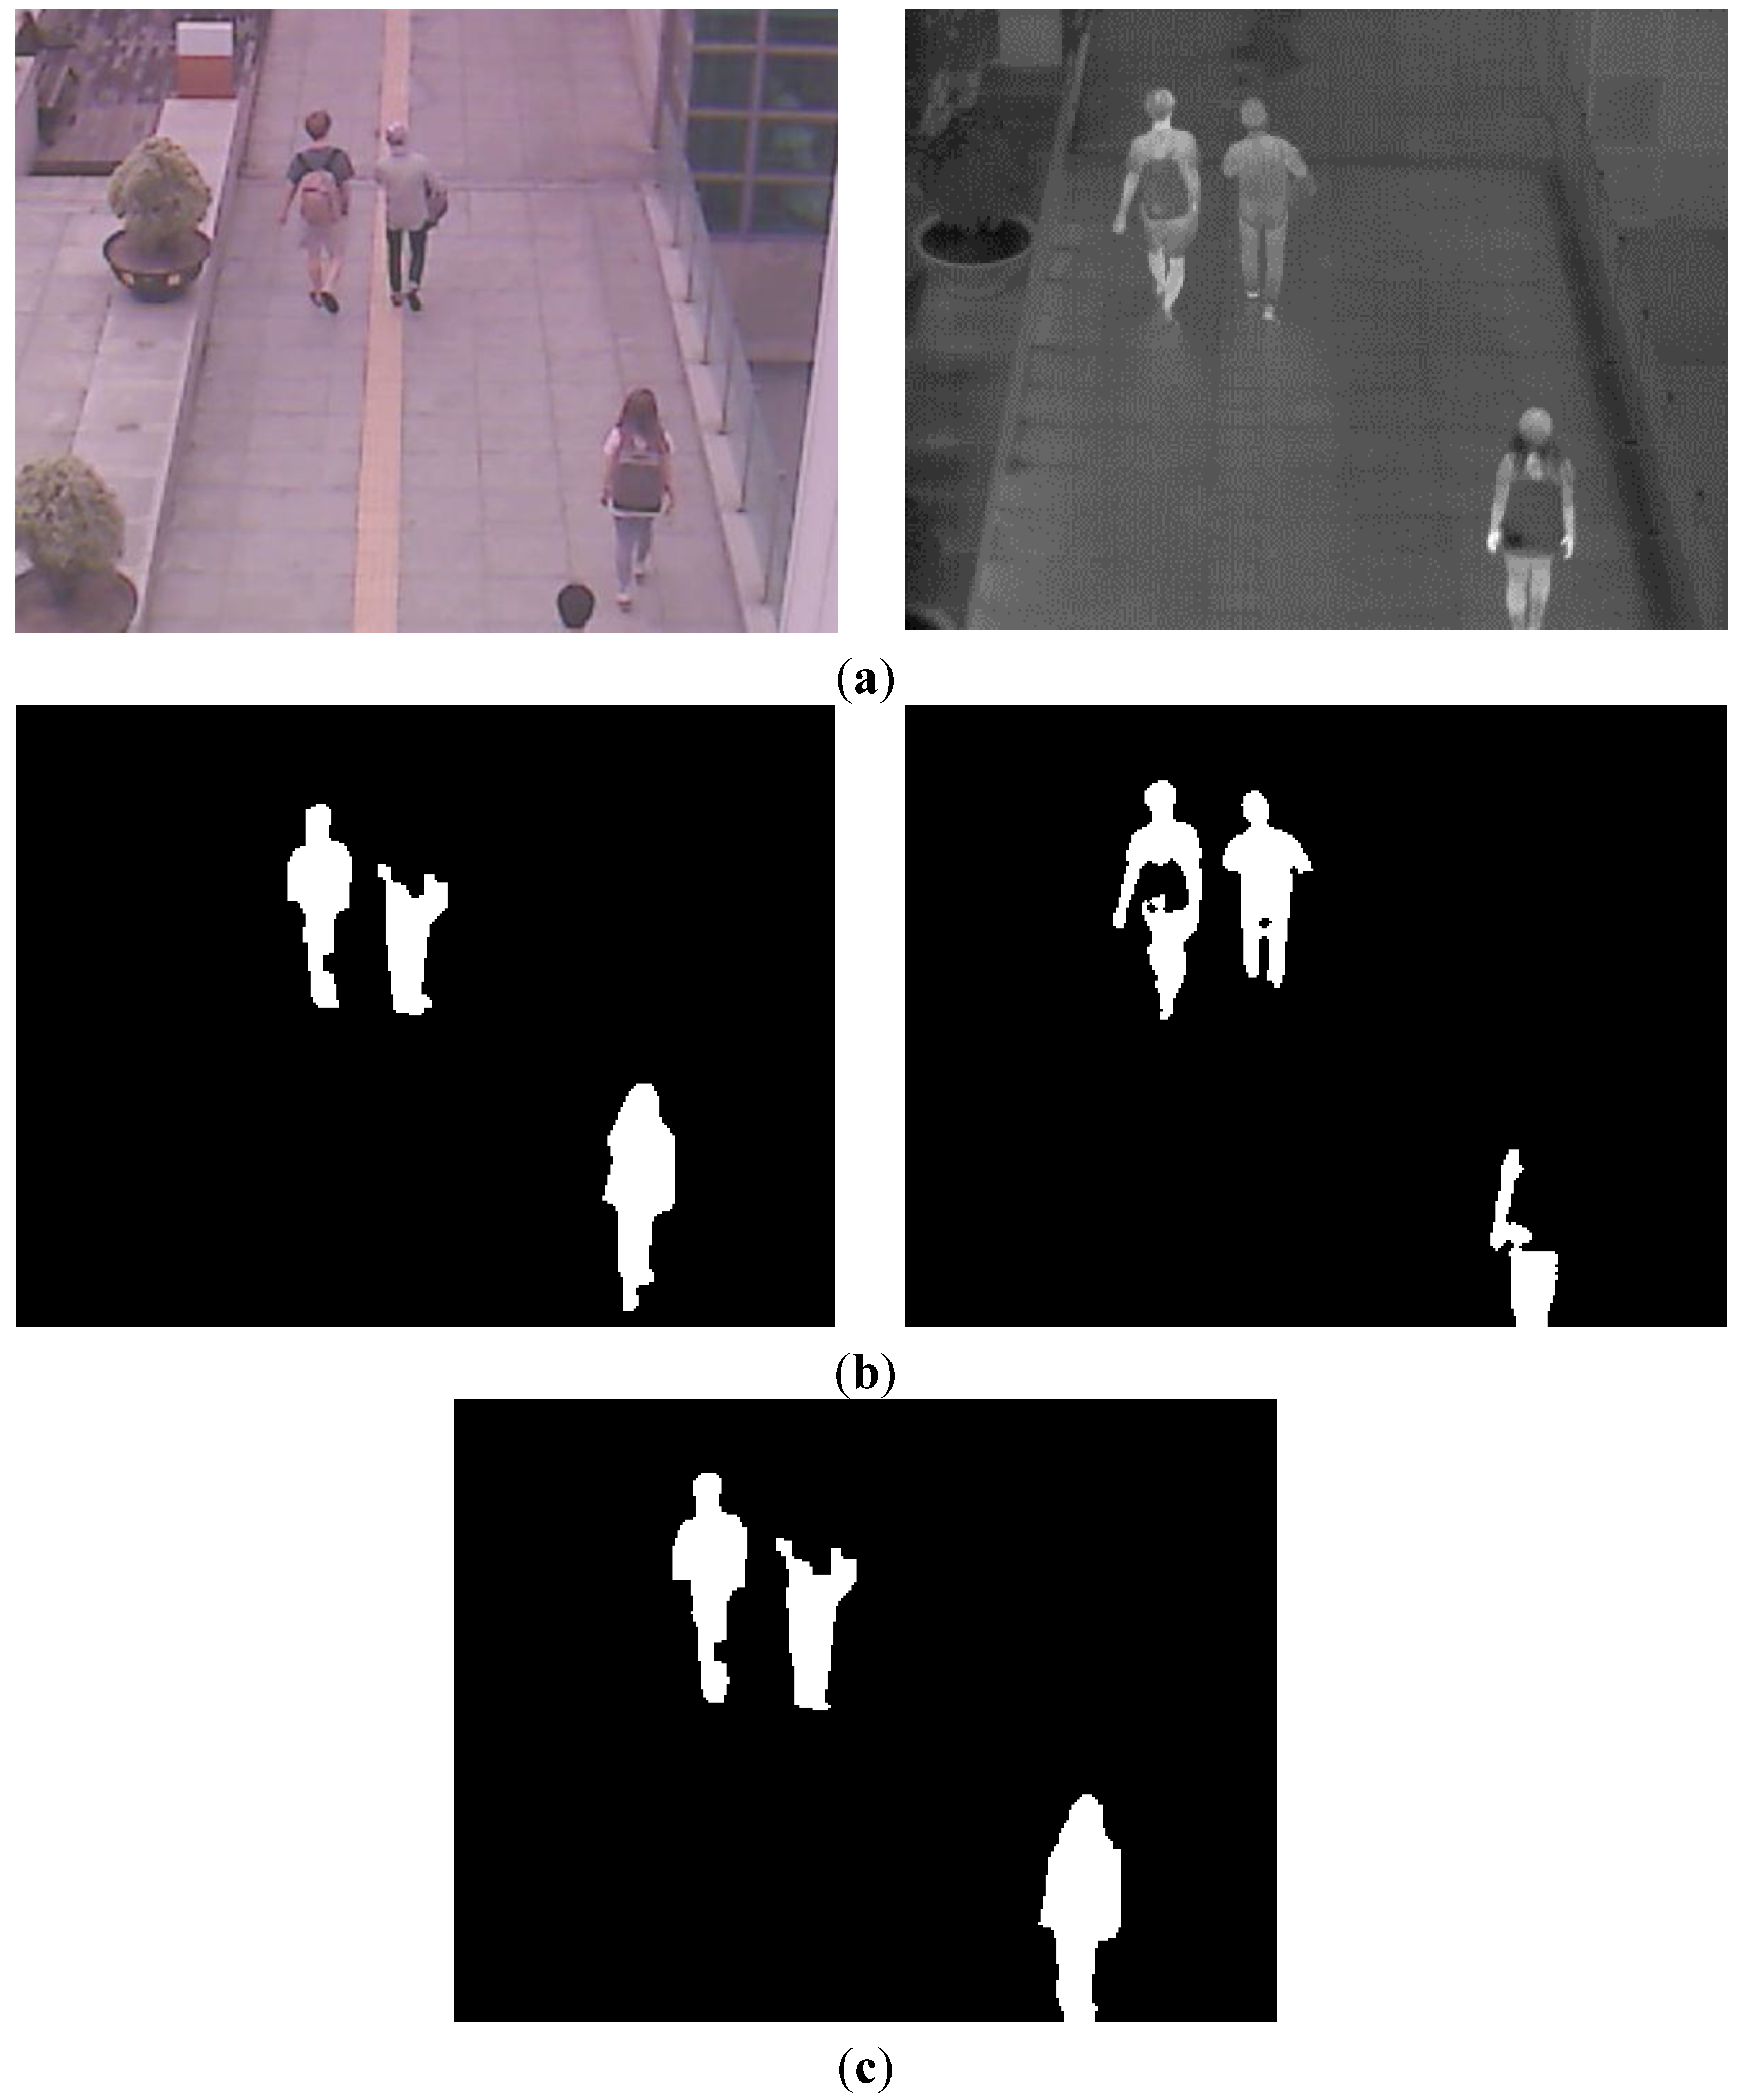
Figure 16 (database II). However, the size of people in the database II (
Figure 16) becomes smaller than that in database I (
Figure 12) due to the wider FOV.
Figure 16.
Examples of collected images in database II. Left and right figures of (a–d) are the images by visible light and thermal cameras, respectively. Image captured (a) in the morning; (b) in the afternoon; (c) at night; (d) on a rainy day.
Figure 16.
Examples of collected images in database II. Left and right figures of (a–d) are the images by visible light and thermal cameras, respectively. Image captured (a) in the morning; (b) in the afternoon; (c) at night; (d) on a rainy day.
In order to reduce the image disparity between the two cameras, we make the two axes of visible light and thermal cameras parallel in the horizontal direction with minimum horizontal distance between the two cameras as shown in
Figure 15.
Table 13.
Detection results using dual camera systems by our method with database II.
Table 13.
Detection results using dual camera systems by our method with database II.
| Environment | #Frame | #People | #TP | #FP | Recall (%) | Precision (%) |
|---|
| Morning | 200 | 167 | 135 | 1 | 80.84 | 99.26 |
| Afternoon | 200 | 216 | 210 | 26 | 97.22 | 88.98 |
| Night | 200 | 269 | 254 | 2 | 94.42 | 99.22 |
| Rainy day | 200 | 181 | 180 | 72 | 99.45 | 71.43 |
| Total | 800 | 833 | 779 | 101 | 93.52 | 88.52 |
Table 14.
Detection result using only visible light camera by our method with database II.
Table 14.
Detection result using only visible light camera by our method with database II.
| Environment | #Frame | #People | #TP | #FP | Recall (%) | Precision (%) |
|---|
| Morning | 200 | 167 | 48 | 16 | 28.74 | 75.00 |
| Afternoon | 200 | 216 | 132 | 28 | 61.11 | 82.50 |
| Night | 200 | 269 | 0 | 0 | 0 | Cannot be calculated |
| Rainy day | 200 | 181 | 142 | 70 | 78.45 | 66.98 |
| Total | 800 | 833 | 322 | 114 | 38.66 | 73.85 |
Table 15.
Detection result using only thermal camera by our method with database II.
Table 15.
Detection result using only thermal camera by our method with database II.
| Environment | #Frame | #People | #TP | #FP | Recall (%) | Precision (%) |
|---|
| Morning | 200 | 167 | 128 | 55 | 76.65 | 69.95 |
| Afternoon | 200 | 216 | 149 | 119 | 68.98 | 55.60 |
| Night | 200 | 269 | 241 | 35 | 89.59 | 87.32 |
| Rainy day | 200 | 181 | 180 | 5 | 99.45 | 97.30 |
| Total | 800 | 833 | 698 | 214 | 83.79 | 76.54 |
For the next experiment, we measured the processing time of our method with database II as shown in
Table 16. As shown in
Table 16, the total processing time is about 27.04 ms and we find that our system can be operated at the speed of about 36.98 frames/s (1000/27.04). By comparing the processing time of
Table 7, the processing time of Steps (1)–(4), (7) and (8) in
Table 16 is much smaller than that of
Table 7. That is because the thermal image in database I (used in
Table 7) includes a lot of noises and additional median filtering is included in the Steps (1)–(4), (7) and (8) in
Table 7.
As the next test, we compare our algorithm with previous detectors [
8,
14,
22] with database II. Because their method is for the pedestrian detection and tracking in thermal image [
22], we compared the performance by our method in thermal image (
Table 15) and that by their method. As shown in
Table 15 and
Table 17, average recall and precision by our method are higher than those by previous method [
22]. In addition, we compared the processing time of our method with that by previous method [
22]. The total processing time of our method is 27.04 ms (
Table 16) which is smaller than that by previous method (59.14 ms). From these results, we can confirm that our method outperforms the previous one [
22].
Table 16.
Processing time of our method with database II.
Table 16.
Processing time of our method with database II.
| Steps of Figure 3 | Processing Time (ms) |
|---|
| Steps (1)–(4), (7) and (8) | 0.003 |
| Steps (5) and (6) | 1.60 |
| Steps (9)–(12) | 18.10 |
| Step (13) | 0.97 |
| Steps (14) and (15) | 5.69 |
| Steps (16)–(18) | 0.68 |
| Total | 27.04 |
Table 17.
Detection result using only thermal camera by previous method [
22] with database II.
Table 17.
Detection result using only thermal camera by previous method [22] with database II.
| Environment | #Frame | #People | #TP | #FP | Recall (%) | Precision (%) |
|---|
| Morning | 200 | 167 | 80 | 103 | 47.90 | 43.72 |
| Afternoon | 200 | 216 | 177 | 83 | 81.94 | 68.08 |
| Night | 200 | 269 | 206 | 52 | 76.58 | 79.85 |
| Rainy day | 200 | 181 | 150 | 10 | 82.87 | 93.75 |
| Total | 800 | 833 | 613 | 248 | 73.59 | 71.20 |
In the next experiment, we compared the performance by our method with that by previous detector [
8,
14]. Because their method can be applied to both the visible light and thermal images [
8,
14], we compared the performances by our method in visible light (
Table 14) and thermal image (
Table 15) and those by their method. As shown in
Table 14 and
Table 18, average recall and precision in visible light image by our method are higher than those by previous method [
8,
14]. In addition, as shown in
Table 15 and
Table 19, average recall and precision in thermal image by our method are higher than those by previous method [
8,
14]. In addition, we compared the processing time of our method with that by previous method [
8,
14]. The total processing time of our method is 27.04 ms (
Table 16) which is smaller than that by previous method (54.55 ms). From these results, we can confirm that our method outperforms the previous one [
8,
14].
Table 18.
Detection result using only visible light camera by previous method [
8,
14] with database II.
Table 18.
Detection result using only visible light camera by previous method [8,14] with database II.
| Environment | #Frame | #People | #TP | #FP | Recall (%) | Precision (%) |
|---|
| Morning | 200 | 167 | 32 | 20 | 19.16 | 61.54 |
| Afternoon | 200 | 216 | 117 | 45 | 54.17 | 72.22 |
| Night | 200 | 269 | 0 | 0 | 0 | Cannot be calculated |
| Rainy day | 200 | 181 | 147 | 92 | 81.22 | 61.51 |
| Total | 800 | 833 | 296 | 157 | 35.53 | 65.34 |
Table 19.
Detection result using only thermal camera by previous method [
8,
14] with database II.
Table 19.
Detection result using only thermal camera by previous method [8,14] with database II.
| Environment | #Frame | #People | #TP | #FP | Recall (%) | Precision (%) |
|---|
| Morning | 200 | 167 | 108 | 48 | 64.67 | 69.23 |
| Afternoon | 200 | 216 | 121 | 98 | 56.02 | 55.25 |
| Night | 200 | 269 | 237 | 44 | 88.10 | 84.34 |
| Rainy day | 200 | 181 | 177 | 19 | 97.79 | 90.31 |
| Total | 800 | 833 | 643 | 209 | 77.19 | 75.47 |
In addition, we compared the background subtraction by our method with that based on Gaussian background-subtraction approach which has been widely used [
37] with database II. For fair comparisons, only the background update and subtraction (Steps (1)–(5) and (7)–(9) of
Figure 3) are replaced by [
37] when measuring the performance by previous method [
37]. Because their method can be applied to both the visible light and thermal images, we compared the performances by our method in visible light (
Table 14) and thermal image (
Table 15) and those by their method.
As shown in
Table 14 and
Table 20, average recall and precision in visible light image by our background subtraction method are higher than those by previous method [
37]. In addition, as shown in
Table 15 and
Table 21, average recall and precision in thermal image by our background subtraction method are higher than those by previous method [
37]. In addition, we compared the processing time of our background subtraction method with that by previous method [
37]. The total processing time of our method is 7.73 ms (Steps (1)–(5), and (7)–(9) of
Table 16) which is smaller than that by previous method (51.54 ms). From these results, we can confirm that our background subtraction method outperforms the previous one [
37].
Table 20.
Detection result using only visible light camera by previous method [
37] with database II.
Table 20.
Detection result using only visible light camera by previous method [37] with database II.
| Environment | #Frame | #People | #TP | #FP | Recall (%) | Precision (%) |
|---|
| Morning | 200 | 167 | 27 | 0 | 16.17 | 100 |
| Afternoon | 200 | 216 | 118 | 28 | 54.63 | 80.82 |
| Night | 200 | 269 | 0 | 0 | 0 | Cannot be calculated |
| Rainy day | 200 | 181 | 102 | 73 | 56.35 | 58.29 |
| Total | 800 | 833 | 247 | 101 | 29.65 | 70.98 |
Table 21.
Detection result using only thermal camera by previous method [
37] with database II.
Table 21.
Detection result using only thermal camera by previous method [37] with database II.
| Environment | #Frame | #People | #TP | #FP | Recall (%) | Precision (%) |
|---|
| Morning | 200 | 167 | 129 | 50 | 77.25 | 72.07 |
| Afternoon | 200 | 216 | 139 | 124 | 64.35 | 52.85 |
| Night | 200 | 269 | 178 | 34 | 66.17 | 83.96 |
| Rainy day | 200 | 181 | 180 | 5 | 99.45 | 97.30 |
| Total | 800 | 833 | 626 | 213 | 75.15 | 74.61 |
In our system, the background image (where no human area is included) is manually saved, and this procedure is performed one time only at the initial setup of our system. If the human area exists in the current input image, the pixel difference between the input and background images becomes large (the condition of Step 2 of
Figure 3 makes a result of “Yes”), and the background update is not performed as shown in the Step 2 of
Figure 3, consequently. Therefore, even in the case that the human area remains steady in the current input images, the initial background (not including the human area) is not updated due to the condition of the Step 2 of
Figure 3, and the human areas can be detected by our background subtraction between the input and background images.
In previous researches [
39,
40], Serrano-Cuerda
et al., proposed the method of human detection by the fusion of visible light and thermal videos. In their method, the detection result from the thermal or visible light images is adaptively selected based on the confidence level of the thermal or visible light image. Castillo
et al., proposed the method of detecting dangerous situations at home, such as falls, by using color and thermal cameras [
41]. In their method, the behavior of fall is recognized based on fuzzy system, and the recognition is done independently on the indoor images of visible light and thermal cameras, respectively. The two decisions (Yes or No) of the behavior of fall from the images of visible light and thermal cameras are combined in decision level fusion.
In another research [
42], they proposed the multi-agent system for infrared and color video fusion. They showed the method of adaptively selecting the detection result from the thermal or visible light images based on the confidence level of the thermal or visible light image like the researches [
39,
40]. However, they did not show the detail method of refining the detected area of human by fusing the positional information of two detected areas of human in visible light and thermal images. In other research [
43], they proposed the method of extracting the ROI of human by combining the information of binarized input image and motion. They used only the thermal image without the visible light ones.
The main characteristics of these researches are that they adaptively select the detection result of human from the thermal or visible light images based on the confidence level of the thermal or visible light image. The confidence level of the image is determined by the average gray value of the input image by visible light camera and the ratio of the average gray value of the input image by thermal camera to the standard deviation of the input image by thermal camera. However, in our research, as shown in
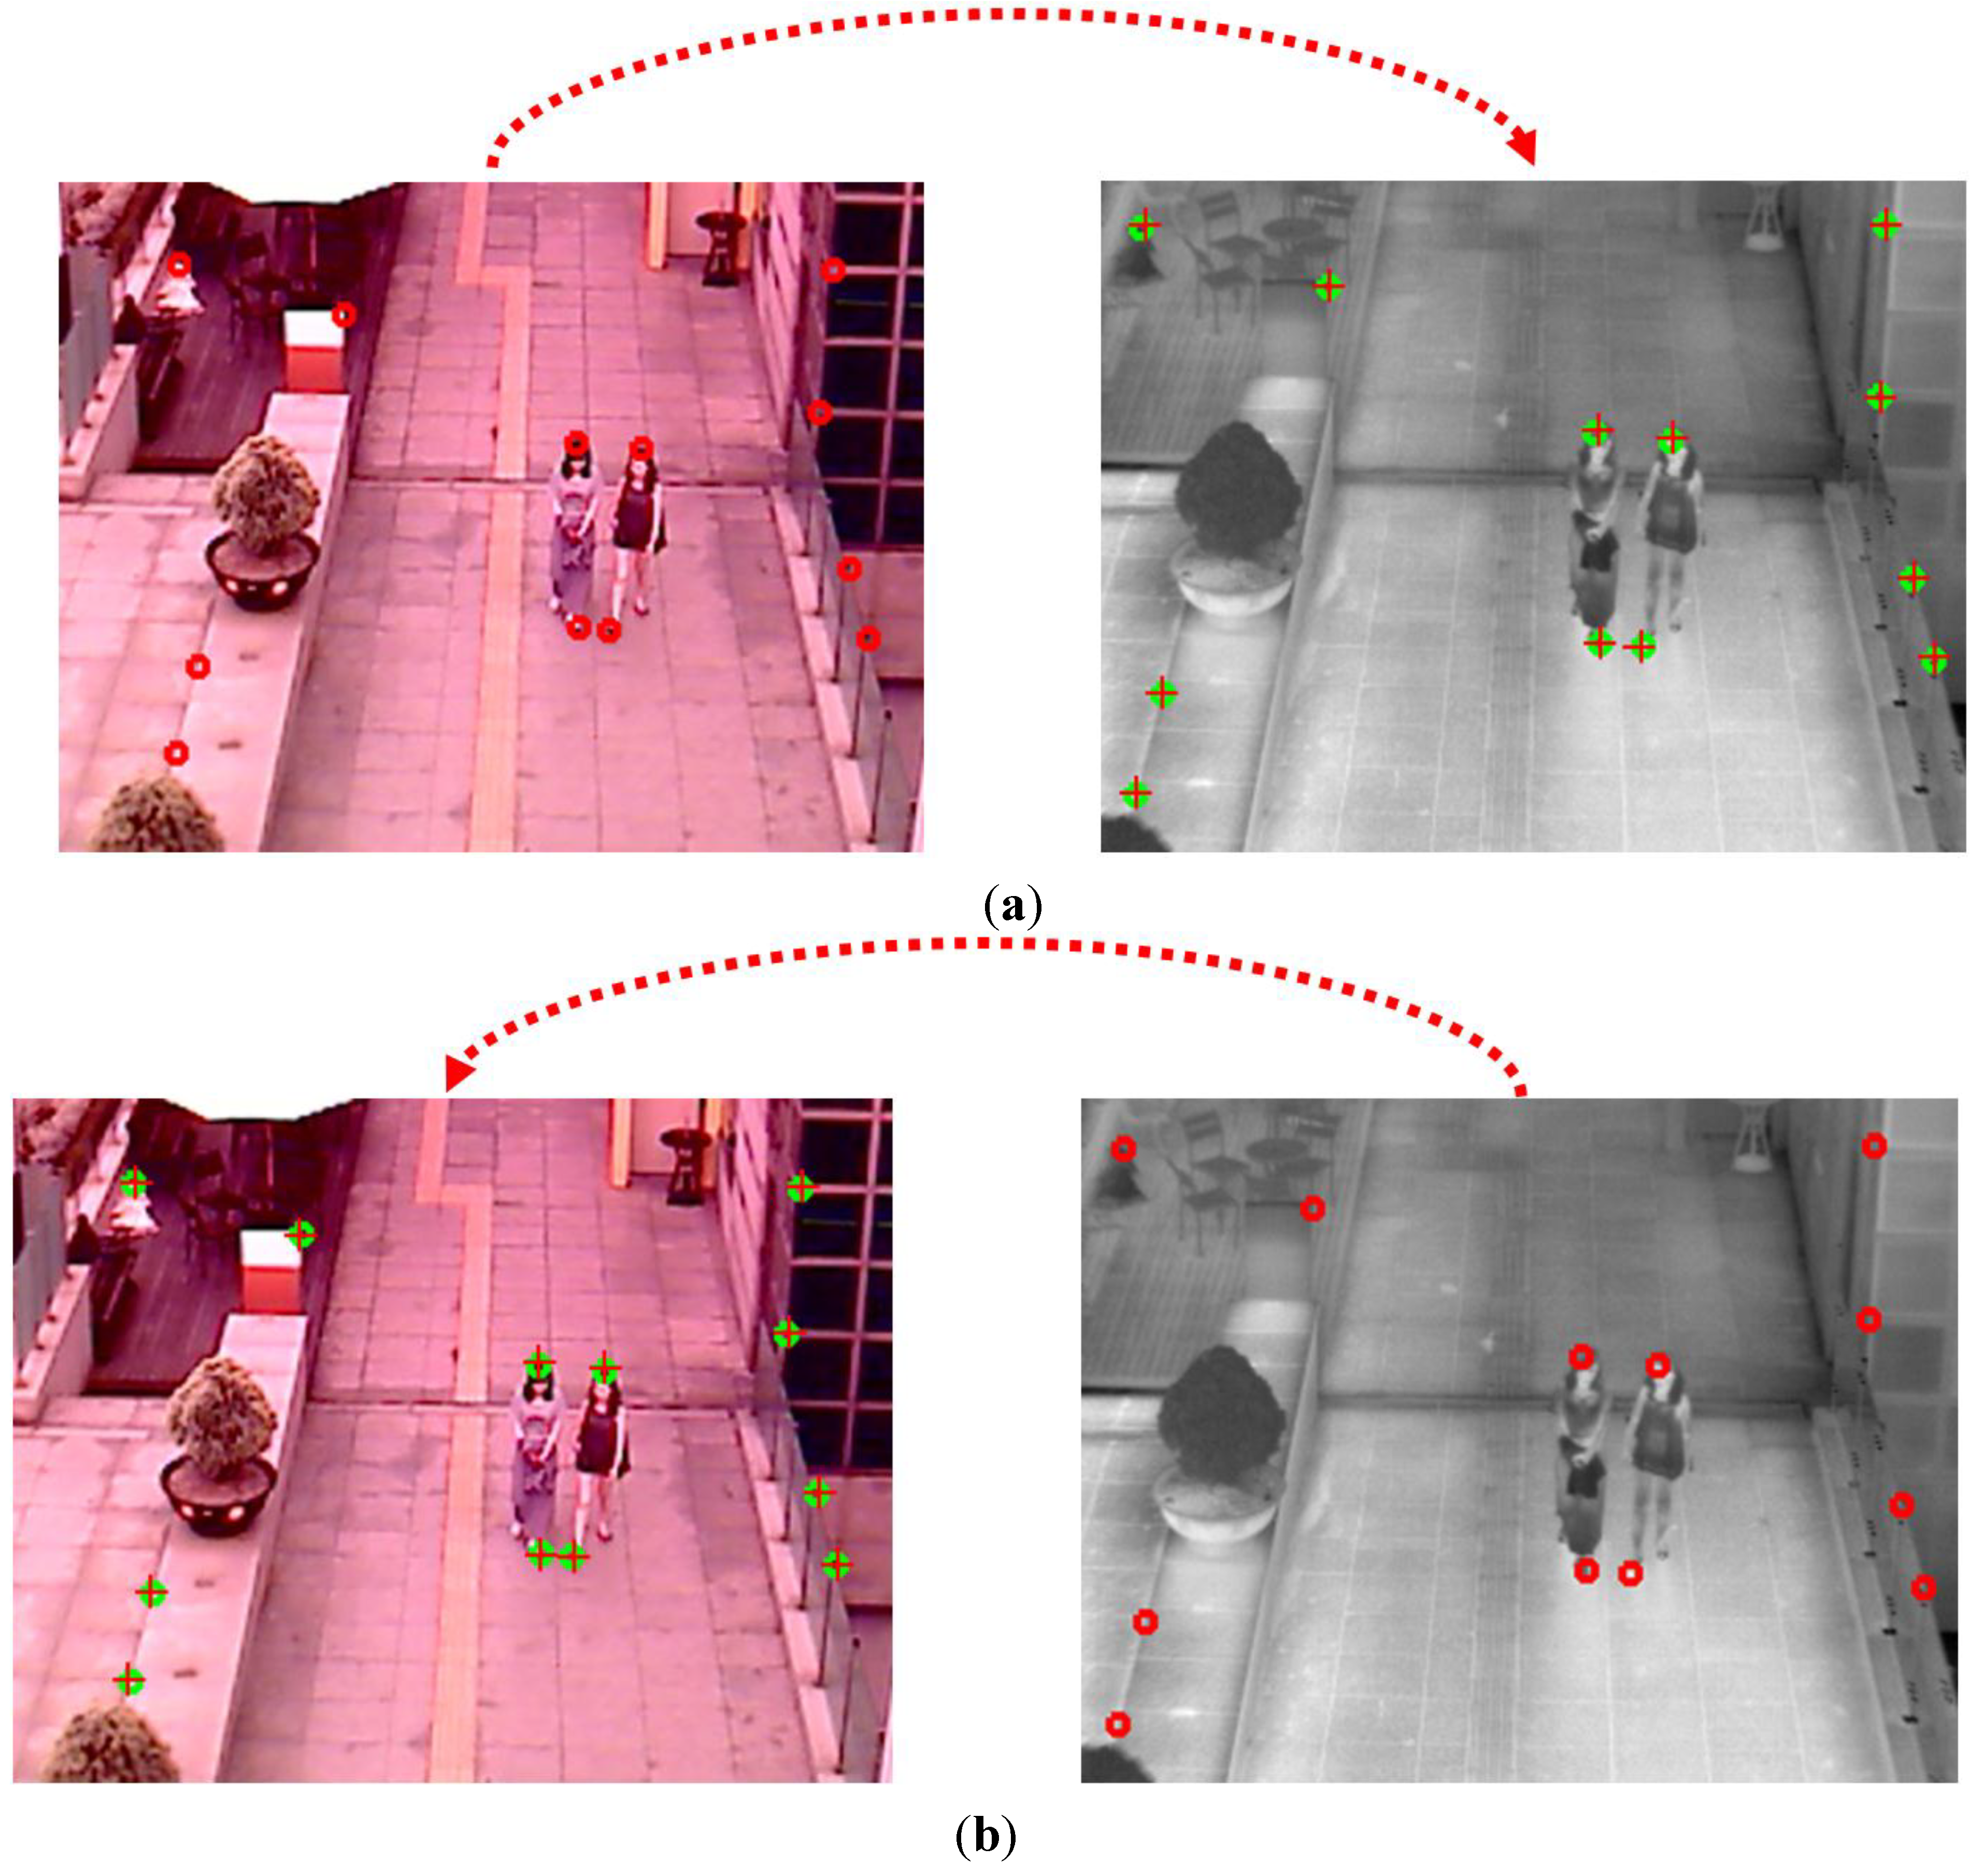
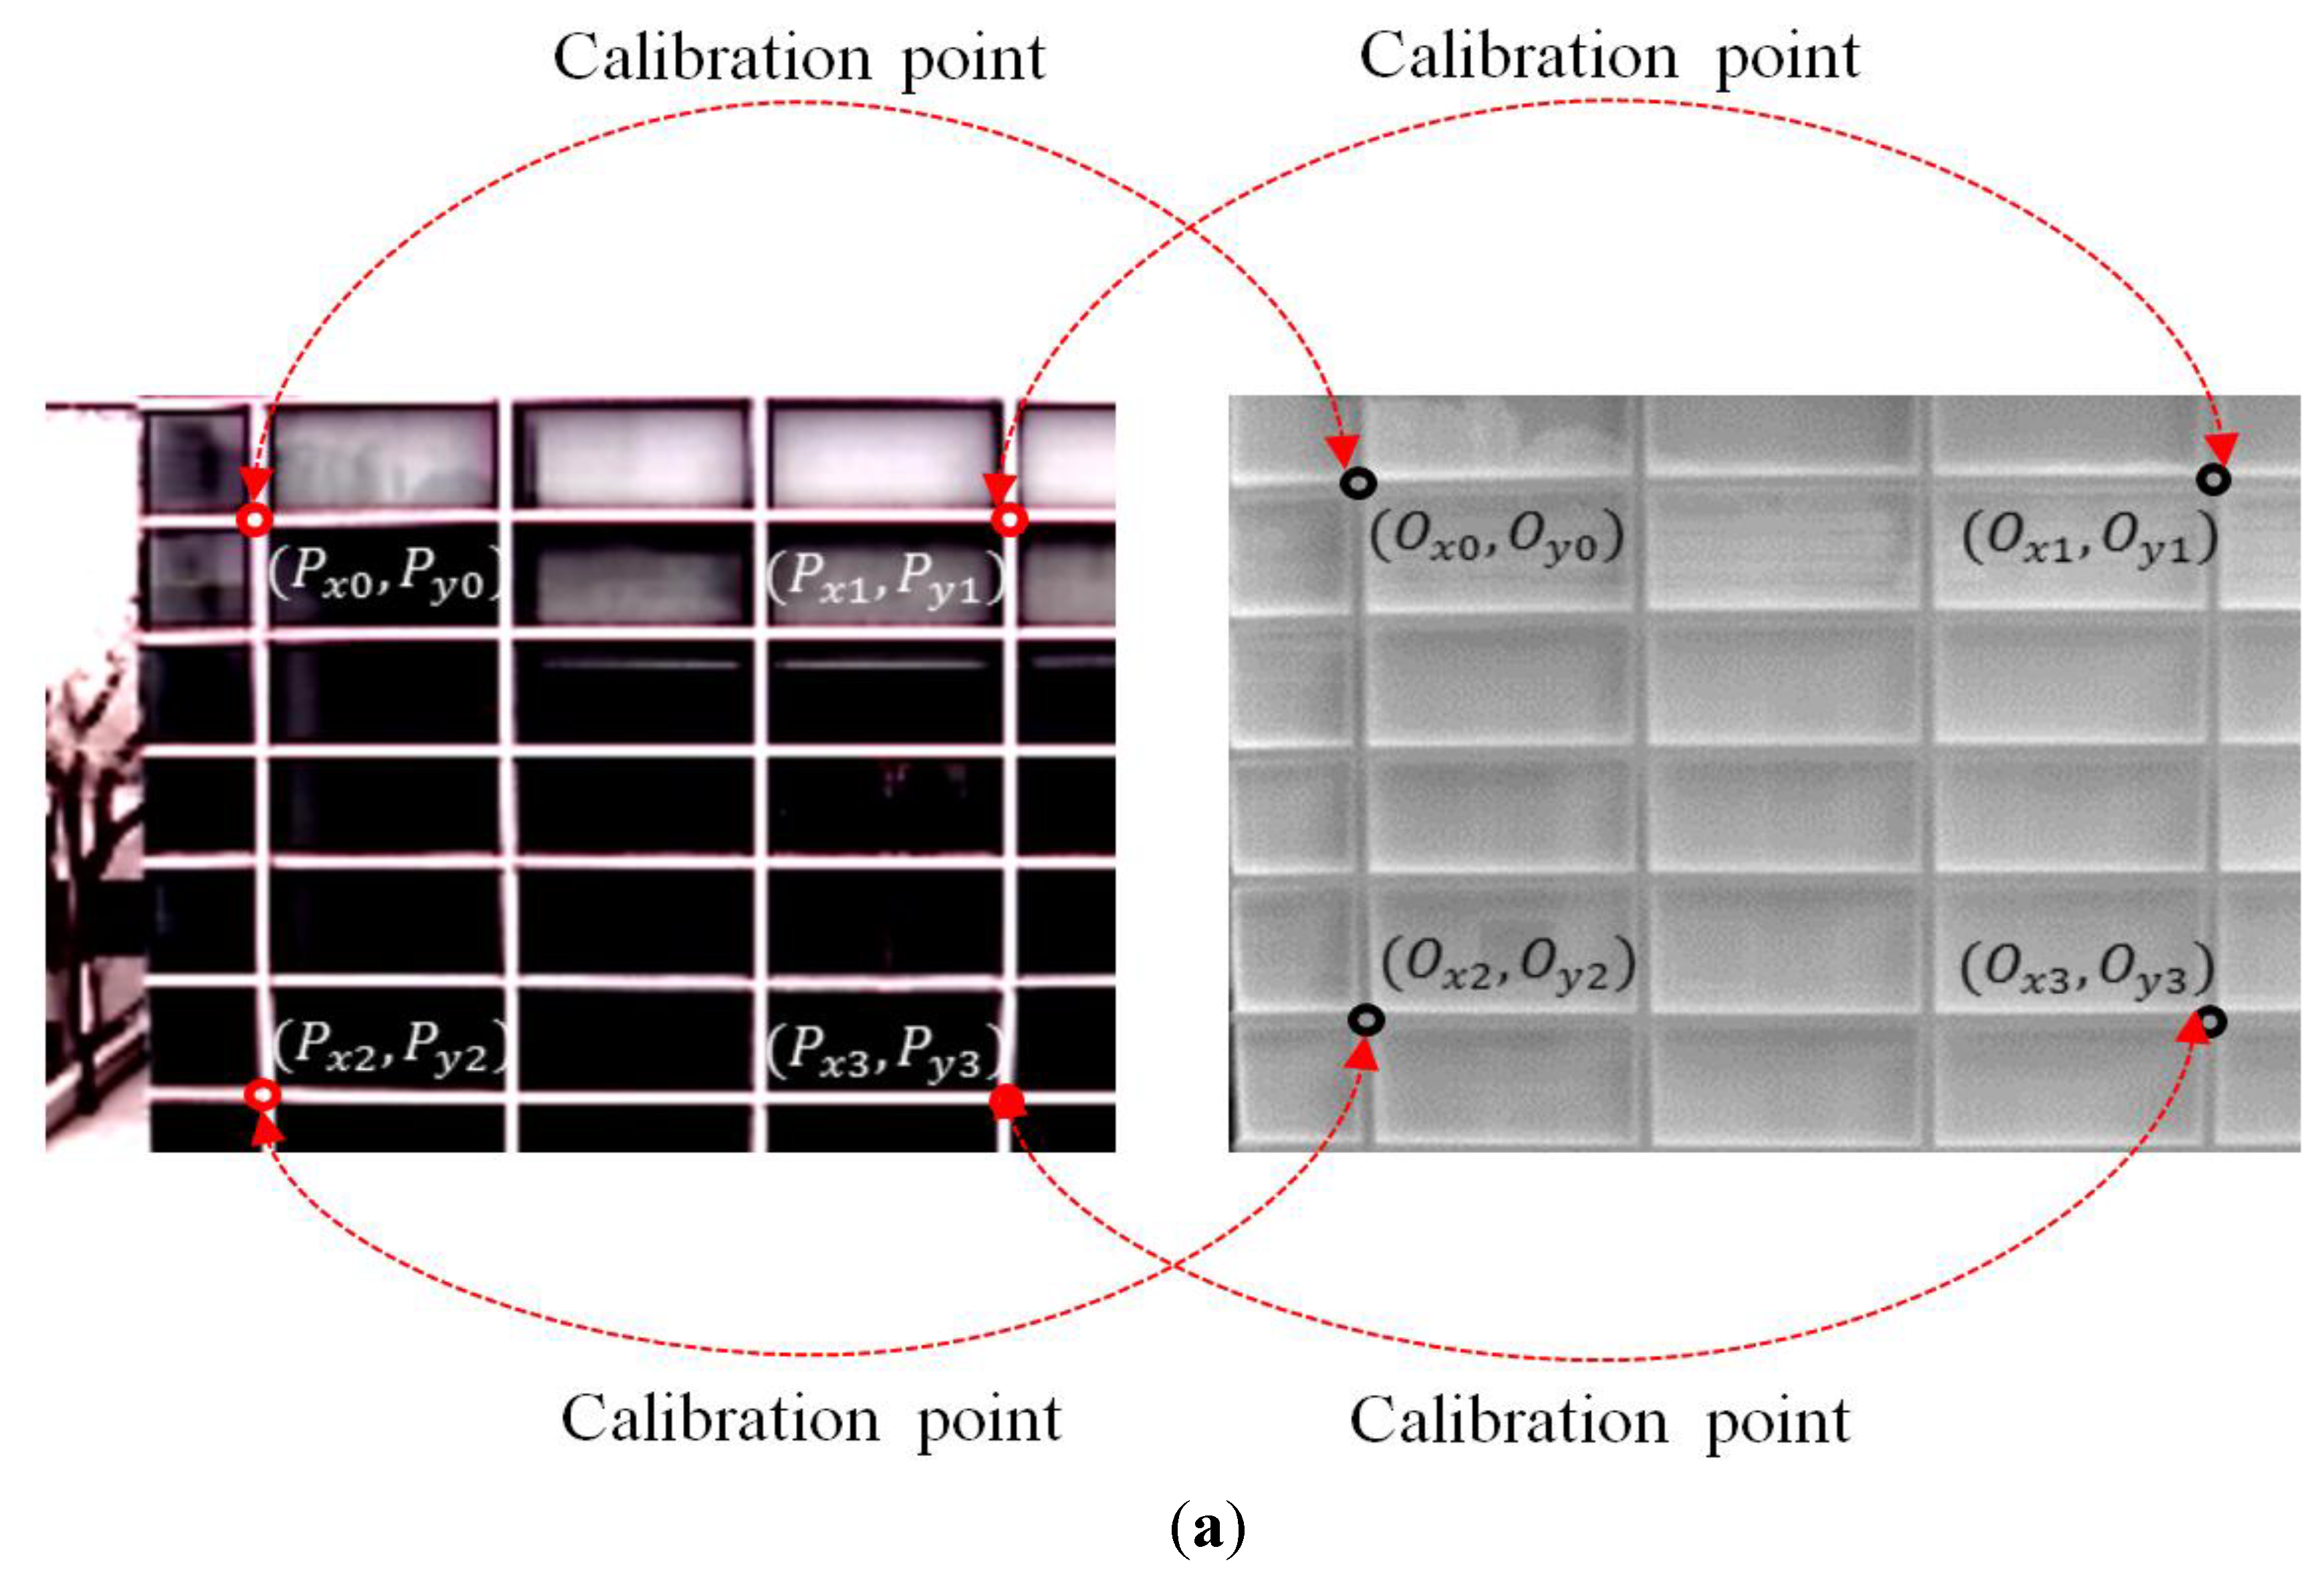
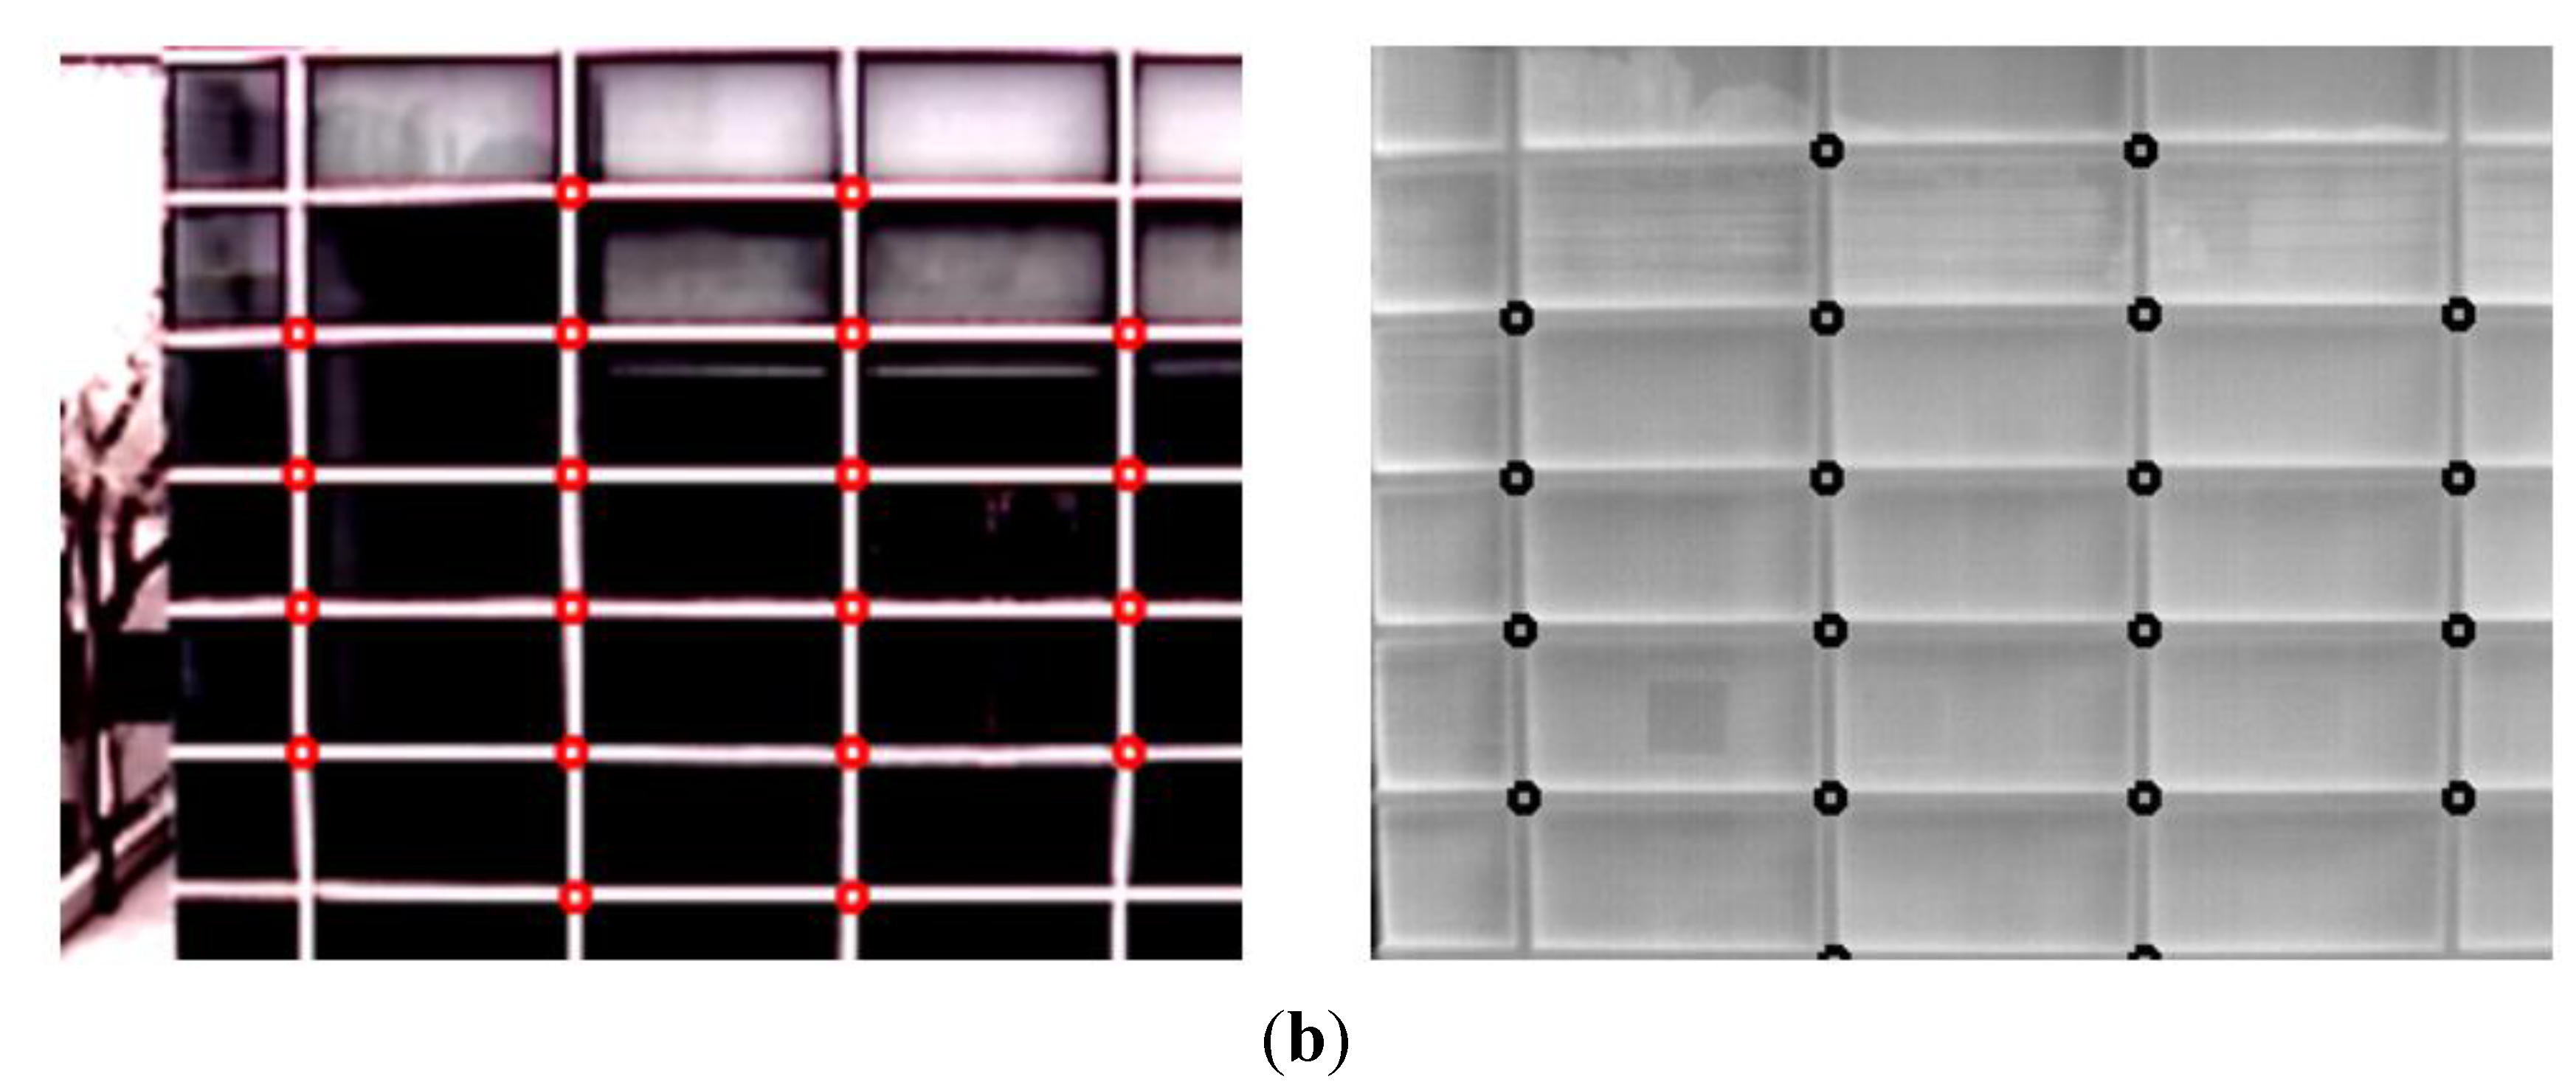
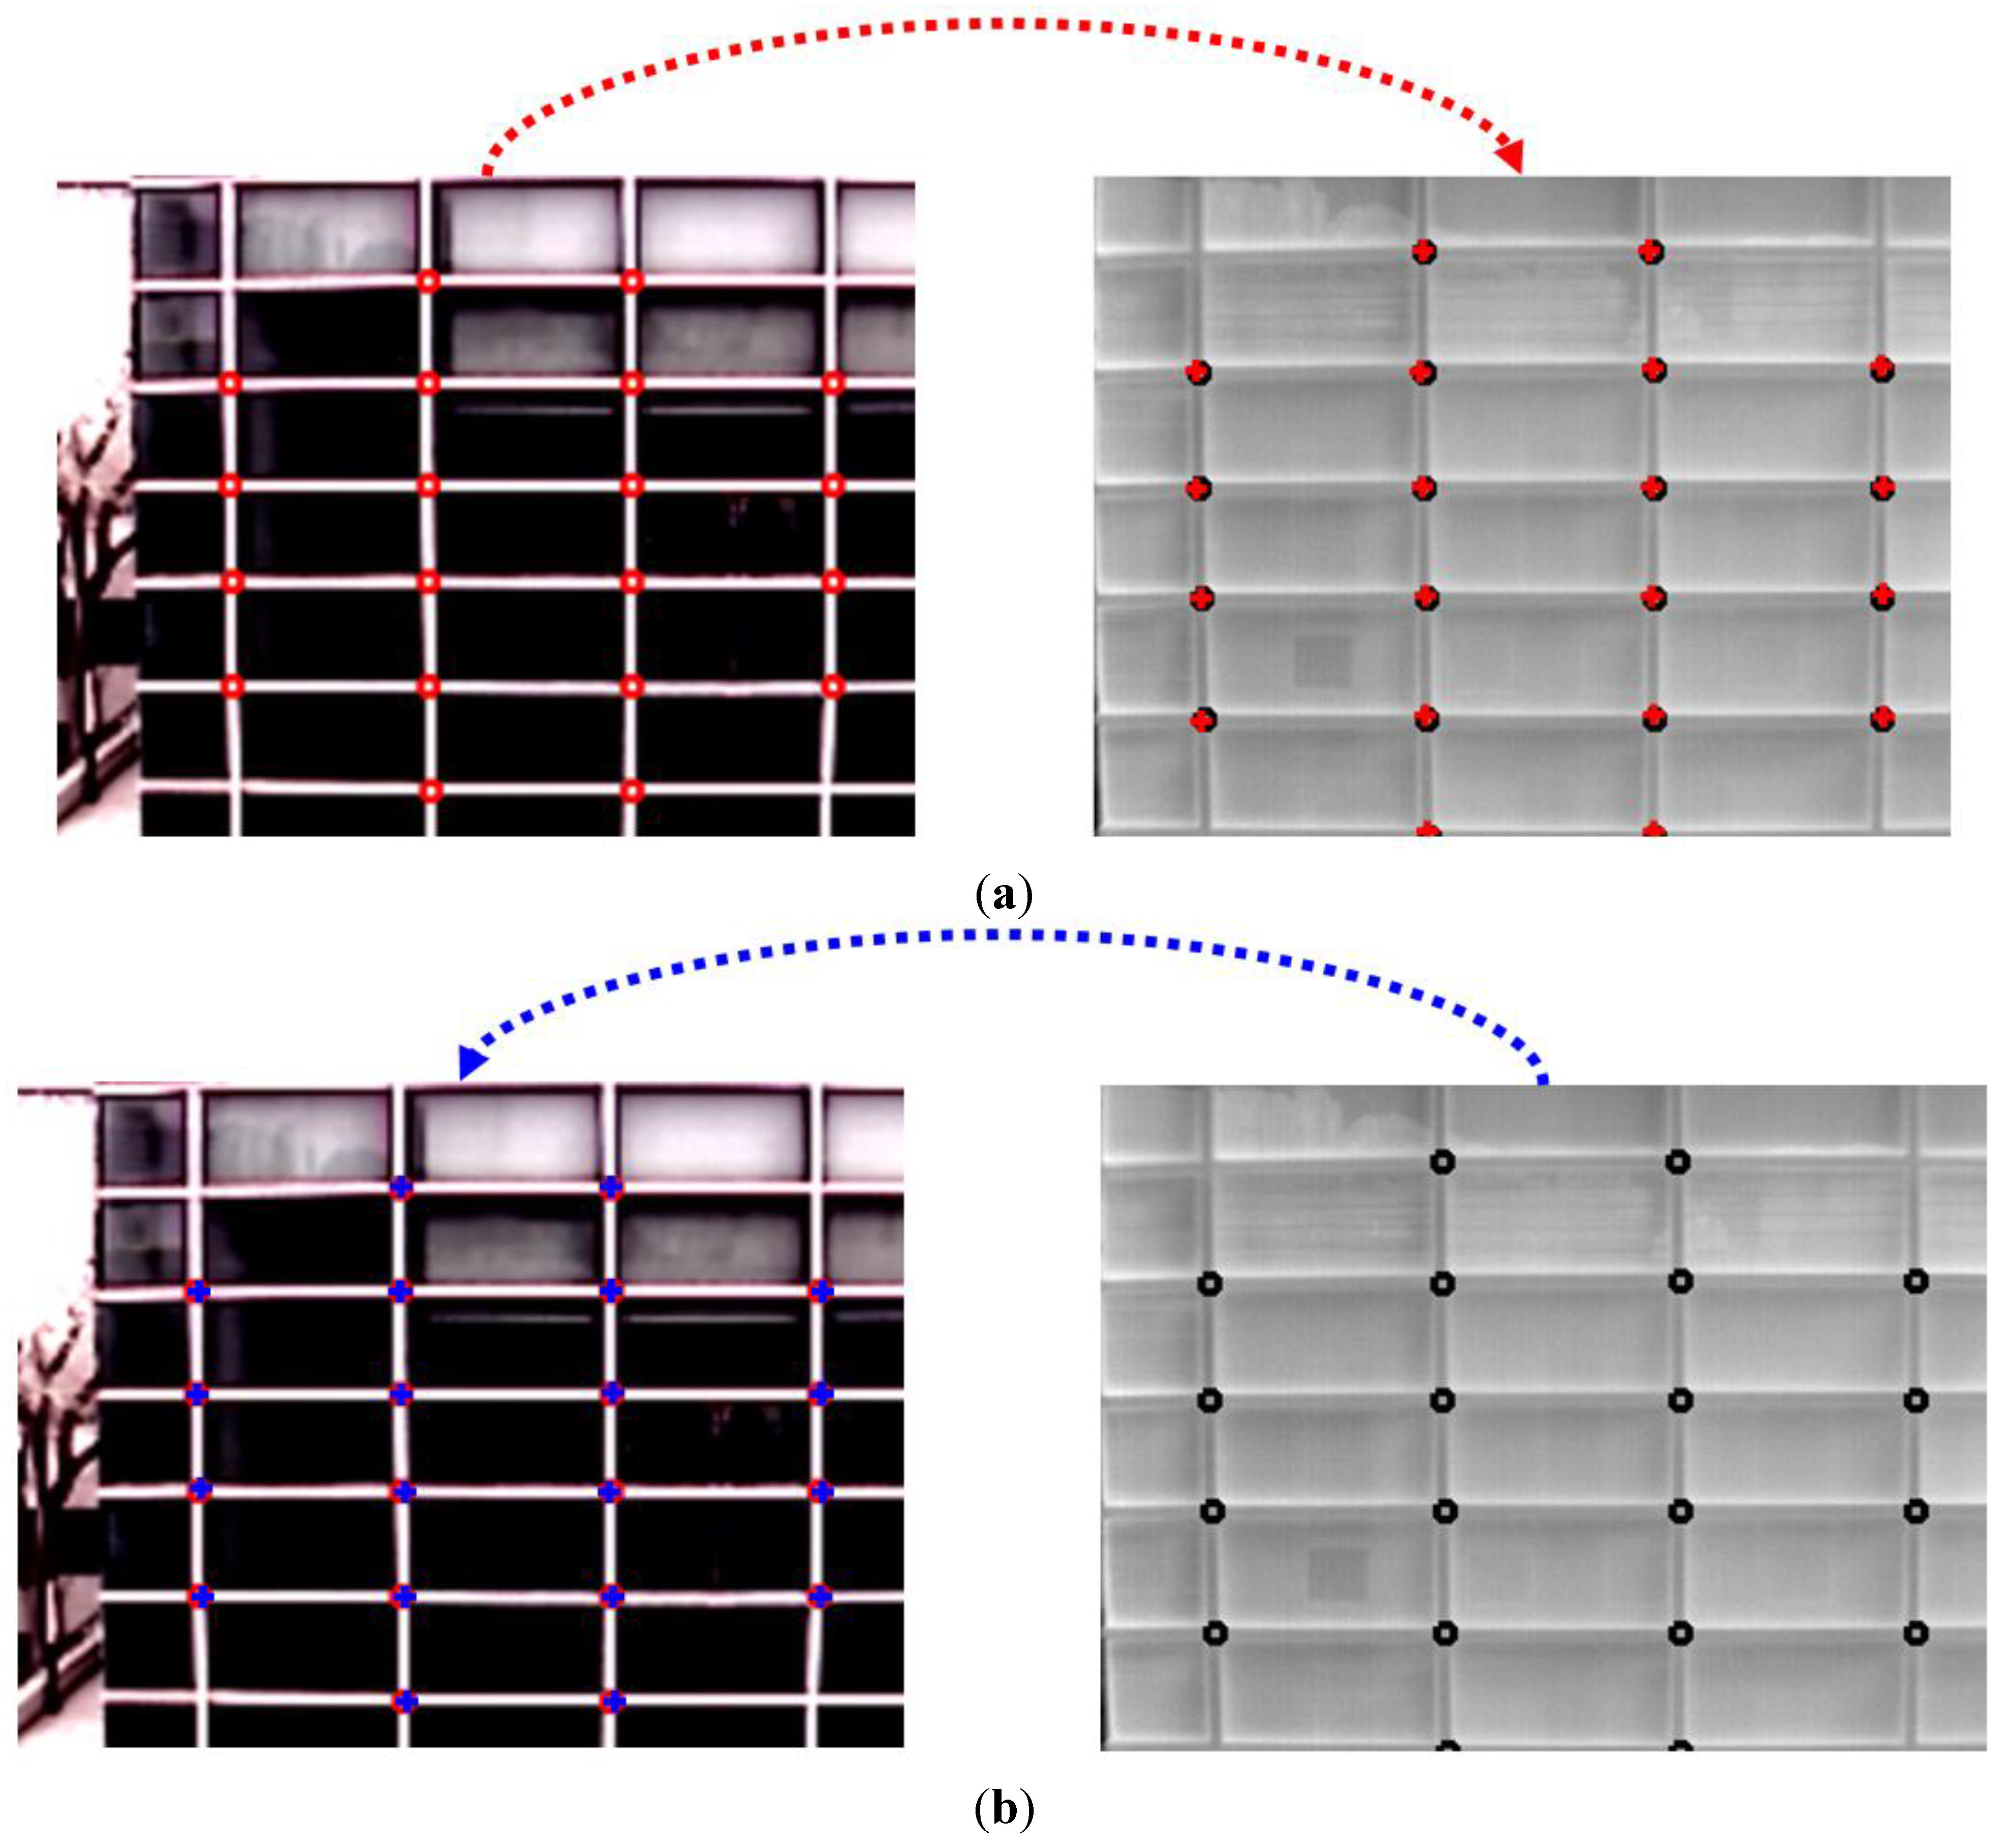
Figure 7 and
Figure 9, we fuse the two detected areas (CWI and CSI) of human in visible light and thermal images by the mapping of pixel positions based on the geometric transform (of Equations (1) and (2)) between two cameras as shown in
Figure 3. In addition, we quantitatively measured the accuracy of mapping of pixel positions based on the geometric transform as shown in
Figure 10 and
Figure 11 and
Table 2 and
Table 3. By combining the two detected areas of human as shown in the Step (16) of
Figure 3, more refined areas of human can be obtained by our method. This is the 1st and main difference between our method and previous researches.
For the second difference between our method and these previous researches, we adaptively update two background images for visible light and thermal cameras when the pixel difference between an input thermal image and pre-stored thermal background image is smaller than the threshold whereas the previous method used adaptive Gaussian background modeling [
40]. In addition, we do not use the scheme of frame subtraction (motion information) whereas the previous researches adopted this scheme [
39,
40,
43]. These schemes of Gaussian background modeling and frame subtraction have the disadvantage that they cannot cover the cases that human is not moved in all the frames. We overcome this disadvantage by fusing the two detected areas (CWI and CSI) of human in visible light and thermal images, and these two areas are obtained by adaptive updating of the background image (Steps (4) and (8) of
Figure 3) and background subtraction (Steps (5), (9) and (14) of
Figure 3).
In
Figure 14 and
Table 5,
Table 6,
Table 11 and
Table 12, we compared the accuracies of human detection with our method and Gaussian background modeling [
37]. As shown in
Figure 14 and
Table 11 and
Table 12, we find that the accuracy in our method is higher than that by Gaussian background modeling. As mentioned before, the total processing time of our method is 7.73 ms (Steps (1)–(5), and (7)–(9) of
Table 7) which is smaller than that by previous method (51.54 ms) [
37]. From these results, we can confirm that our background subtraction method outperforms the previous one [
37].
For the third difference, by using the background subtraction based on the adaptive thresholding for binarization considering the background temperature as shown in Equations (4)–(7), we can obtain the candidate region of human, which is less affected by the temperature of background.
For the last difference between our method and these previous researches, in addition to the accuracies of human detection, we provide the processing speed of our method as shown in
Table 7 considering the real-time application of intelligent surveillance system. However, previous researches did not show the results of processing speed [
39,
40,
41,
42,
43].
The final goal of our research is to recognize the behavior of people in various environments outdoors, and this will be our next research. However, in the OSU thermal pedestrian database, OSU color-thermal database, and terravic motion IR database of OTCBVS dataset collection [
33], the people size is so small that they are difficult to be used for behavioral recognition. In addition, in the pedestrian infrared/visible stereo video dataset of OTCBVS dataset collection [
33], although the people size is large enough for behavioral recognition, they are collected indoors (not in various environments of outdoors). Therefore, we used our own database (database I) of 2000 images collected in various outdoor environments (morning, afternoon, nights and rainy day) as shown in
Figure 12. In addition, we collected the additional database (database II which includes 800 images) as shown in
Figure 16 for the experiments by using the dual cameras of wide FOV. Through the experimental results of
Table 4,
Table 5,
Table 6,
Table 7,
Table 8,
Table 9,
Table 10,
Table 11,
Table 12,
Table 13,
Table 14,
Table 15,
Table 16,
Table 17,
Table 18,
Table 19,
Table 20 and
Table 21 and
Figure 12,
Figure 13,
Figure 14,
Figure 15 and
Figure 16 with databases I and II, we can confirm our method is robust to the kinds of camera and database, and the performance of our method is better than previous ones [
8,
14,
22,
37].


