1. Introduction
Fingerprint identification, one of the most popular biometric technologies, has been widely used in law and business applications during the last decade. The technology is rapidly expanding in a number of new application areas, including identification of suspects, credit card verification services, and daily attendance management for employees [
1]. The feasibility of these applications mainly based on distinctive and measurable characteristics of biometrics research. According to previous researches, extremely low possibilities were found for different individuals possessing exactly the same fingerprints [
2]. Besides, fingerprints retain stable and classifiable characteristics with respect to increasing age. Under such assumptions, fingerprints could offer an infallible means for individual person identification. Examples of large-scale fingerprint systems could be found in the U.S. government including the US-VISIT’s IDENT program [
3] and the FBI’s IAFIS services [
4]. Recently, applications of fingerprint identification have been also combined with cloud computing technology [
5].
Since traditional optical fingerprint sensors have some shortcomings such as large volume, high cost and lack or portability, alternative approaches to sweeping fingerprint sensors designed for portable devices has gradually increased. Successful products are found in mobile phones, tablet PCs and laptop computers due to the merits of smaller size and low cost, and these built-in sweeping sensors are widely used as the basis for personnel identification in various commercial applications. For a sweeping fingerprint sensor, a fingerprint image is reconstructed from dozens of frames which contain certain limited widths [
6]. However, when a user sweeps his fingers along the sensor at a nonlinear speed, the captured image might be truncated and degraded during reconstruction the process [
7], thus it becomes difficult to establish accurate reference fingerprint templates for future matching applications. This kind of situation occurs frequently, especially with novice users [
8], and the worst part is that the erroneous fingerprint images from the initial stage would be stored in the fingerprint enrolment procedures without any warning. Accordingly, the adoption of truncated fingerprint images would decrease the identification accuracy dramatically, and users might lose their confidence in related products and services. It is known that several different approaches for fingerprint matching applications have been proposed, which include correlation-, image-, minutiae- and hybrid wavelet-based methods [
9]. Among these algorithms, minutiae and ridge based approaches provide satisfactory performance during matching processes, but unfortunately, no matter which kind of approach the recognition system employs, enrolled truncated fingerprint images may severely affect the matching processes and directly lead to failure.
Truncated fingerprints caused by inappropriate operations during sweeping processes usually share certain unique characteristics. These noisy features within truncated fingerprints reveal less visibility than distorted images caused by other factors, such as scars and permanent marks on fingers. It can also be observed that the insignificant features of truncated fingerprints may easily disappear after performing image reconstruction and enhancement procedures. Nevertheless, existing detection algorithms [
10,
11] for fingerprint image analysis always focused on checking the adequate feature number of minutiae/ridges [
12,
13] or image qualities [
14,
15,
16], and most of algorithms spend a lot of time on determining the validity of a fingerprint [
17,
18,
19]. For example, one of the most reliable fingerprint quality inspection systems is the Fingerprint Image Quality (NFIQ) [
20] which was developed and maintained by National Institute of Standard and Technology (NIST) in United States. Although NFIQ 2.0 was developed by NIST in 2012, the currently available version is still NFIQ 1.0 and it was applied in this study. To understand the relationship between quality aspects defined by NFIQ and performance of fingerprint recognition, we have collected 43 truncated degraded fingerprint images for system evaluation.
Table 1 lists the results of our quality assessment of these truncated fingerprints classified by the NFIQ system. Only one of them was defined within the fifth class, a class of the poorest quality level, and most of the collected degraded fingerprints were classified either in the second or the third classes. According to previous experimental reports, a correct identification rate of AFIS developed by Neurotechnologija Ltd. (Vilnius, Lithuania) was higher than 97.8% for fingerprint images possessing qualities at least classified as the third level, and the detailed recognition rates are shown in
Table 2 [
21,
22]. However, based on the evaluation of 165 experimental tests on our collected truncated fingerprints, if these truncated fingerprint images were enrolled in the AFIS, the successful recognition rate would be decreased to 49% despite the fact most of the fingerprint images were defined with qualities better than the third level. It shows that truncated fingerprint images might be defined as high quality patterns, but these degraded images are extremely harmful if used in practical applications. To solve this problem, we propose a low time complexity and high accuracy identification algorithm for detecting inappropriately scanned fingerprint images, especially for truncated patterns caused by nonlinear finger sweeping speed of users. These types of truncated fingerprints possess clear and specific characteristics such as missing a segment in the middle part of a fingerprint and discontinuous features interspersedly appearing between two truncated subimages. All these features will be discussed, classified, and systematically identified in this paper. Among them, two features were applied for fingerprint quality measurement, including orientation field and ridge thickness [
14]. Other features are novel characteristics that are newly proposed in this study.
Table 1.
Distribution of collected 43 truncated fingerprints according to NFIQ measurement.
Table 1.
Distribution of collected 43 truncated fingerprints according to NFIQ measurement.
| Quality Classes | Number of Truncated Fingerprints |
|---|
| 1. excellent | 0 |
| 2. very good | 22 |
| 3. good | 20 |
| 4. fair | 0 |
| 5. poor | 1 |
Table 2.
Prediction accuracies on (a) left index; (b) right index at various NFIQ levels. (False alarm rate: fingerprints were matched incorrectly; True alarm rate: fingerprints were matched successfully. Data from NIST [
22]).
Table 2.
Prediction accuracies on (a) left index; (b) right index at various NFIQ levels. (False alarm rate: fingerprints were matched incorrectly; True alarm rate: fingerprints were matched successfully. Data from NIST [22]).
| (a) Prediction Rates for Left Index |
|---|
| Quality | 1 (Excellent) | 2 (Very good) | 3 (Good) | 4 (Fair) | 5 (Poor) |
|---|
| False alarm rate | 0.0136 | 0.0114 | 0.0106 | 0.0076 | 0.0147 |
| True alarm rate | 0.995 | 0.994 | 0.978 | 0.874 | 0.651 |
| (b) Prediction Rates for Right Index |
| Quality | 1 (Excellent) | 2 (Very good) | 3 (Good) | 4 (Fair) | 5 (Poor) |
| False alarm rate | 0.0199 | 0.0175 | 0.0176 | 0.0143 | 0.0210 |
| True alarm rate | 0.994 | 0.990 | 0.986 | 0.924 | 0.778 |
To identify true truncated fingerprints and reject misrecognized cases caused by pseudo-truncated fingerprints prior to the AFIS enrollment processes, an automatic and comprehensive detection system for identifying truncated fingerprints is developed in this study. The proposed system analyzes truncated characteristics on each line image and computes its corresponding scores for selected features. If the feature scores satisfy the default threshold settings, the corresponding features would be further sent to an additional classifier based on the supported vector machine (SVM) technique, a widely used machine learning tool, for reconfirmation. As a result, users would be required to perform the fingerprint scanning processes again if the final validation from the proposed SVM classifier confirms the query fingerprint as a true truncated pattern. Machine learning is a subfield of applied statistics, which trains on a collected sample dataset and generalizes rules from previous experiences for later classification applications. The training data with unknown probability distribution is usually applied to extract some general principles and perhaps the distribution for future prediction on new testing data. Several types of machine learning algorithm can be categorized based on trained inputs or desired outcomes, such as supervised, unsupervised, semi-supervised, and reinforcement learning mechanisms. Recently, the SVM kernel method, a supervised learning model, has become one of the most popular classification algorithms for training known features and has been adopted in biomarker identification processes [
23]. To construct such a classification model, both positive and negative data classes should be provided as training examples in advance, and a trained SVM model is then constructed according to the selected features. In the feature space, all learning objects are divided by a hyperplane with a separable margin as wide as possible, and the query objects are mapped into the same feature space and assigned to one of the two defined categories based on the locations of the testing objects. In this study, we adopted an SVM classification tool (LIBSVM) developed by Lin’s lab [
24,
25] to enhance our prediction on query fingerprints. Both normal and truncated fingerprints with defined features were trained and an SVM model was constructed for classifying all new and independent testing fingerprints. The selection of classification features, evaluation on different kernel transformation techniques, and prediction results on benchmark datasets will be shown and discussed in details in the following sections.
3. Automatic Detection of Truncated Fingerprints
Though a truncated fingerprint appears with discontinuities and/or missing segments in a reconstructed image, it has high probabilities of pseudo feature creation, such as pseudo bifurcation points and pseudo ridge ending features.
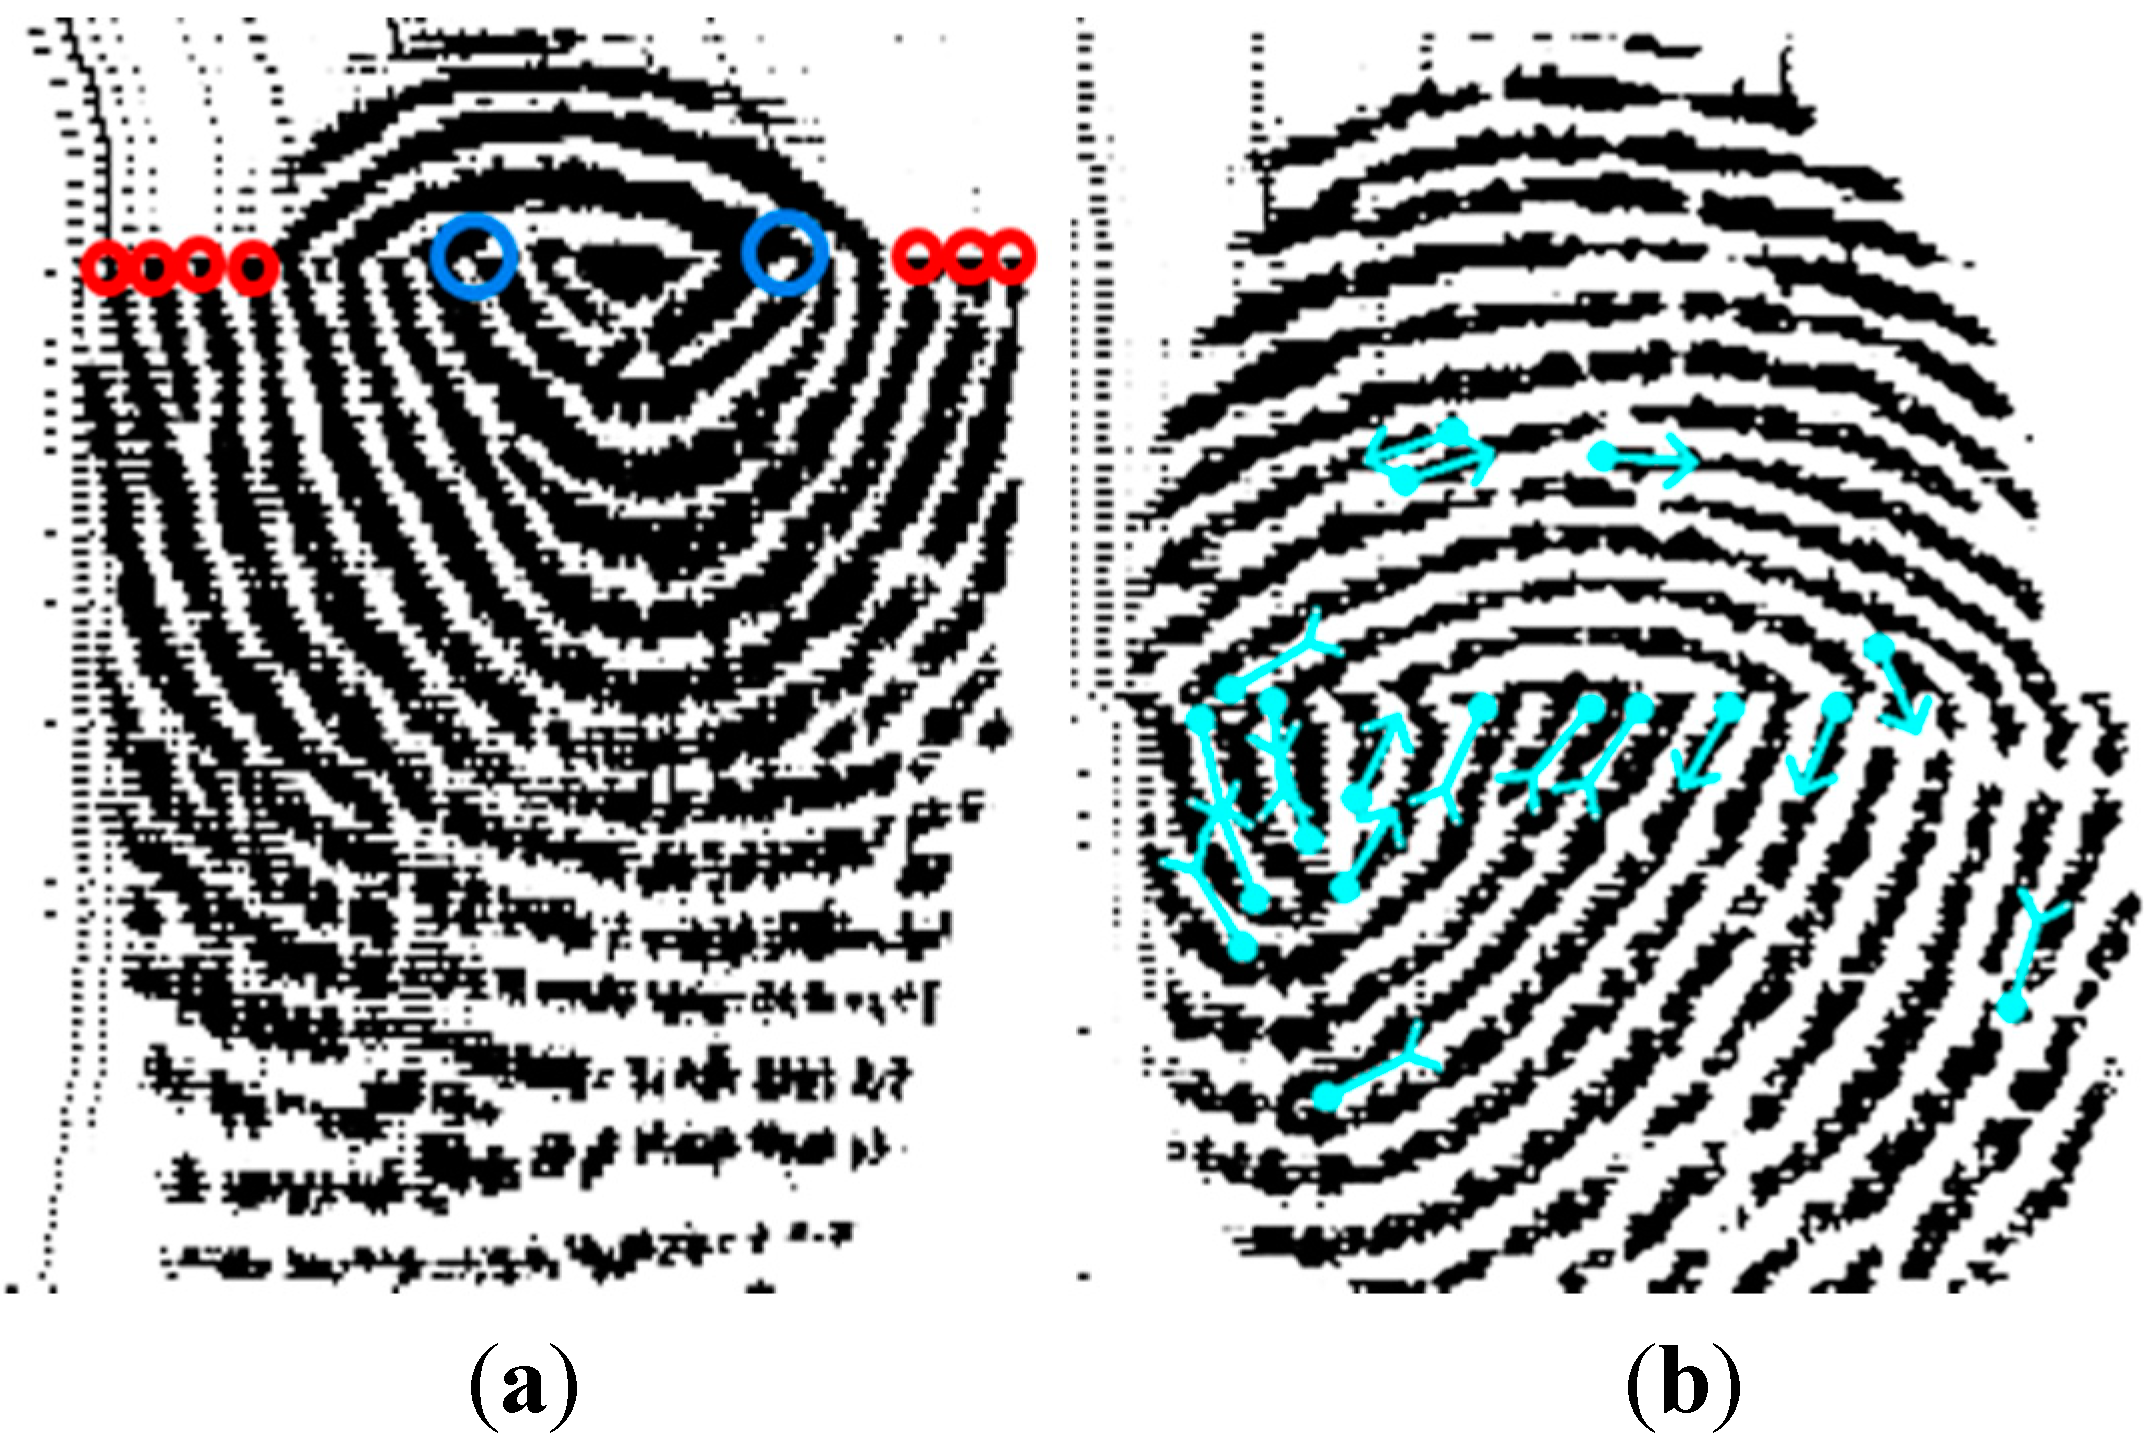
Figure 2 shows two examples of truncated fingerprints containing pseudo features which were detected as fingerprint minutiae features for identification applications. The left image in
Figure 2 is a true truncated fingerprint and its feature points are marked by two colors: blue circles represent examples of pseudo bifurcation nodes; red circles for pseudo ridge ending points. If these two type pseudo features were identified and successfully enrolled as fingerprint minutiae points by a recognition system, it would cause error detection in any subsequent application. To demonstrate how these pseudo features were created, we applied the fingerprint identification software SourceAFIS [
26] as a validation tool. It is obvious that the next line image of a missing segment appears with a large number of pseudo minutiae points and it will be enrolled by AFIS. These minutiae points found by SourceAFIS were illustrated in the right fingerprint of
Figure 2 with blue marked notations. Unfortunately, the successful recognition rates for fingerprint identification in following applications would drop considerably because of improper enrollment.
Figure 2.
(a) Truncated fingerprint contains two types of feature points including pseudo bifurcation nodes (blue circle) and pseudo ridge ending points (red circle); (b) Truncated fingerprint possesses minutiae points found by SourceAFIS.
Figure 2.
(a) Truncated fingerprint contains two types of feature points including pseudo bifurcation nodes (blue circle) and pseudo ridge ending points (red circle); (b) Truncated fingerprint possesses minutiae points found by SourceAFIS.
A truncated fingerprint with lost segments usually appears with top and bottom lines from missing segments. Thus, two consecutive lines can be distinguished directly from the scores of truncated characteristics. Hence, the proposed system evaluates the query image line-by-line and compares the proposed truncated features between two scanned neighboring line images.
5. Evaluation on Pseudo Truncated Fingerprints
When the previous feature analysis responds simultaneously with high scores in a query fingerprint, a truncated fingerprint is considered to be detected. However, some normal fingerprint images might also possess similar truncated characteristics and easily be misrecognized as truncated fingerprints. These normal fingerprint images possessing truncated features are called pseudo truncated fingerprints. To prevent incorrect classification by the proposed system, an additional pseudo truncated fingerprint filter is designed in this study. Three additional checking conditions and one rejection criterion were proposed for discovering these exceptional cases. If the result confirms that the query image shows a propensity to a pseudo truncated fingerprint through the re-confirmed checking processes, the system would reject the previous verification as a truncated fingerprint. These additional checking conditions on initially assumed truncated fingerprint candidates are described in the following subsections.
5.1. Check Thickness of Fingerprint Elements at Truncated Boundaries
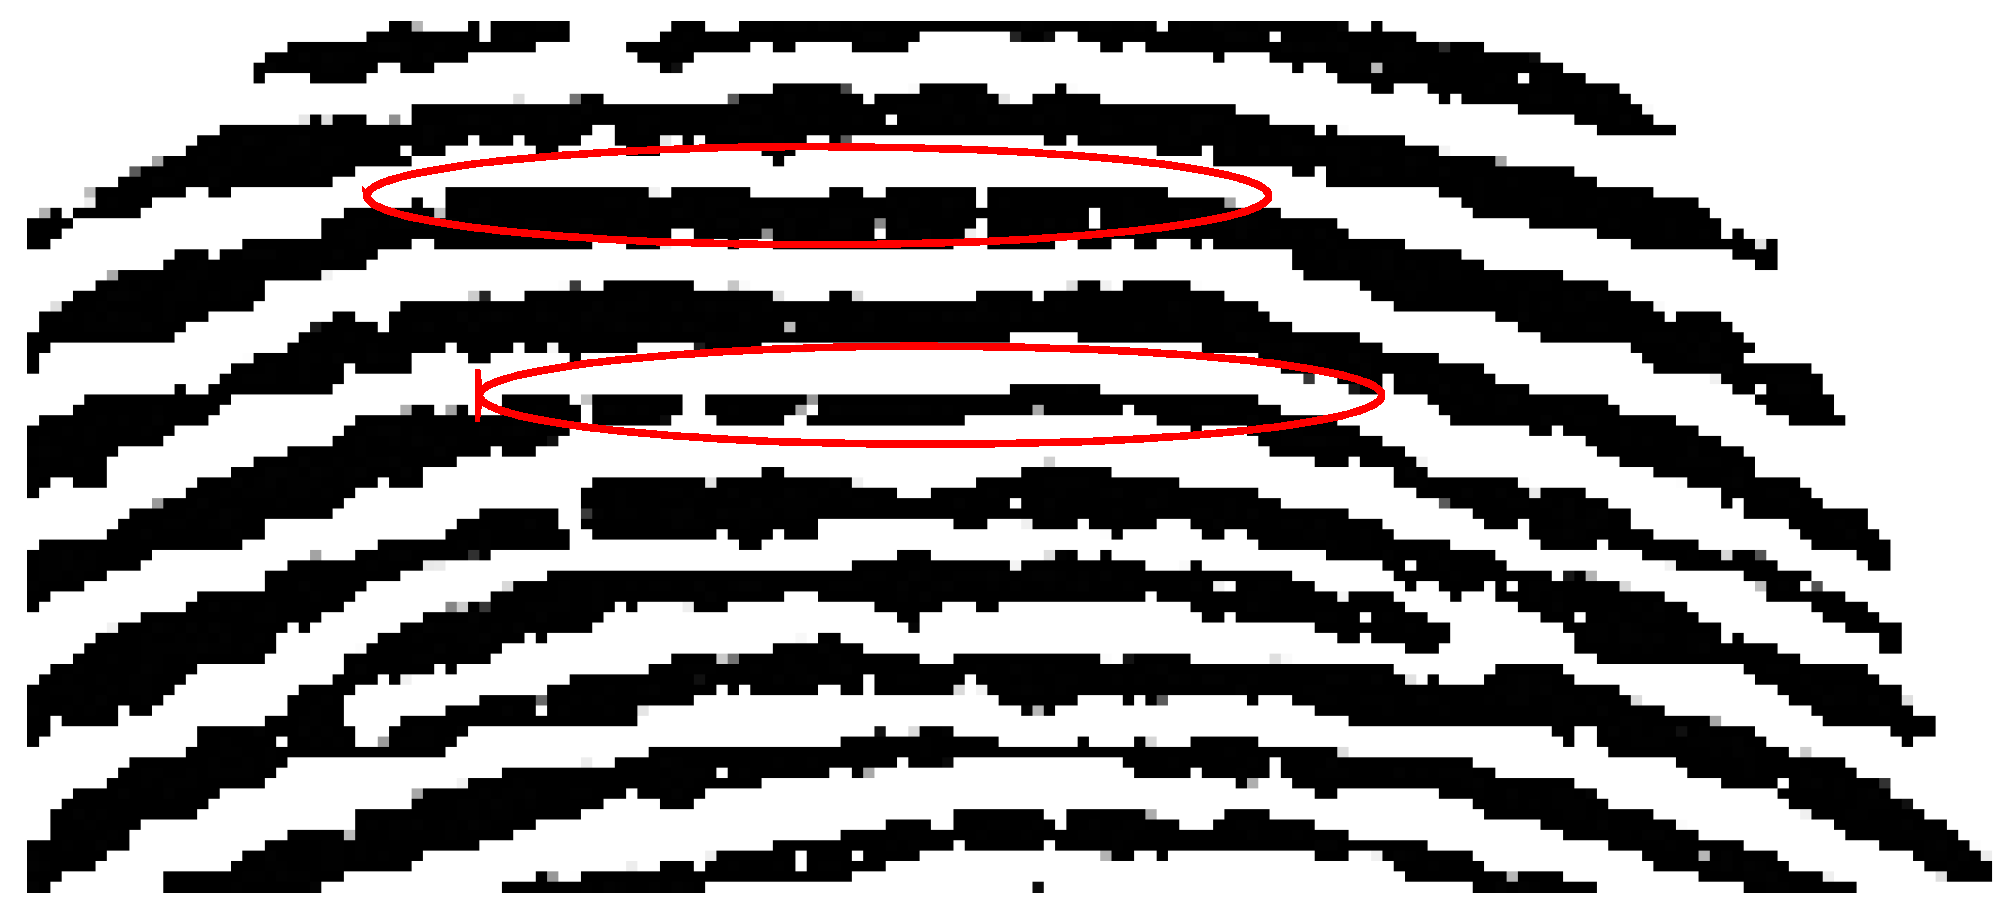
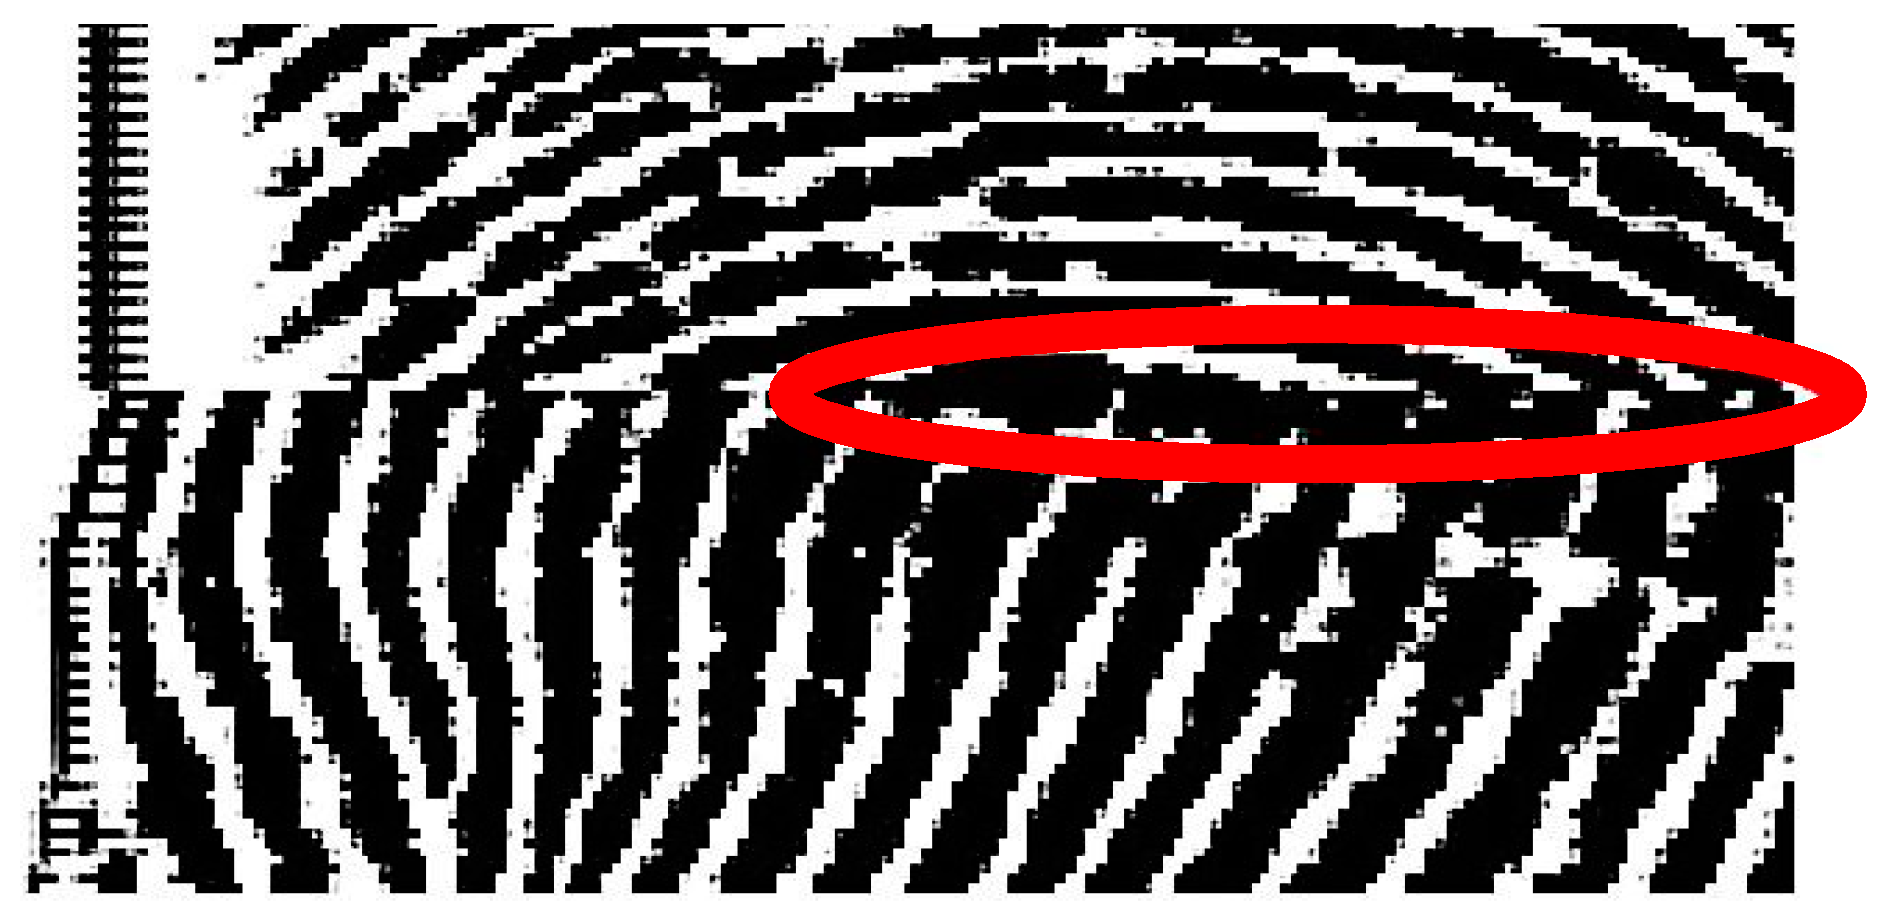
Since blank areas could appear on the top of arch patterns, relatively high scores would be obtained regarding the features of interlaced black-and-white changes and mean absolute errors. The detection system might misjudge this type of pattern as truncated regions. An example is shown in
Figure 3, and the patterns of arched lines possess similar scores as truncated boundaries. However, these misrecognized boundaries possess another feature that is distinctive from truncated lines, in that the thickness of the detected fingerprint line should be consistently maintained for a detected stroke, and this could be applied to remove misclassified cases from arch-top patterns.
Figure 3.
Arch-top patterns of a fingerprint.
Figure 3.
Arch-top patterns of a fingerprint.
5.2. Check Total Number of Continuous Black Pixels
Several cases of arch-top fingerprint lines could not be rejected mainly based on checking thickness of detected elements. This type of fingerprint patterns usually contains long and continuous black pixels with white regions above. Hence, we applied an additional continuous black pixels feature to reconfirm truncated boundary candidates even with a great amount of thickness.
5.3. Truncated Fingerprint with Smeared Patterns
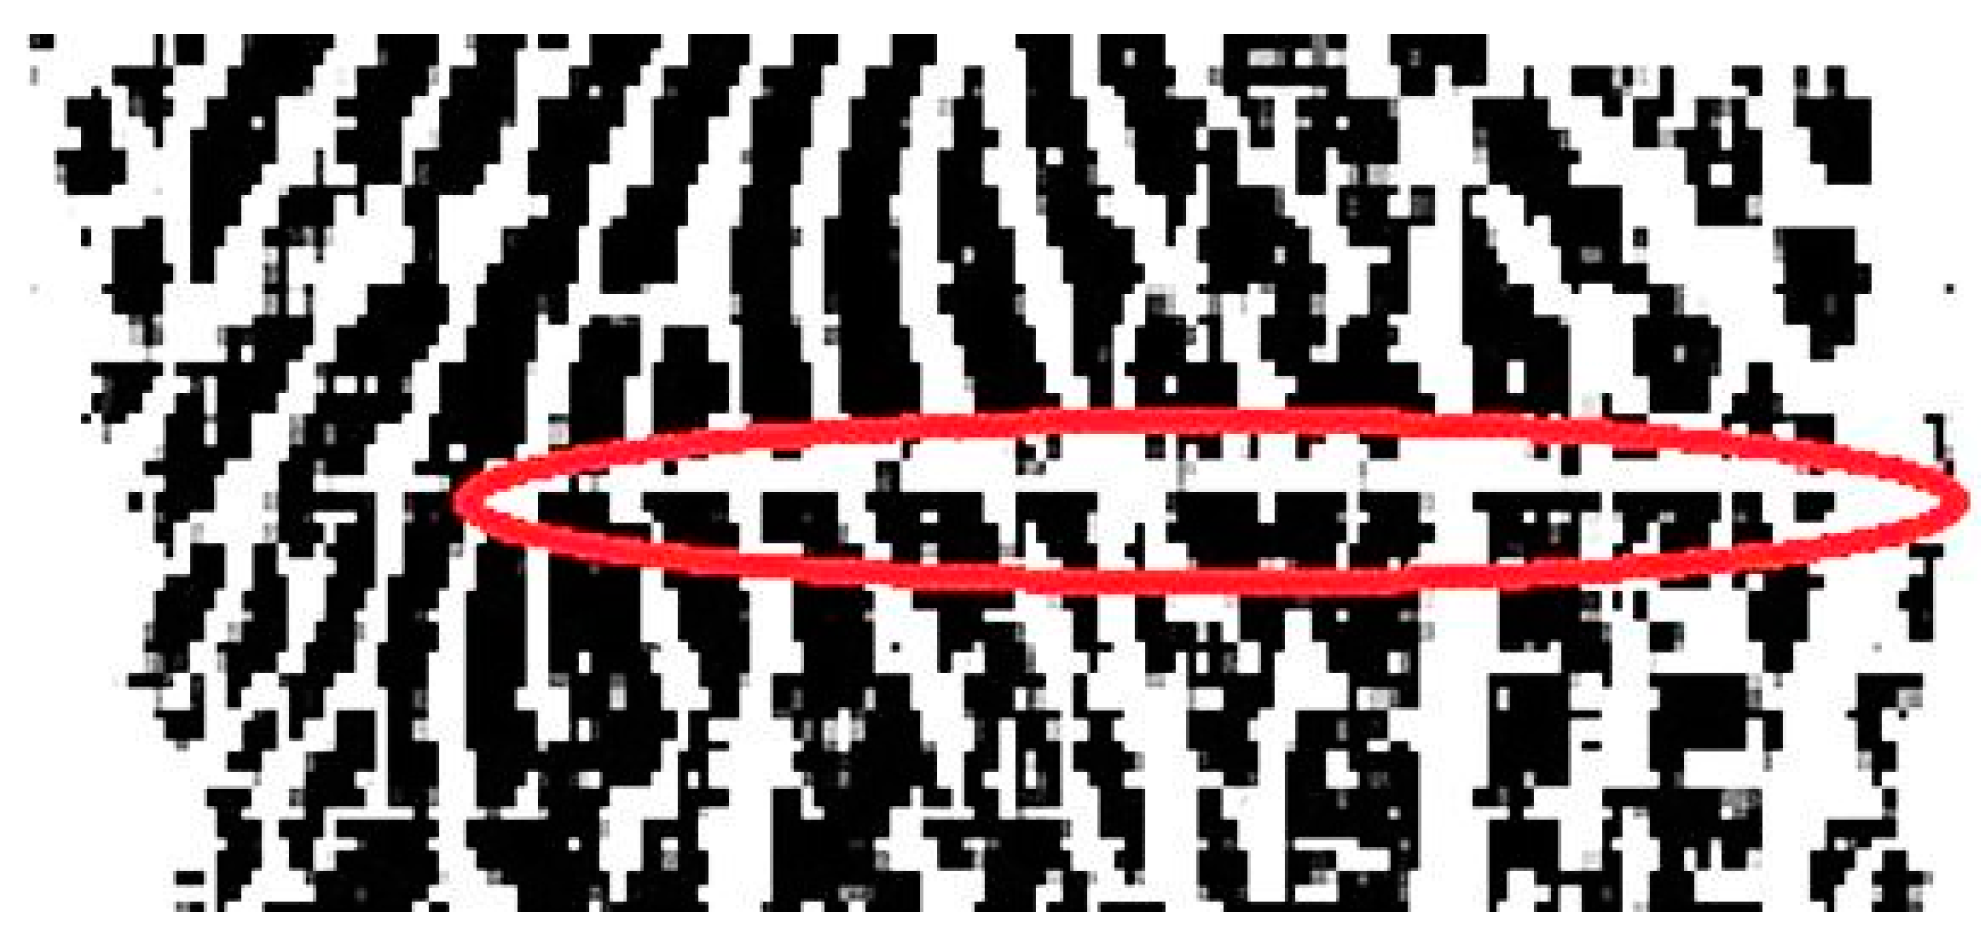
A truncated fingerprint with smeared patterns usually possesses a great number of continuous black pixels in a row, as the example shown in
Figure 4. These kinds of continuous black pixels within a truncated fingerprint might satisfy the previous checking conditions, and it would be rejected as a pseudo truncated fingerprint. Hence, the validation mechanism by inspecting on a total number of continuous black pixels does not apply for an indeed truncated fingerprint with smeared noise. In this designed system, if the total number of consecutive black pixels in a fingerprint line exceeds the default settings, the reconfirmation checking processes will be skipped.
Figure 4.
Large segment of continuing black pixels in a row due to smeared noise in a truncated fingerprint.
Figure 4.
Large segment of continuing black pixels in a row due to smeared noise in a truncated fingerprint.
5.4. Pseudo Truncated Fingerprints Caused by Scars
A fingerprint would appear with truncated characteristics when the finger’s surface was scratched and had scars. It is quite often the case that an injured finger appears with truncations like scars on fingerprints. In general, a small scar does not affect the prediction results of the proposed detection system. However, a straight horizontal scar gives high scores when evaluating the proposed truncated features of interlaced black-and-white stripes and mean absolute errors. Patterns of horizontal scars are quite similar to truncated features, and an example of fingerprint with scars is shown in
Figure 5.
Figure 5.
A pseudo truncated fingerprint caused by horizontal scars.
Figure 5.
A pseudo truncated fingerprint caused by horizontal scars.
Intuitively, a scar is relatively easy to be misrecognized as a truncated fingerprint. Nevertheless, by observing carefully, a true scar possesses a feature of alternating pairwise black and white pixels on both sides of the scar, and this important feature could be easily detected by our proposed additional detection module. Hence, pseudo truncated fingerprints could be eliminated from the candidate list and miscalculation rates caused by scar-like patterns can be successfully reduced.
6. Experimental Results
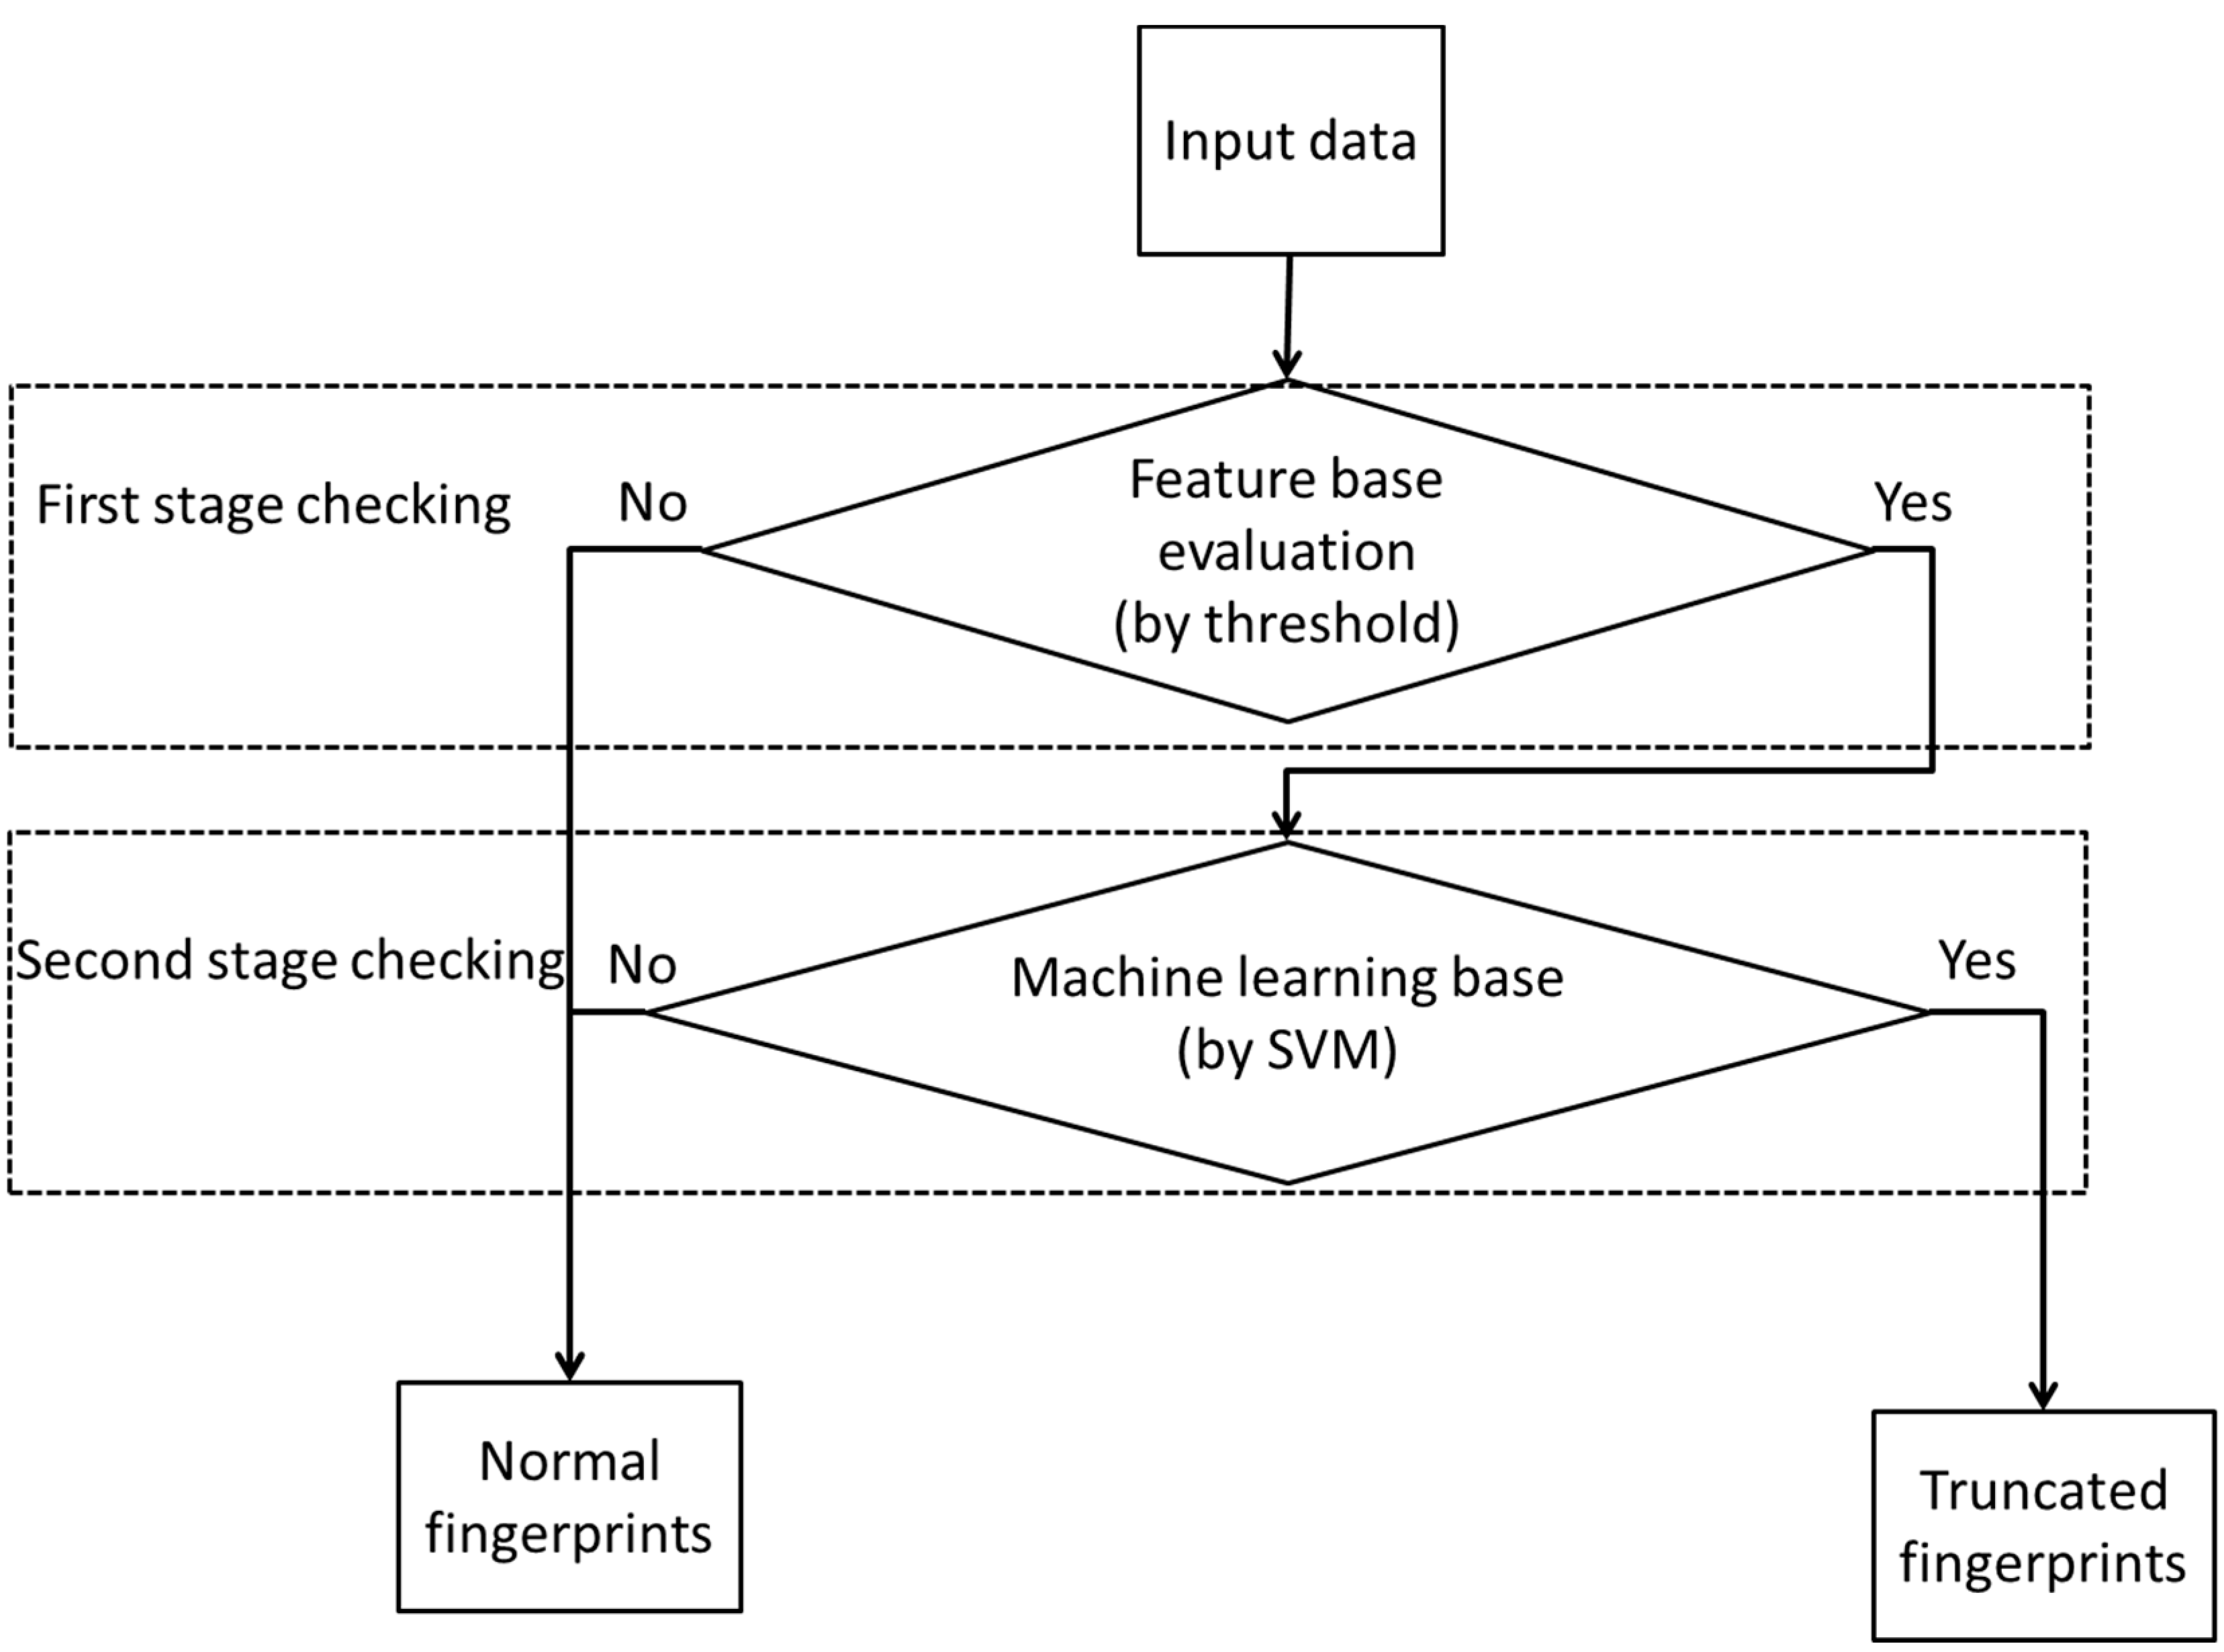
In the proposed detection system, there are five sequential validation procedures designed to verify possible truncated fingerprints automatically at the first stage. These modules include: (a) smeared pattern checking; (b) maximum interlaced black-and-white stripe and orientation field change feature checking; (c) orientation field change and ranking of interlaced black-and-white stripe; (d) ranking of oriented field change and interlaced black-and-white stripe feature checking, and (e) comprehensive checking. The default parameters used in this study were obtained by taking the middle values between average values of truncated cases and normal cases. Only the learning dataset was applied for training the default parameter. The order of combinatorial checking procedures is considered based on the time cost of each checking algorithm. Here, we arranged the checking procedures requiring longer time at the later stages. Once the scanned line images in a query fingerprint failed to pass any one of the five validation criteria, the system initiates the next validation stage for the reconfirmation processes. Finally, the system extracts the information of a candidate truncated fingerprint including black-and-white stripe, orientation field change, mean absolute error, thickness of fingerprint element and total number of continuous black pixels as features and passes to LIBSVM for the second stage classification. At the second stage, the system employs the radial basis function kernel type one-class SVM library provided by Lin
et al. [
24]. Once a query fingerprint is firmly identified with truncated features in both the first and the second stages, the proposed system will reject the query fingerprint in the following enrolling registration procedures. On the other hand, if the query fingerprint image could pass all the proposed validation rules at the first stage or be identified as a pseudo truncated fingerprint at the second stage, the system returns a successful scanning message and the fingerprint image would be enrolled in the devices for further recognition applications.
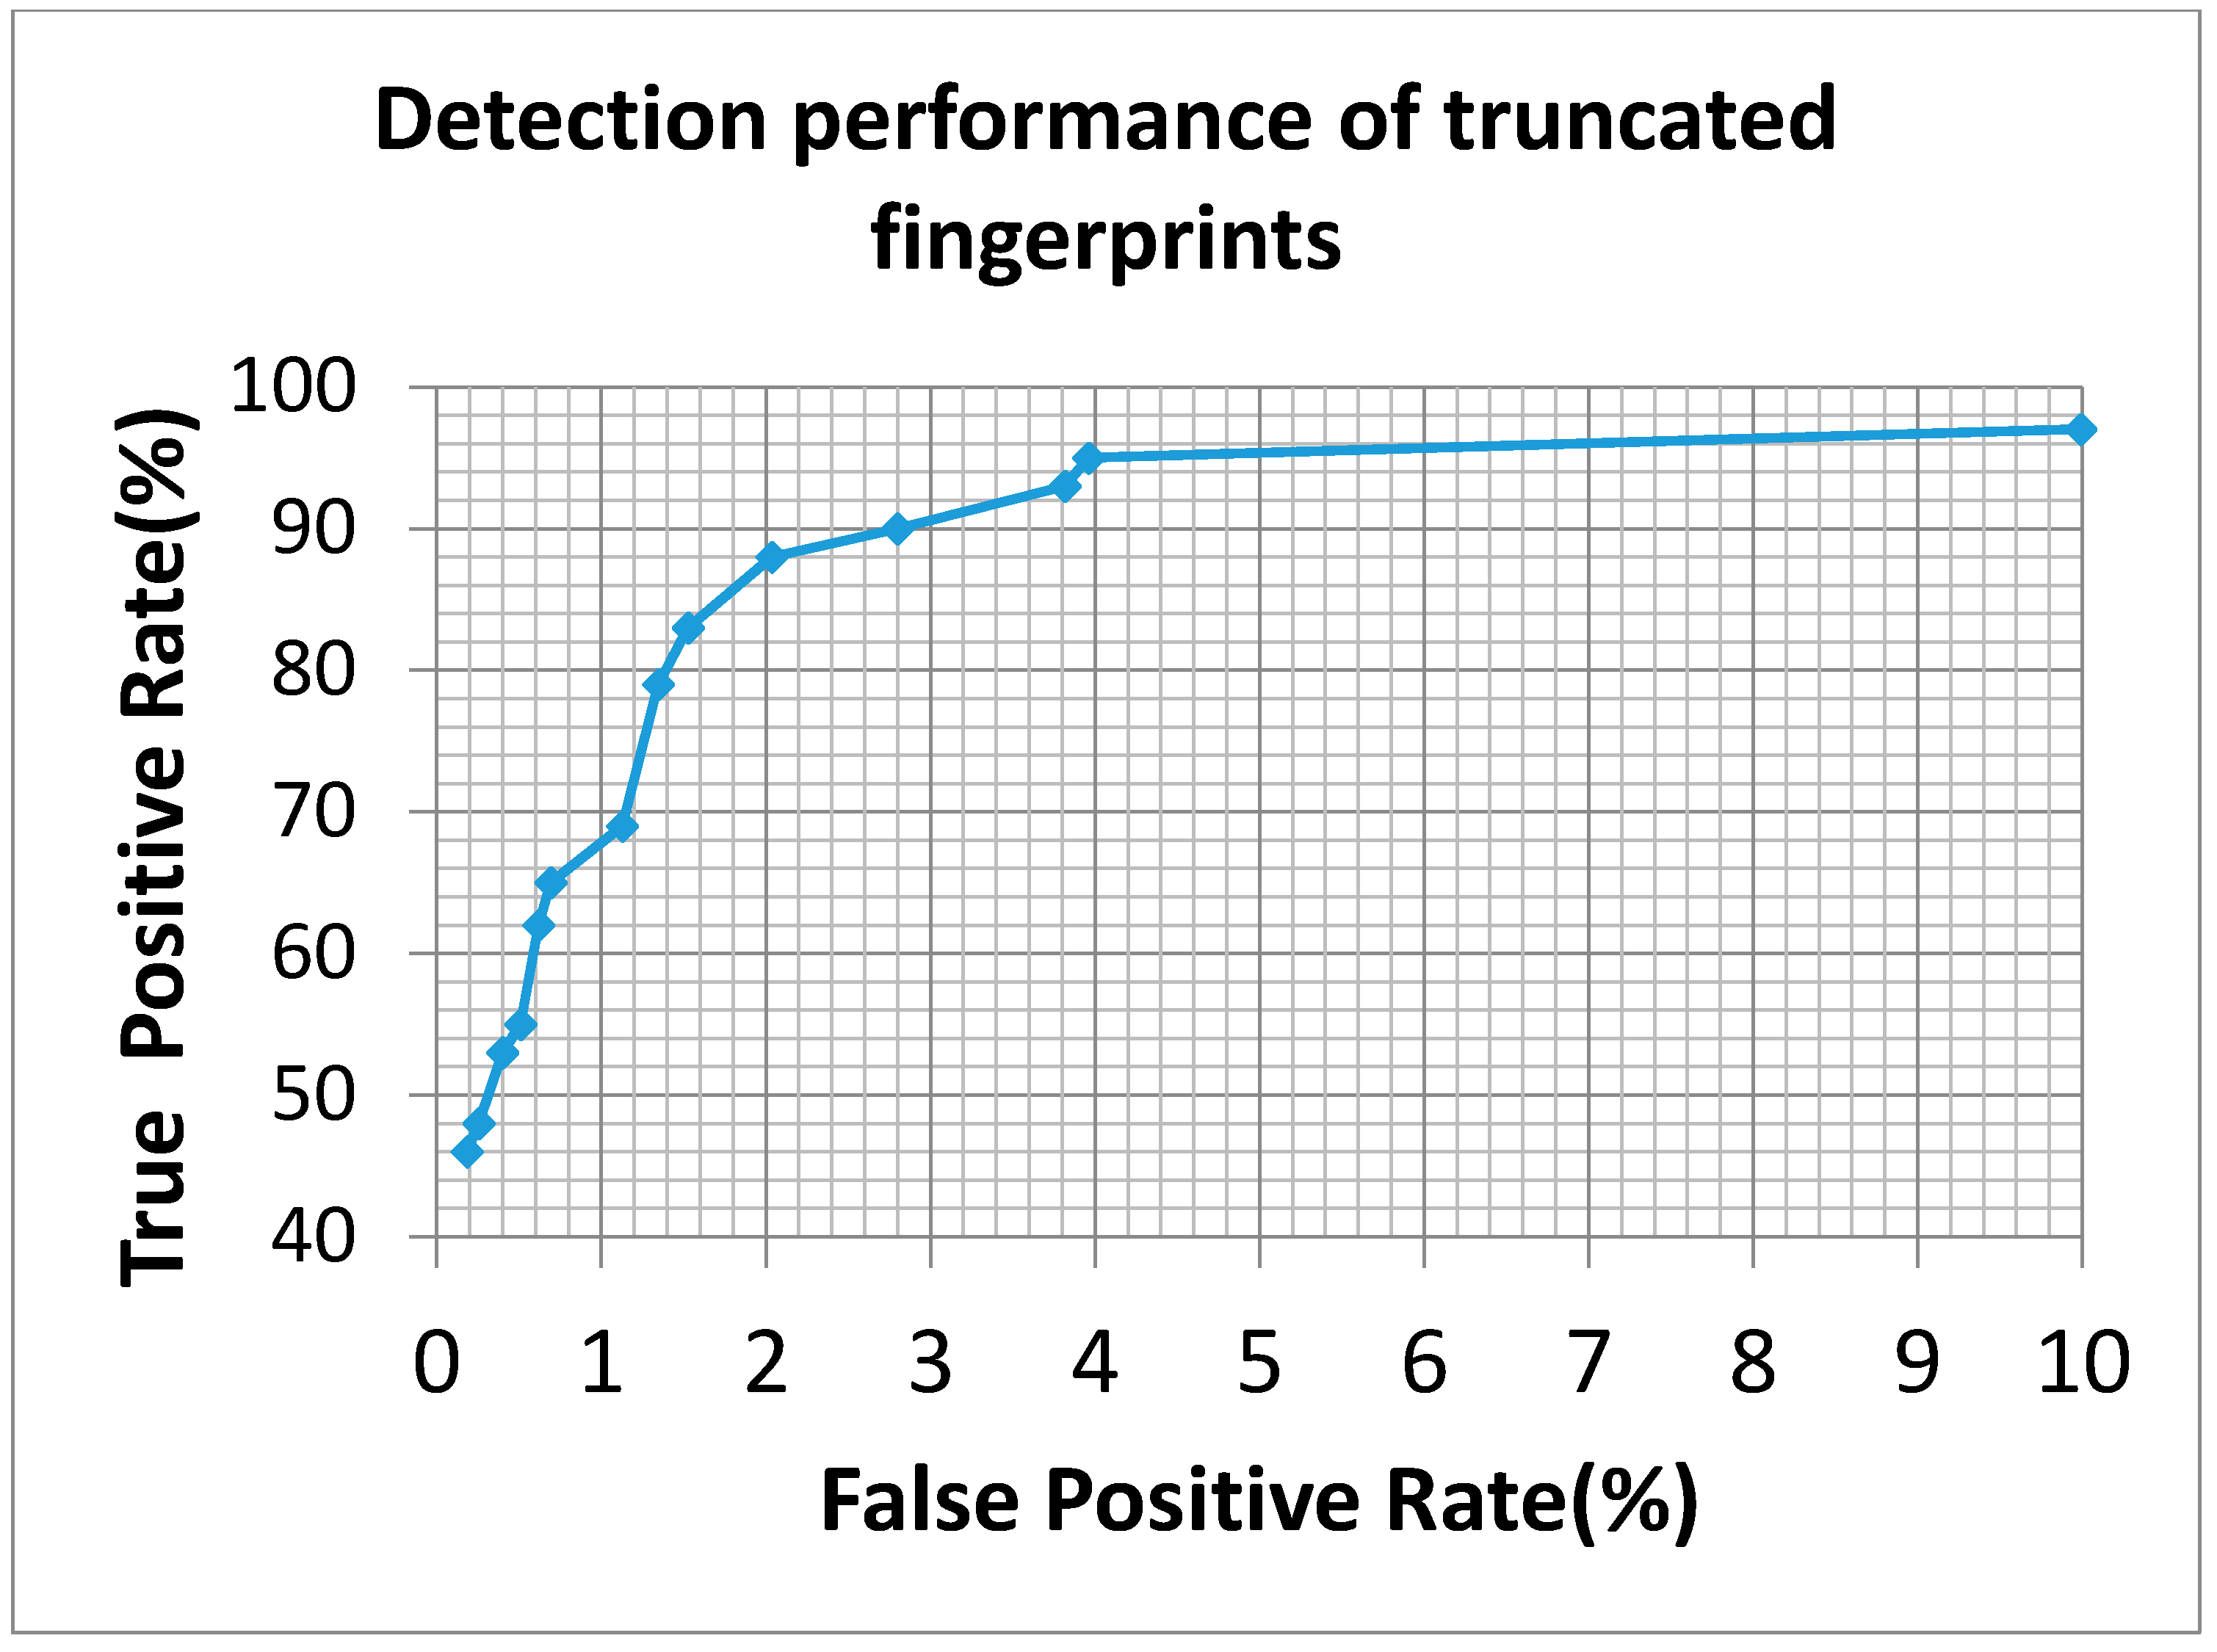
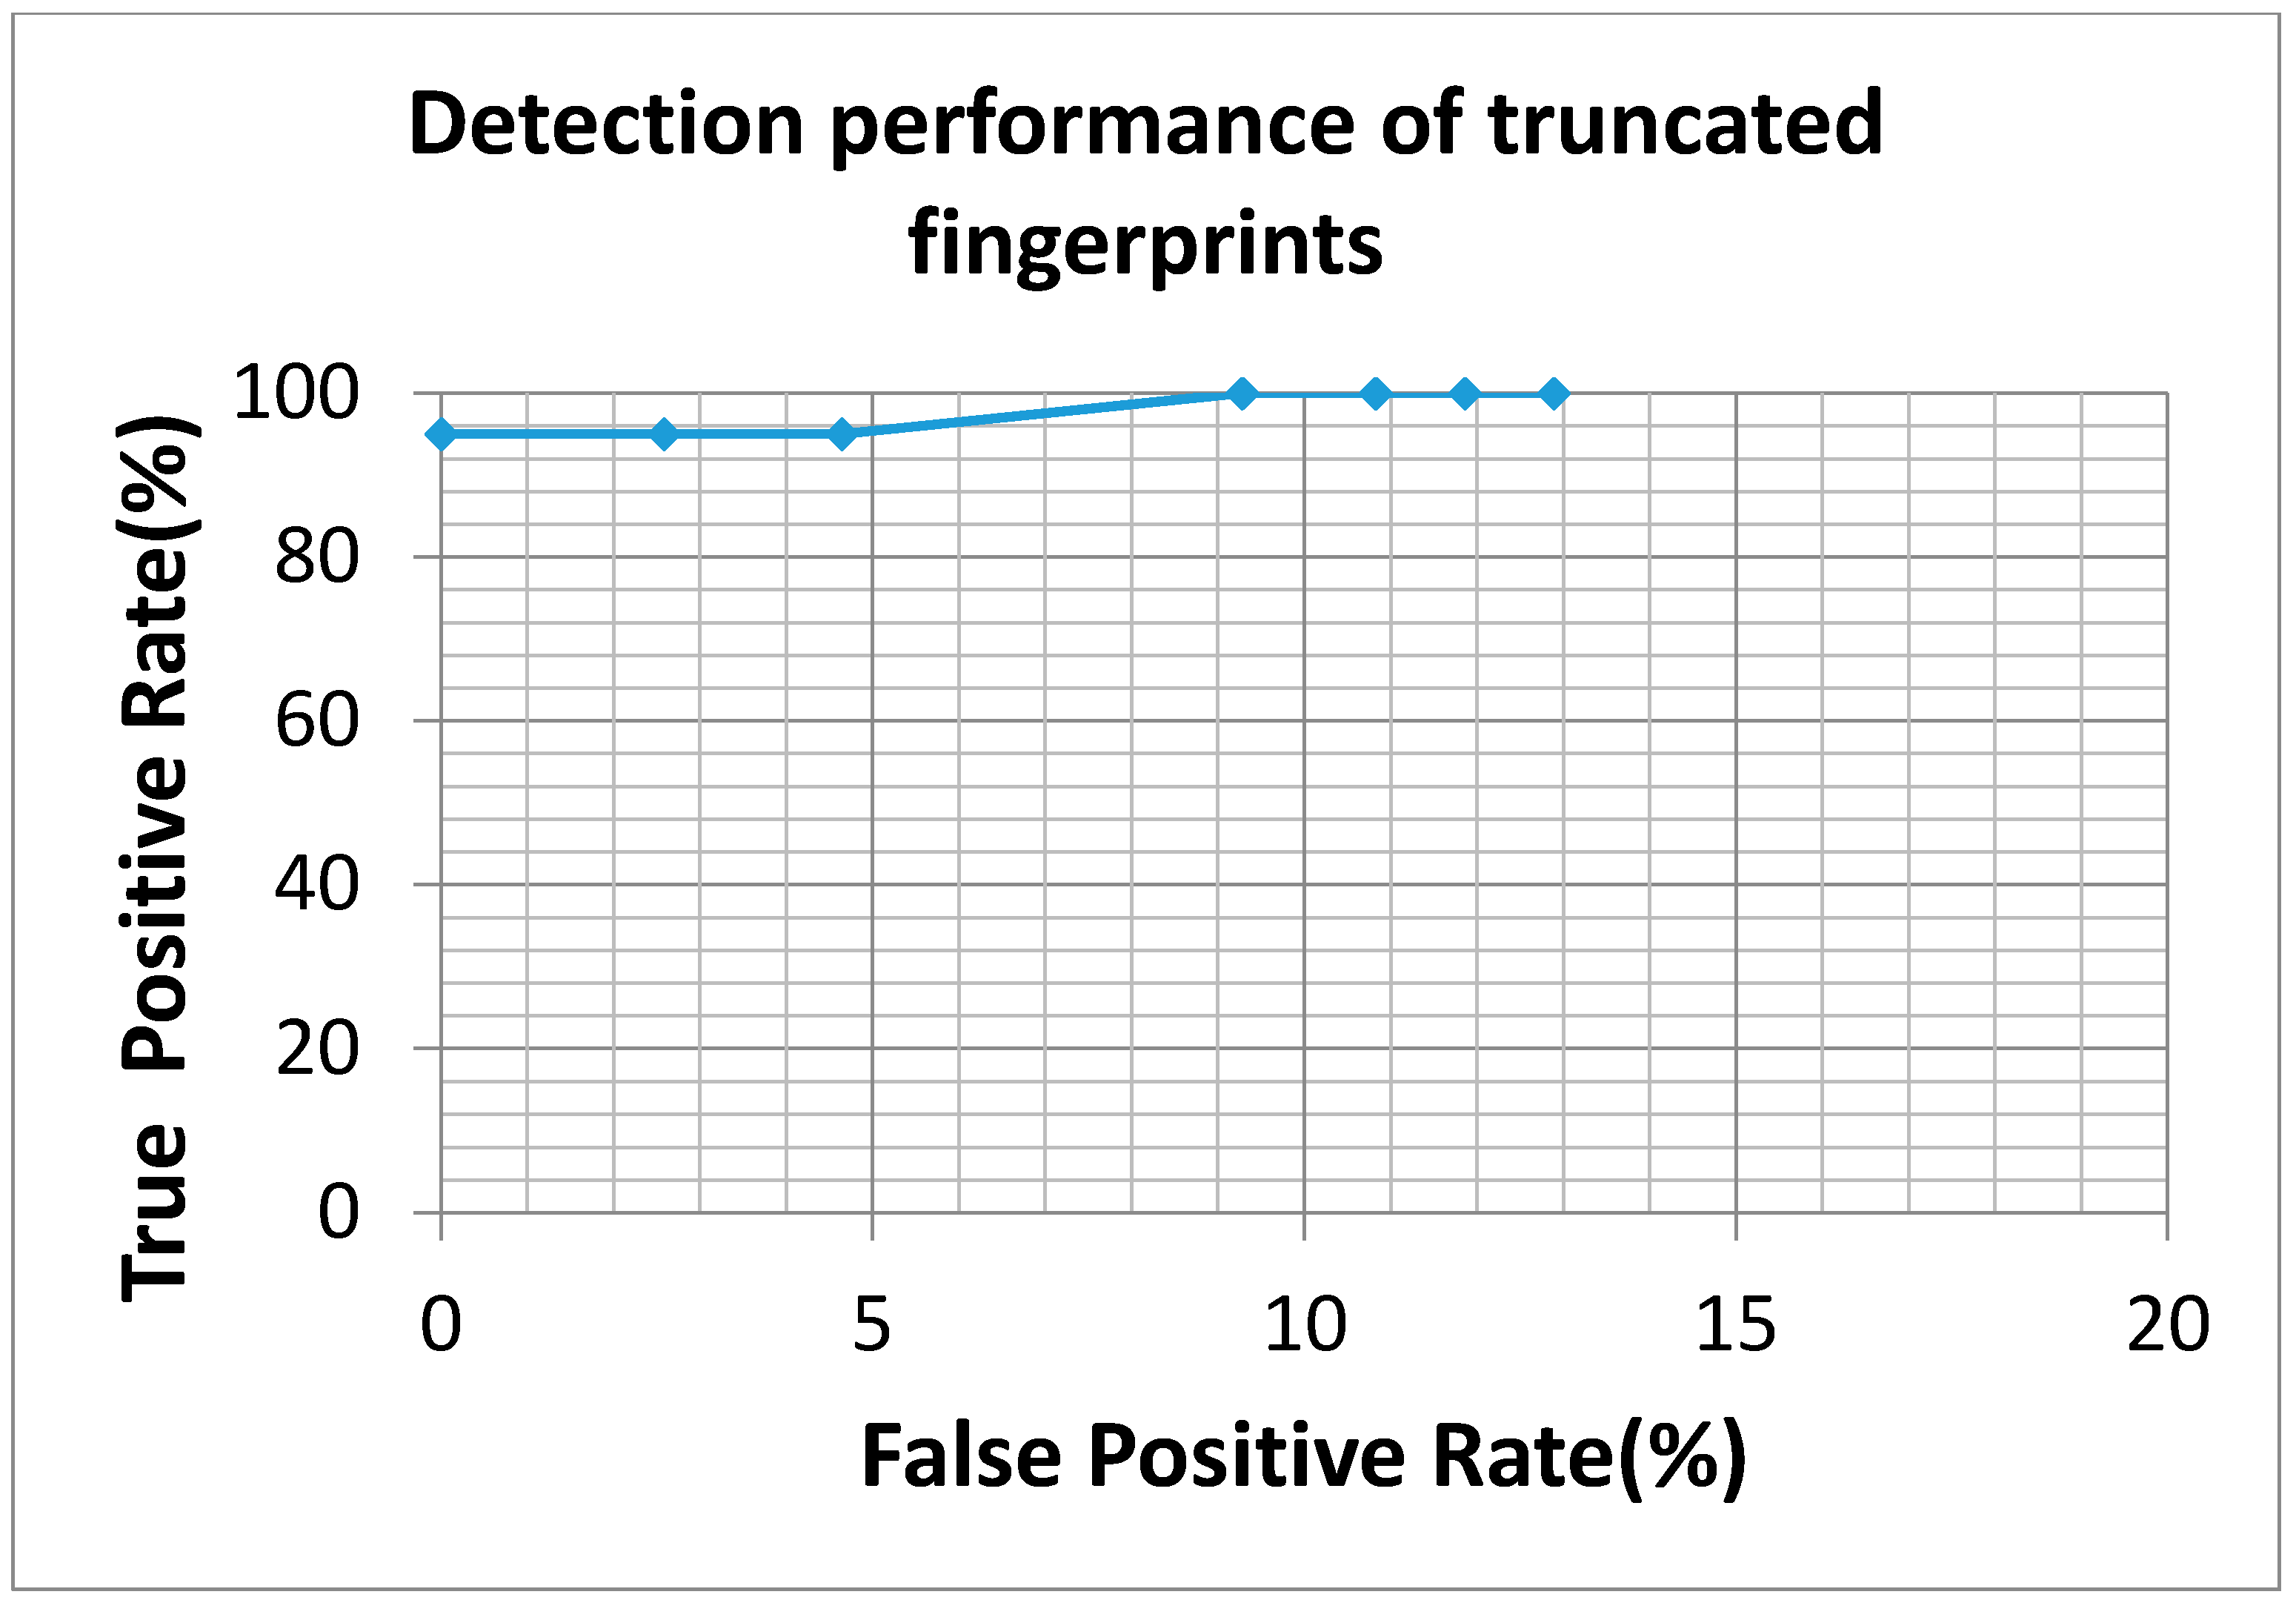
This study applied 2753 normal fingerprints in cooperation with 43 truncated fingerprints as a learning dataset for SVM training processes, and another independent dataset collected by Egis Technology Inc. containing 20 truncated fingerprints and 174 normal fingerprints were applied as testing dataset for system evaluation. The SVM training parameters in this study included the cost parameter of 32 and gamma parameter of 0.0064125, respectively. Only the learning dataset was applied for setting these parameters. Each experimental trial required 8.4 milliseconds on average to determine whether the query image is a truncated fingerprint or not, and it showed the advantages of low time complexity in this detection system. Meanwhile, the proposed system achieved an accuracy rate of 99.4% when none of the pseudo truncated fingerprint was classified as truncated fingerprints. Precisely speaking, for all testing fingerprint images, a precision rate of 100%, a recall rate of 95% and a Matthews correlation coefficient of 0.971 were obtained from the proposed system. In addition, as a mean to detect all truncated fingerprints, we have tried to modify threshold settings of black-and-white stripes and oriented field changes. In that case, an accuracy rate of 90.7% could be achieved, and which contained 52.6% precision rate, 100% recall rate, and 0.686 Matthews correlation coefficient. To comprehensively analyze the proposed system, a ROC curve obtained from various experimental settings is shown in
Figure 6, and the detecting results compared to NFIQ system are shown in
Table 4. In addition, the public database Fingerprint Verification Contest (FVC) 2004 DB3_B [
27] has been also verified by our proposed system, and the prediction results are shown in
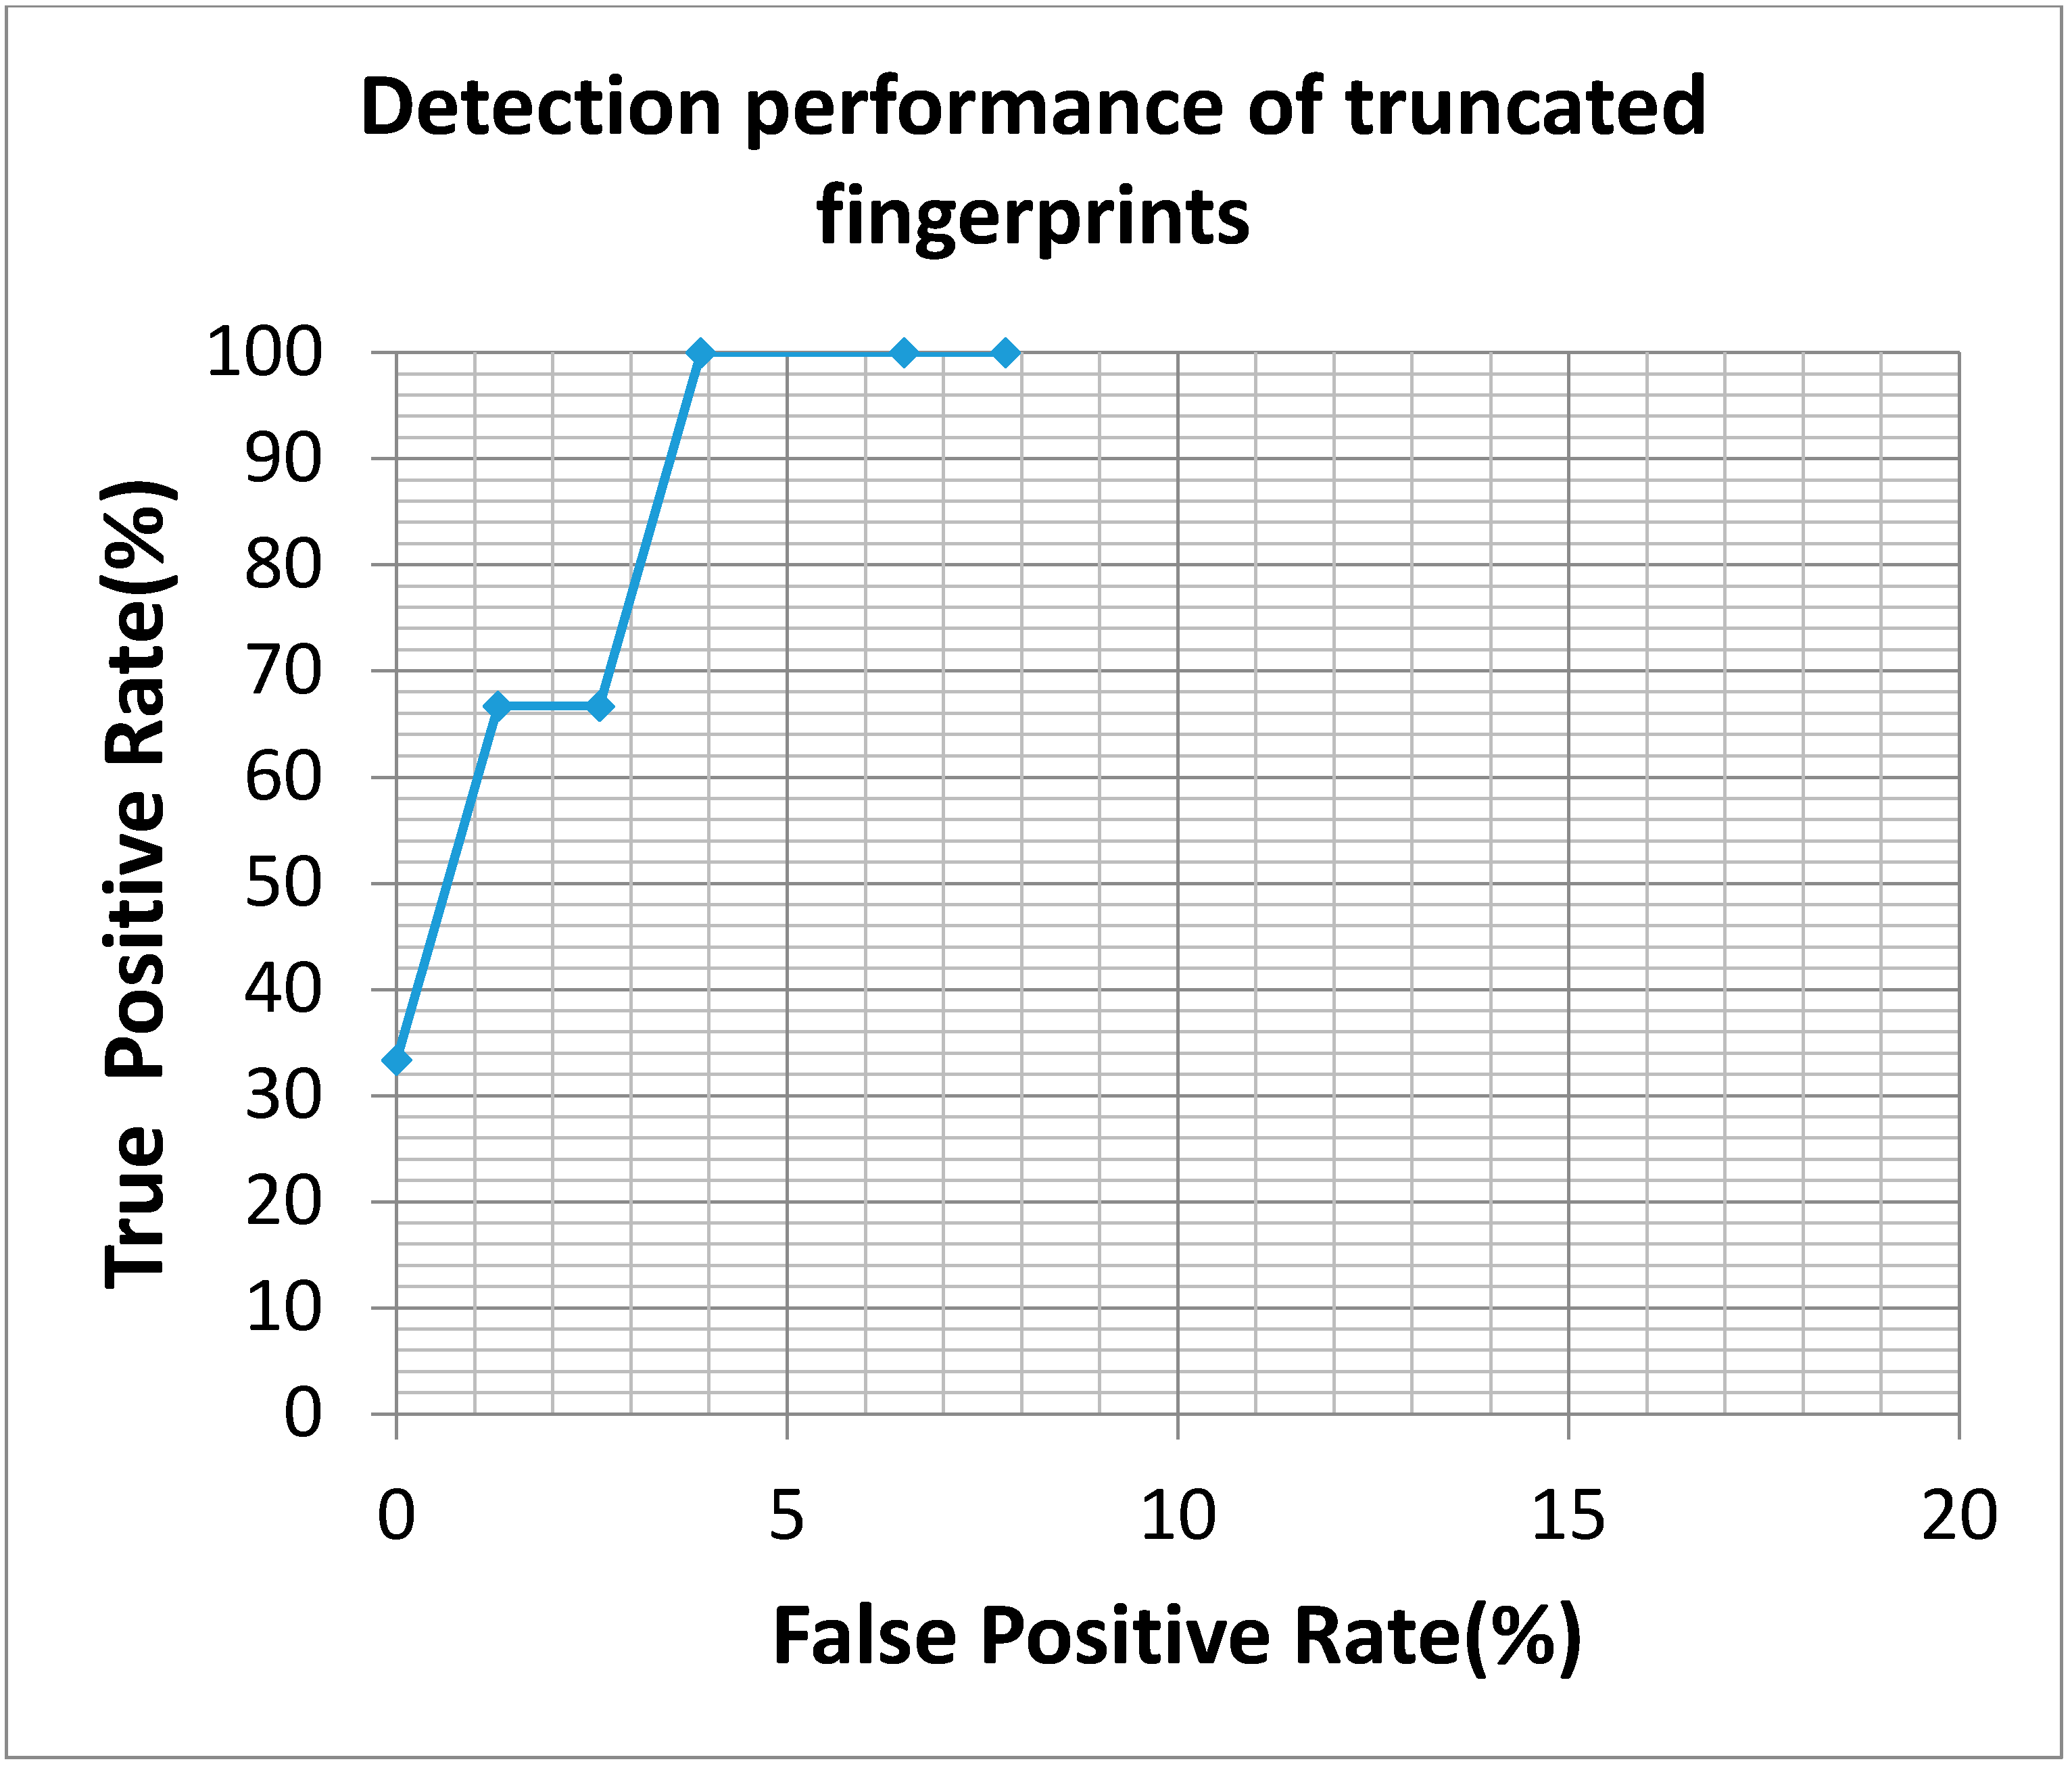
Table 5. The ROC curve obtained from various experimental settings is shown in
Figure 7. In the database, only three truncated fingerprints were manually identified and curated, and all truncated fingerprint have been successfully detected and an accuracy rate of 96.2% was achieved.
Figure 6.
The ROC curve of truncated fingerprint detection is obtained by tuning threshold settings of black-and-white stripe and oriented field change. From left to right, threshold settings were strictly decreased.
Figure 6.
The ROC curve of truncated fingerprint detection is obtained by tuning threshold settings of black-and-white stripe and oriented field change. From left to right, threshold settings were strictly decreased.
Figure 7.
The ROC curve of truncated fingerprint detection is obtained by tuning threshold settings of black-and-white stripe and oriented field change. From left to right, threshold settings were strictly decreased.
Figure 7.
The ROC curve of truncated fingerprint detection is obtained by tuning threshold settings of black-and-white stripe and oriented field change. From left to right, threshold settings were strictly decreased.
Table 4.
The detection results for various systems. We defined that when NFIQ determined a fingerprint belonging to the level 4 (fair) or higher, the system classified the fingerprint as a normal fingerprint. On the other hand, when NFIQ determined the fingerprint at the level 5 (poor), the system classified the fingerprint as a truncated fingerprint.
| | NFIQ | Our System |
|---|
| 100% Precision Rate | 52.6% Precision Rate |
|---|
| Detected truncated fingerprint | 0 | 19 | 20 |
| Undetected truncated fingerprint | 20 | 1 | 0 |
Table 5.
The predicated results for public database FVC2004 DB3.
Table 5.
The predicated results for public database FVC2004 DB3.
| | Truncated Fingerprint | Non-Truncated Fingerprint |
|---|
| Truncated fingerprint (predicted) | 3 | 3 |
| Non-truncated fingerprint (predicted) | 0 | 74 |
We also applied the identical classification approach in the reverse way. We employed the 174 normal fingerprints and 20 truncated fingerprint as a training set and applied the 2753 normal and 43 truncated fingerprints as a testing dataset. The ROC curve obtained from various experimental settings is shown in
Figure 8. In this case, the proposed system achieved an accuracy rate of 96% when the recall rate approached to 95%.
Figure 8.
The ROC curve of truncated fingerprint detection is obtained by tuning threshold settings of black-and-white stripe and oriented field change. From left to right, threshold settings were strictly decreased.
Figure 8.
The ROC curve of truncated fingerprint detection is obtained by tuning threshold settings of black-and-white stripe and oriented field change. From left to right, threshold settings were strictly decreased.


