
Using a Novel Wireless-Networked Decentralized Control Scheme under Unpredictable Environmental Conditions


Abstract
:1. Introduction
- The high stability and robust micro-electromechanical (MEM) sensing and control devices are used to regulate and control the environmental parameters inside the greenhouse;
- Remote monitoring displays current temperature and humidity changes in the various cultivation zones in the greenhouse;
- The control range of temperature and humidity are adjusted automatically based on different plant growth stages to achieve plant growth optimization;
- Multi-zone decentralized control based on fuzzy rule-based inference for planting standardization and diversification;
- A wireless sensing network is utilized, which reduces the cost of wire mounting between sensing nodes, actuator nodes, and control nodes and provides high mobility, cultivation data collection and processing, and good control flexibility.
2. Methodology
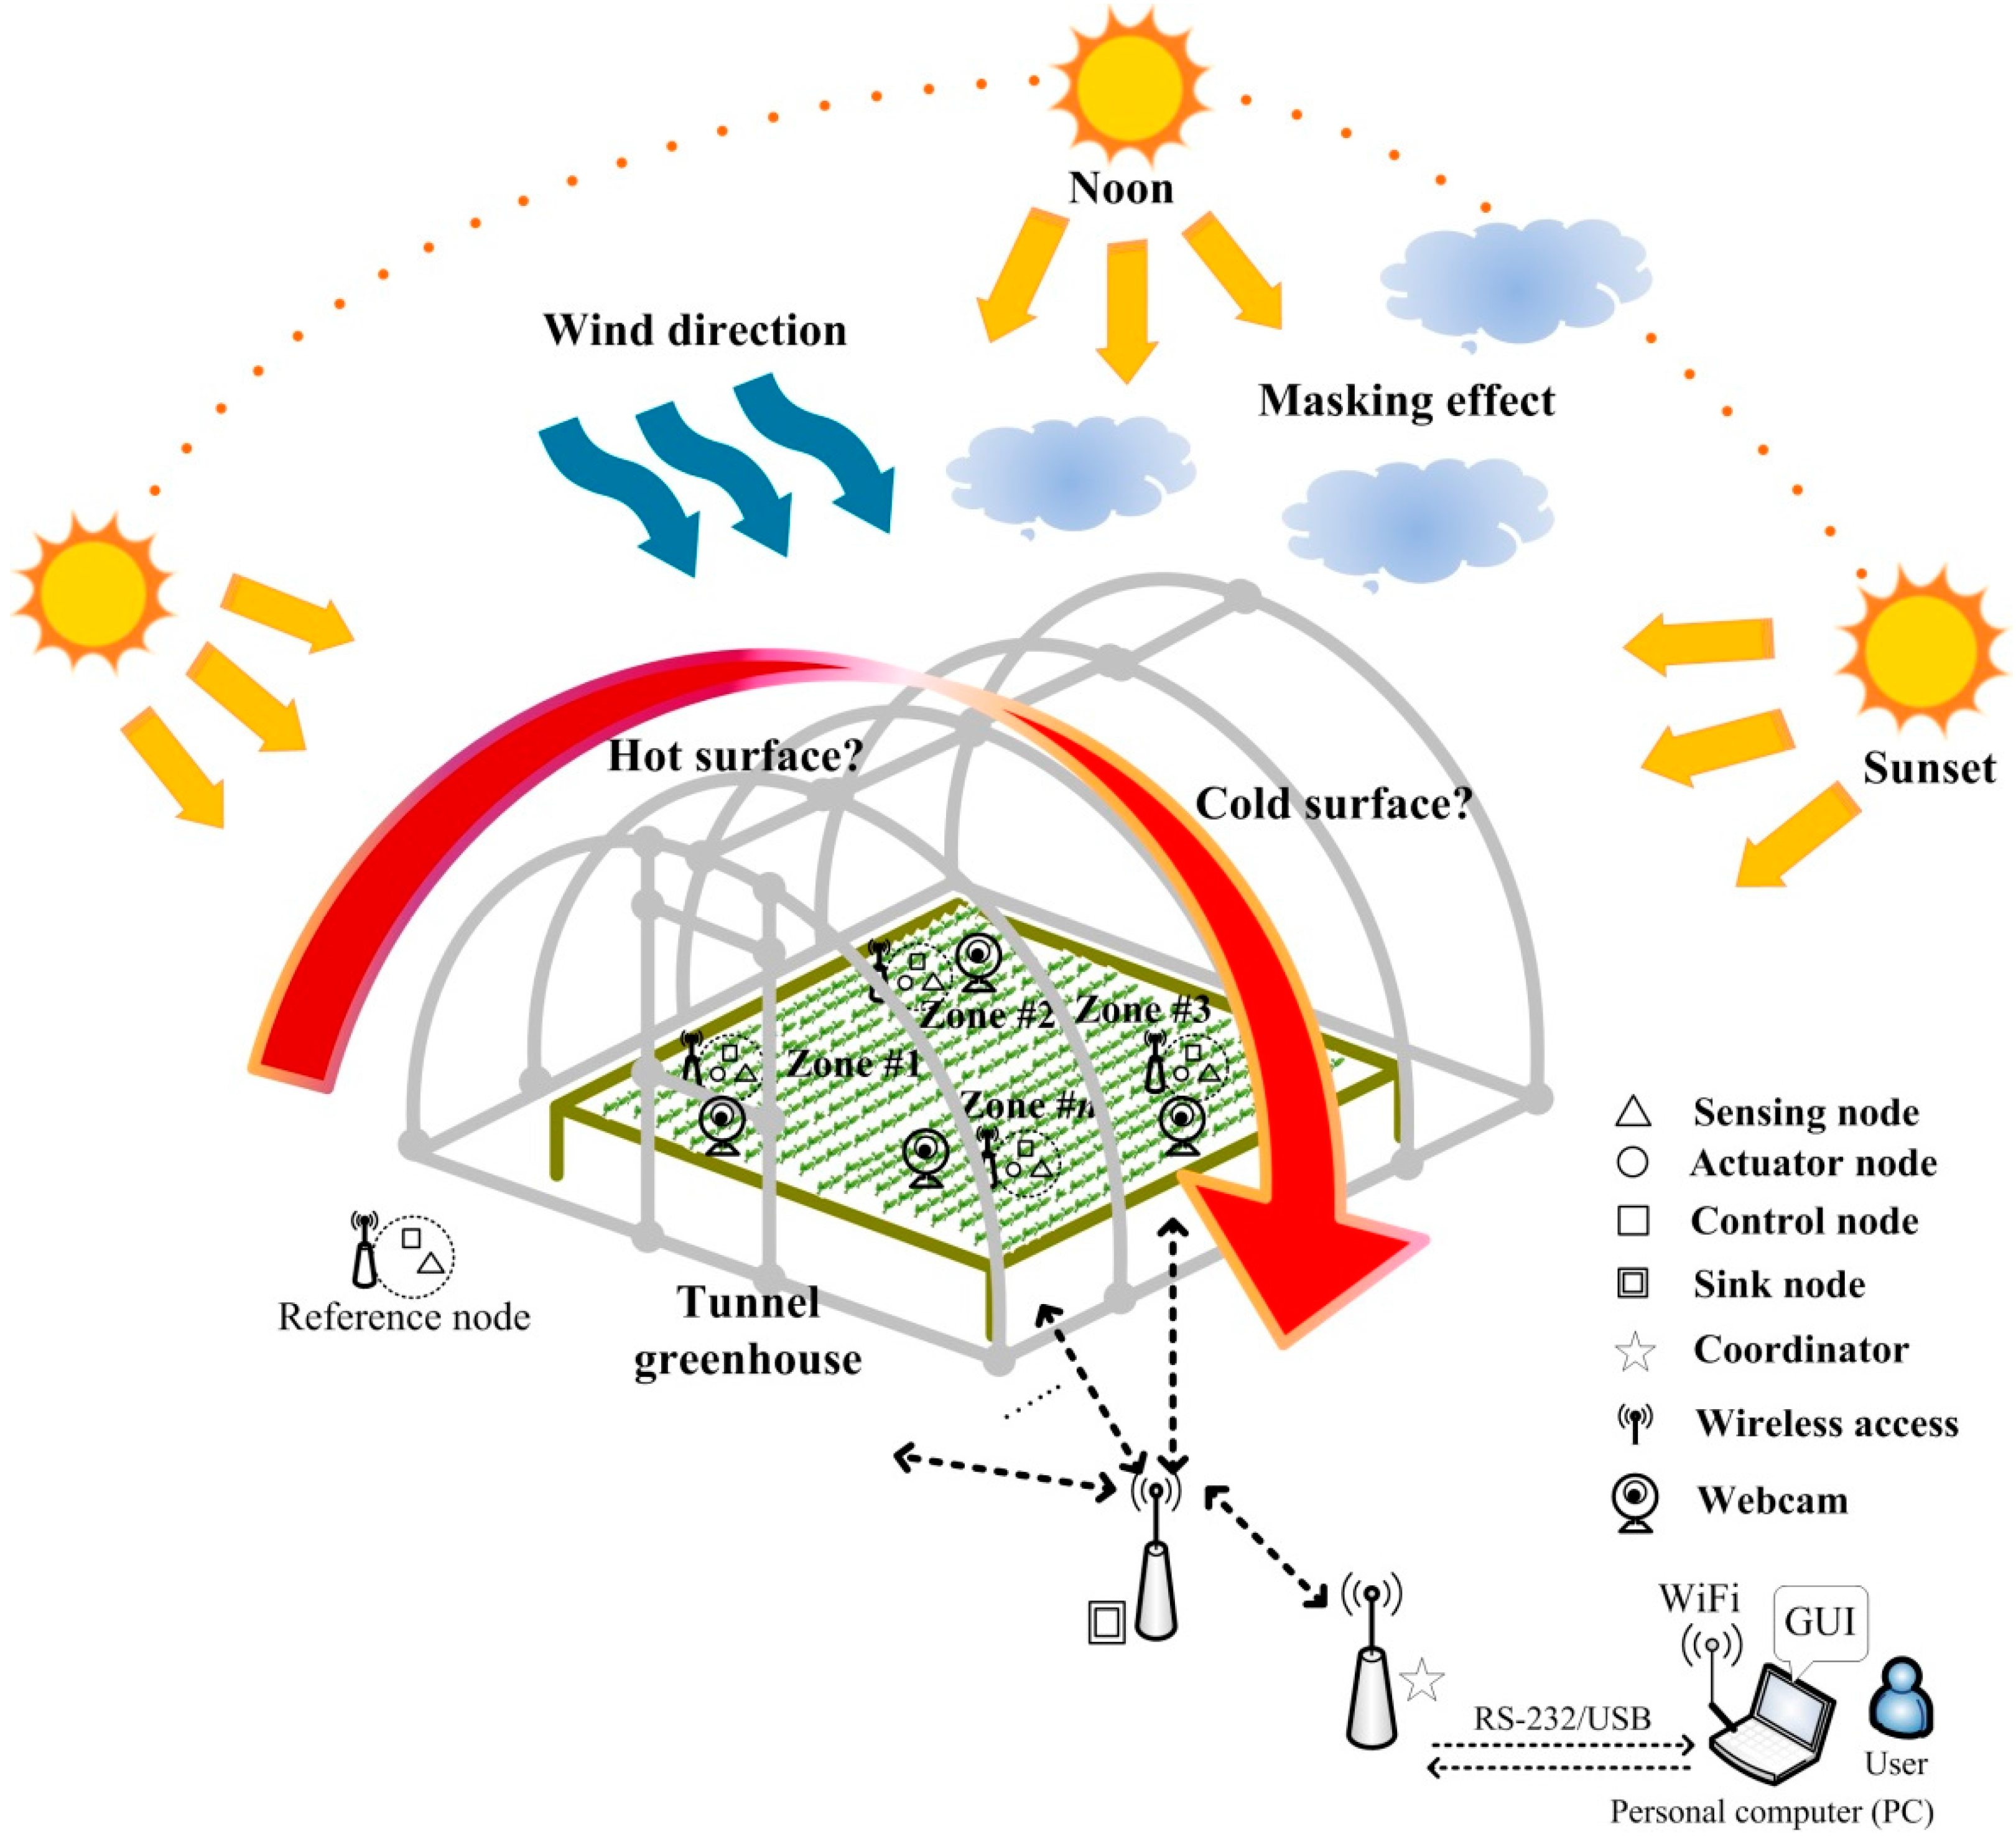
2.1. Design Concept

2.2. Decentralized Fuzzy Control Scheme
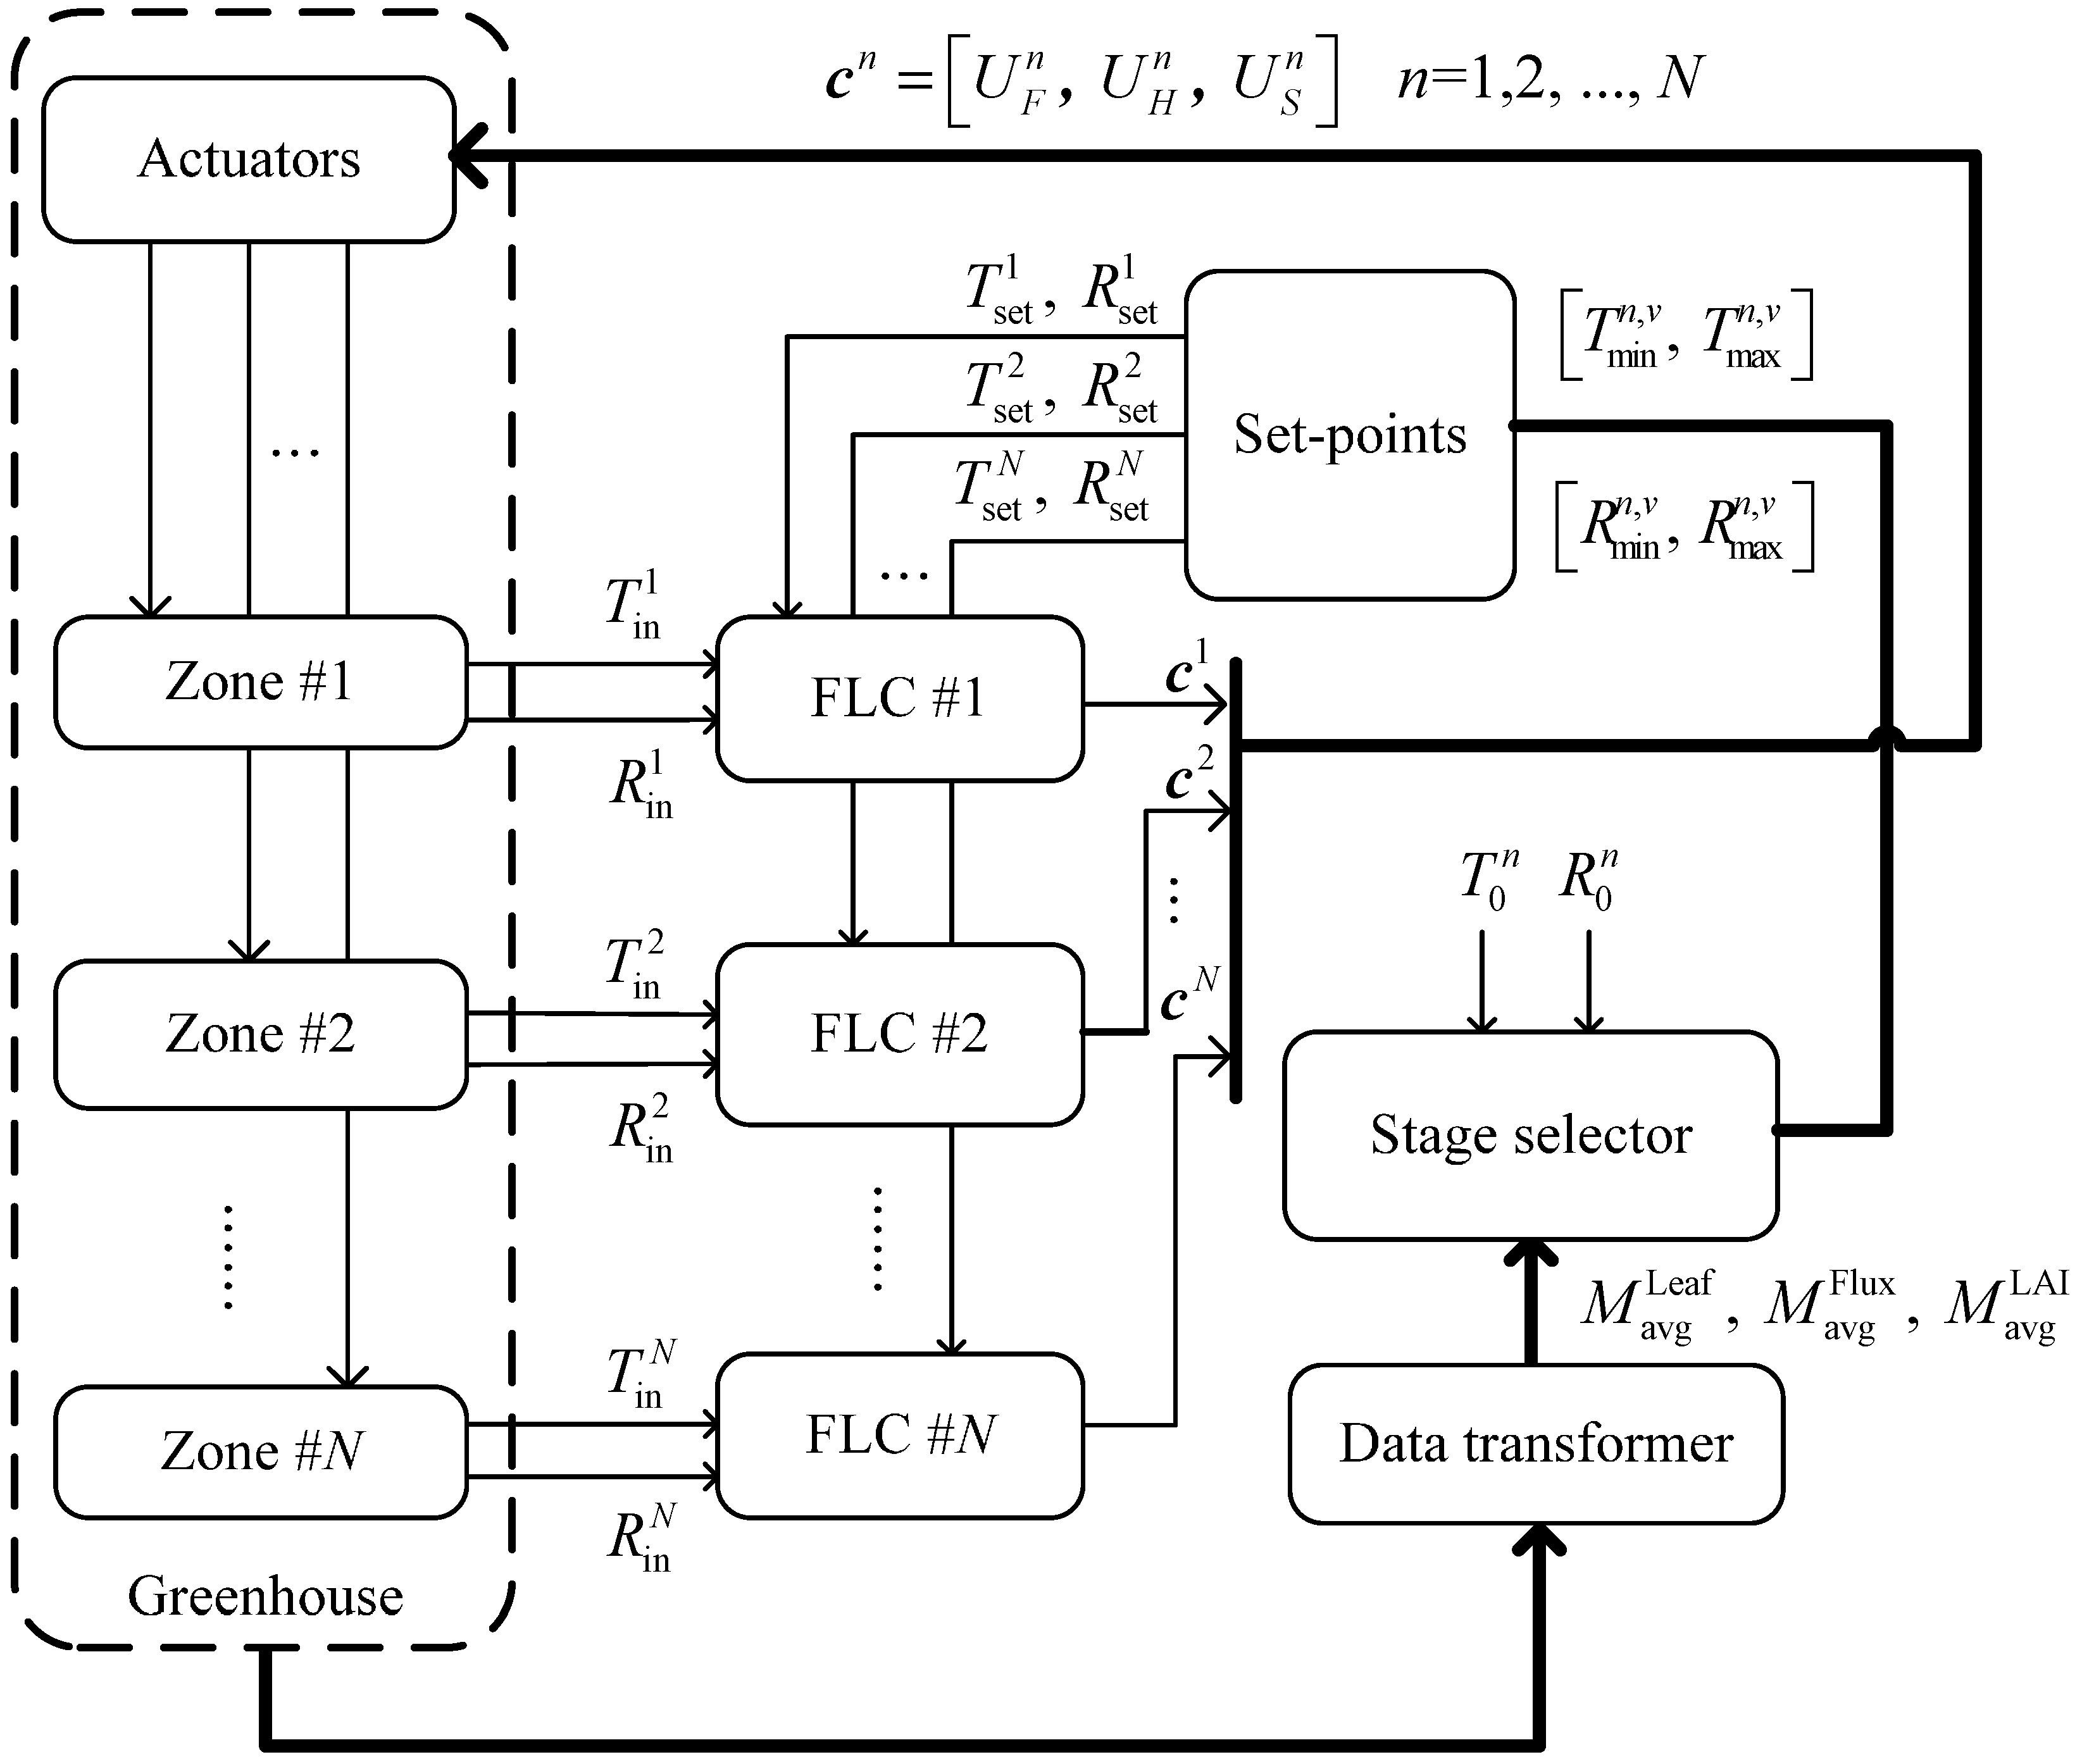
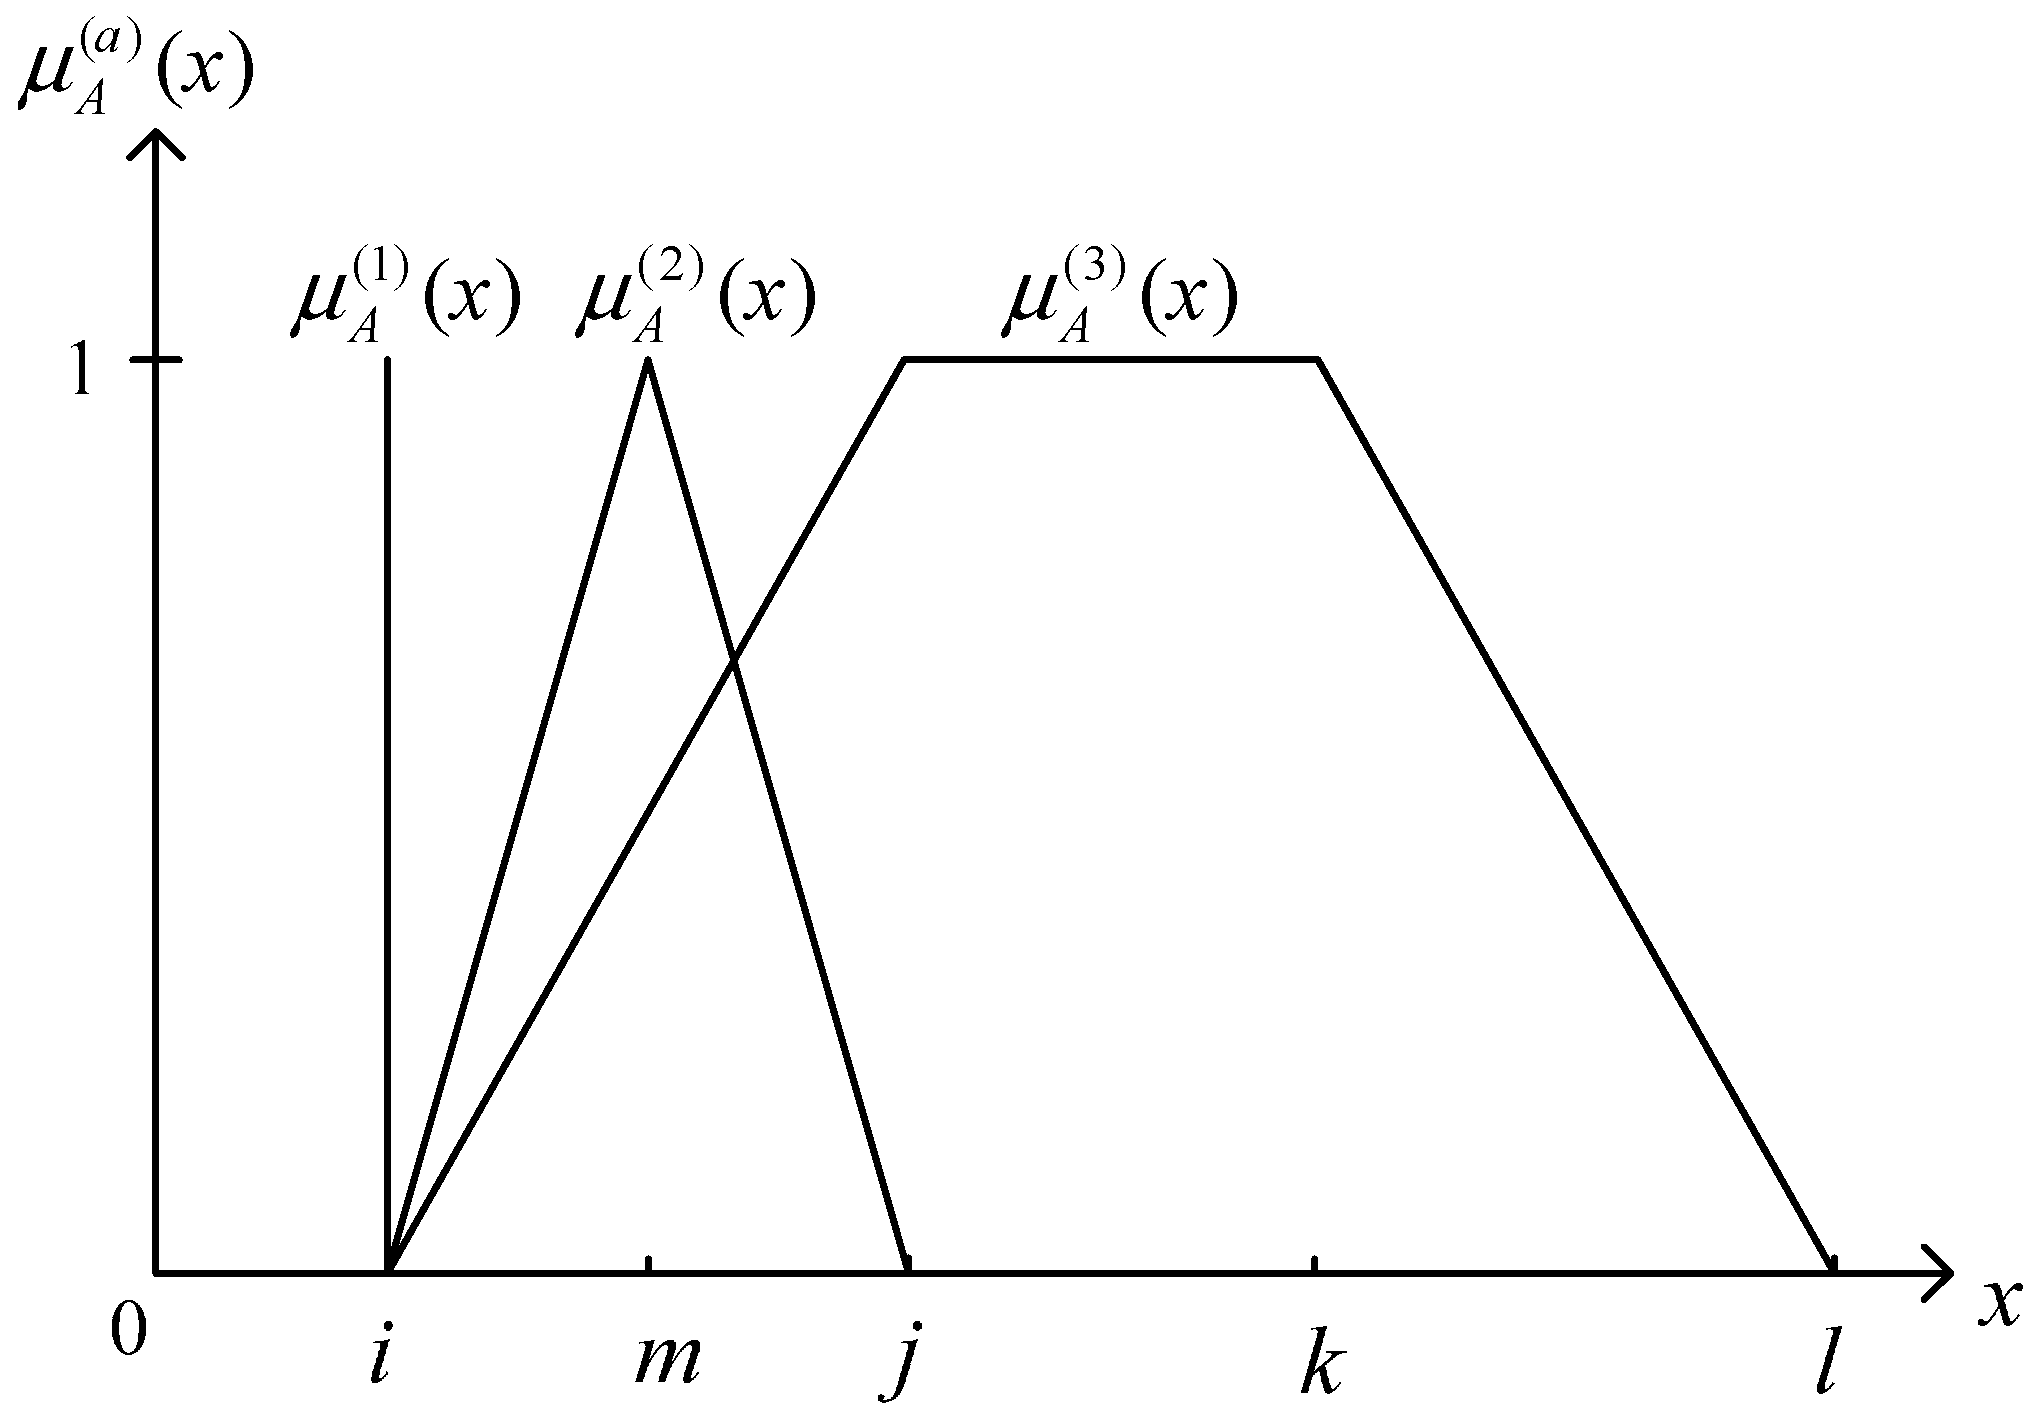
2.2.1. FLC

| Variables | Fuzzy Subset (Linguistic Labels) | Type of Membership Function | Points of Base | Range |
|---|---|---|---|---|
| Temperature deviation () | Trapezoid () | [−5, −5, −2.5, −0.5] | [−5, 5] | |
| Triangle () | [−1.5, 0, 1.5] | |||
| Trapezoid () | [0.5, 2.5, 5, 5] | |||
| Humidity deviation () | Trapezoid () | [−10, −10, −5, −3] | [−10, 10] | |
| Triangle () | [−5, 0, 5] | |||
| Trapezoid () | [3, 5, 10, 10] | |||
| Fan () | Singleton () | [0, 1] | ||
| Heater () | Singleton () | [0, 1] | ||
| Pad-fan () | Singleton () | [0, 1] | ||
| S | M | B | ||
|---|---|---|---|---|
| S | ||||
| M | ||||
| B | ||||
2.2.2. Data Transformer
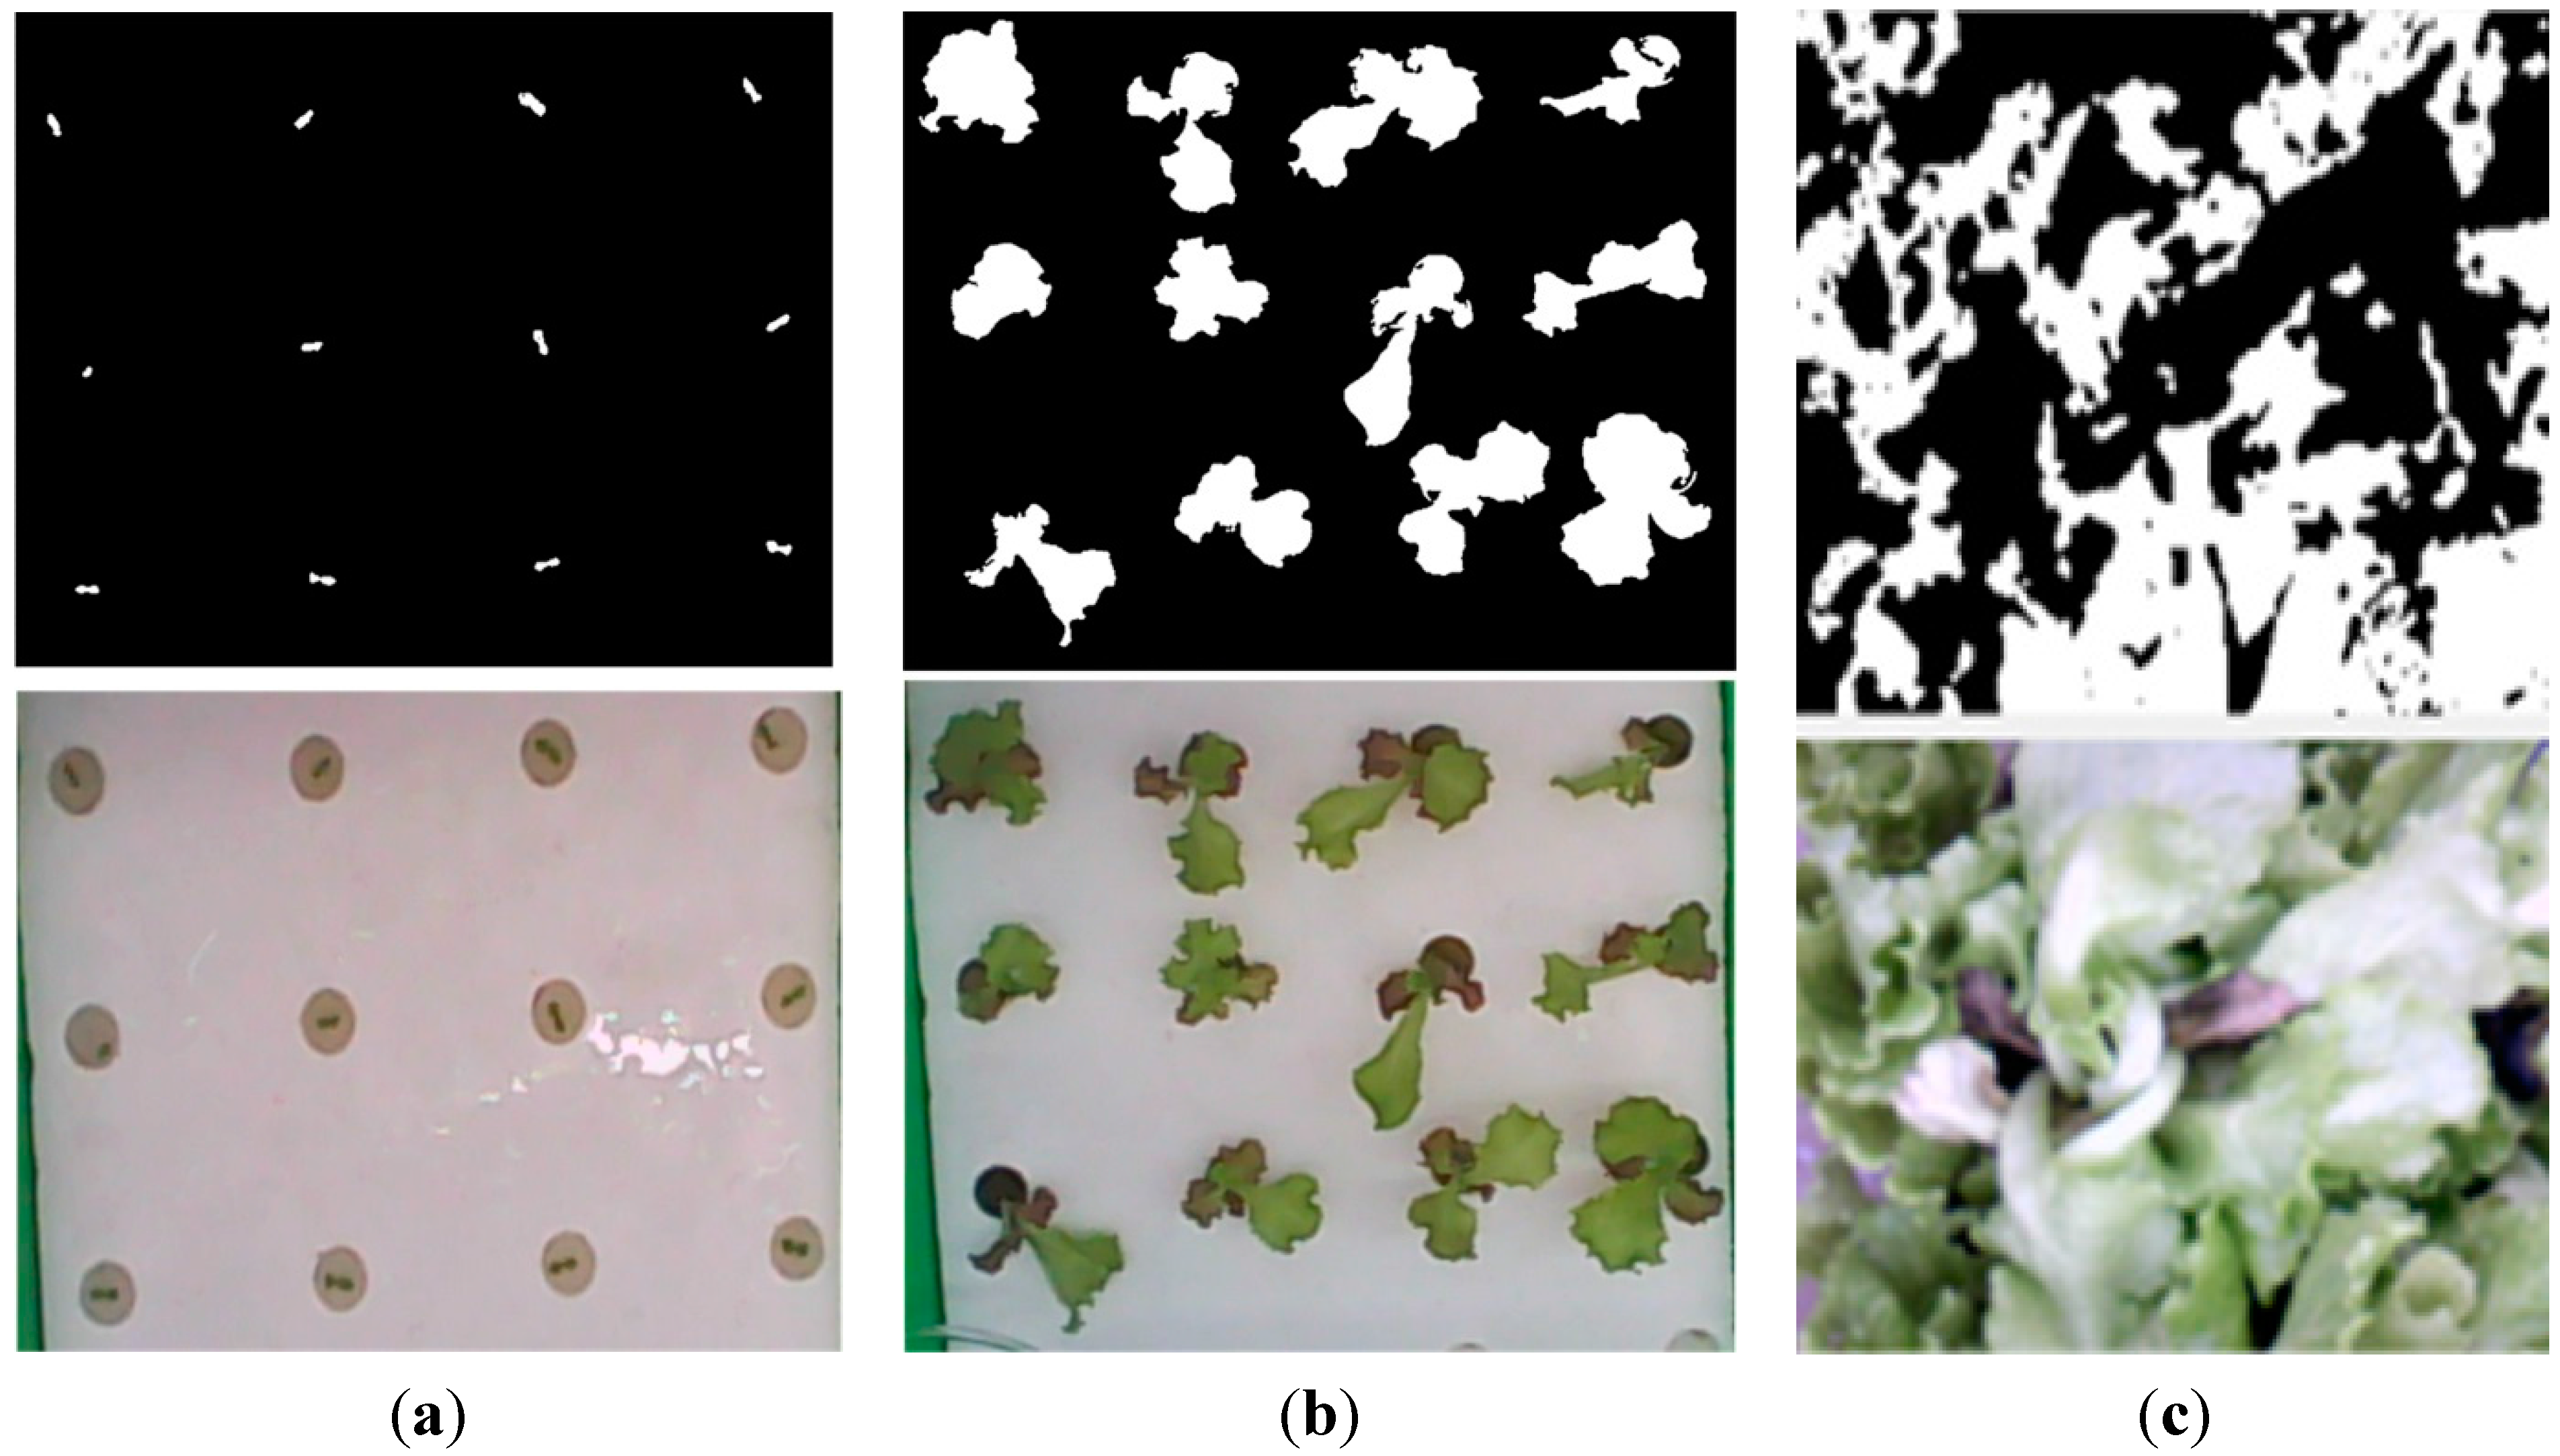
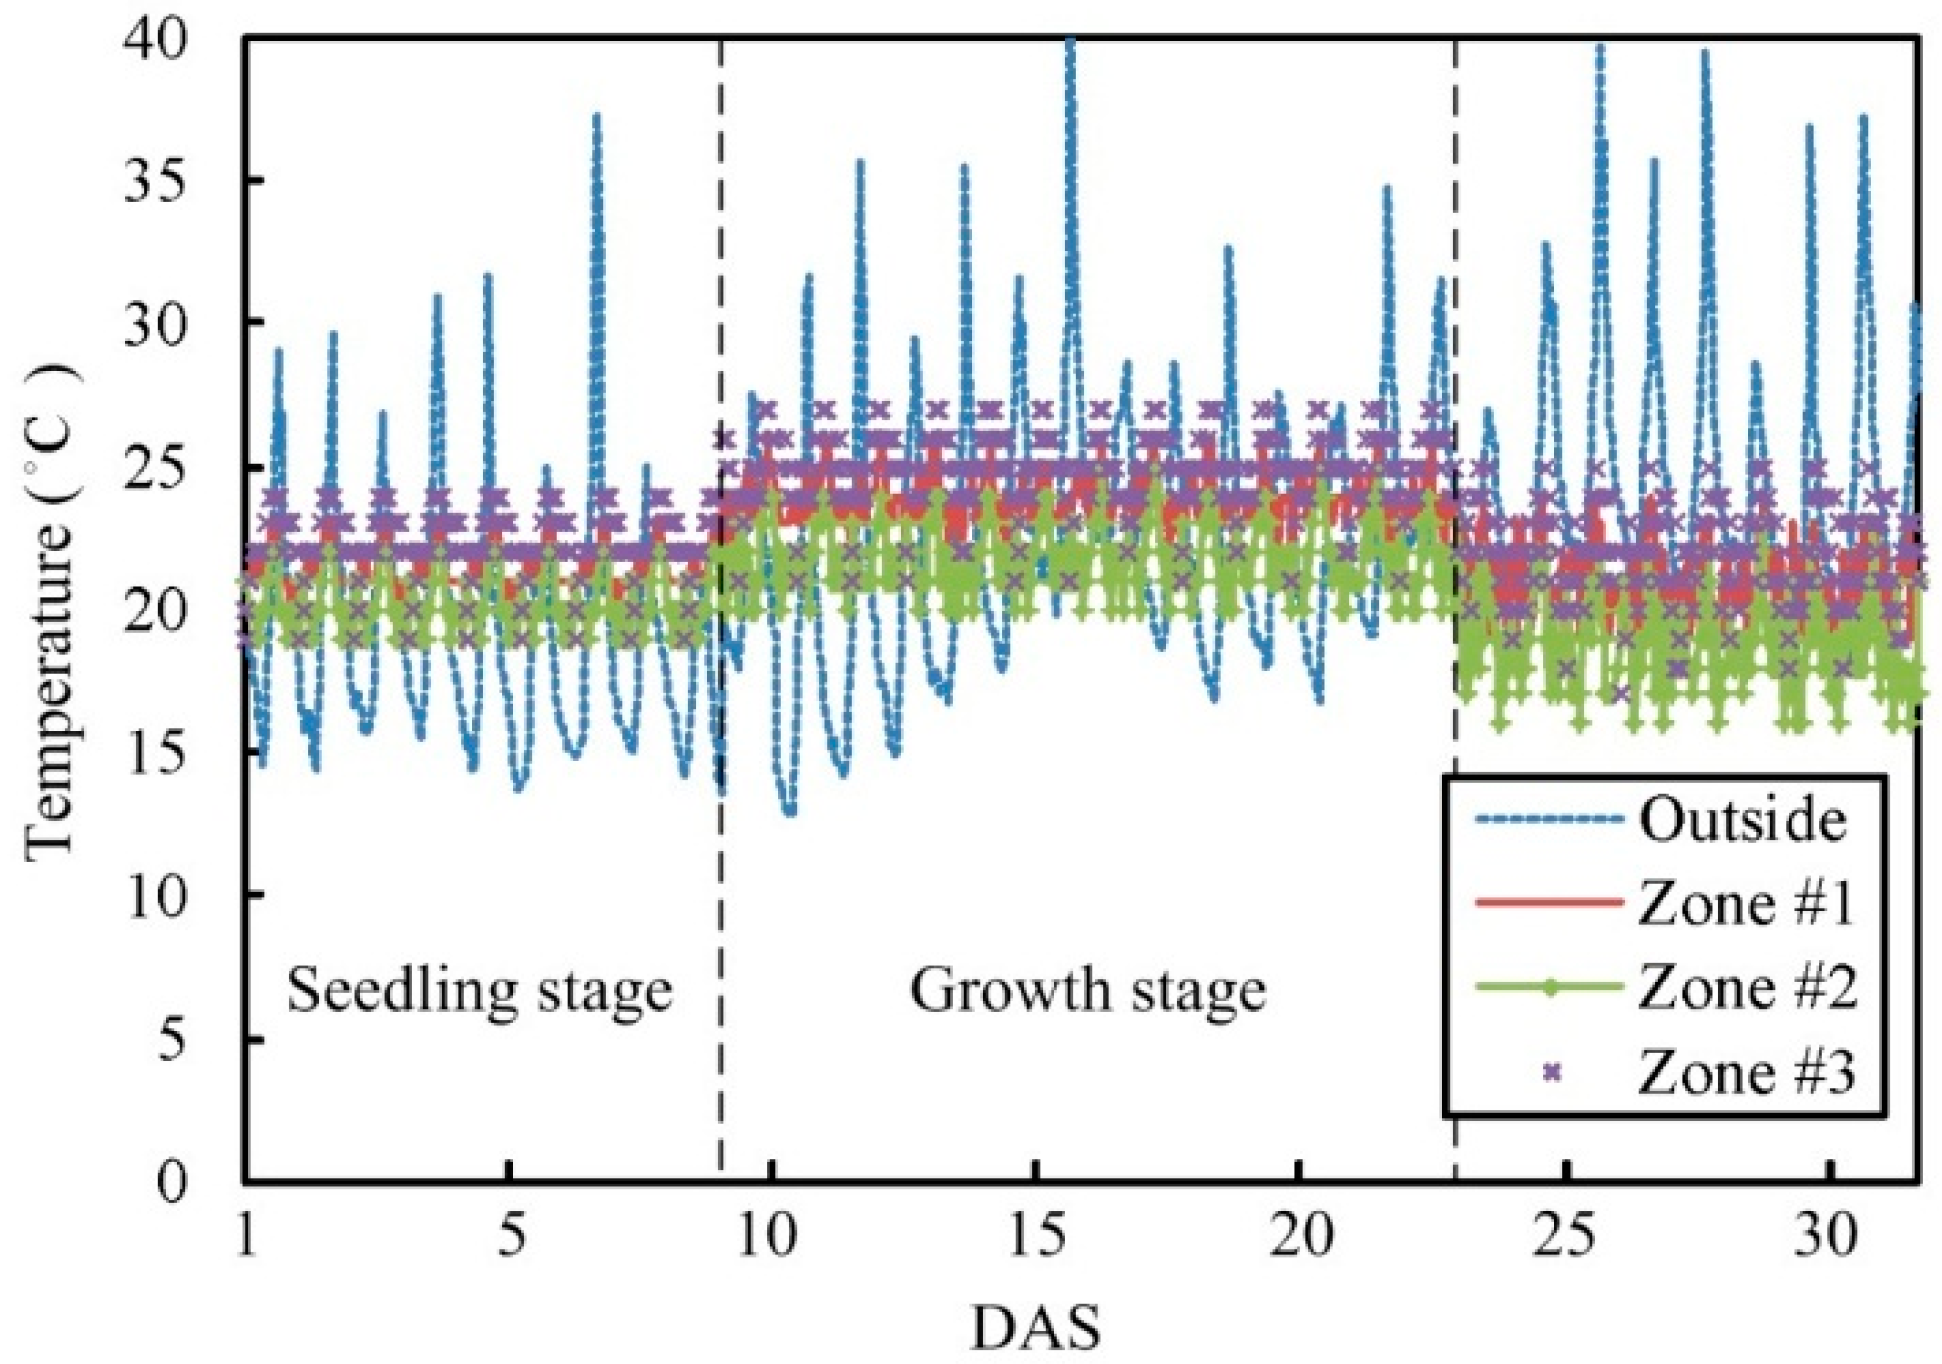
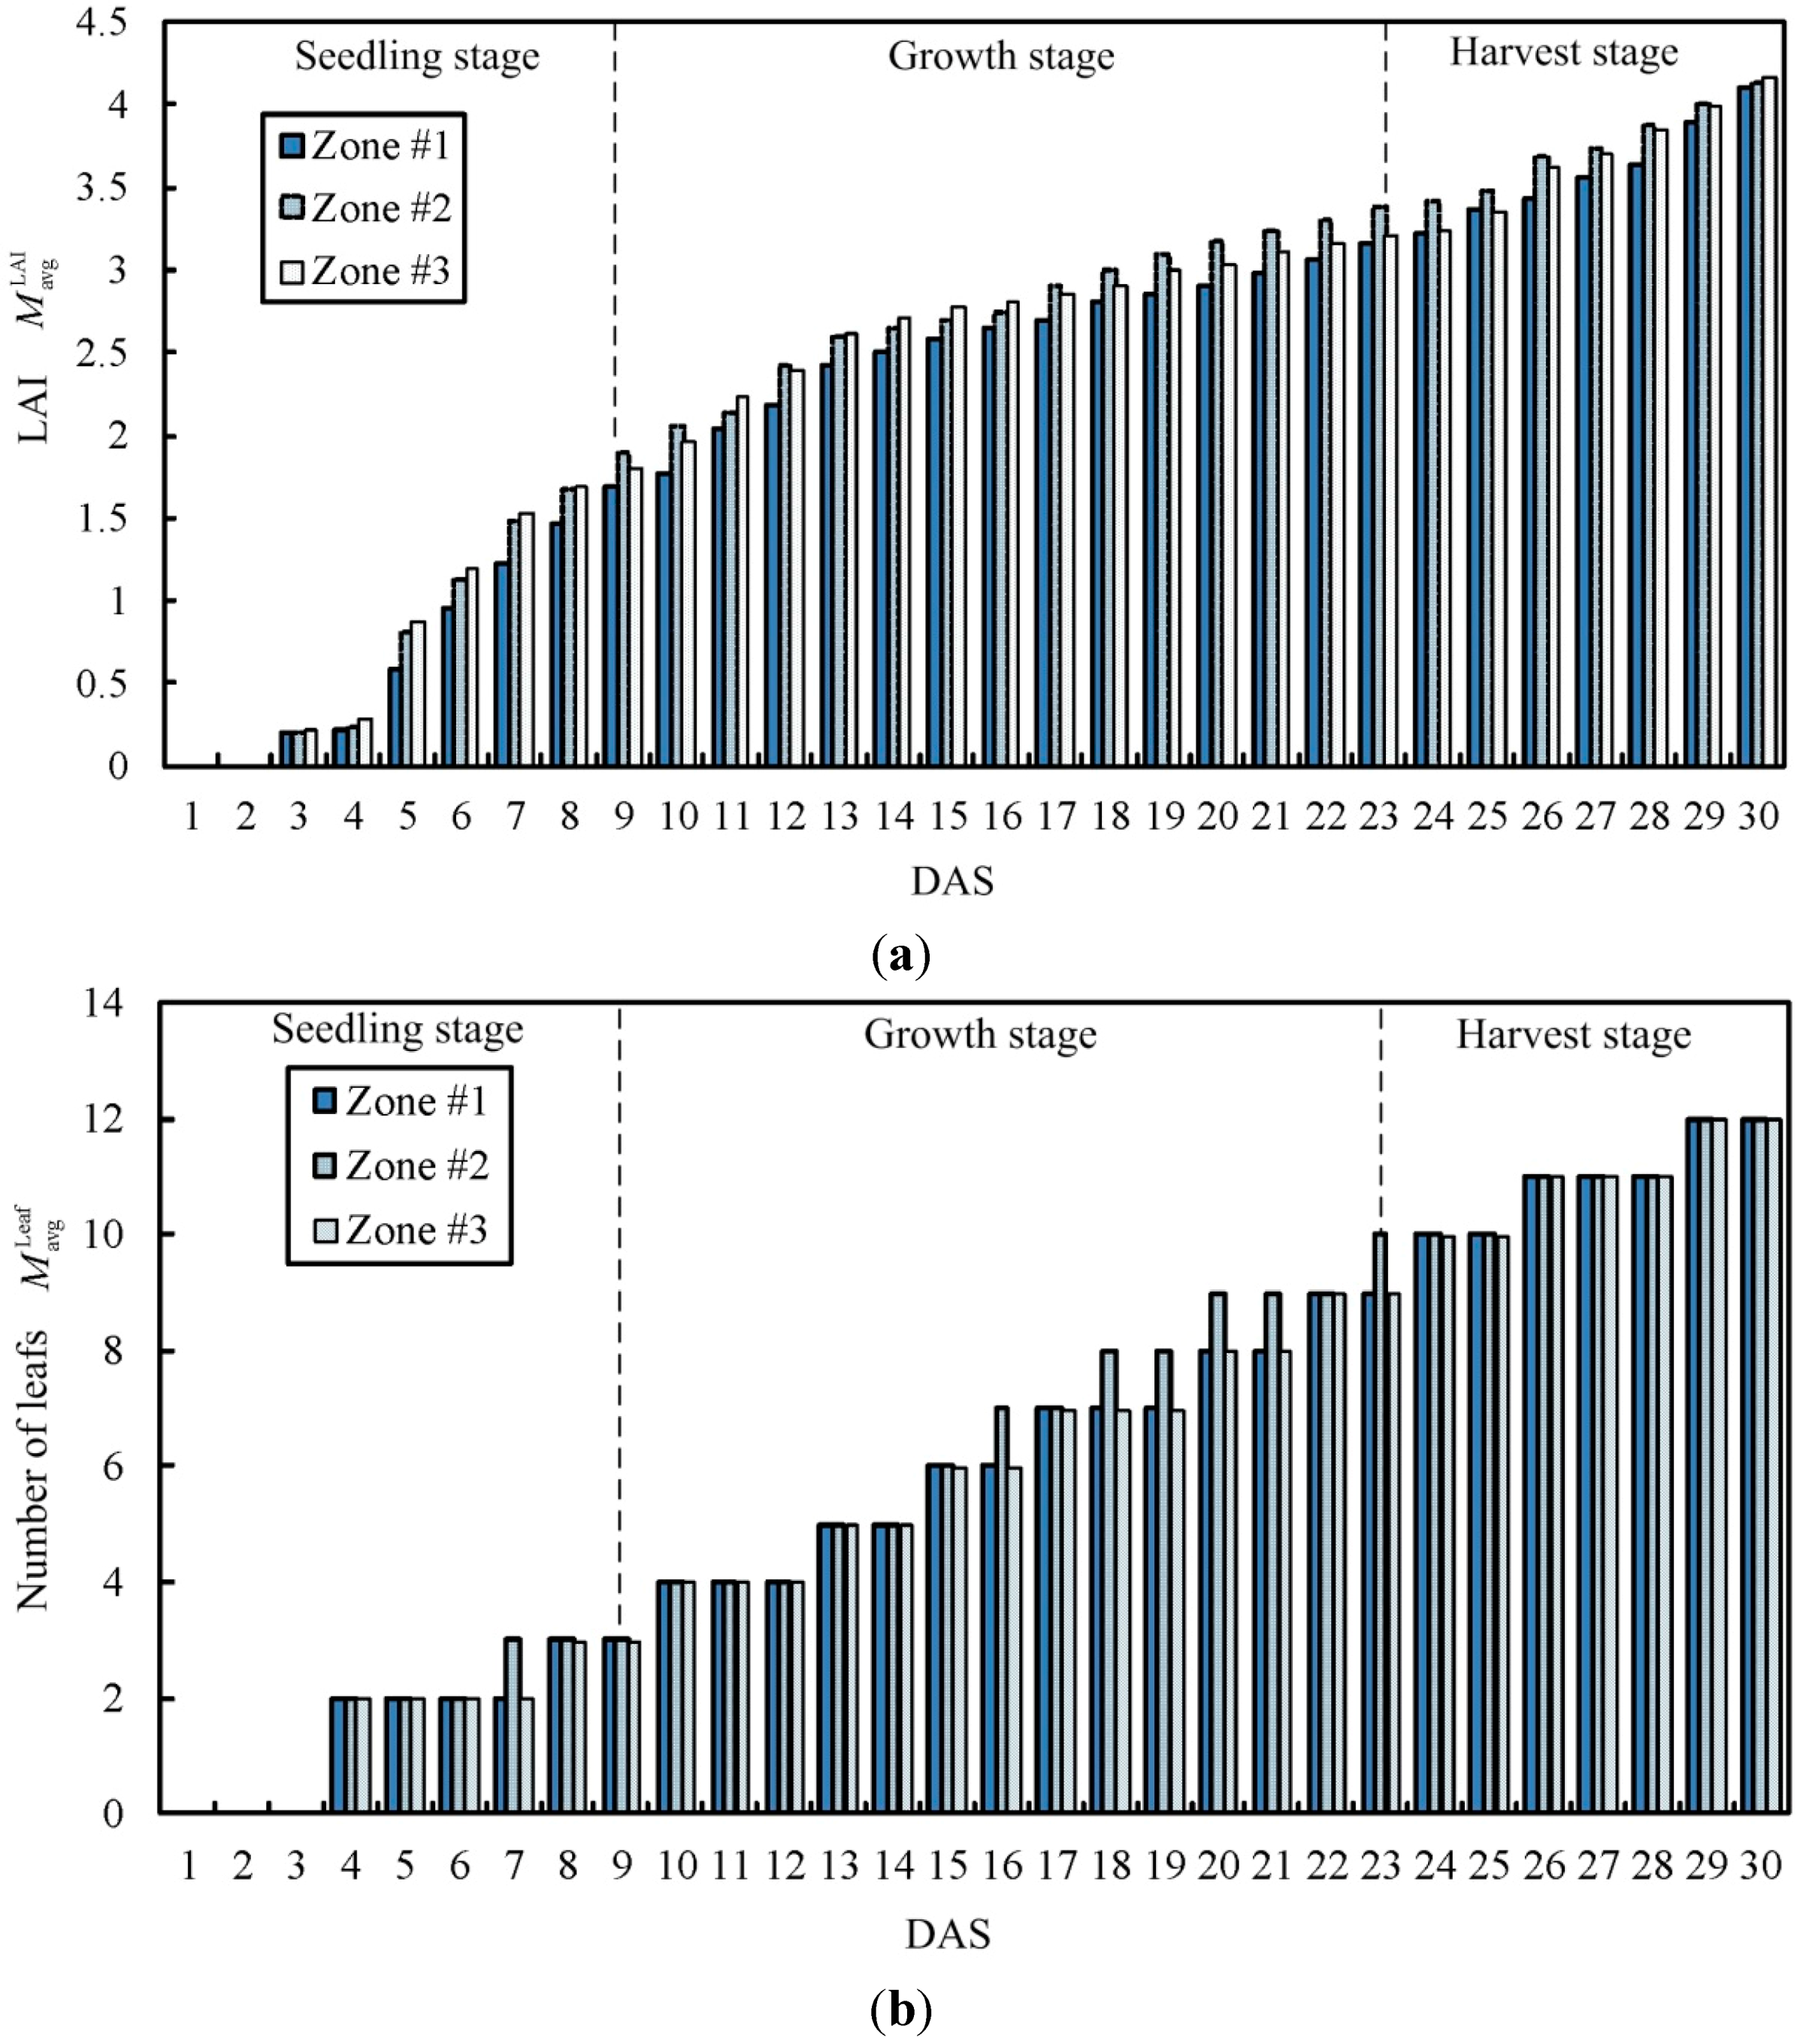
2.2.3. Growth Stage Selector
| Parameters | Leaf Area Index | Number of Leaves | Cumulative Amount of Light () | |
|---|---|---|---|---|
| Growth Stage | ||||
| Seedling stage | ||||
| Growth stage | ||||
| Harvest stage | ||||
| Stage | Seedling Stage | Growth Stage | Harvest Stage | |
|---|---|---|---|---|
| Range | ||||
| Temperature | ||||
| Humidity | ||||
2.2.4. Set-Points Module
3. System Implementation

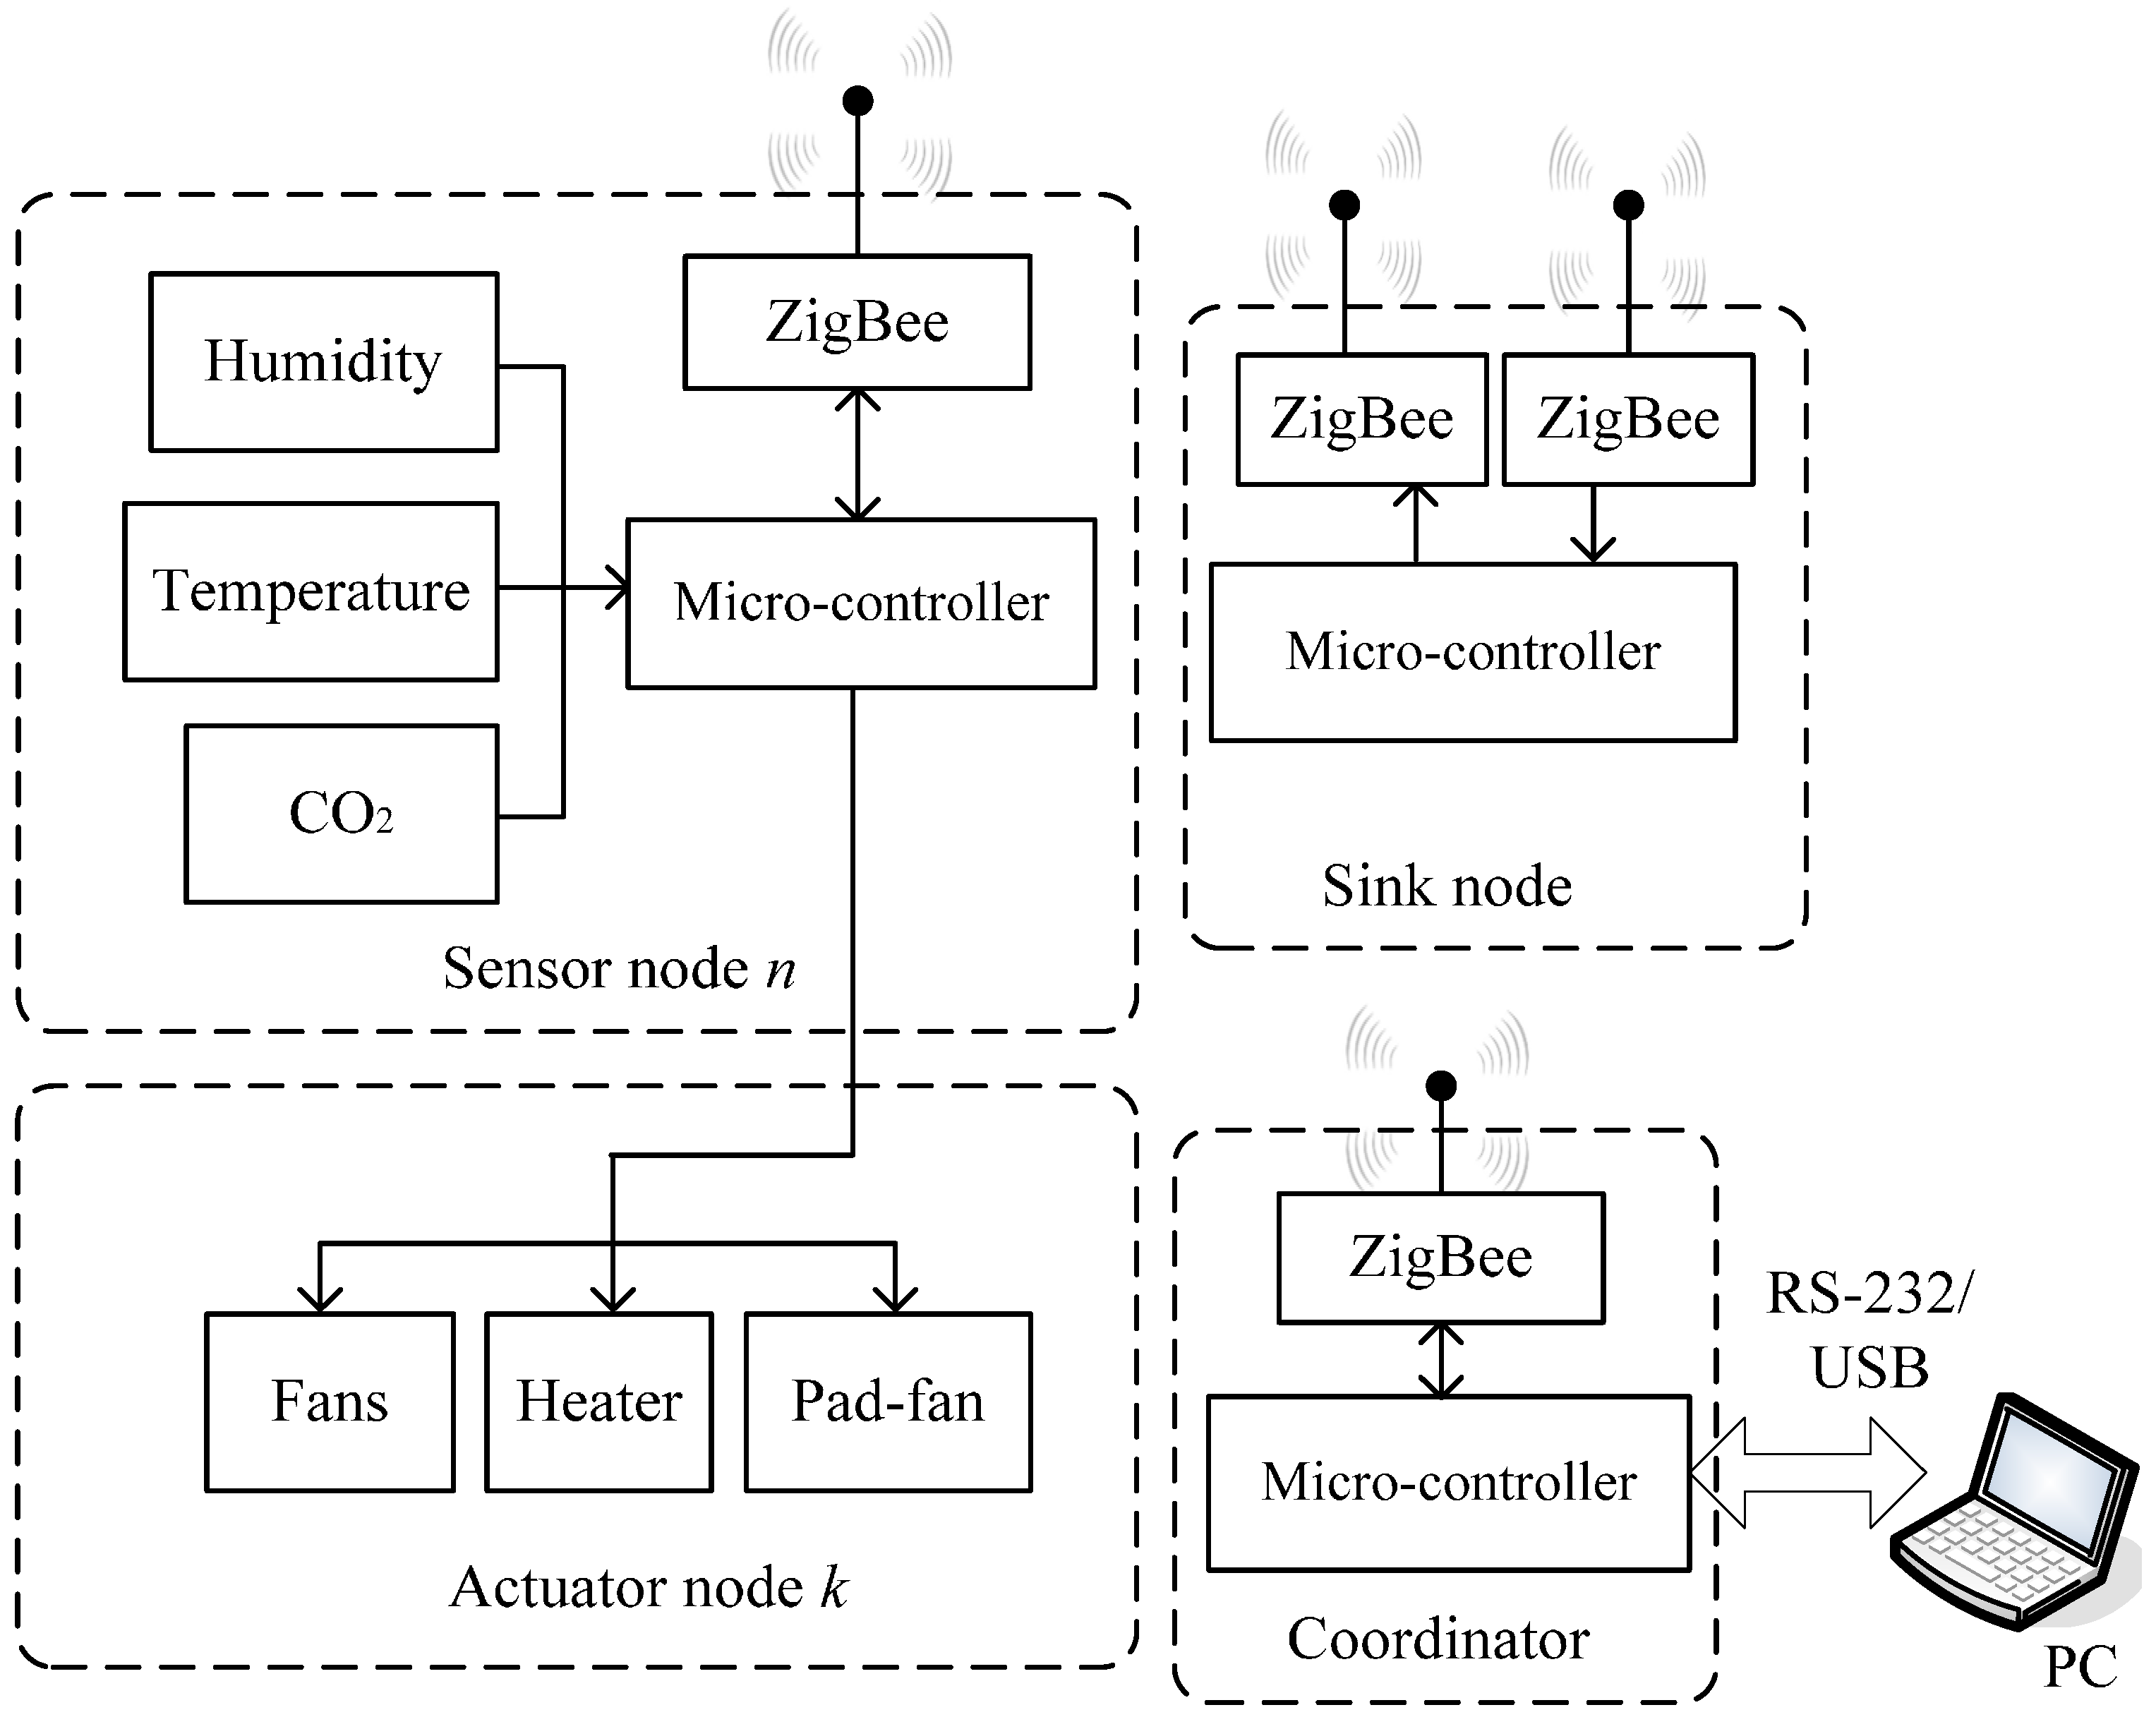
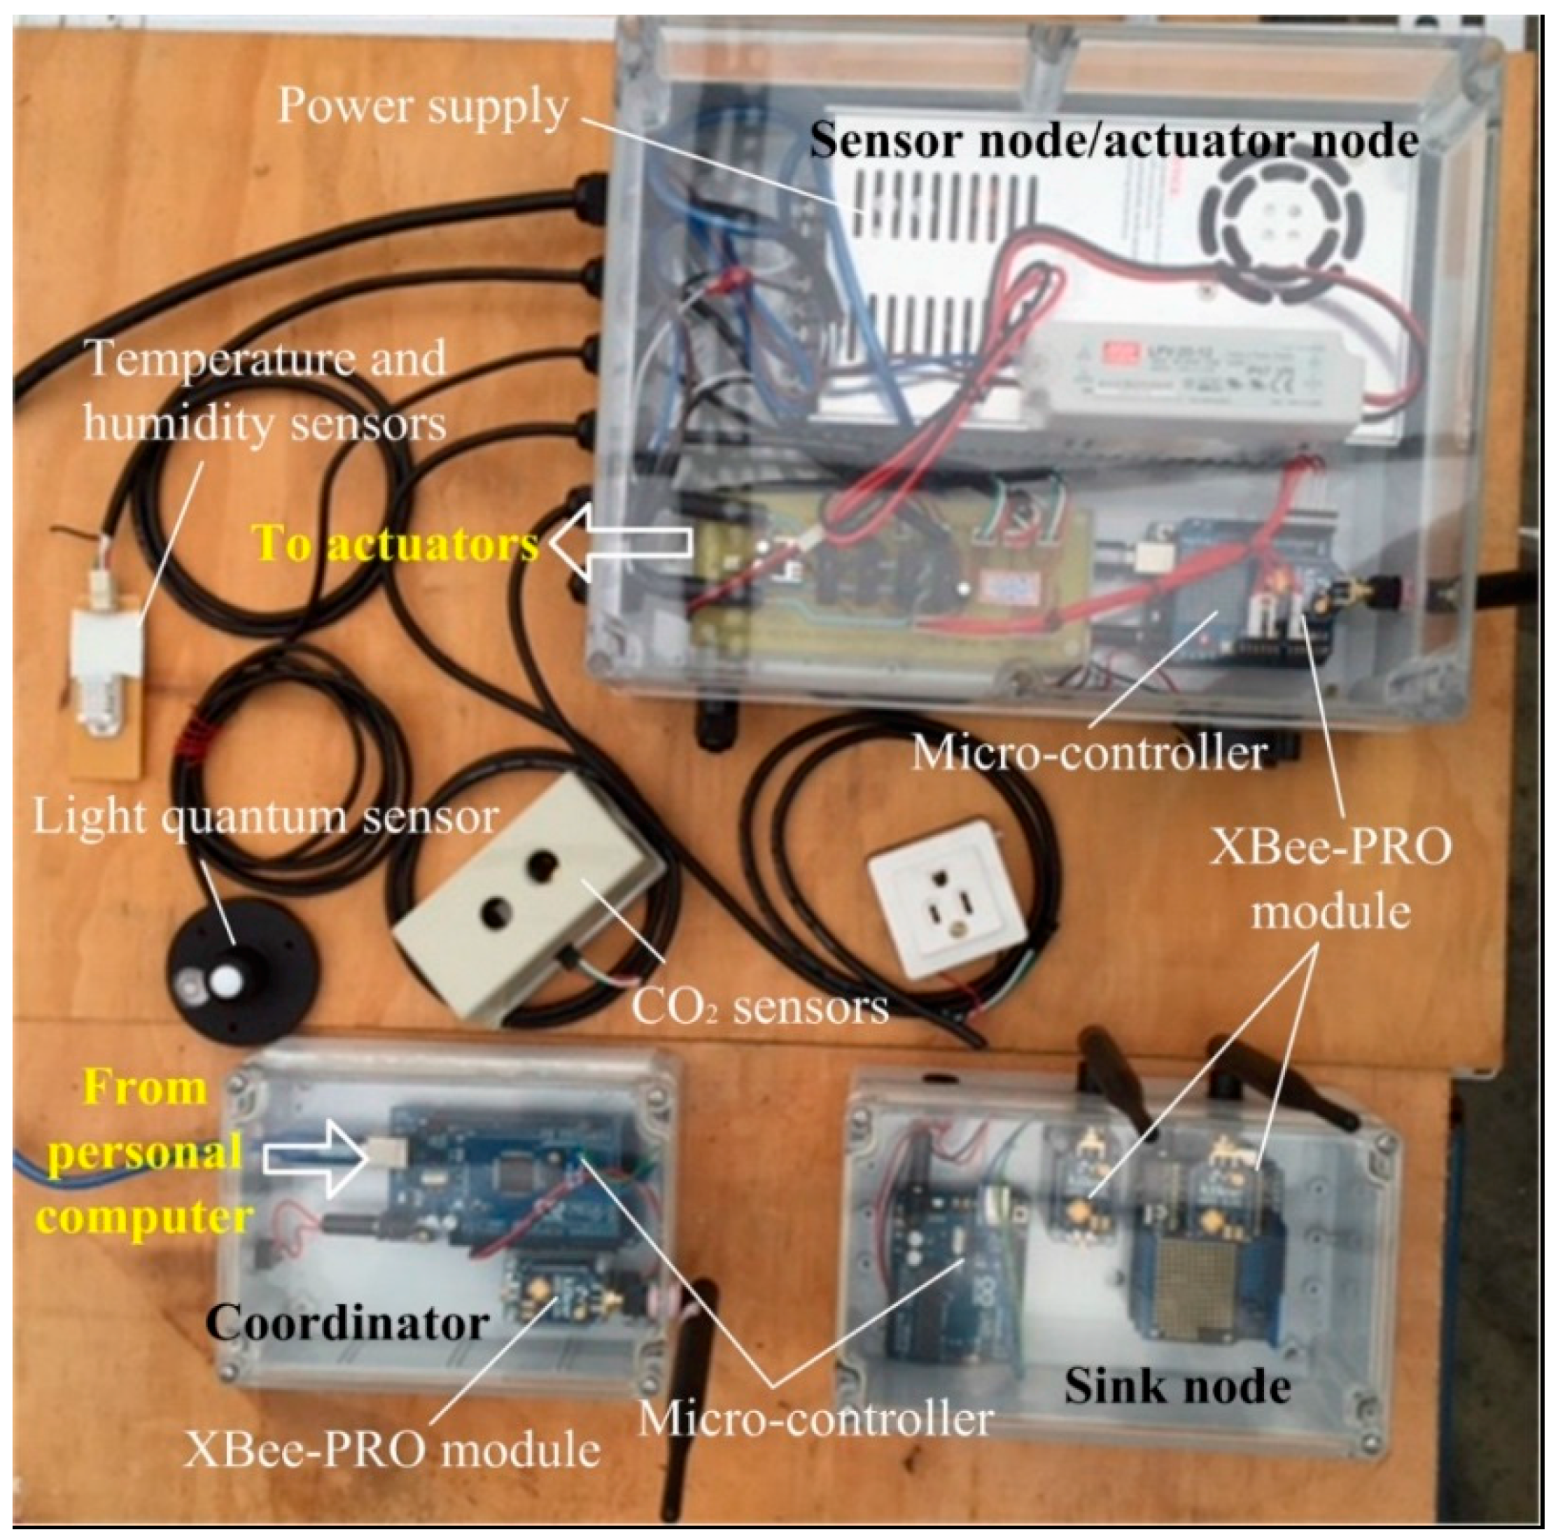
3.1. Hardware
3.1.1. Sensor Node

3.1.2. Actuator Node
3.1.3. Control Node
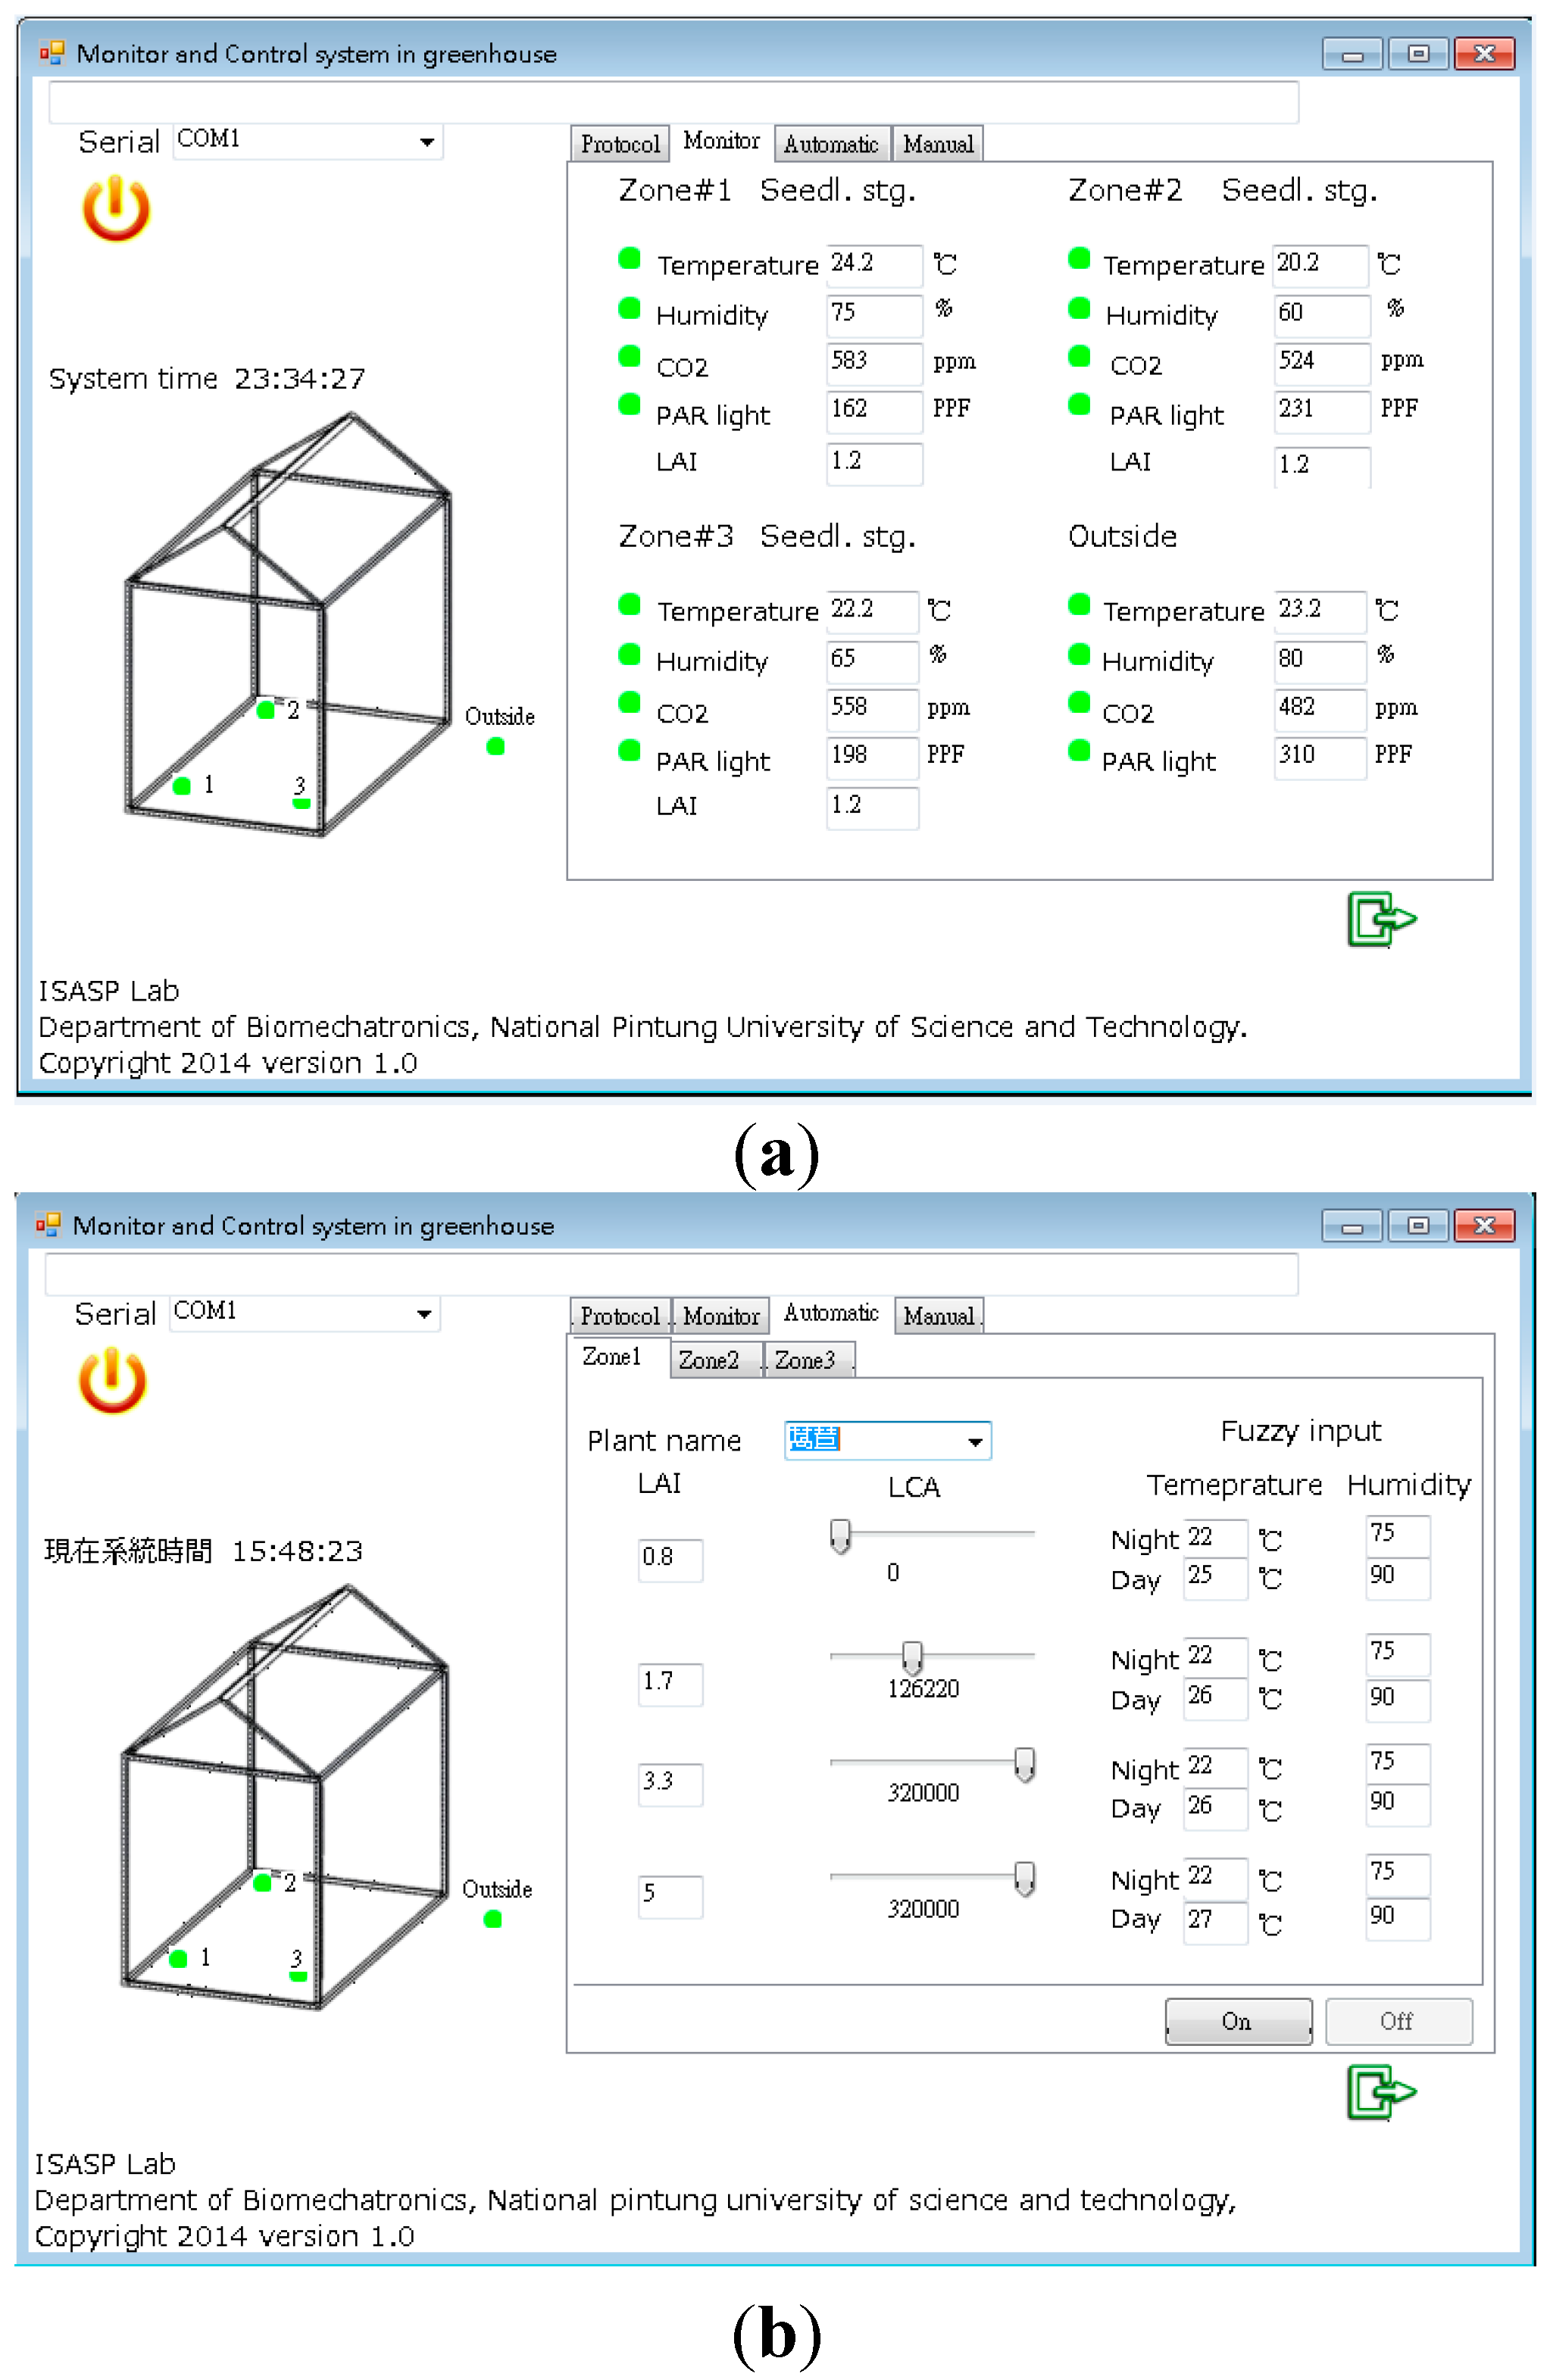
3.2. Software
3.2.1. Graphic User Interface


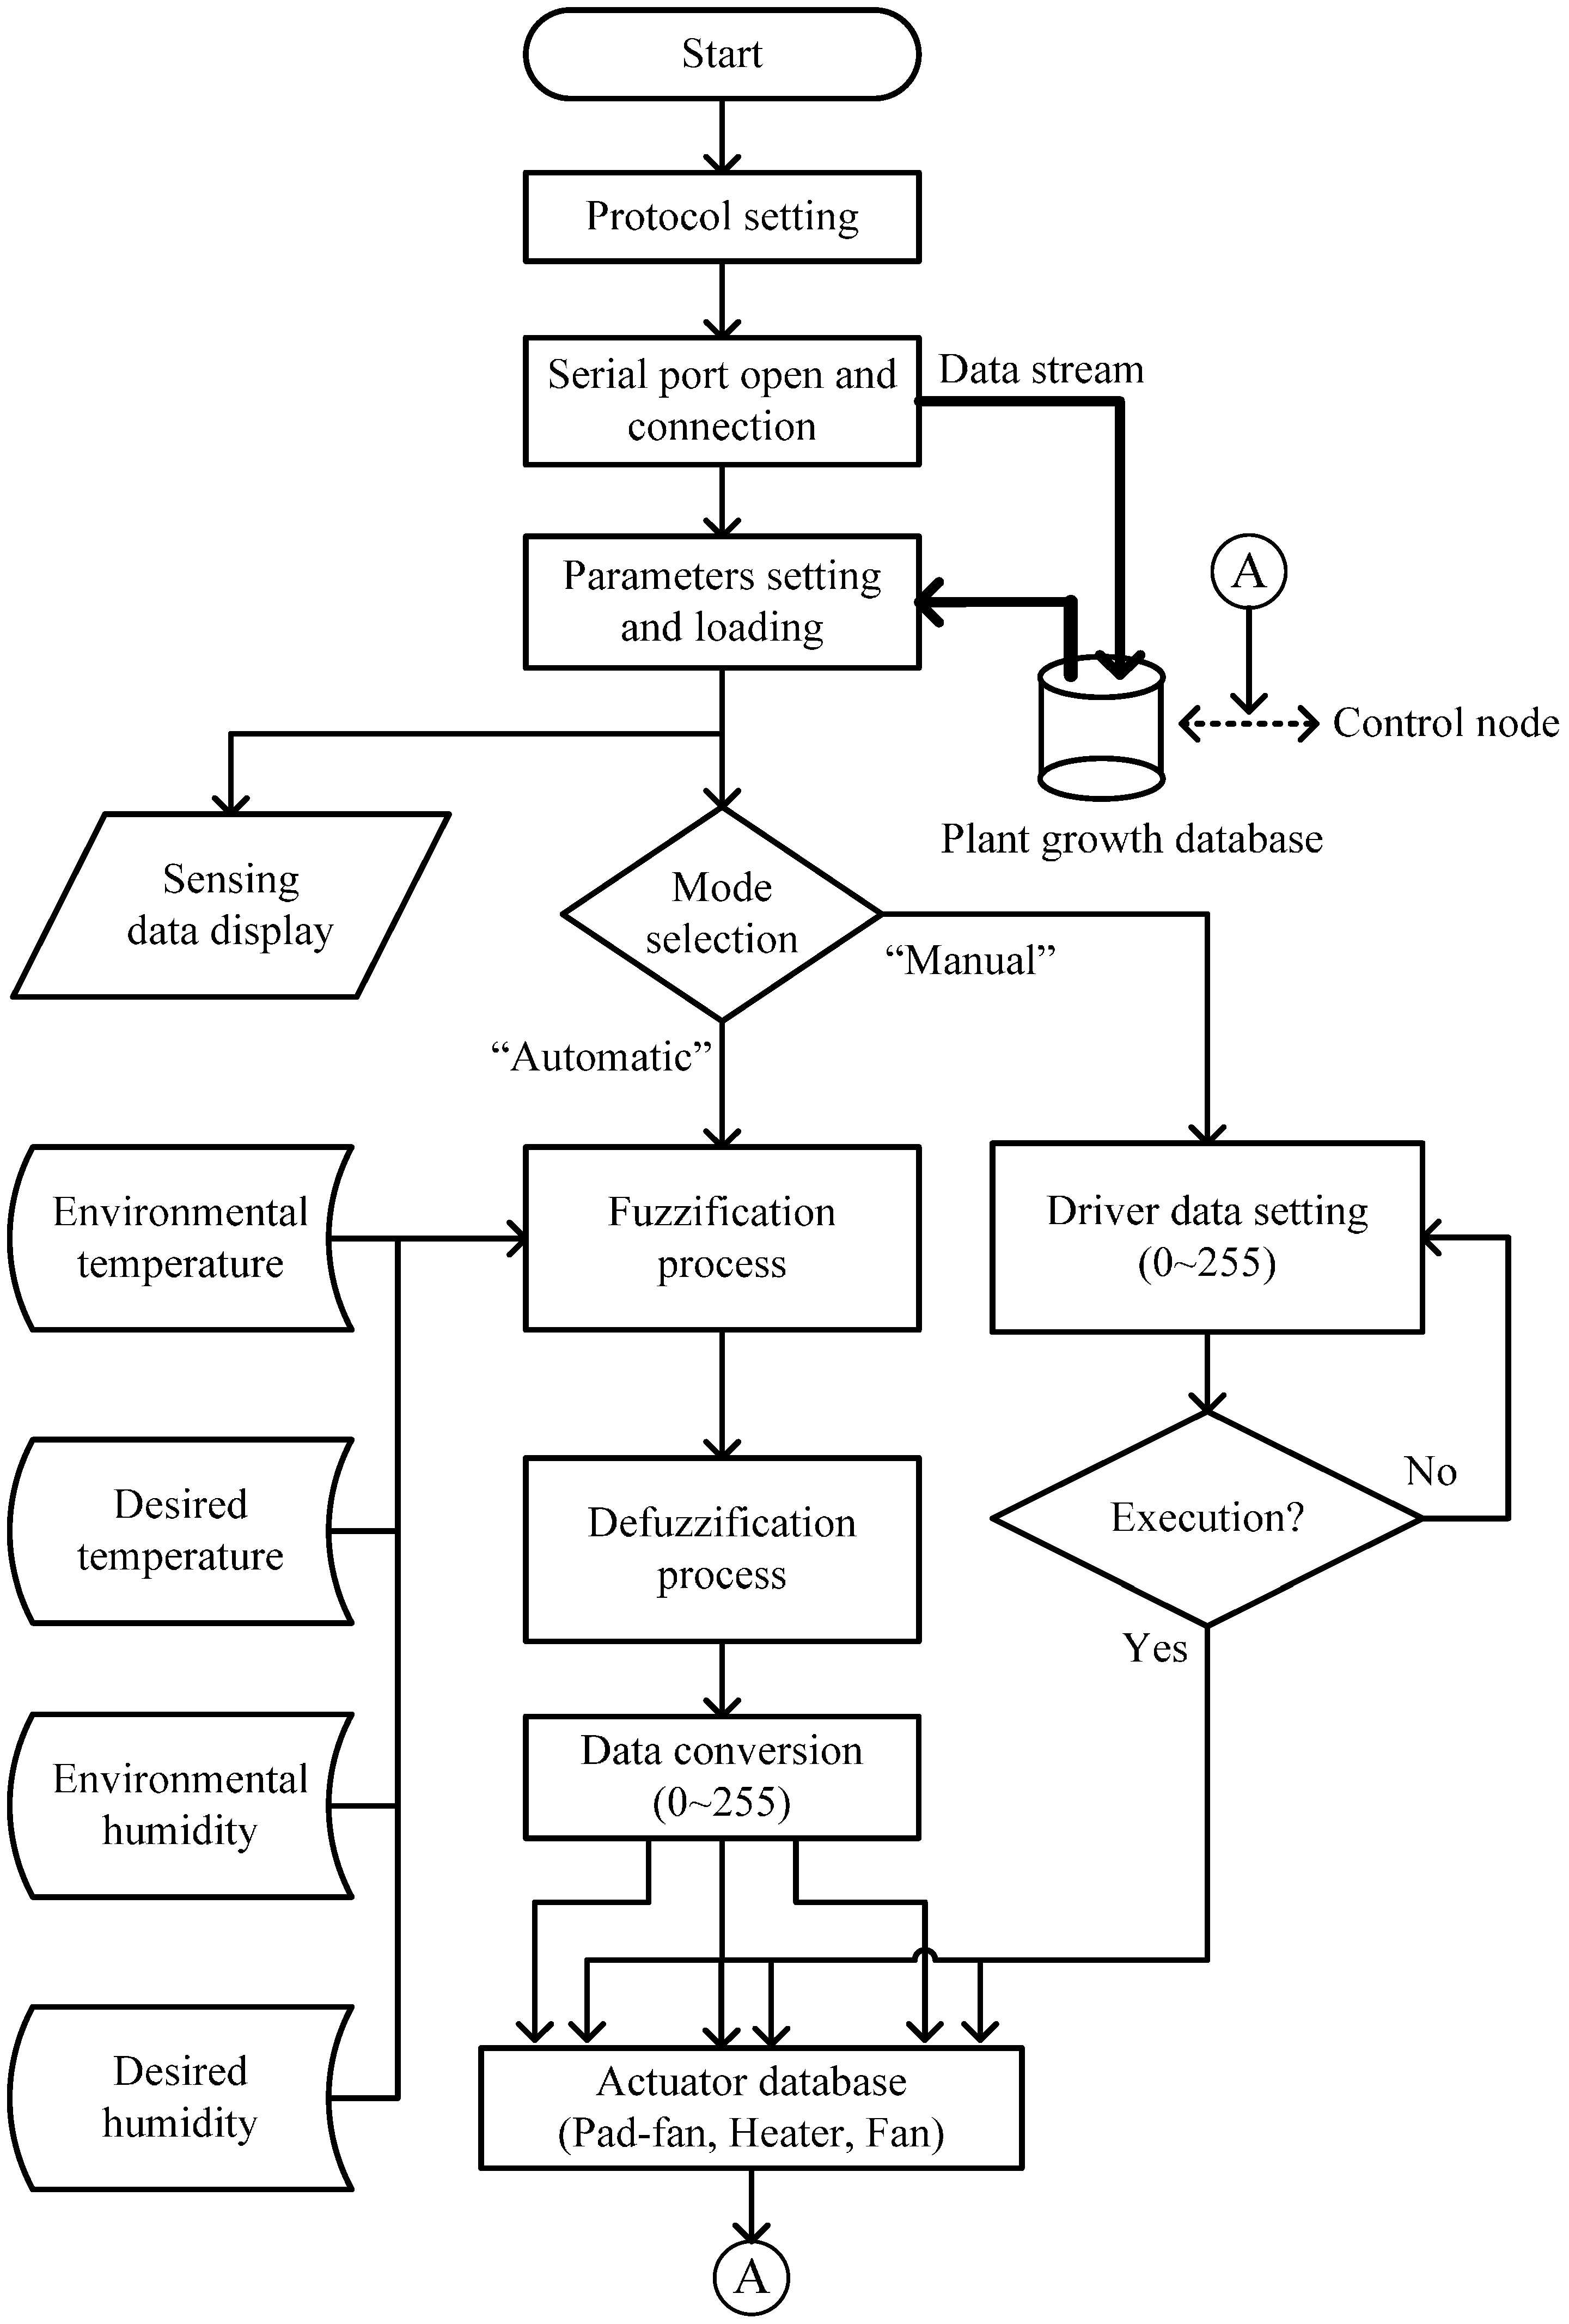
3.2.2. Data Reception and Control Program
Define variables
Input variable: sensor data (Temperature, Humidity, CO2, and Light intensity);
Output variable: actuator data (Heater, Pad-fan, and Fans);
Communication: protocol setup and port connection (PC and ZigBee);
Begin
  Loop 1
    { Receive the actuator data from PC;
 Remove wrong data.
      Decode the actuator data;
      Send the decoded actuator data to actuator via Zigbee;
 }
  Loop 2
    { Receive the sensor data via Zigbee;
 Remove wrong data.
      Decode sensor data;
      Send the decoded sensor data to PC;
    }
End
3.3. System Integration and Testing

4. Experimental Results and Discussion
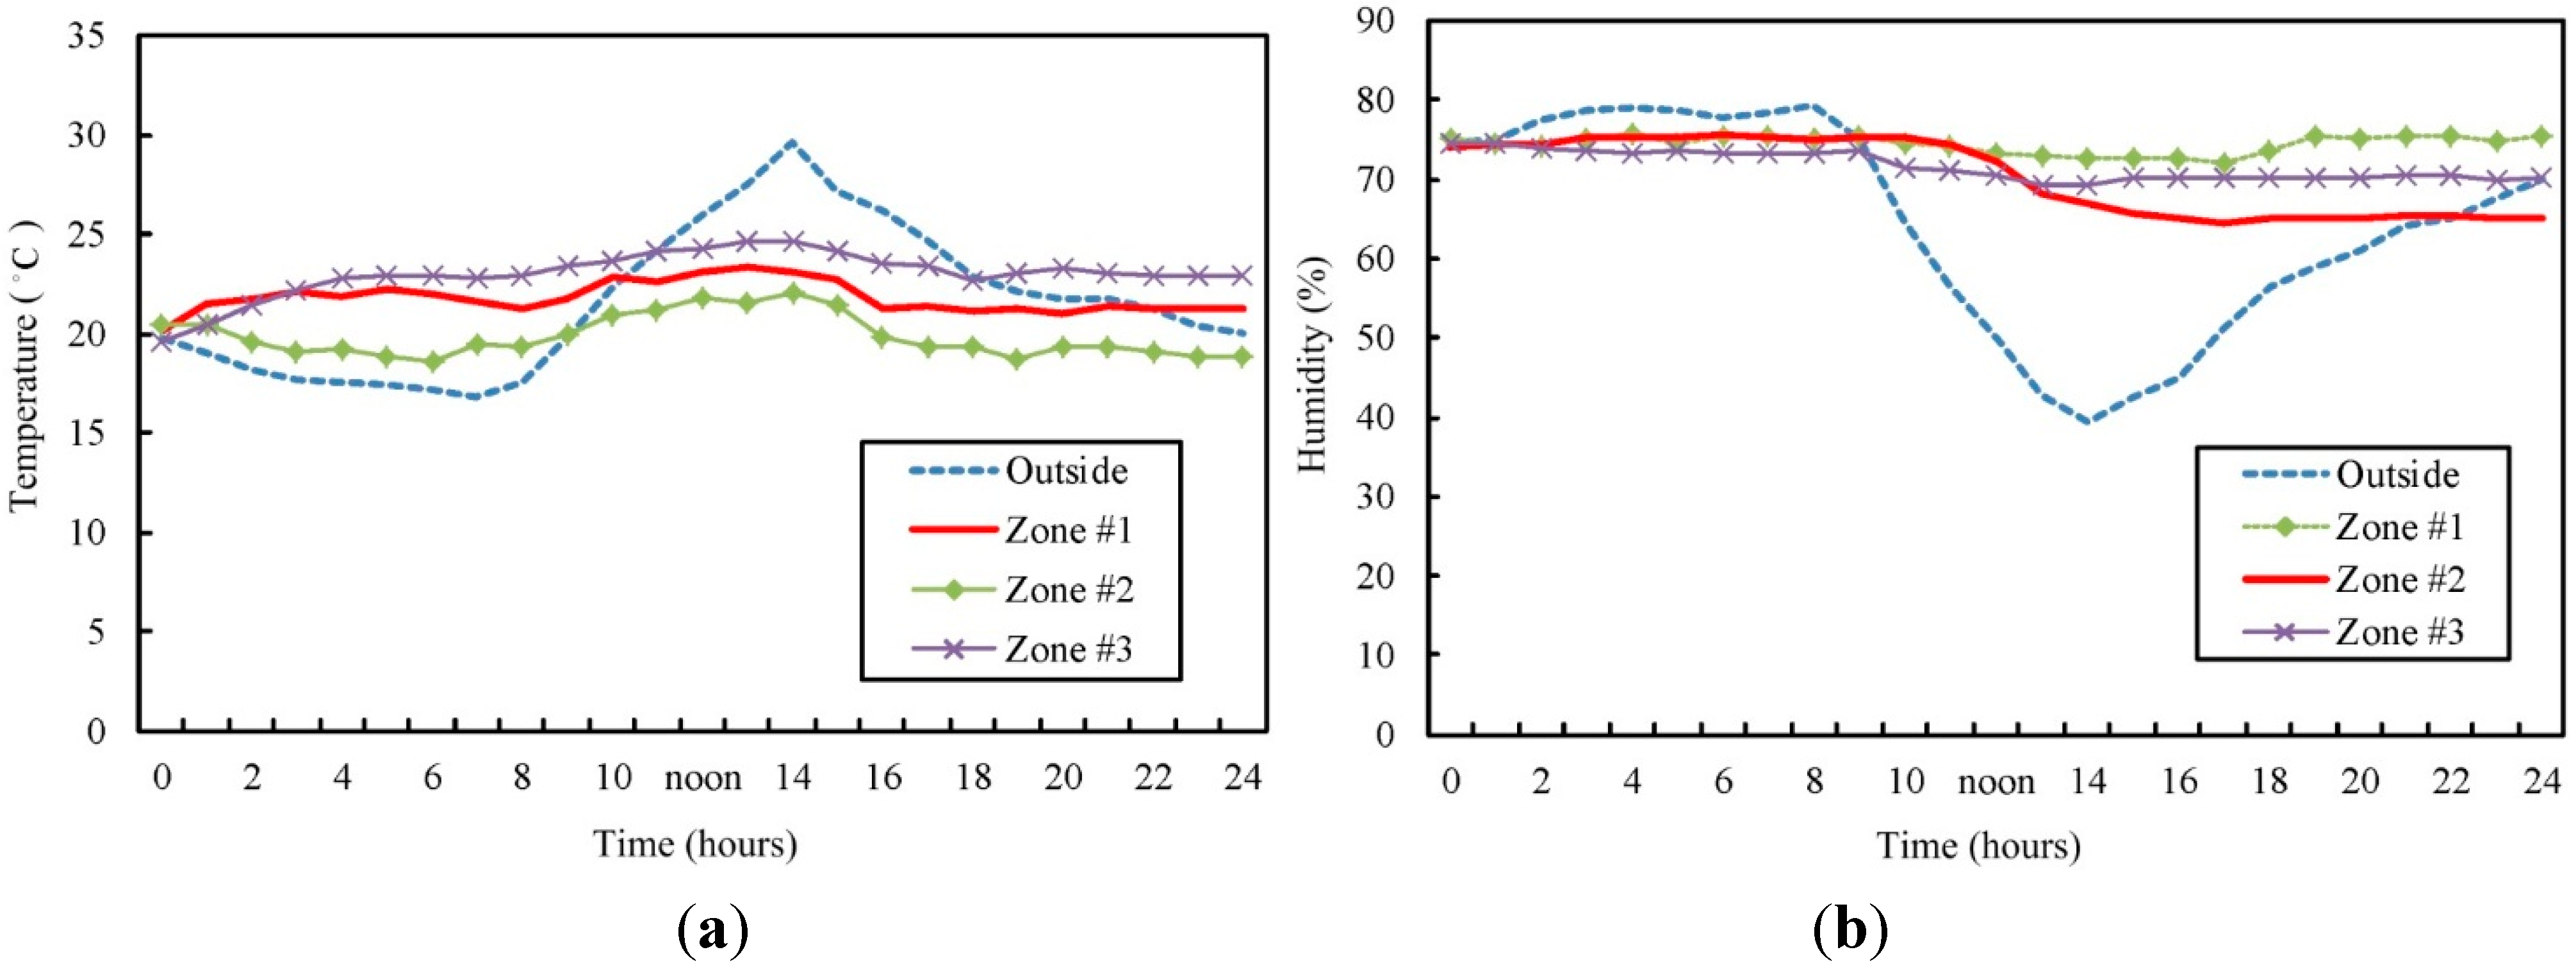
4.1. Culture Conditions
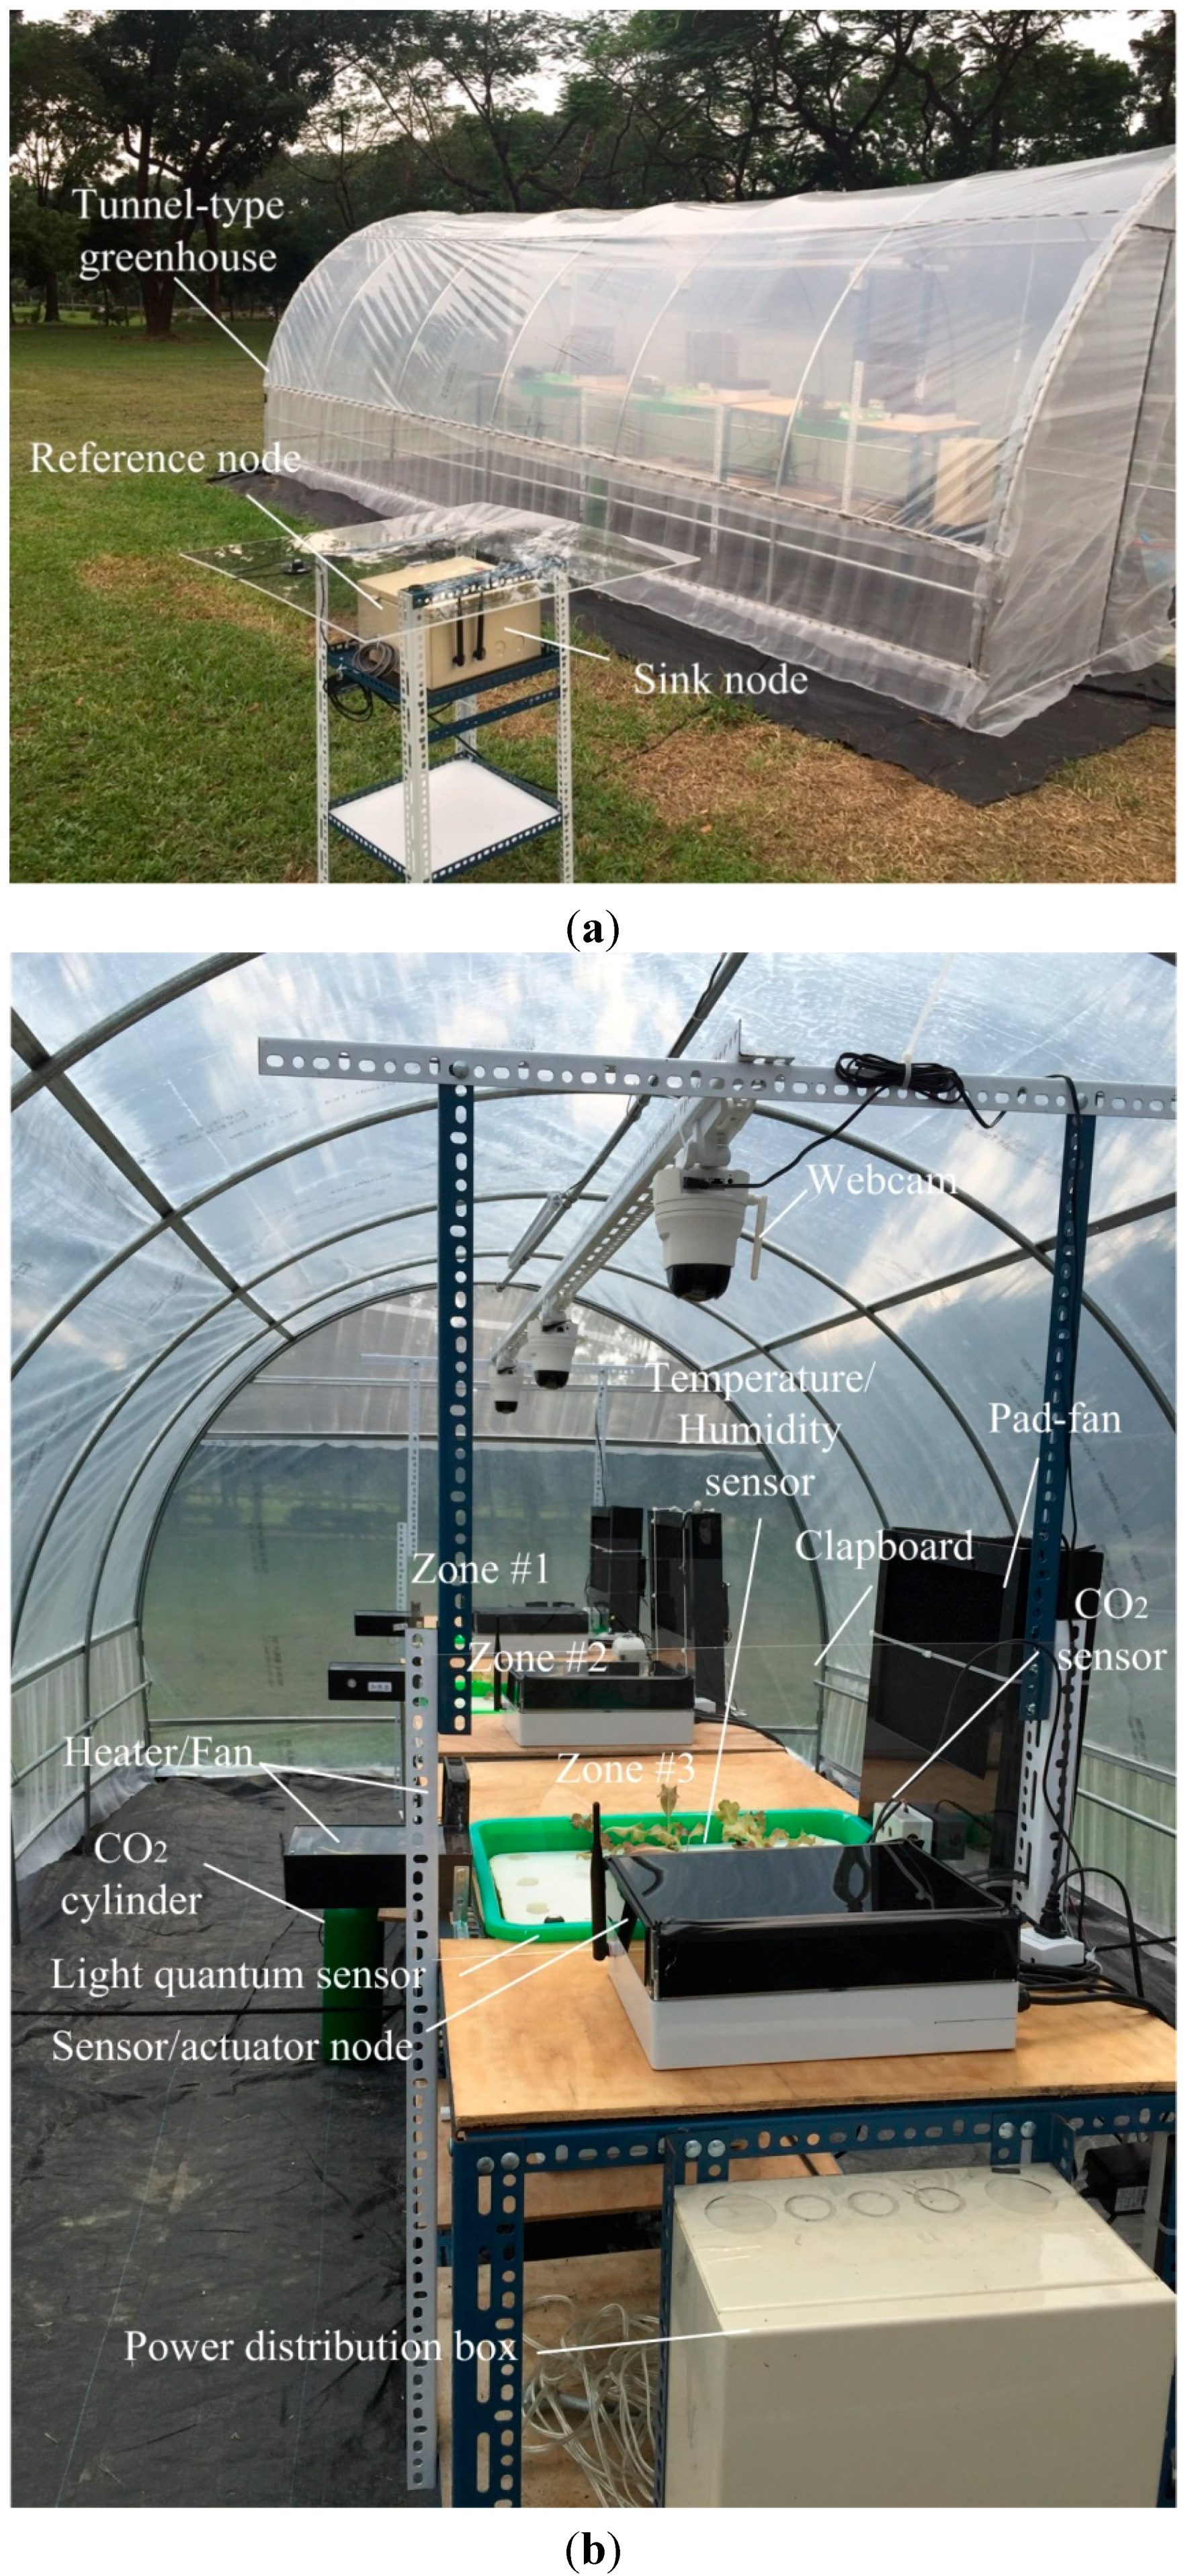
4.2. Experimental Setup

| Stage | Zone #1 | Zone #2 | Zone #3 | |
|---|---|---|---|---|
| Parameters | ||||
| Temperature | Preset () | 21.2 °C | 19.5 °C | 23 °C |
| Target () | 21 °C | 19 °C | 23 °C | |
| Range | [20, 22] | [18, 20] | [22, 24] | |
| Humidity | Preset () | 80% | 70% | 75% |
| Target () | 75% | 65% | 70% | |
| Range | [72, 80] | [62, 70] | [67, 75] |


| Parameters | Zone #1 | Zone #2 | Zone #3 | Uncontrolled Zone |
|---|---|---|---|---|
| Height of plant (cm) | 24.9 ± 0.9 | 24.4 ± 1.4 | 24.1 ± 1.1 | 23.1 ± 0.8 |
| Number of leaves | 12 ± 1 | 12 ± 1 | 12 ± 1 | 11 ± 1 |
| Shoot dry mass (g/plant) | 3.8 ± 0.2 | 3.8 ± 0.6 | 3.8 ± 0.3 | 3.2 ± 0.5 |
| Shoot fresh mass (g/plant) | 30.1 ± 1.3 | 30.2 ± 1.5 | 30.2 ± 1.2 | 24.2 ± 1.5 |
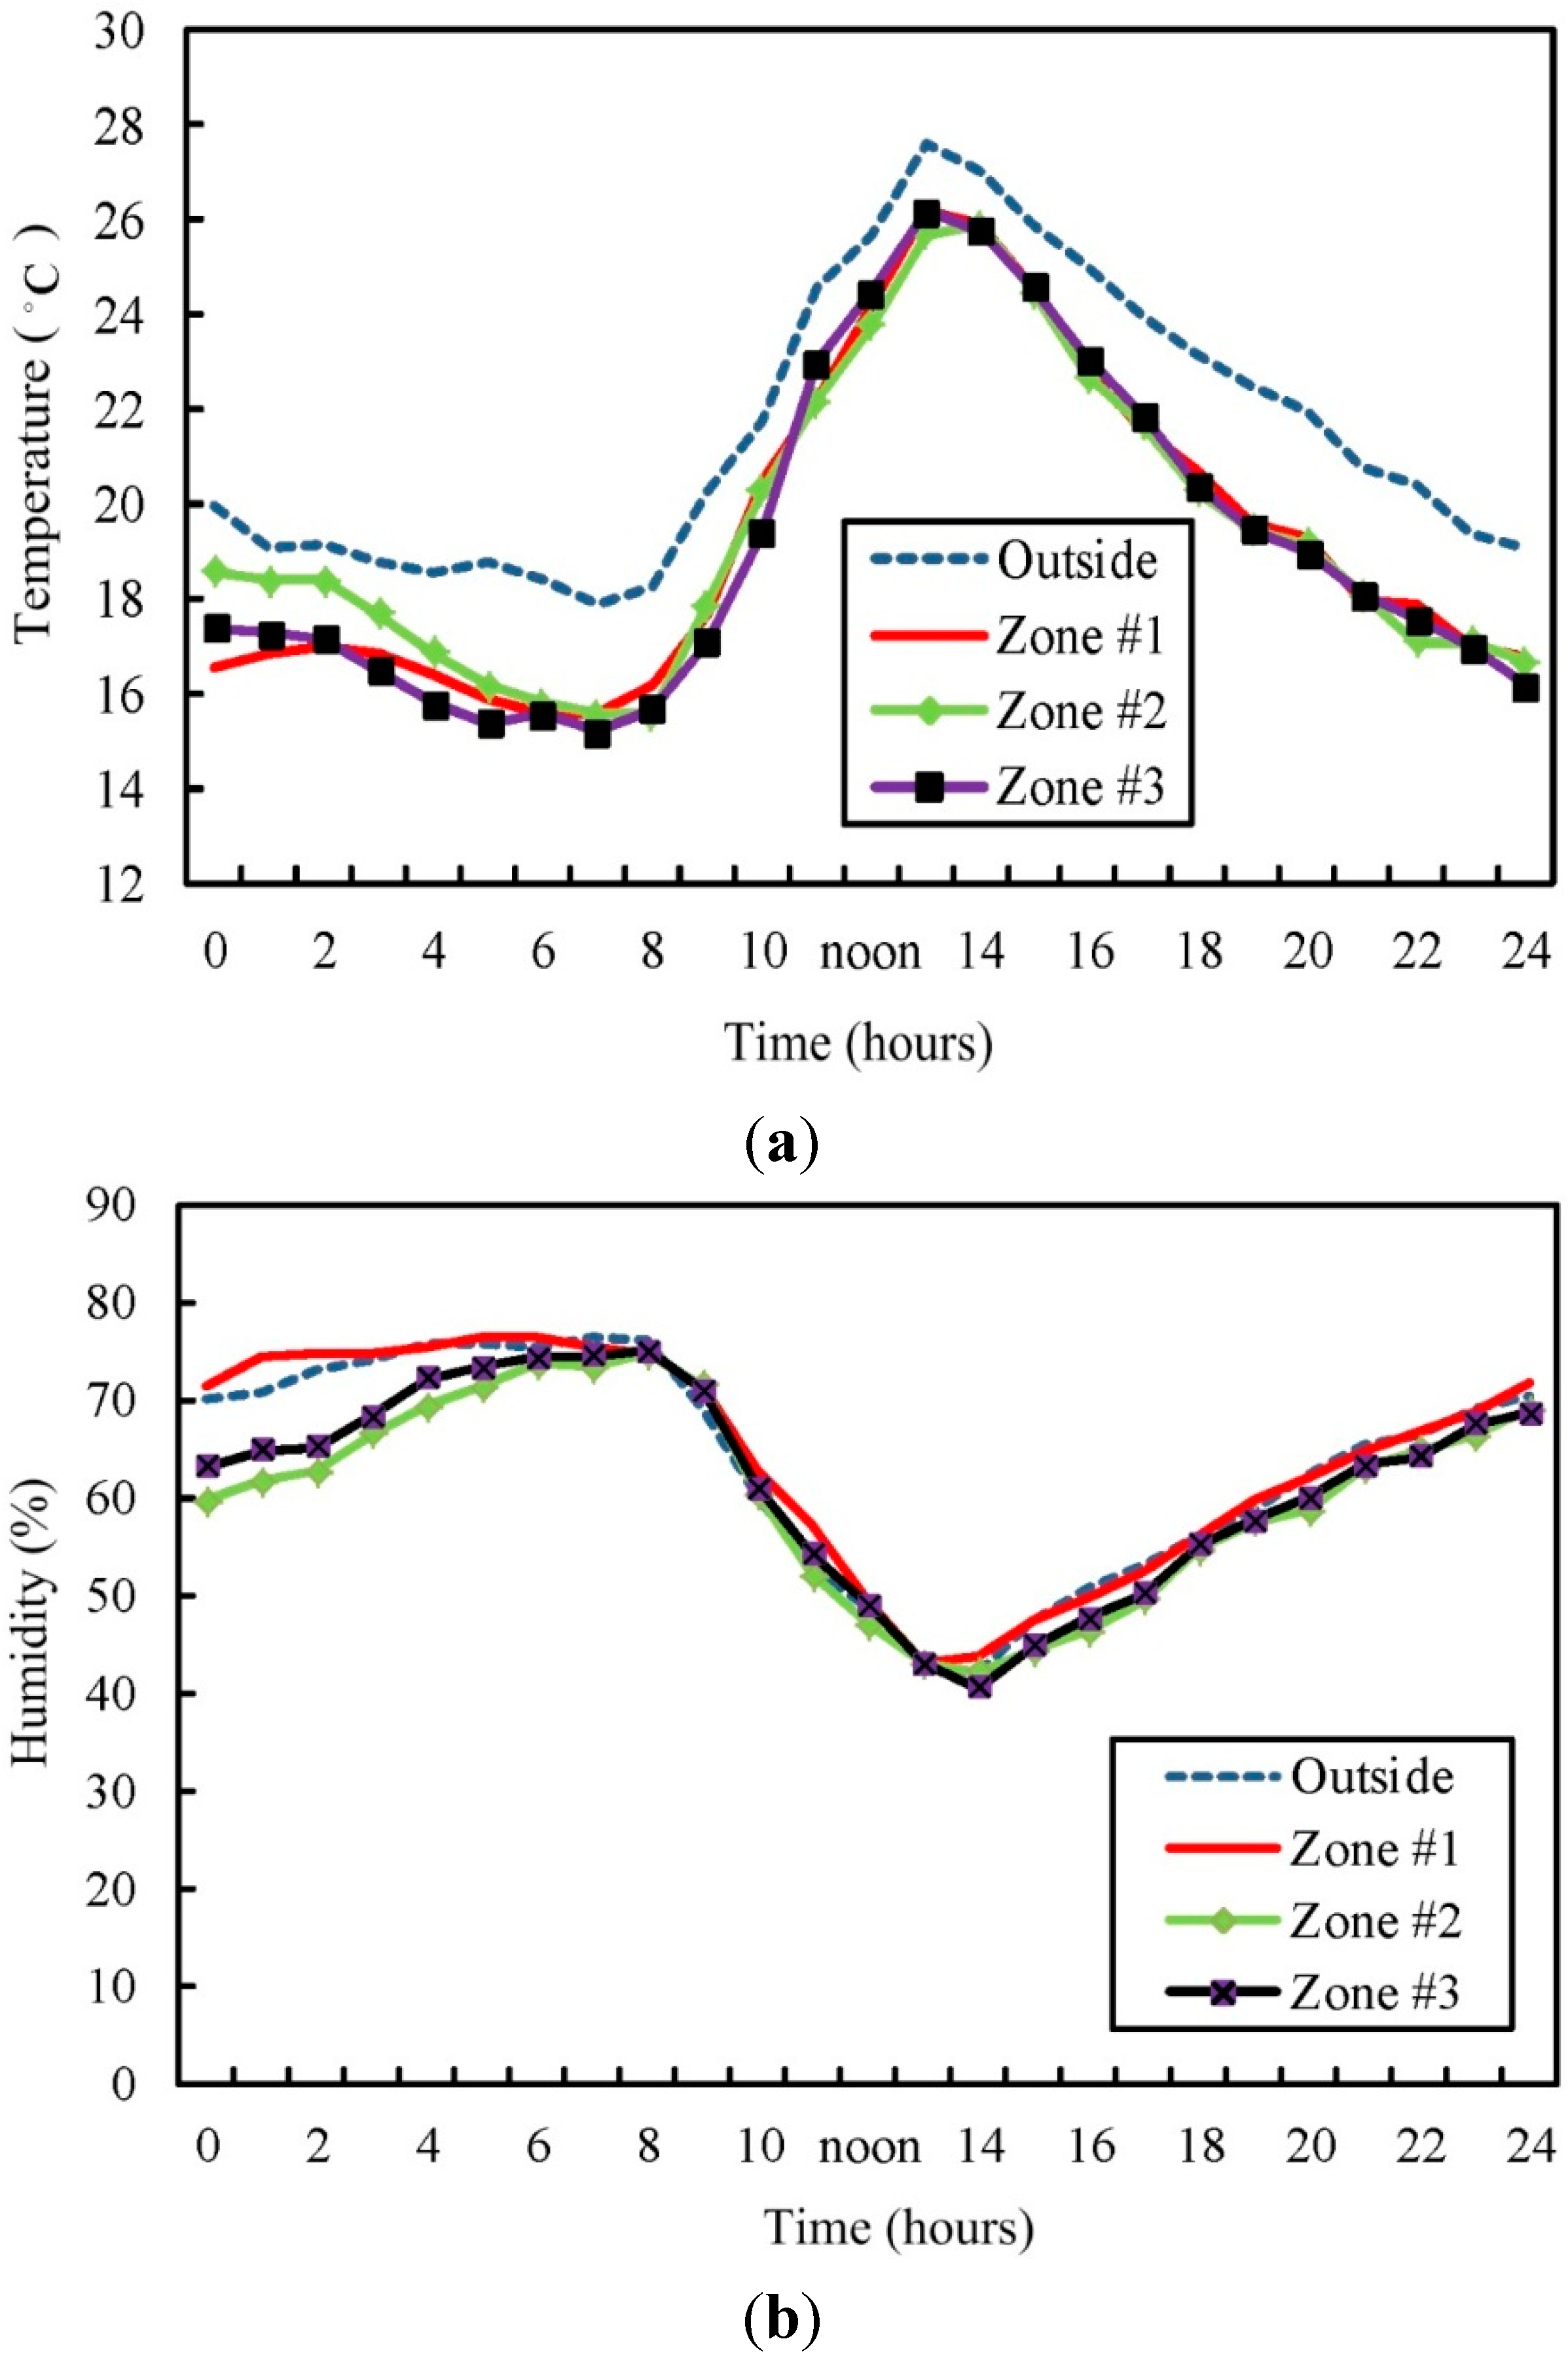
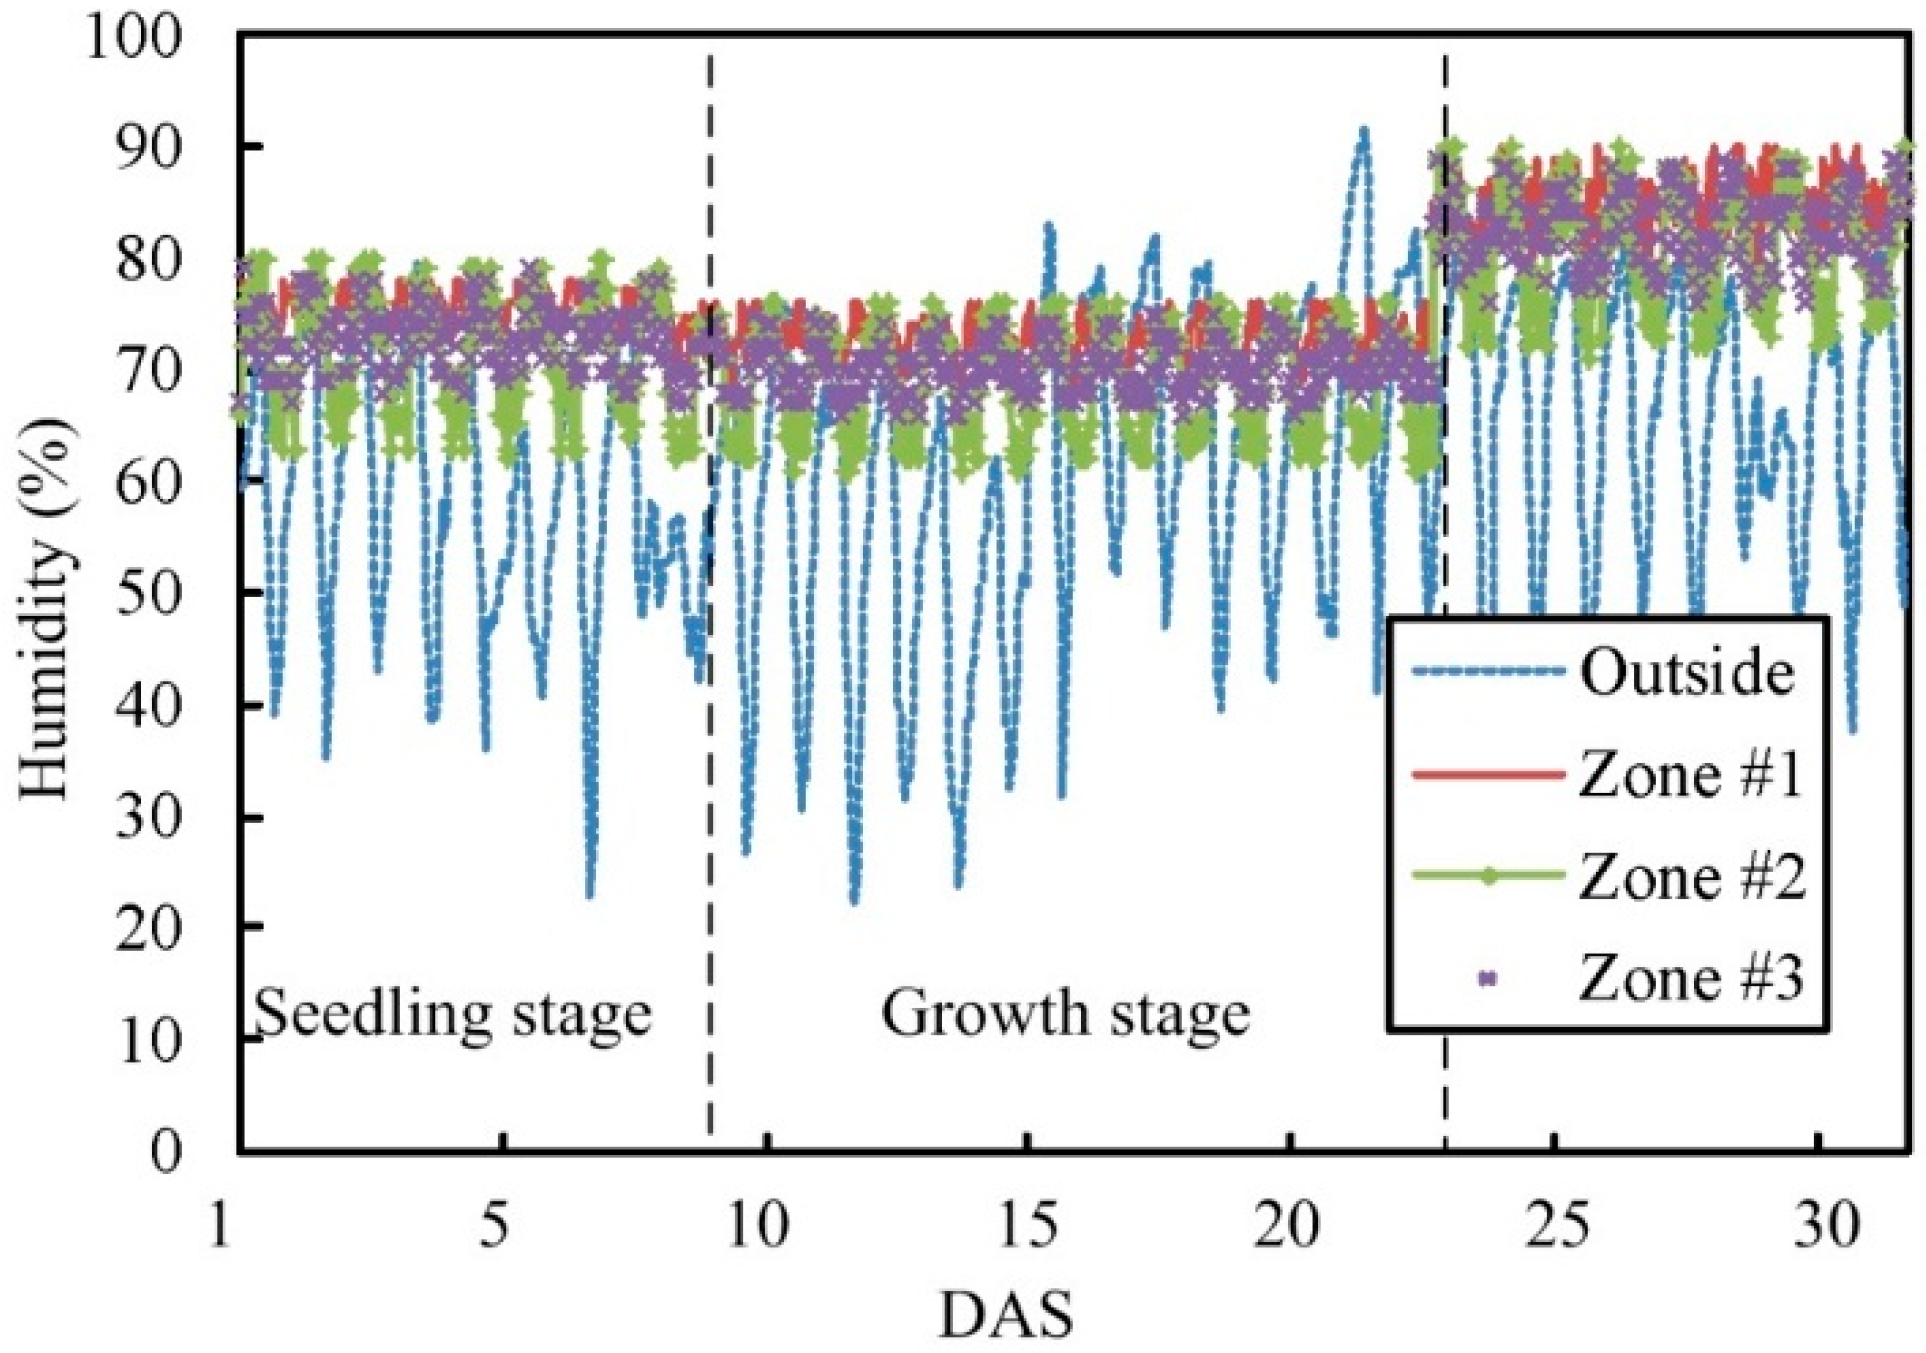
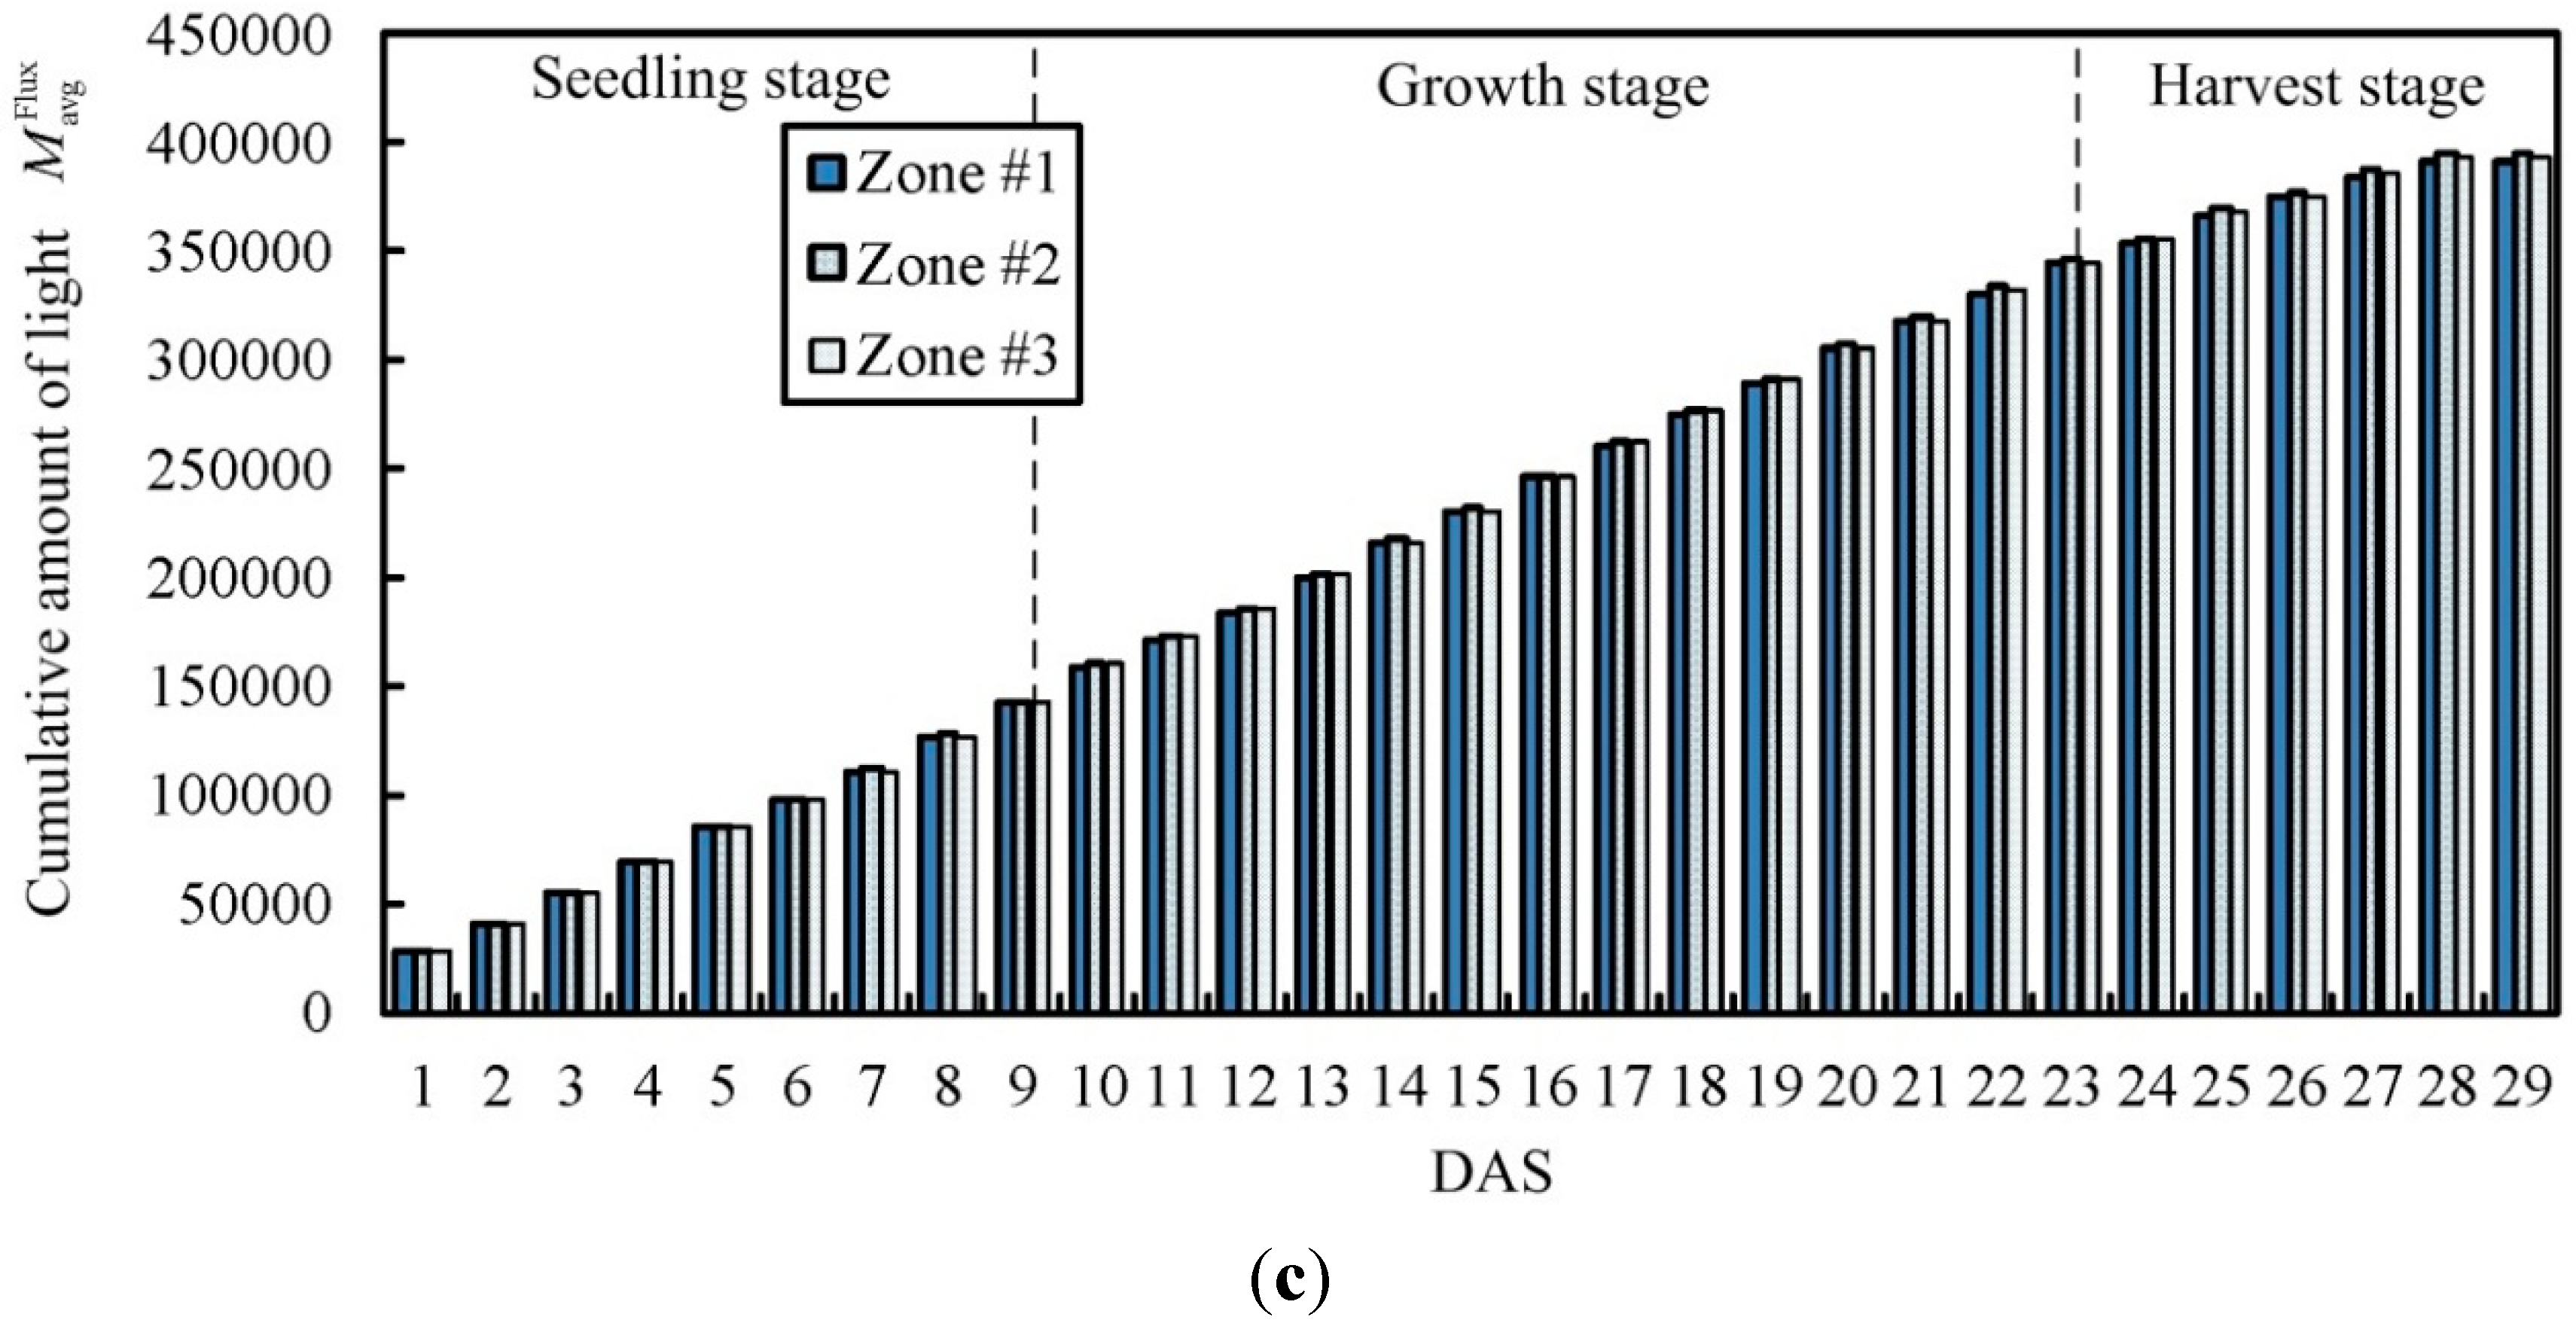
4.3. Discussion
5. Conclusions
Acknowledgments
Author Contributions
Conflicts of Interest
References
- Ottoson, J.R.; Nyberg, K.; Lindqvist, R.; Albihn, A. Quantitative microbial risk assessment for Escherichia coli O157 on lettuce, based on survival data from controlled studies in a climate chamber. J. Food Protect. 2011, 74, 2000–2007. [Google Scholar] [CrossRef] [PubMed]
- Webb, S.E.; Hochmuth, R.C. Vegetable Insect Identification and Management-Florida Greenhouse Vegetable Production Handbook. Available online: https://edis.ifas.ufl.edu/cv274 (accessed on 1 March 2015).
- Holvoet, K.; Sampers, I.; Seynnaeve, M.; Jacxsens, L.; Uyttendaele, M. Agricultural and management practices and bacterial contamination in greenhouse versus open field lettuce production. Int. J. Environ. Res. Public Health 2015, 12, 32–63. [Google Scholar] [CrossRef] [PubMed]
- Heidemann, J.; Govindan, R. Embedded Sensor Networks. In Handbook of Networked and Embedded Control Systems; Levine, B., Hristu, D., Eds.; Birkauser: Basel, Switzerland, 2005. [Google Scholar]
- Zhang, Q.; Yang, X.L.; Zhou, Y.M.; Wang, L.R.; Guo, X.S. A wireless solution for greenhouse monitoring and control system based on ZigBee technology. J. Zhejiang Univ. Sci. A 2007, 8, 1584–1587. [Google Scholar] [CrossRef]
- Candido, A.; Cicirelli, F.; Furfaro, A.; Nigro, L. Embedded real-time system for climate control in a complex greenhouse. Int. Agrophys. 2007, 21, 17–27. [Google Scholar]
- Yunseop, K.; Evans, R.G.; Iversen, W.M. Remote sensing and control of an irrigation system using a distributed wireless sensor network. IEEE Trans. Instrum. Meas. 2008, 57, 1379–1387. [Google Scholar] [CrossRef]
- Speetjens, S.L.; Janssen, H.J.J.; van Straten, G.; Gieling, T.H.; Stigter, J.D. Methodic design of a measurement and control system for climate control in horticulture. Comput. Electron. Agric. 2008, 64, 162–172. [Google Scholar] [CrossRef]
- Pawlowski, A.; Guzman, J.L.; Rodriguez, F.; Berenguel, M.; Sanchez, J.; Dormido, S. Simulation of greenhouse climate monitoring and control with wireless sensor network and event-based control. Sensors 2009, 9, 232–252. [Google Scholar] [CrossRef] [PubMed]
- Park, D.H.; Park, J.W. Wireless sensor network-based greenhouse environment monitoring and automatic control system for dew condensation prevention. Sensors 2011, 11, 3640–3651. [Google Scholar] [CrossRef] [PubMed]
- Coates, R.W.; Delwiche, M.J.; Broad, A.; Holler, M. Wireless sensor network with irrigation valve control. Comput. Electron. Agric. 2013, 96, 13–22. [Google Scholar] [CrossRef]
- Ahonen, T.; Virrankoski, R.; Elmusrati, M. Greenhouse monitoring with wireless sensor network. In Proceedings of the IEEE/ASME International Conference on Mechatronic and Embedded Systems and Applications, Beijing, China, 12–15 October 2008; pp. 403–408.
- Fitch, M.; Nekovee, M.; Kawade, S.; Briggs, K.; MacKenzie, R. Wireless services provision in TV white space with cognitive radio technology: A telecom operators perspective and experience. IEEE Commun. 2011, 49, 64–73. [Google Scholar] [CrossRef]
- Chang, C.L.; Hong, G.F.; Li, Y.L. A supplementary lighting and regulatory scheme using a multi-wavelength LED module for greenhouse application. Light. Res. Technol. 2014, 46, 548–566. [Google Scholar] [CrossRef]
- Paek, J.; Hicks, J.; Coe, S.; Govindan, R. Image-based environmental monitoring sensor application using an embedded wireless sensor network. Sensors 2014, 14, 15981–16002. [Google Scholar] [CrossRef] [PubMed]
- Ferreira, P.M.; Fariab, E.A.; Ruano, A.E. Neural network models in greenhouse air temperature prediction. Neuro Comput. 2002, 43, 51–75. [Google Scholar] [CrossRef]
- El Ghoumari, M.Y.; Tantau, H.J.; Serrano, J. Non-linear constrained MPC: Real-time implementation of greenhouse air temperature control. Comput. Electron. Agric. 2005, 49, 345–356. [Google Scholar] [CrossRef]
- Teitel, M.; Atias, M.; Barak, M. Gradients of temperature, humidity and CO2 along a fan ventilated greenhouse. Biosyst. Eng. 2010, 106, 166–174. [Google Scholar] [CrossRef]
- Fitz-Rodriguez, E.; Kubota, C.; Giacomelli, G.A.; Tignor, M.E.; Wilson, S.B. Dynamic modeling and simulation of greenhouse environments under several scenarios: A web-based application. Comput. Electron. Agric. 2010, 70, 105–116. [Google Scholar] [CrossRef]
- Park, D.H.; Kang, B.J.; Cho, K.R. A study on greenhouse automatic control system based on wireless sensor network. Wirel. Pers. Commun. 2011, 56, 117–130. [Google Scholar] [CrossRef]
- Chen, F.; Tang, Y.N.; Shen, M.Y. Coordination control of greenhouse environmental factor. Int. J. Autom. Comput. 2011, 8, 147–153. [Google Scholar] [CrossRef]
- Chang, C.L.; Sie, M.F. A multistaged fuzzy logic scheme in a biobotanic growth regulation system. HortScience 2012, 47, 762–770. [Google Scholar]
- Chao, K.; Gates, R.S.; Sigrimis, N.A. Fuzzy logic controller design for staged heating and ventilating systems. Trans. ASAE 2000, 43, 1885–1894. [Google Scholar] [CrossRef]
- Wang, L.X. Generating fuzzy rules by learning from examples. IEEE Trans. Syst. Man Cybern. 1992, 22, 1414–1427. [Google Scholar] [CrossRef]
- Herrera, F.; Lozano, M.; Verdegay, J.L. Tuning fuzzy logic controllers by genetic algorithms. Int. J. Approx. Reason. 1995, 12, 299–315. [Google Scholar] [CrossRef]
- Dai, X.; Li, C.K.; Rad, A.B. An approach to tune fuzzy controllers based on reinforcement learning for autonomous vehicle control. IEEE Trans. Intell. Transp. Syst. 2005, 6, 285–293. [Google Scholar] [CrossRef]
- Kaelbling, L.P.; Littman, M.L.; Moore, A.P. Reinforcement learning: A survey. J. Artif. Intell. Res. 1996, 4, 237–285. [Google Scholar]
- Desouky, S.F.; Schwartz, H.M. Q(λ)-learning adaptive fuzzy logic controllers for pursuit–evasion differential games. Int. J. Adapt. Control Signal Process. 2011, 25, 910–927. [Google Scholar] [CrossRef]
- Xing, F.; Tian, Y.C.; Li, Y.; Sung, Y. Wireless sensor/actuator network design for mobile control applications. Sensors 2007, 7, 2157–2173. [Google Scholar] [CrossRef]
- Lin, S.; Zhou, G.; Whitehouse, K.; Wu, Y. Towards stable network performance in wireless sensor networks. In Proceedings of the 30th IEEE Real-Time Systems Symposium, Washington, DC, USA, 1–4 December 2009; pp. 227–237.
- Chao, K.; Gates, R.S. Design of switching control systems for ventilated greenhouses. Trans. ASAE 1996, 39, 1513–1523. [Google Scholar] [CrossRef]
- Lees, M.J.; Taylor, J.; Chotai, A.; Young, P.C.; Chalabi, Z.S. Design and implementation of a proportional-integral-plus (PIP) control system for temperature, humidity and carbon dioxide in a glasshouse. Acta Hort. 1996, 406, 115–123. [Google Scholar] [CrossRef]
- Marks, R.J., II. Fuzzy logic technology and applications, 2nd ed.; IEEE Press: New York, NY, USA, 1994; pp. 19–24. [Google Scholar]
- Andriolo, J.L.; da Luz, G.L.; Witter, M.H.; Godoi1, R.D.S.; Barros, G.T.; Bortolotto, O.C. Growth and yield of lettuce plants under salinity. Hortic. Bras. 2005, 23, 931–934. [Google Scholar] [CrossRef]
- Linker, R.; Gutman, P.O.; Seginer, I. Robust controllers for simultaneous control of temperature and CO2 concentration in greenhouses. Control Eng. Pract. 1999, 7, 851–862. [Google Scholar] [CrossRef]
- Korner, O. Evaluation of crop photosynthesis models for dynamic climate control. Acta Hort. 2004, 654, 295–302. [Google Scholar] [CrossRef]
- Korner, O.; Aaslyng, J.M.; Andreassen, A.U.; Holst, N. Microclimate prediction for dynamic greenhouse climate control. HortScience 2007, 42, 272–279. [Google Scholar]
- Aosong (Guangzhou) Electronics Co., Ltd. AM2303 Datasheet, 2014. Available online: https://www.adafruit.com/datasheets/DHT22.pdf (accessed on 30 May 2015).
- Zhengzhou Winsen Electronics Technology CO., Ltd. MH-Z14 CO2 Module Datasheet, 2013. Available online: http://www.futurlec.com/Datasheet/Sensor/MH-Z14.pdf (accessed on 29 May 2015).
- Spectrum Technologies. Lightscout 3668I, 2014. Available online: http://www.specmeters.com/weather-monitoring/sensors-and-accessories/sensors/light-sensors/lightscout-quantum-light-sensor-3668i/ (accessed on 15 April 2015).
- XBee-PRO® 900 HP Datasheet, Digi International Inc. Available online: http://www.digi.com/pdf/ds_xbeepro900hp.pdf (accessed on 14 September 2015).
- T&D Corporation. TR-74Ui Datasheet, 2012. Available online: http://www.tandd.com/product/tr74ui/option.html (accessed on 14 April 2015).
- Rassam, M.A.; Maarof, M.A.; Zainai, A. Adaptive and online data anomaly detection for wireless sensor system. Knowl.-Based Syst. 2014, 60, 44–57. [Google Scholar] [CrossRef]
- National Instruments Corporation. NI myRIO Datasheet, 2013. Available online: http://digital.ni.com/manuals.nsf/websearch/EE9557A29E63D0F986257BB8005700C5 (accessed on 1 April 2015).
- Roy Fisher, R.; Ledwaba, L.; Hancke, G.; Carel Kruger, C. Open hardware: A role to play in wireless sensor networks? Sensors 2015, 15, 6818–6844. [Google Scholar] [CrossRef] [PubMed]
© 2015 by the authors; licensee MDPI, Basel, Switzerland. This article is an open access article distributed under the terms and conditions of the Creative Commons Attribution license (http://creativecommons.org/licenses/by/4.0/).
Share and Cite
Chang, C.-L.; Huang, Y.-M.; Hong, G.-F. Using a Novel Wireless-Networked Decentralized Control Scheme under Unpredictable Environmental Conditions. Sensors 2015, 15, 28690-28716. https://doi.org/10.3390/s151128690
Chang C-L, Huang Y-M, Hong G-F. Using a Novel Wireless-Networked Decentralized Control Scheme under Unpredictable Environmental Conditions. Sensors. 2015; 15(11):28690-28716. https://doi.org/10.3390/s151128690
Chicago/Turabian StyleChang, Chung-Liang, Yi-Ming Huang, and Guo-Fong Hong. 2015. "Using a Novel Wireless-Networked Decentralized Control Scheme under Unpredictable Environmental Conditions" Sensors 15, no. 11: 28690-28716. https://doi.org/10.3390/s151128690
APA StyleChang, C.-L., Huang, Y.-M., & Hong, G.-F. (2015). Using a Novel Wireless-Networked Decentralized Control Scheme under Unpredictable Environmental Conditions. Sensors, 15(11), 28690-28716. https://doi.org/10.3390/s151128690