
Acetone Sensing Properties of a Gas Sensor Composed of Carbon Nanotubes Doped With Iron Oxide Nanopowder


Abstract
:1. Introduction
2. Experimental Section
2.1. Preparation of Gas Sensitive Materials
2.2. Fabrication of Gas Sensors

3. Results and Discussion
3.1. Materials Characterization
3.1.1. XRD Analysis

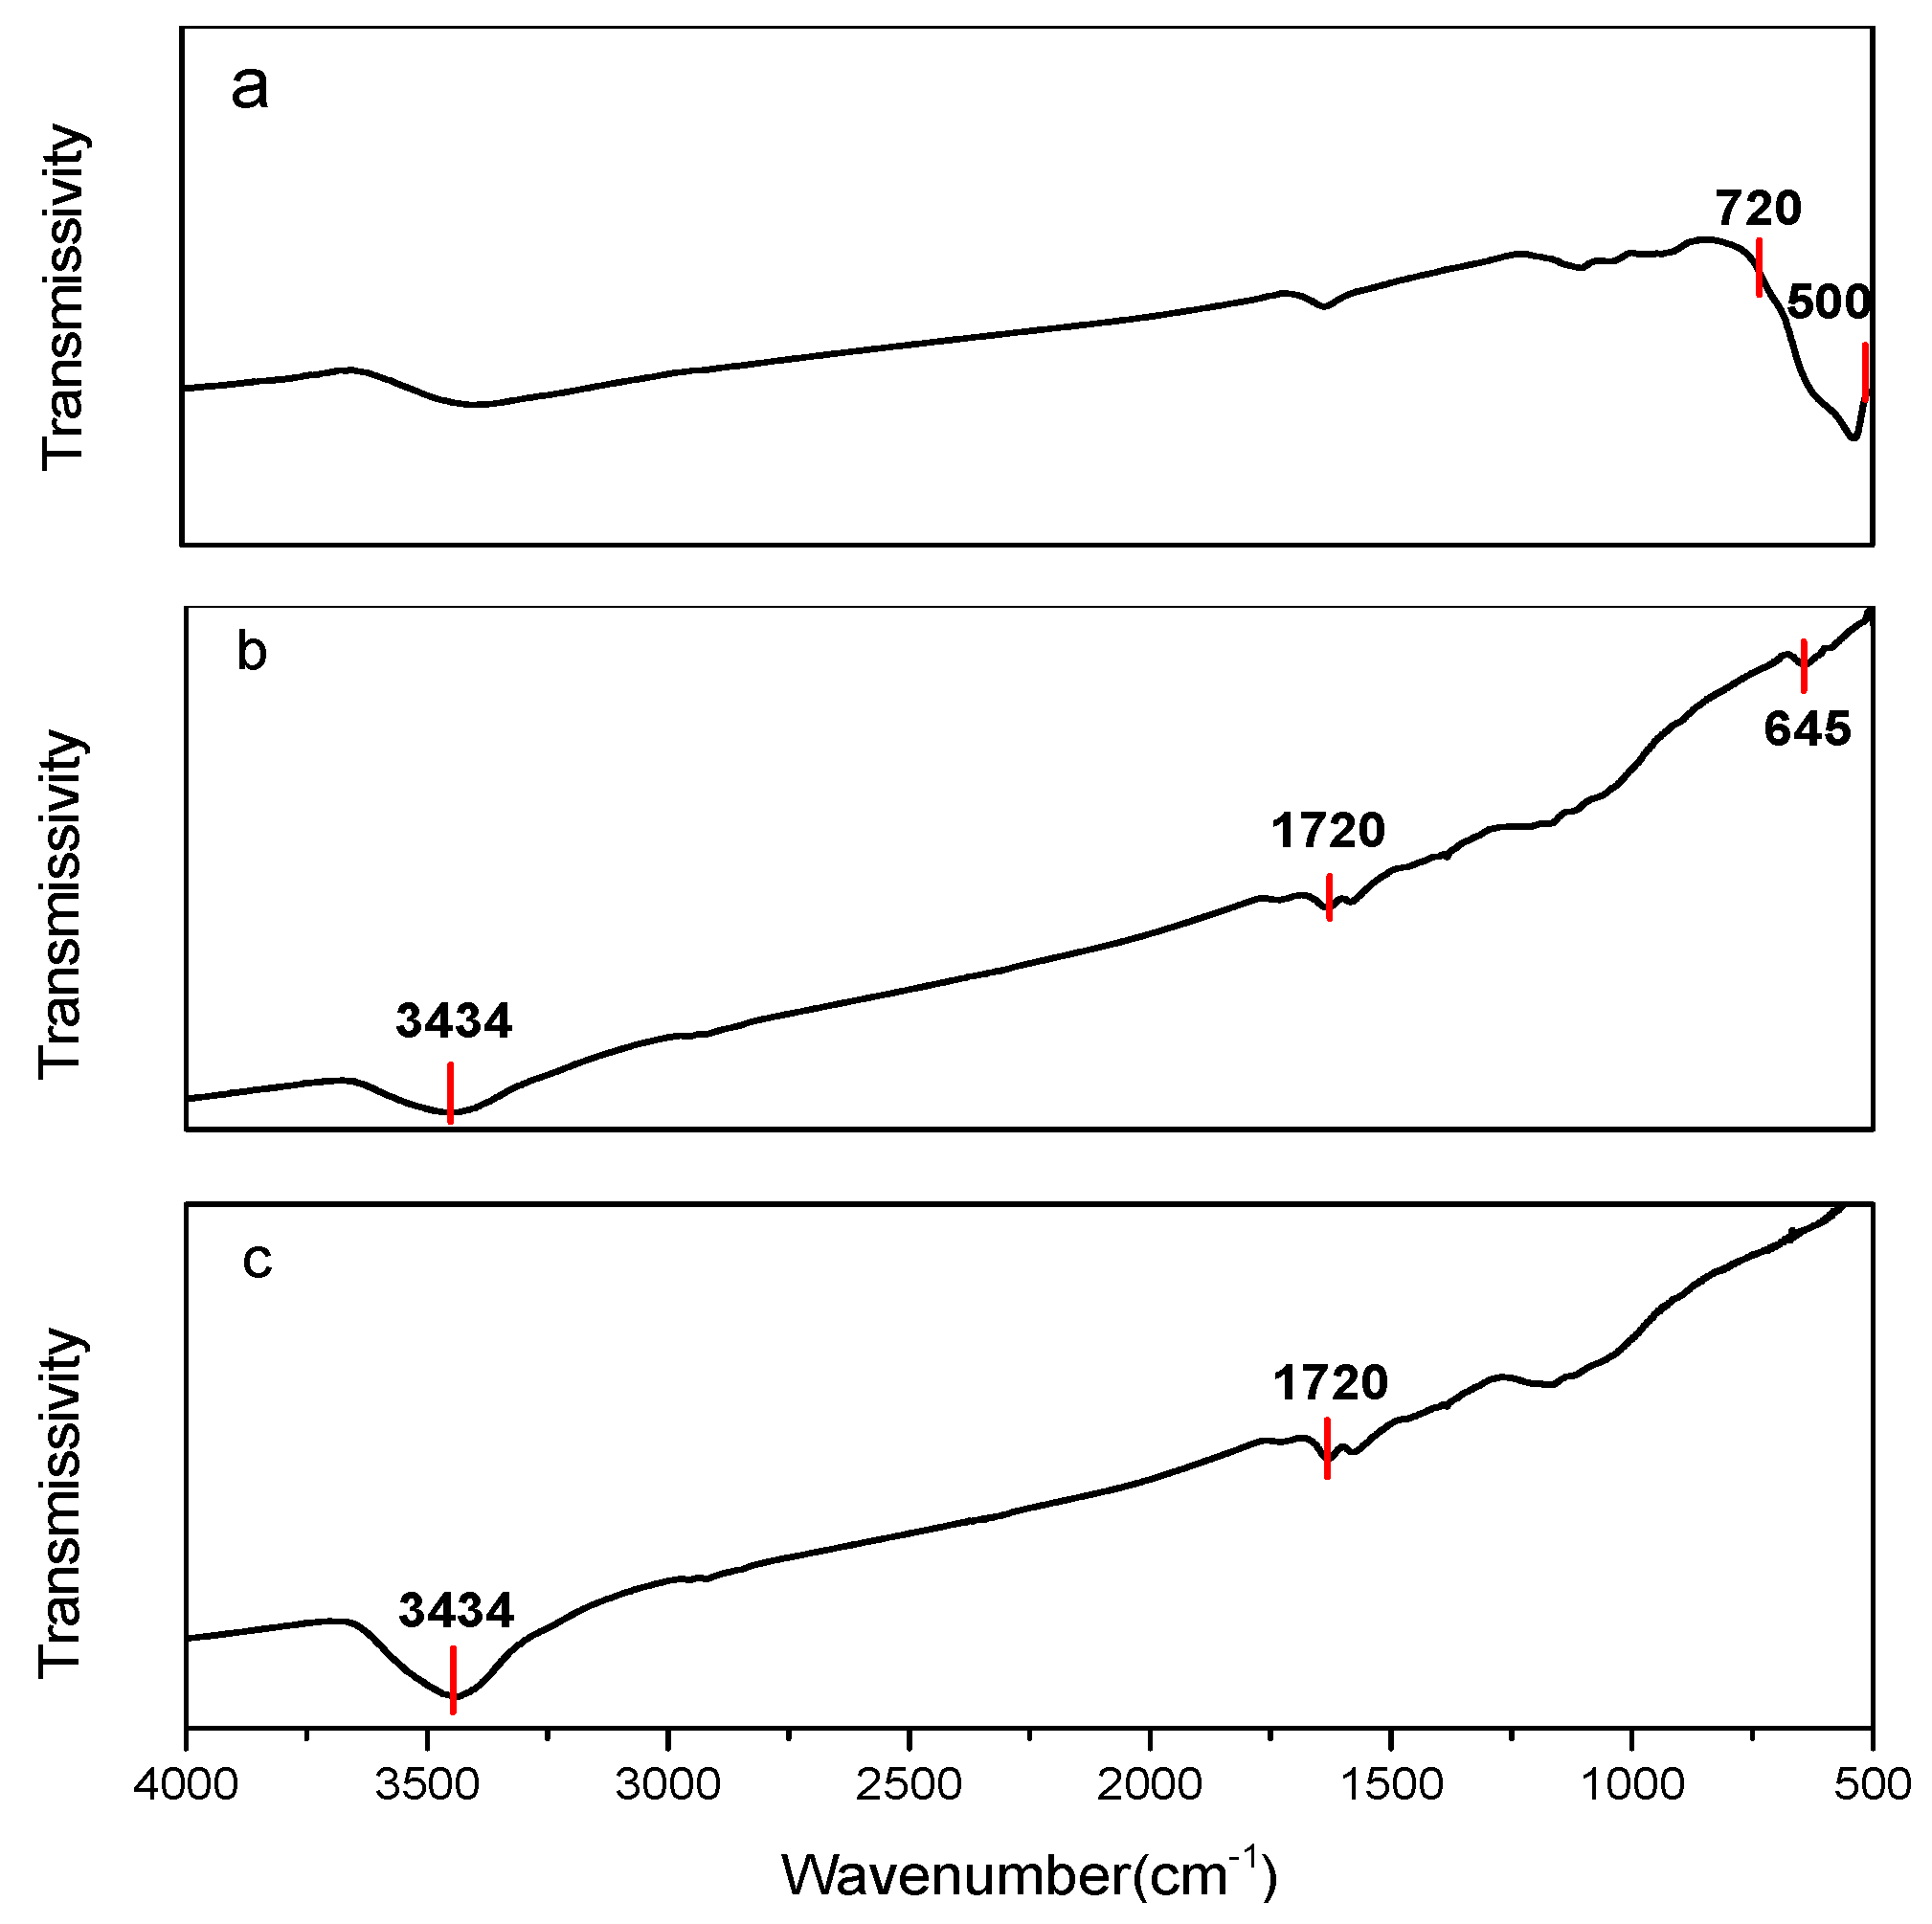
3.1.2. IR Analysis
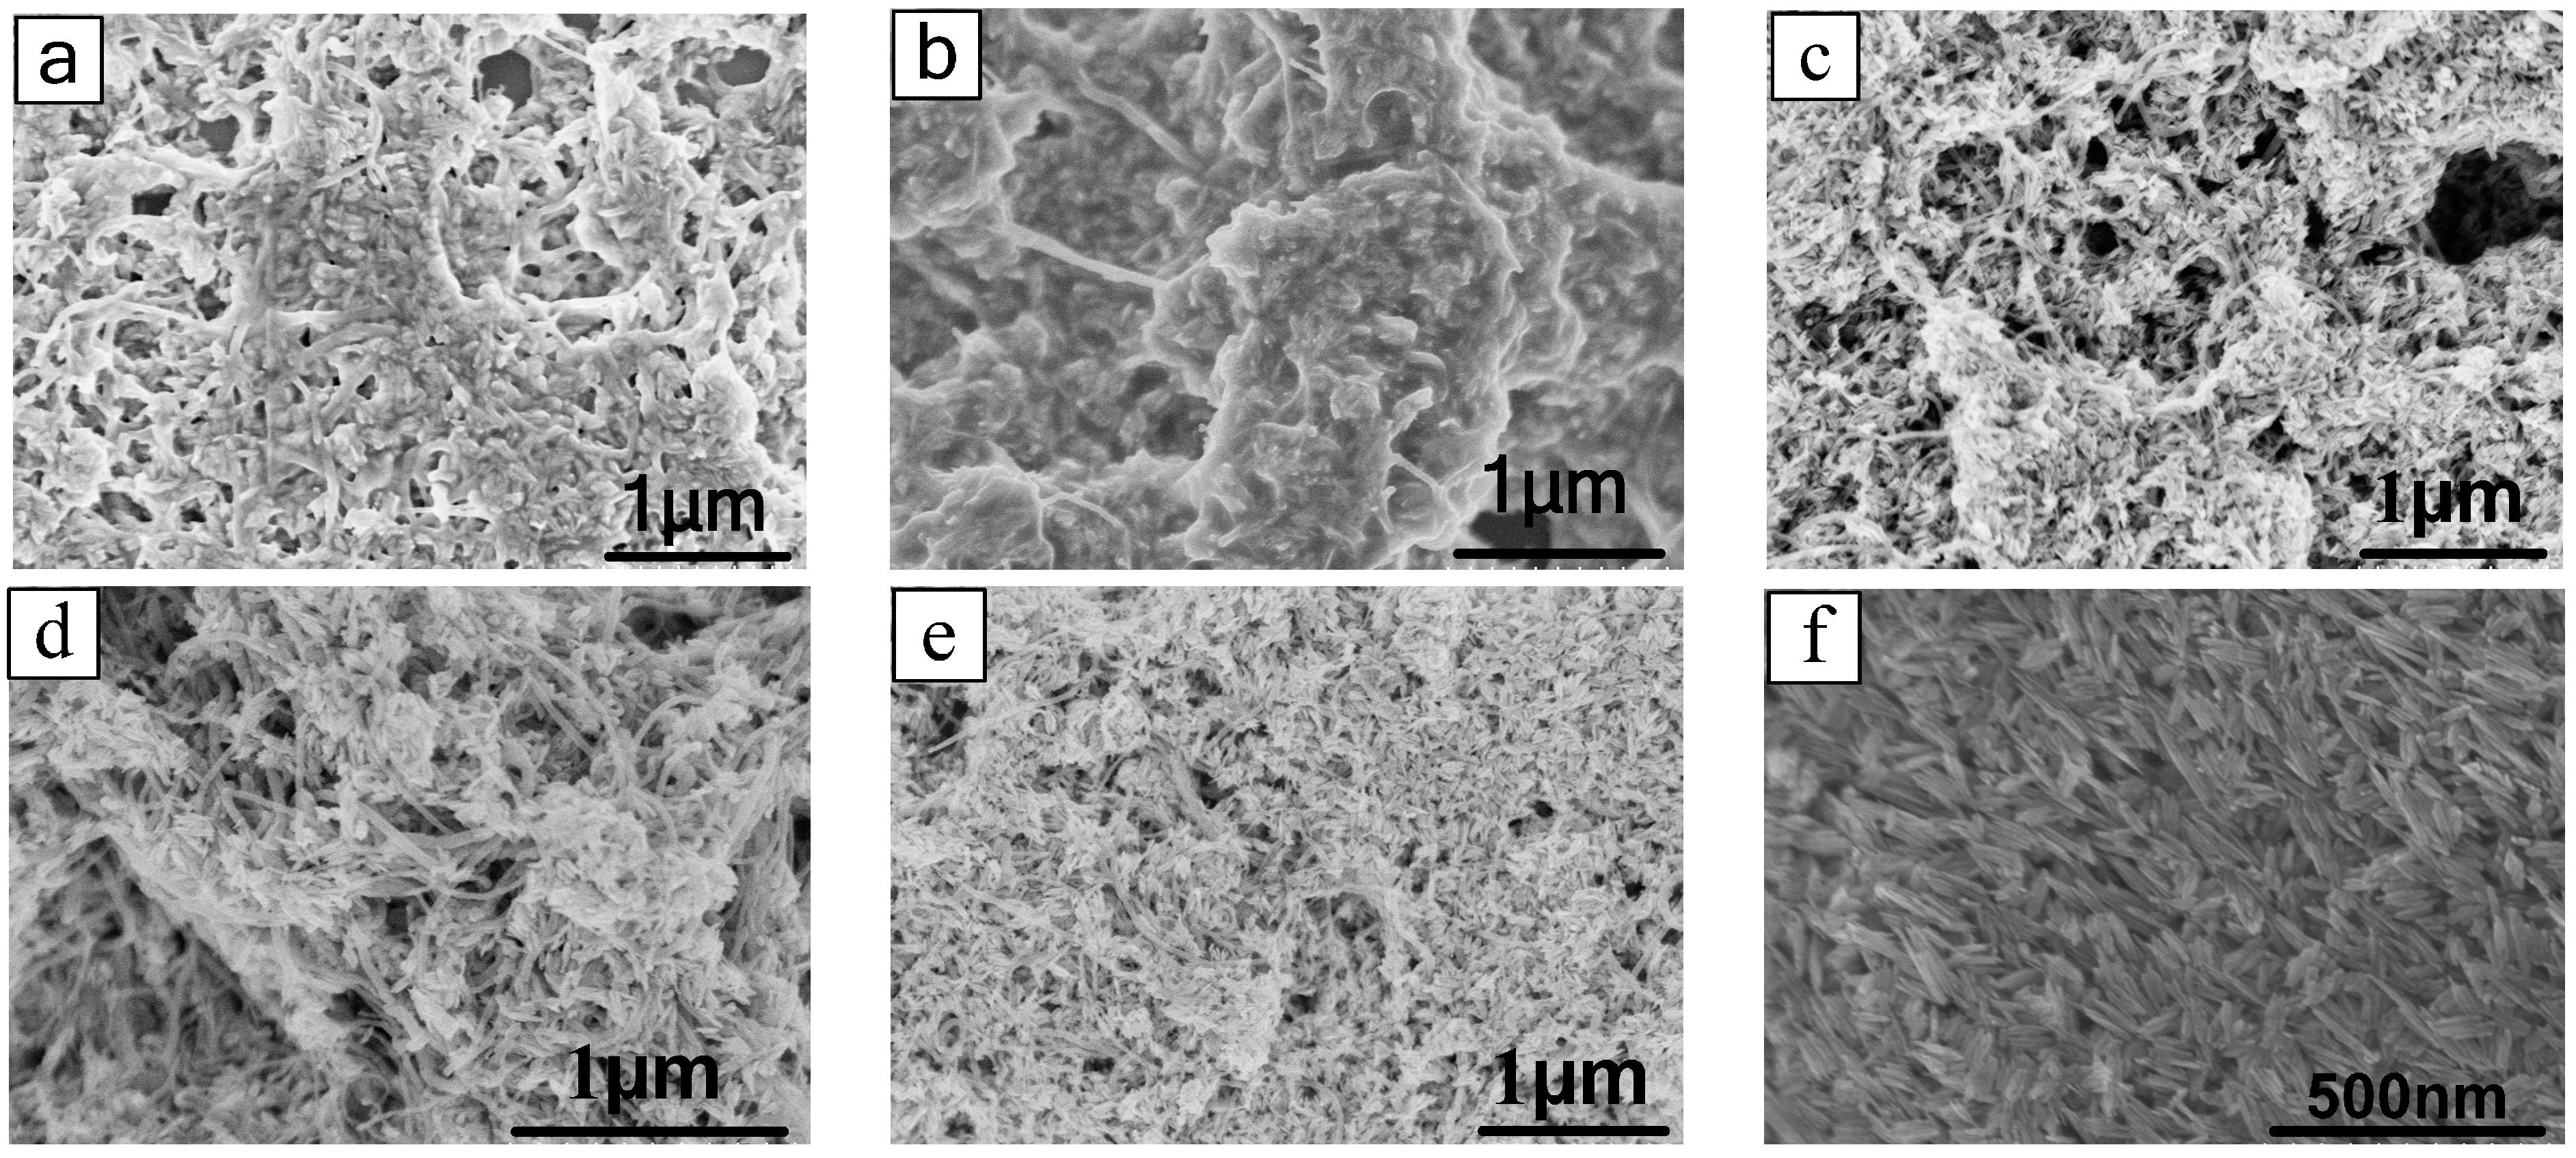
3.1.3. SEM Analysis
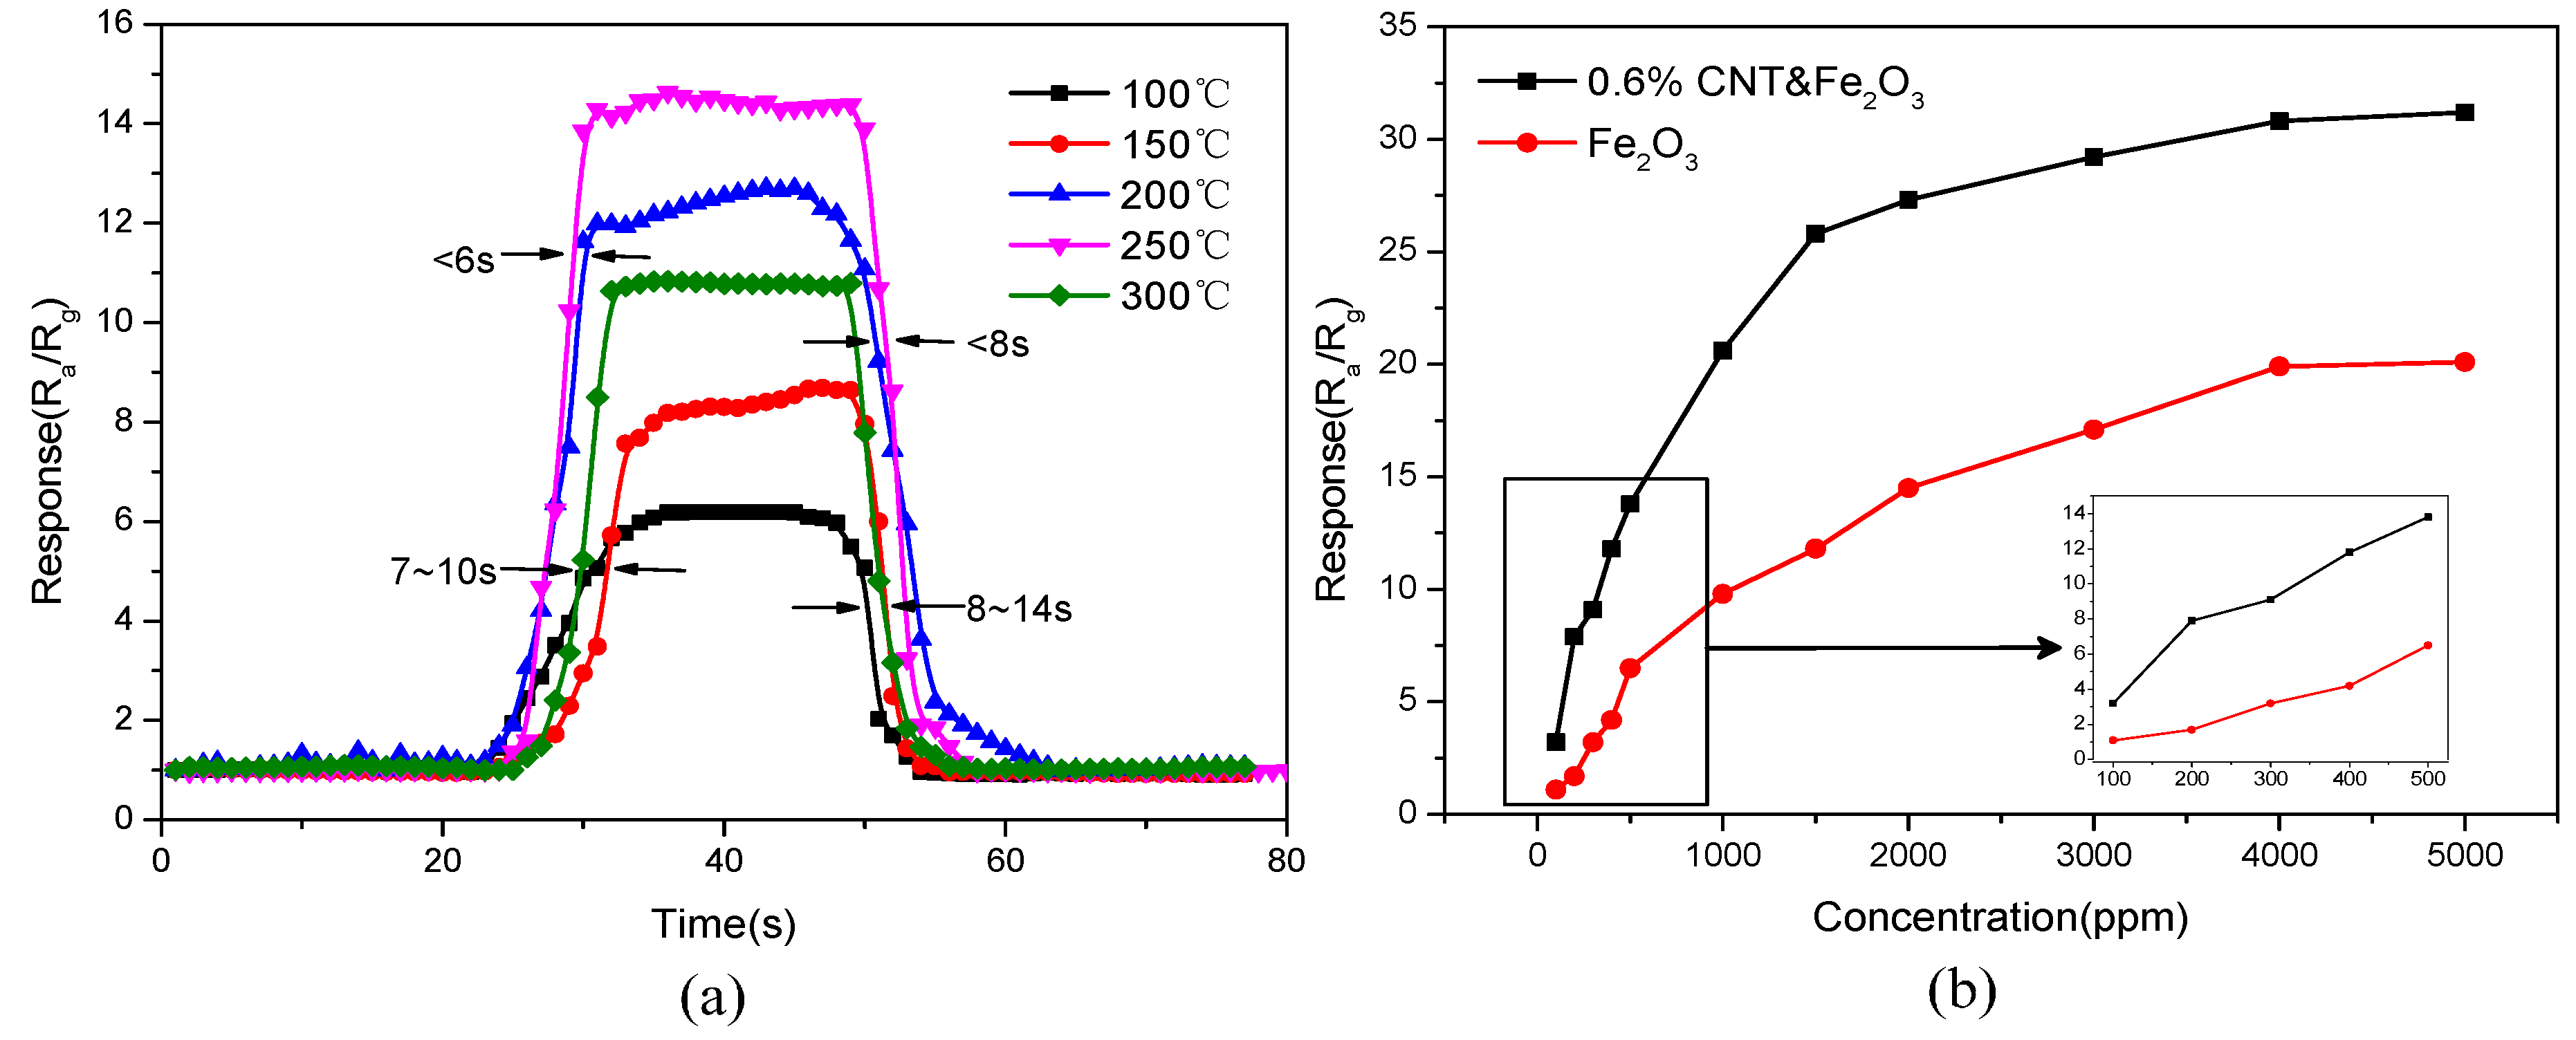
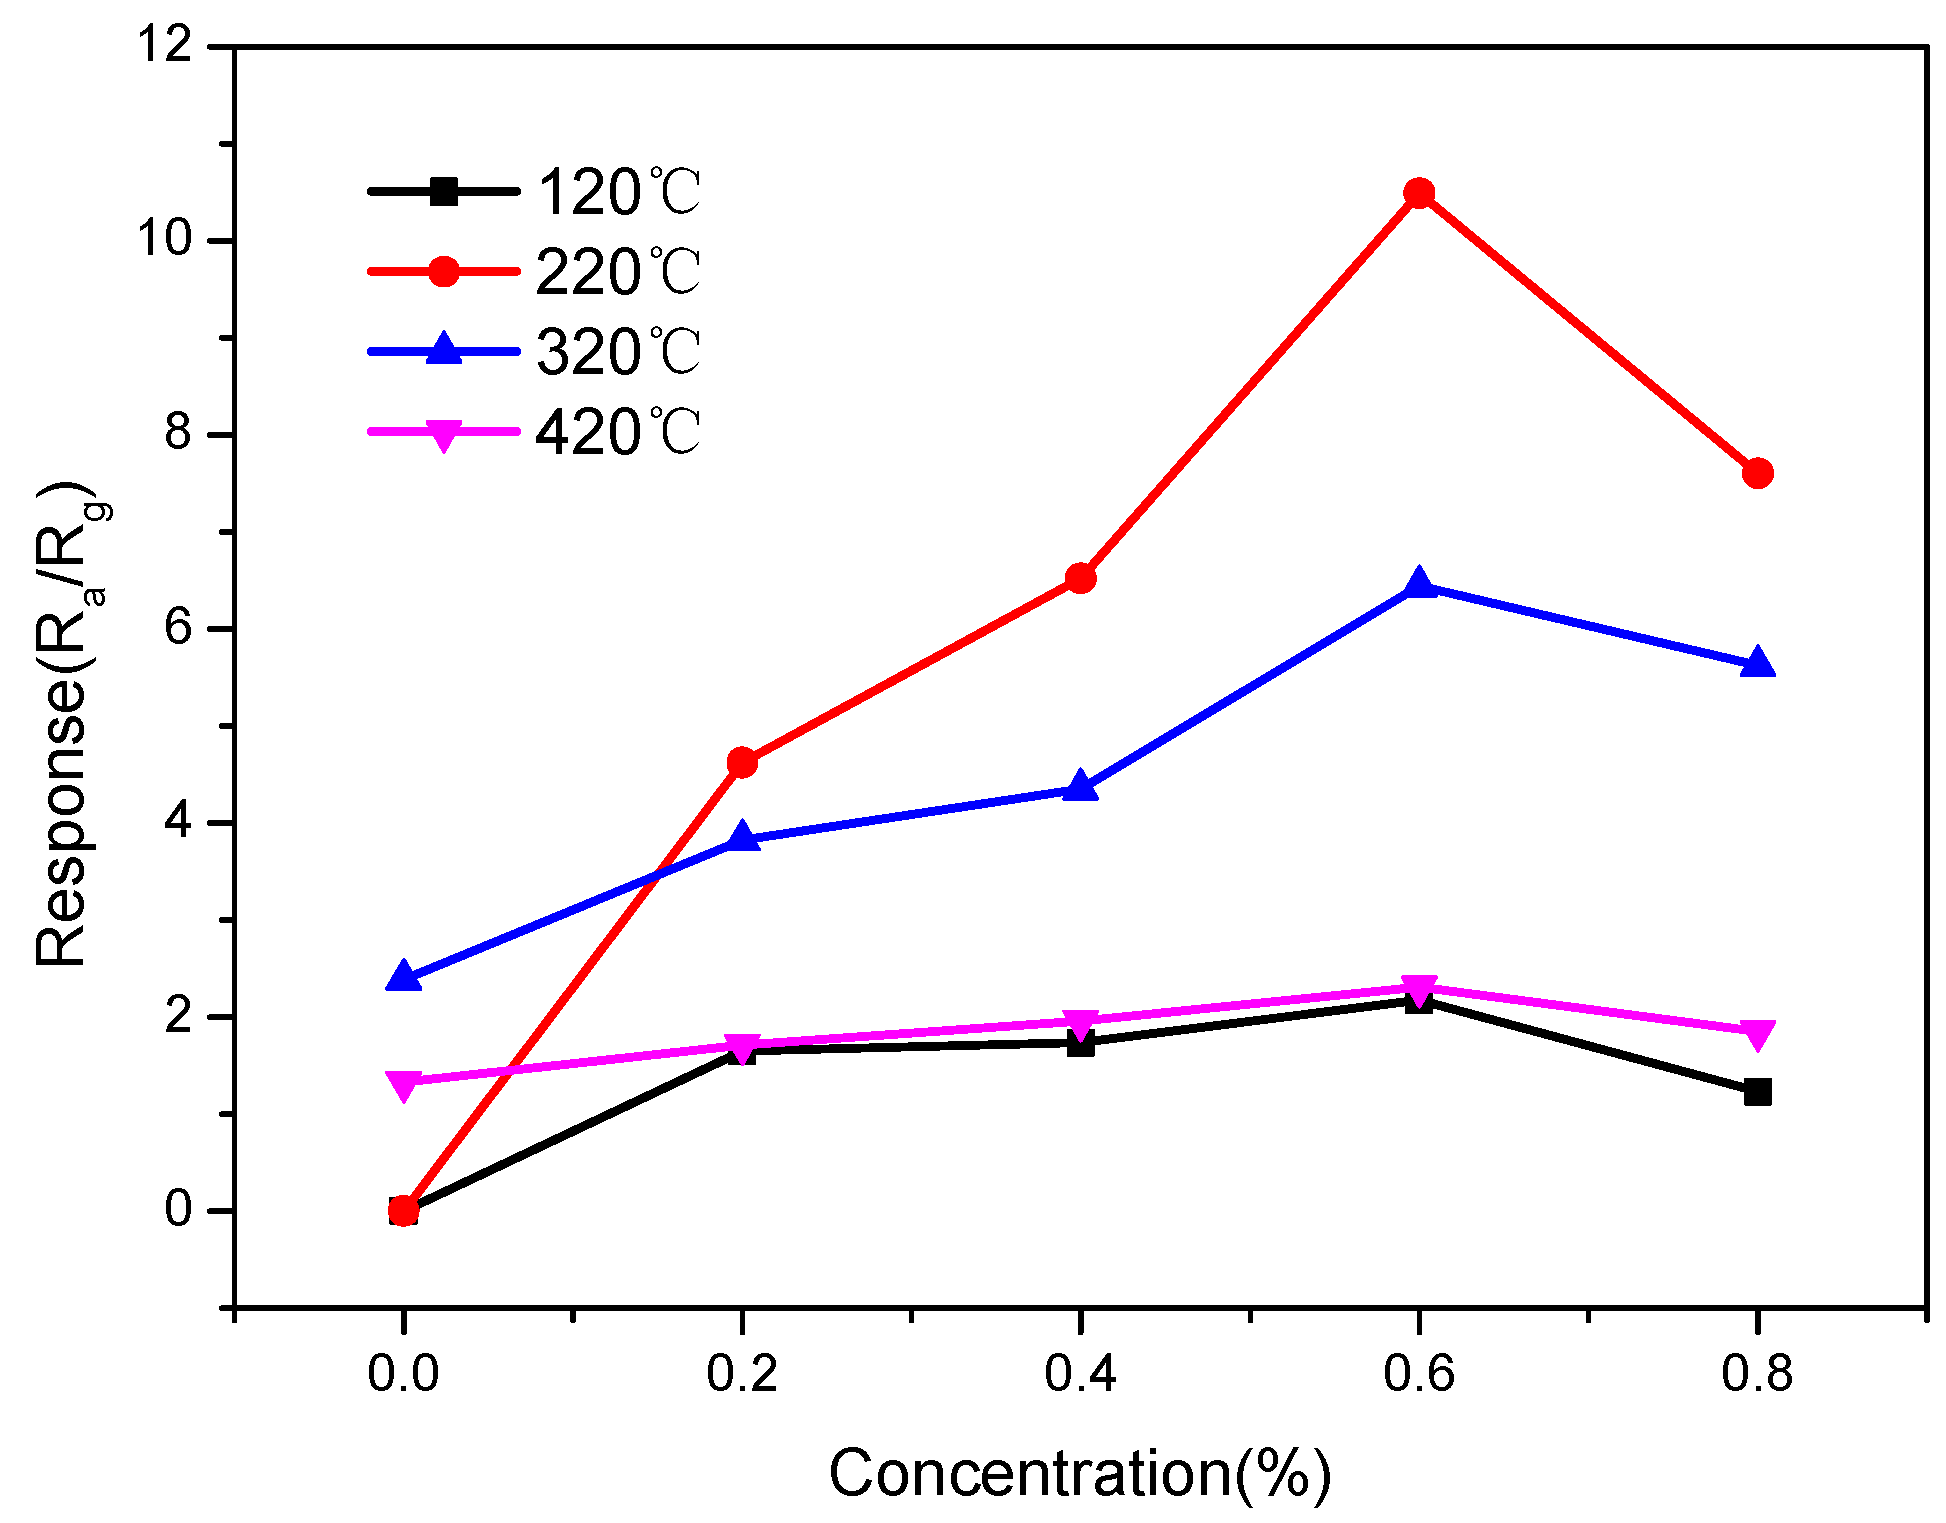
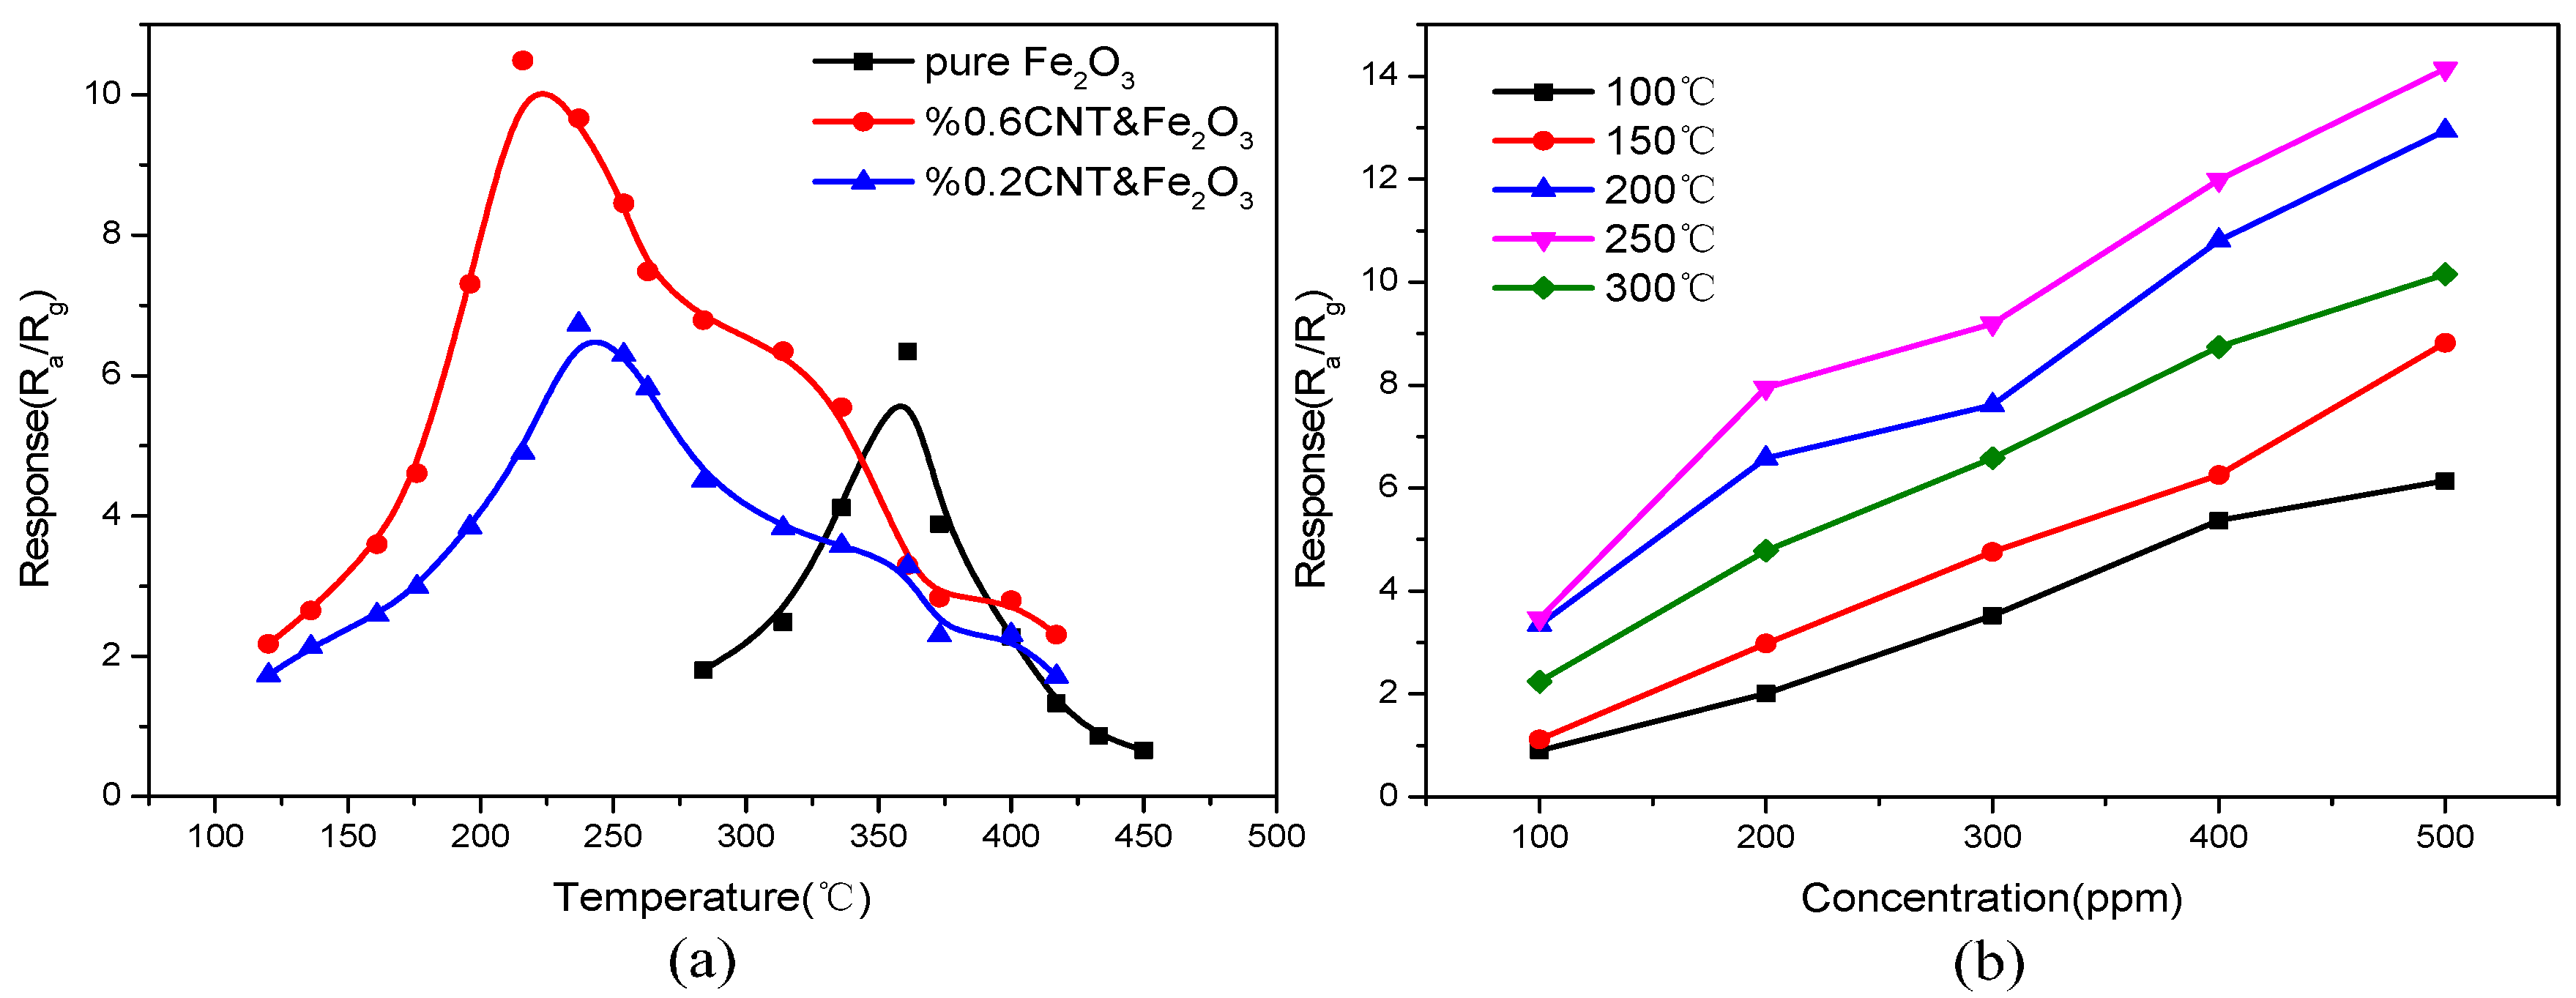
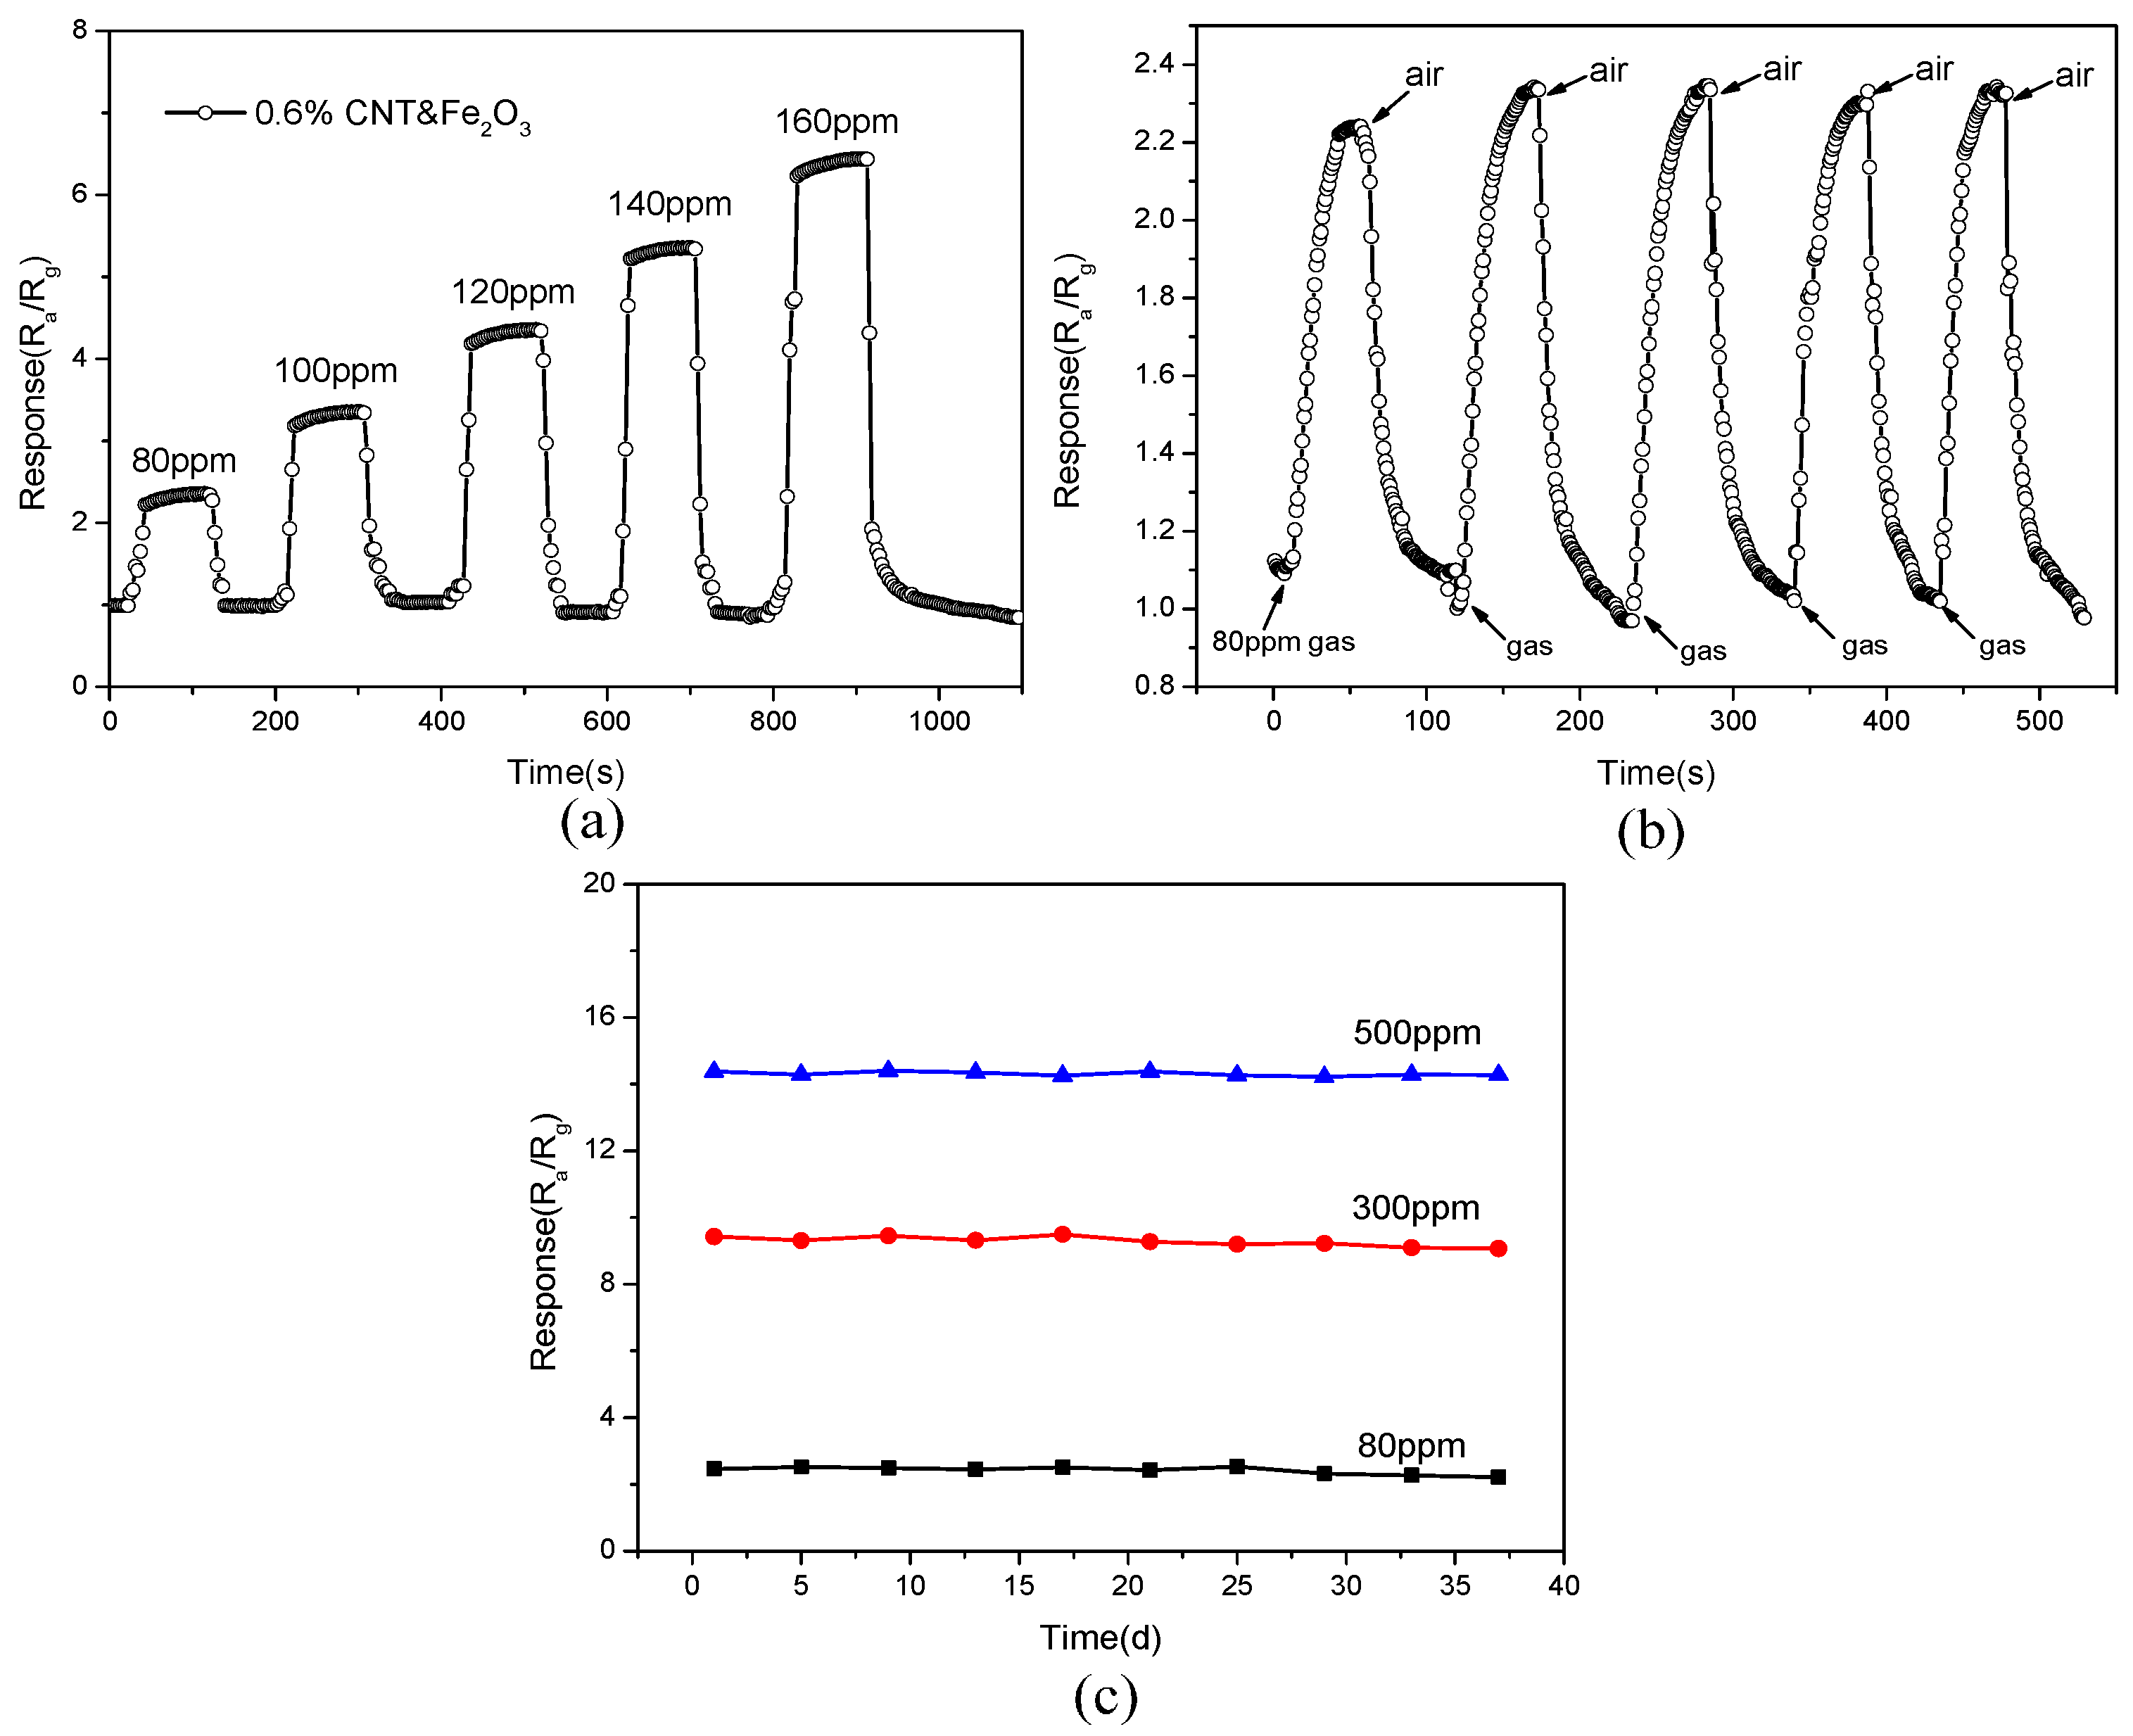
3.2. Gas Sensing Performance Tests

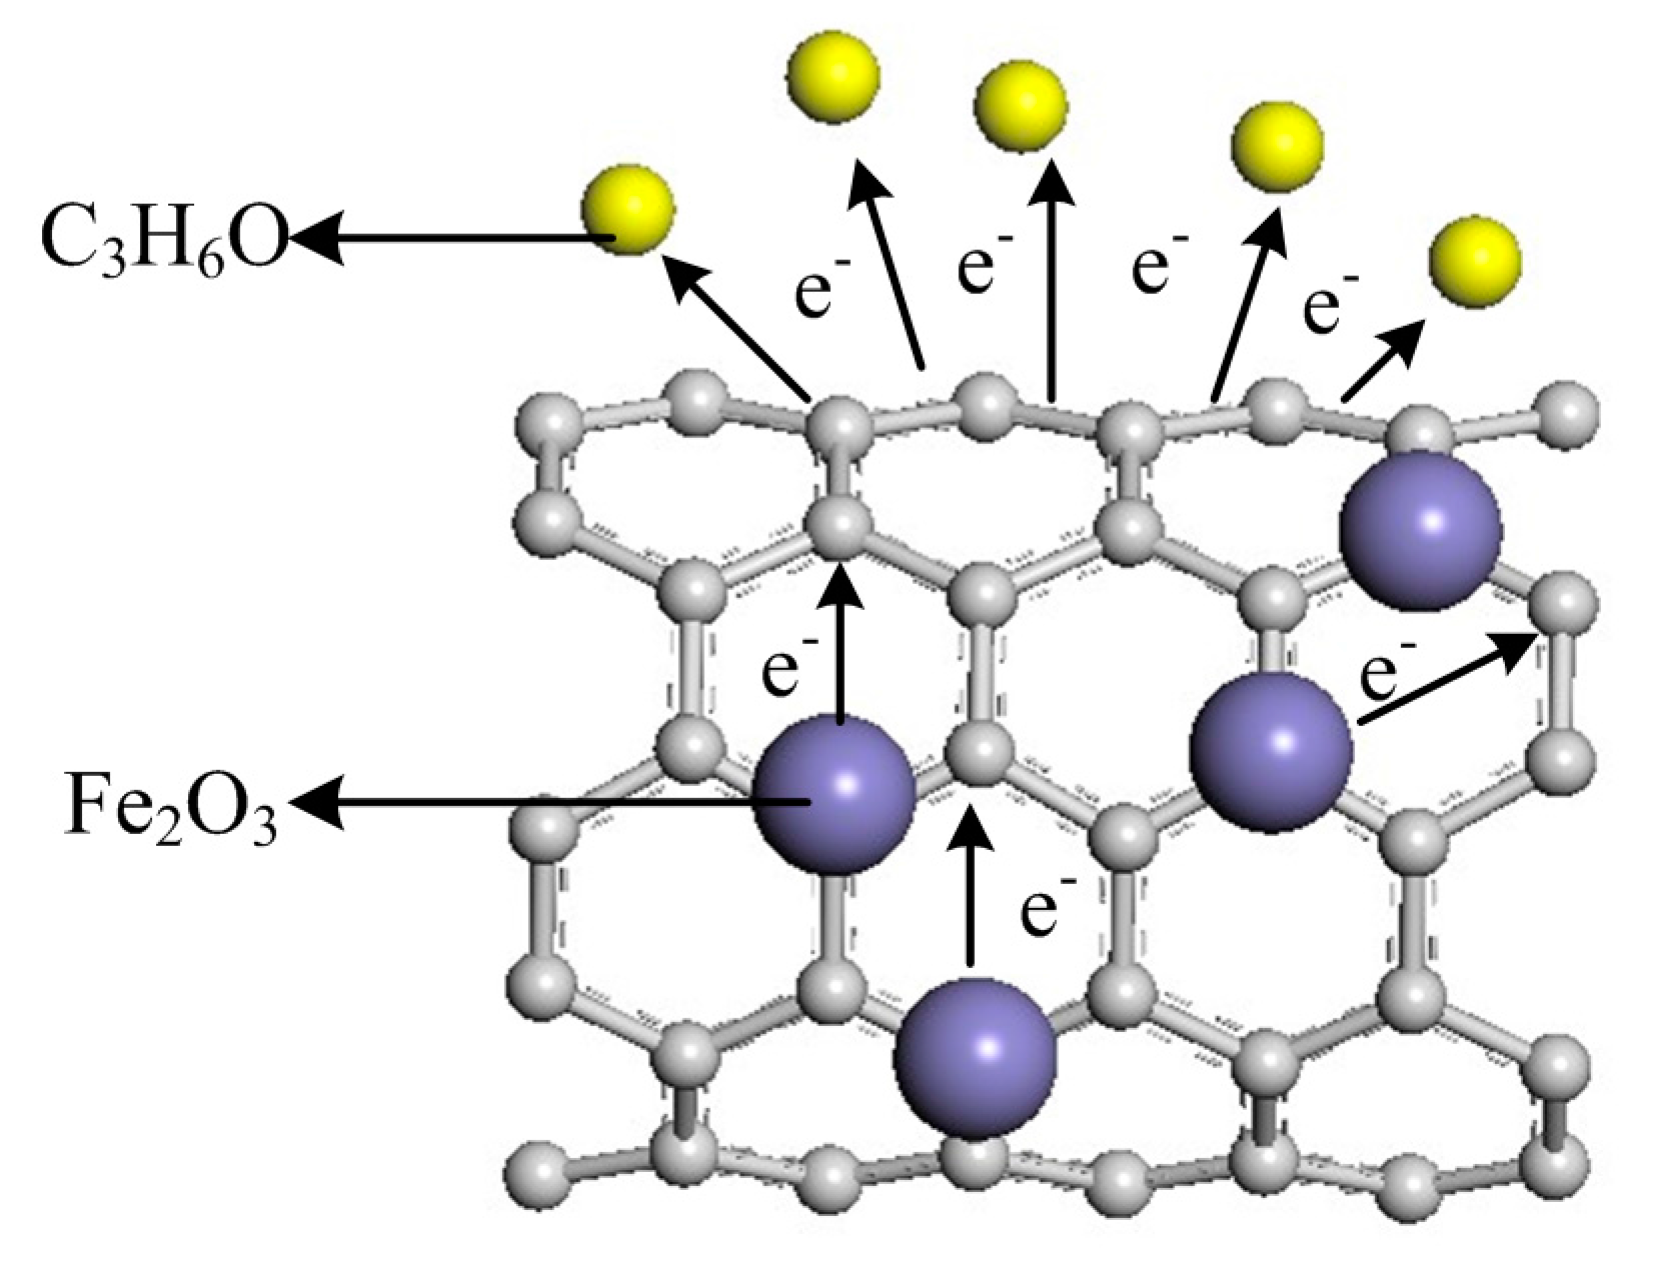
3.3. Gas Sensing Mechanism
4. Conclusions
Acknowledgments
Author Contributions
Conflicts of Interest
References
- Zhu, M.; Diao, G. Review on the progress in synthesis and application of magnetic carbon nanocomposites. Nanoscale 2011, 3, 2748–2767. [Google Scholar] [CrossRef] [PubMed]
- Niyogi, S.; Hamon, M.A.; Hu, H. Chemistry of single-walled carbon nanotubes. Acc. Chem. Res. 2002, 35, 1105–1113. [Google Scholar] [CrossRef] [PubMed]
- Schuerle, S.; Tiwari, M.K.; Shou, K. Fabricating devices with dielectrophoretically assembled, suspended single walled carbon nanotubes for improved nanoelectronic device characterization. Microelectron. Eng. 2011, 88, 2740–2743. [Google Scholar] [CrossRef]
- An, K.H.; Jeong, S.Y.; Hwang, H.R. Enhanced sensitivity of a gas sensor incorporating single-walled carbon nanotube-polypyrrole nanocomposites. Adv. Mater. 2004, 16, 1005–1009. [Google Scholar] [CrossRef]
- Suehiro, J.; Zhou, G.; Imakiire, H. Controlled fabrication of carbon nanotube NO2 gas sensor using dielectrophoretic impedance measurement. Sens. Actuators B Chem. 2005, 108, 398–403. [Google Scholar] [CrossRef]
- Suehiro, J.; Sano, N.; Zhou, G. Application of dielectrophoresis to fabrication of carbon nanohorn gas sensor. J. Electrost. 2006, 64, 408–415. [Google Scholar] [CrossRef]
- Nguyen, L.Q.; Phan, P.Q.; Duong, H.N. Enhancement of NH3 gas sensitivity at room temperature by carbon nanotube-based sensor coated with Co nanoparticles. Sensors 2013, 13, 1754–1762. [Google Scholar] [CrossRef] [PubMed]
- Suehiro, J.; Imakiire, H.; Hidaka, S. Schottky-type response of carbon nanotube NO2 gas sensor fabricated onto aluminum electrodes by dielectrophoresis. Sens. Actuators B Chem. 2006, 114, 943–949. [Google Scholar] [CrossRef]
- Chopra, S.; McGuire, K.; Gothard, N. Selective gas detection using a carbon nanotube sensor. Appl. Phys. Lett. 2003, 83, 2280–2282. [Google Scholar] [CrossRef]
- Liu, L.; Zhang, T.; Li, S.C. Micro-structure sensors based on ZnO microcrystals with contact-controlled ethanol sensing. Chin. Sci. Bull. 2009, 54, 4371–4375. [Google Scholar] [CrossRef]
- Wang, X.Z. Improved ethanol, acetone and H2 sensing performances of micro-sensors based on loose ZnO nanofibers. Chin. Sci. Bull. 2012, 57, 4653–4658. [Google Scholar] [CrossRef]
- Li, X.B.; Ma, S.Y.; Li, F.M. Porous spheres-like ZnO nanostructure as sensitive gas sensors for acetone detection. Mater. Lett. 2013, 100, 119–123. [Google Scholar] [CrossRef]
- Lao, C.S.; Liu, J.; Gao, P. ZnO nanobelt/nanowire Schottky diodes formed by dielectrophoresis alignment across Au electrodes. Nano Lett. 2006, 6, 263–266. [Google Scholar] [CrossRef] [PubMed]
- Cao, Y.; Luo, H.; Jia, D. Low-heating solid-state synthesis and excellent gas-sensing properties of α-Fe2O3 nanoparticles. Sens. Actuators B Chem. 2013, 176, 618–624. [Google Scholar] [CrossRef]
- Wang, Y.; Cao, J.L.; Yu, M.G. Porous α-Fe2O3 hollow microspheres: hydrothermal synthesis and their application in ethanol sensors. Mater. Lett. 2013, 100, 102–105. [Google Scholar] [CrossRef]
- Sun, P.; Wang, W.; Liu, Y. Hydrothermal synthesis of 3D urchin-like α-Fe2O3 nanostructure for gas sensor. Sens. Actuators B Chem. 2012, 173, 52–57. [Google Scholar] [CrossRef]
- Liu, C.; Shan, H.; Liu, L. High sensing properties of Ce-doped α-Fe2O3 nanotubes to acetone. Ceram. Int. 2014, 40, 2395–2399. [Google Scholar] [CrossRef]
- Huang, L.; Fan, H. Room-temperature solid state synthesis of ZnO/α-Fe2O3 hierarchical nanostructures and their enhanced gas-sensing properties. Sens. Actuators B Chem. 2012, 171, 1257–1263. [Google Scholar] [CrossRef]
- Shan, H.; Liu, C.; Liu, L. Highly sensitive acetone sensors based on La-doped α-Fe2O3 nanotubes. Sens. Actuators B Chem. 2013, 184, 243–247. [Google Scholar] [CrossRef]
- Sun, P.; Wang, C.; Zhou, X. Cu-doped α-Fe2O3 hierarchical microcubes: Synthesis and gas sensing properties. Sens. Actuators B Chem. 2014, 193, 616–622. [Google Scholar] [CrossRef]
- Varghese, O.K.; Kichambre, P.D.; Gong, D. Gas sensing characteristics of multi-wall carbon nanotubes. Sens. Actuators B Chem. 2001, 81, 32–41. [Google Scholar] [CrossRef]
- Clément, P.; Hafaiedh, I.; Parra, E.J.; Thamri, A.; Guillot, J.; Abdelghani, A.; Llobet, E. Iron oxide and oxygen plasma functionalized multi-walled carbon nanotubes for the discrimination of volatile organic compounds. Carbon 2014, 78, 510–520. [Google Scholar] [CrossRef]
- Liu, L.; Liu, C.; Li, S. Honeycombed SnO2 with ultra sensitive properties to H2. Sens. Actuators B Chem. 2013, 177, 893–897. [Google Scholar] [CrossRef]
- Sun, P.; Cai, Y.; Du, S. Hierarchical α-Fe2O3/SnO2 semiconductor composites: Hydrothermal synthesis and gas sensing properties. Sens. Actuators B Chem. 2013, 182, 336–343. [Google Scholar] [CrossRef]
- Li, L.; Xiao, C.; Guo-Guang, W. Synthesis and Improved Acetone Sensing Properties of Porous α-Fe2O3 Nanowires. Chin. Phys. Lett. 2013, 30. [Google Scholar] [CrossRef]
© 2015 by the authors; licensee MDPI, Basel, Switzerland. This article is an open access article distributed under the terms and conditions of the Creative Commons Attribution license (http://creativecommons.org/licenses/by/4.0/).
Share and Cite
Tan, Q.; Fang, J.; Liu, W.; Xiong, J.; Zhang, W. Acetone Sensing Properties of a Gas Sensor Composed of Carbon Nanotubes Doped With Iron Oxide Nanopowder. Sensors 2015, 15, 28502-28512. https://doi.org/10.3390/s151128502
Tan Q, Fang J, Liu W, Xiong J, Zhang W. Acetone Sensing Properties of a Gas Sensor Composed of Carbon Nanotubes Doped With Iron Oxide Nanopowder. Sensors. 2015; 15(11):28502-28512. https://doi.org/10.3390/s151128502
Chicago/Turabian StyleTan, Qiulin, Jiahua Fang, Wenyi Liu, Jijun Xiong, and Wendong Zhang. 2015. "Acetone Sensing Properties of a Gas Sensor Composed of Carbon Nanotubes Doped With Iron Oxide Nanopowder" Sensors 15, no. 11: 28502-28512. https://doi.org/10.3390/s151128502
APA StyleTan, Q., Fang, J., Liu, W., Xiong, J., & Zhang, W. (2015). Acetone Sensing Properties of a Gas Sensor Composed of Carbon Nanotubes Doped With Iron Oxide Nanopowder. Sensors, 15(11), 28502-28512. https://doi.org/10.3390/s151128502