A Revised LRSPR Sensor with Sharp Reflection Spectrum


Abstract
: In this work, we have proposed a novel long-range surface plasmon resonance (LRSPR) sensor with sharp reflection spectrum, which consists of a glass prism, a (A/B)4-type waveguide-coupled layer and a metal layer. To reveal its sharp reflection spectrum perfectly, we have simulated the effects of all factors of this LRSPR sensor on the reflection spectrum, and finally presented the optimal parameters of the LRSPR sensor with sharp reflection spectrum.
1. Introduction
Surface plasmon resonance (SPR) refers to the optical excitation of surface plasmon wave at the interface between a noble metal and a dielectric. The SPR sensors have great potential in chemical and biological sensing, including the measurements on the concentration of an analyte in a complex sample, the specificity, affinity and biomolecular interaction kinetics [1–3]. The most common SPR sensor, also called the conventional SPR (CSPR) sensor, is in Kretschmann configuration and comprises of a glass prism, a thin metal film and a sample in sequence, that may work in angular or wavelength interrogation mode. For the SPR sensor in angular interrogation mode, the wavelength of the entrance light is constant and the incident angle can be adjusted [4–6]. Until now, numerous works have been done to develop the CSPR sensors in angular interrogation mode [7–11], but these CSPR sensors have a common disadvantage, namely the wide reflection spectrum (∼2–3° of dip width) that produces low sign-to-noise ratio.
Apart from CSPR sensors, other three kinds of SPR sensors have been developed also [12]. The first kind is waveguide-coupled SPR (WCSPR) sensor, whose configuration is made up of a prism, a metal layer, a dielectric waveguiding layer, a metal layer and a sample in sequence [13–15]. In the reflection spectrum of WCSPR sensor, there are one CSPR dip, one WCSPR dip and several waveguide-coupled resonance dips. Although the WCSPR dip is one sharp dip (∼0.3°), it is difficult to distinguish those dips in the measurements. The second kind is plasmon-waveguide SPR (PWSPR) sensor, whose configuration is made up of a prism, a metal layer, a dielectric waveguiding layer and a sample in sequence [16,17]. In its reflection spectrum, there are one CSPR dip and one sharp WCSPR dip (∼0.5°), but our simulations have shown that the refractive index (RI) range of the WCSPR dip is too small.
The third kind is a long-range SPR (LRSPR) sensor, whose configuration is made up of a prism, a dielectric layer, a metal layer and a sample in sequence [18–21]. Based on LRSPR structure, we have proposed a revised LRSPR sensor with sharp reflection spectrum, which consists of a glass prism, a (A/B)4-type waveguide-coupled (WC) layer and a metal layer. To reveal its sharp reflection spectrum perfectly, we have investigated the effects of key parameters of the revised LRSPR sensor on the reflection spectrum, and finally presented the optimal parameters.
2. Model and Simulation Results
Figure 1a gives the configuration of the revised LRSPR sensor. The first layer is the coupling prism with the RI of np = 1.5105. As shown in Figure 1b, the next is the WC layer with the periodic structure of type (A/B)Y, where A = TiO2 and B = SiO2, Y denotes the number of A/B layer, the RI and thickness of A layer is denoted by n2 (=2.232) and d2, the RI and thickness of B layer denoted by n3 (=1.451) and d3 respectively. Let N = 2Y + 3, then the (N−1)th layer is the noble metal layer whose dielectric function obeys Lorentz-Drude model and can be expressed in the following form [22]
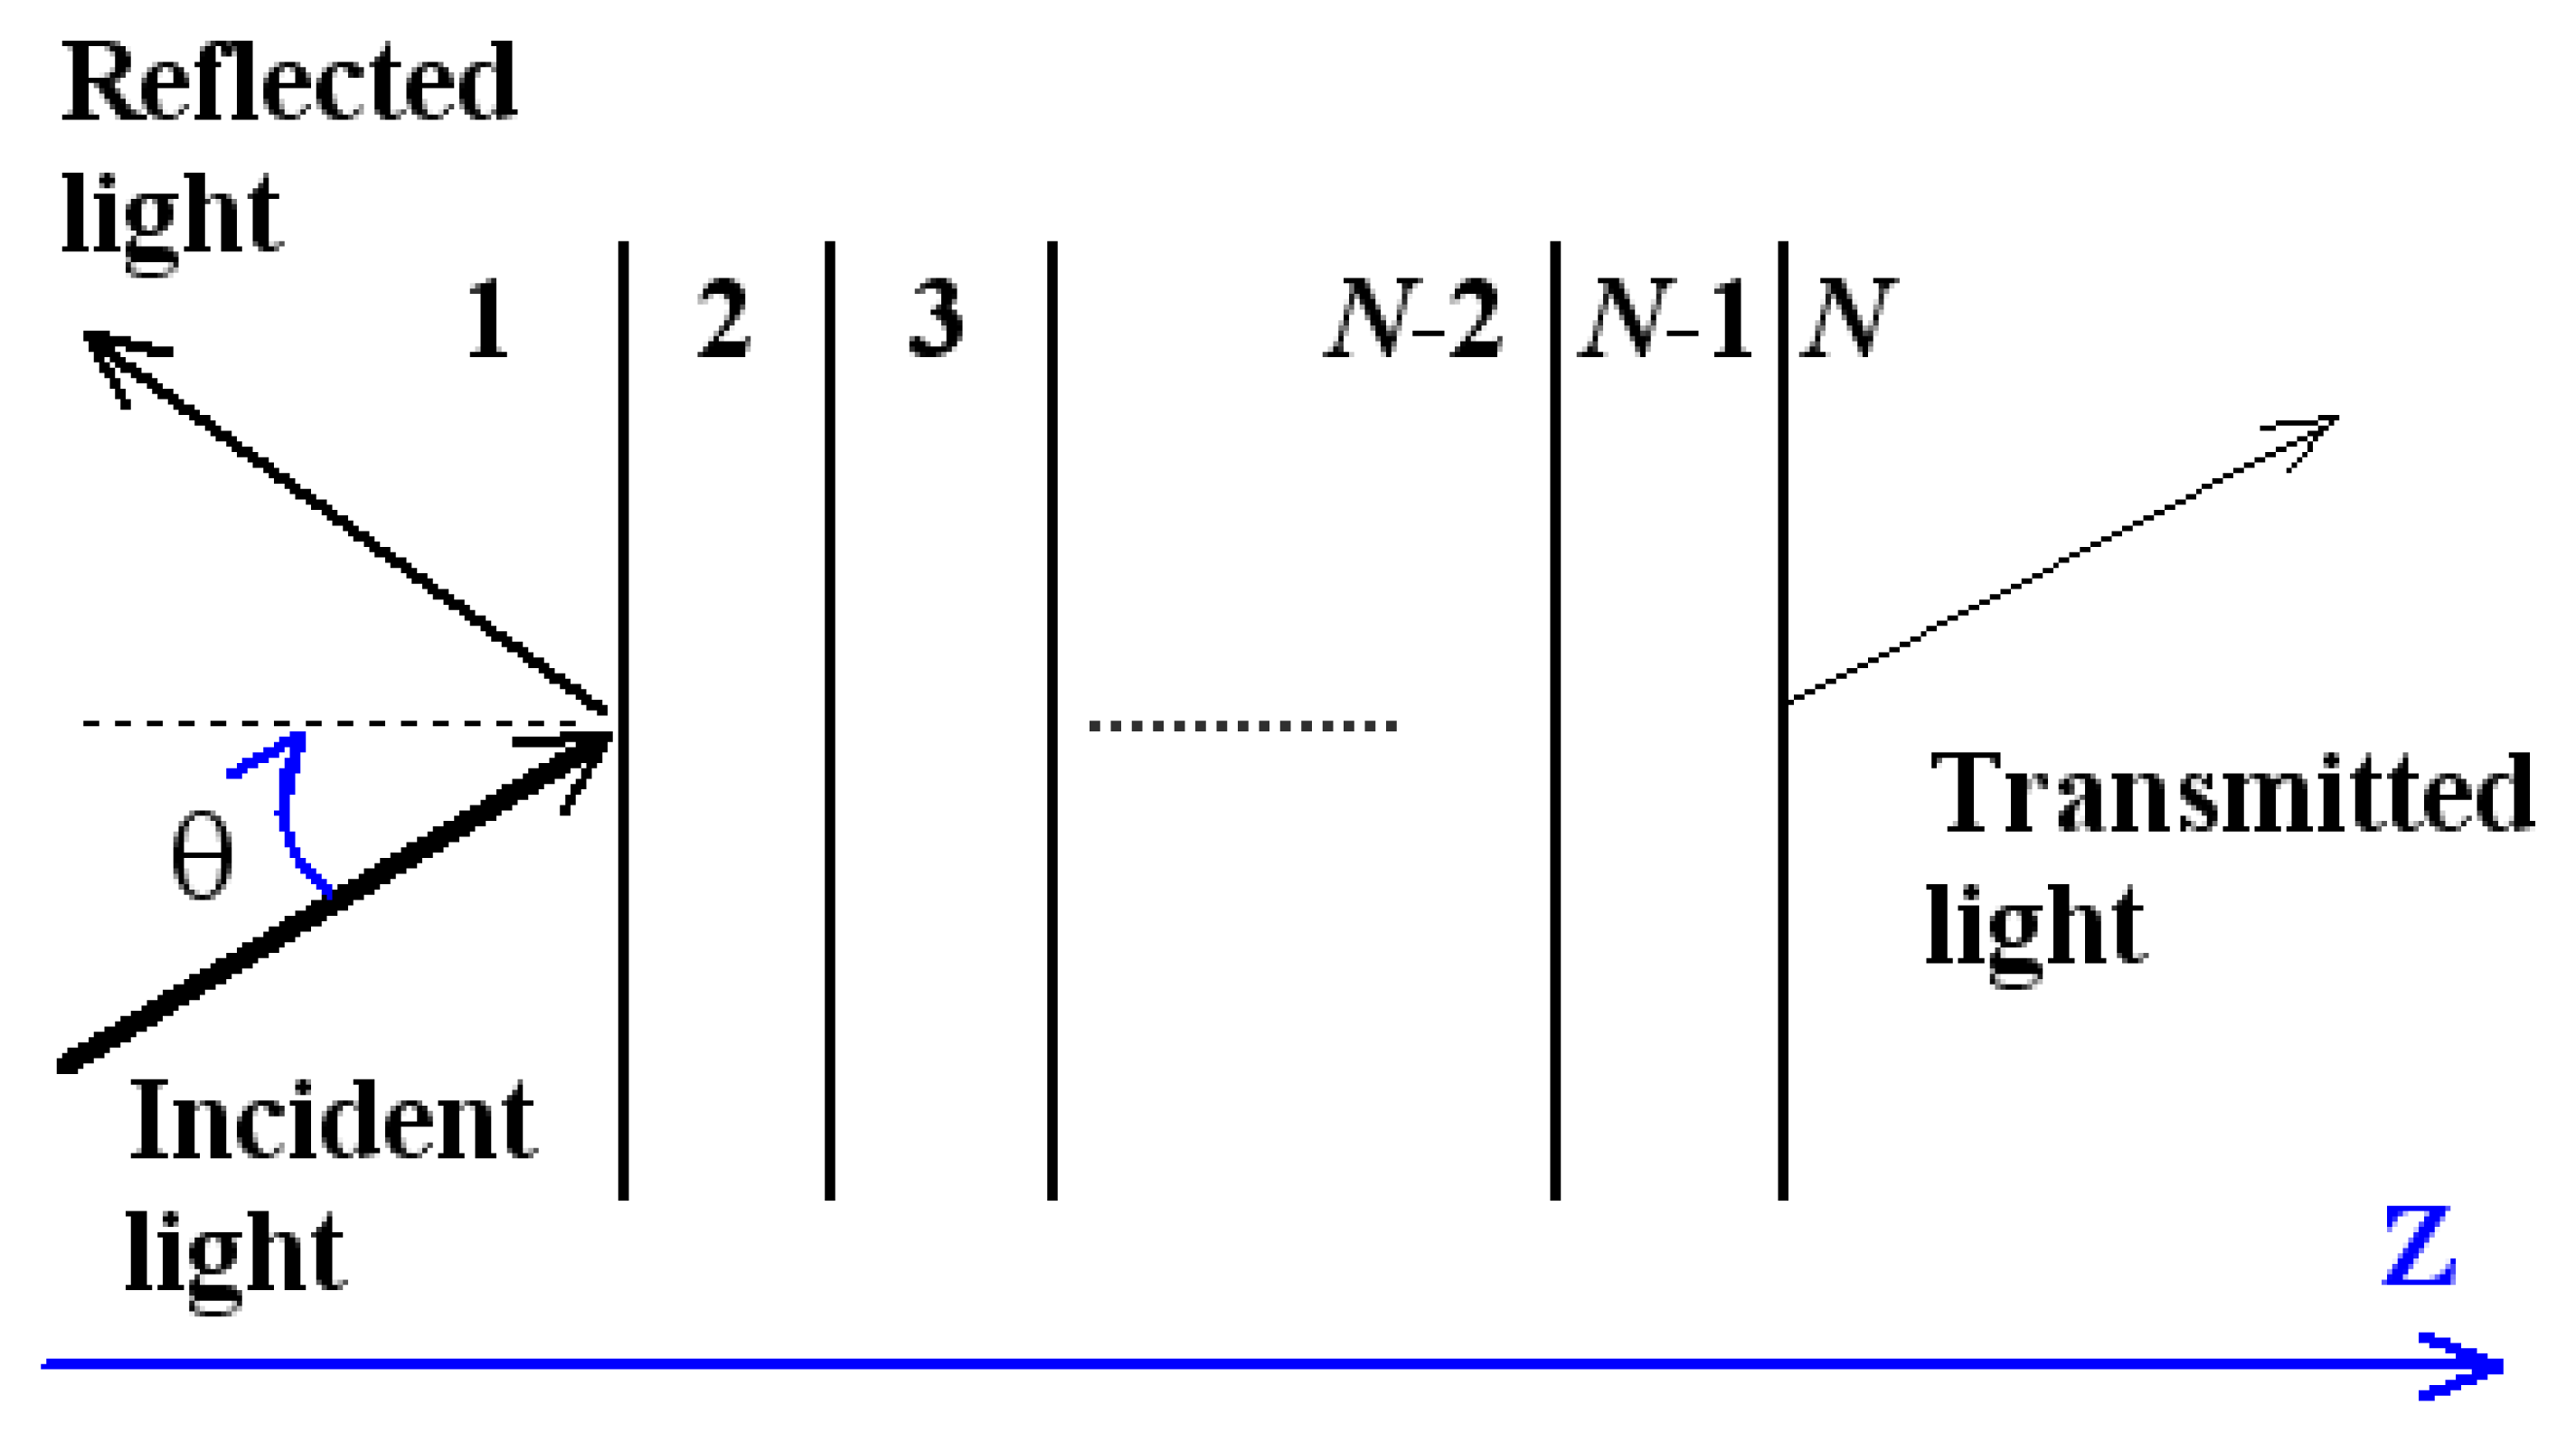
To calculate the reflected light intensity of p-polarized incident light, the N-layer model has been used to simulate the SPR sensor working in the angle interrogation mode. As shown in Figure 2, these layers are stacked along the z-axis, any layer is defined by the thickness dk, dielectric constant ɛk, and refractive index nk, where k is a footnote that denotes the prism, metal, dielectric layers and the sample. All layers are assumed to be uniform, isotropic and non-magnetic. The tangential fields at the first boundary Z = Z1 = 0 are related to those at the final boundary Z = ZN−1 by [3,22]
Here λ is the free space wavelength. The amplitude reflection coefficient for p-polarized incident wave is given by
Finally, the reflection intensity for p-polarized light is
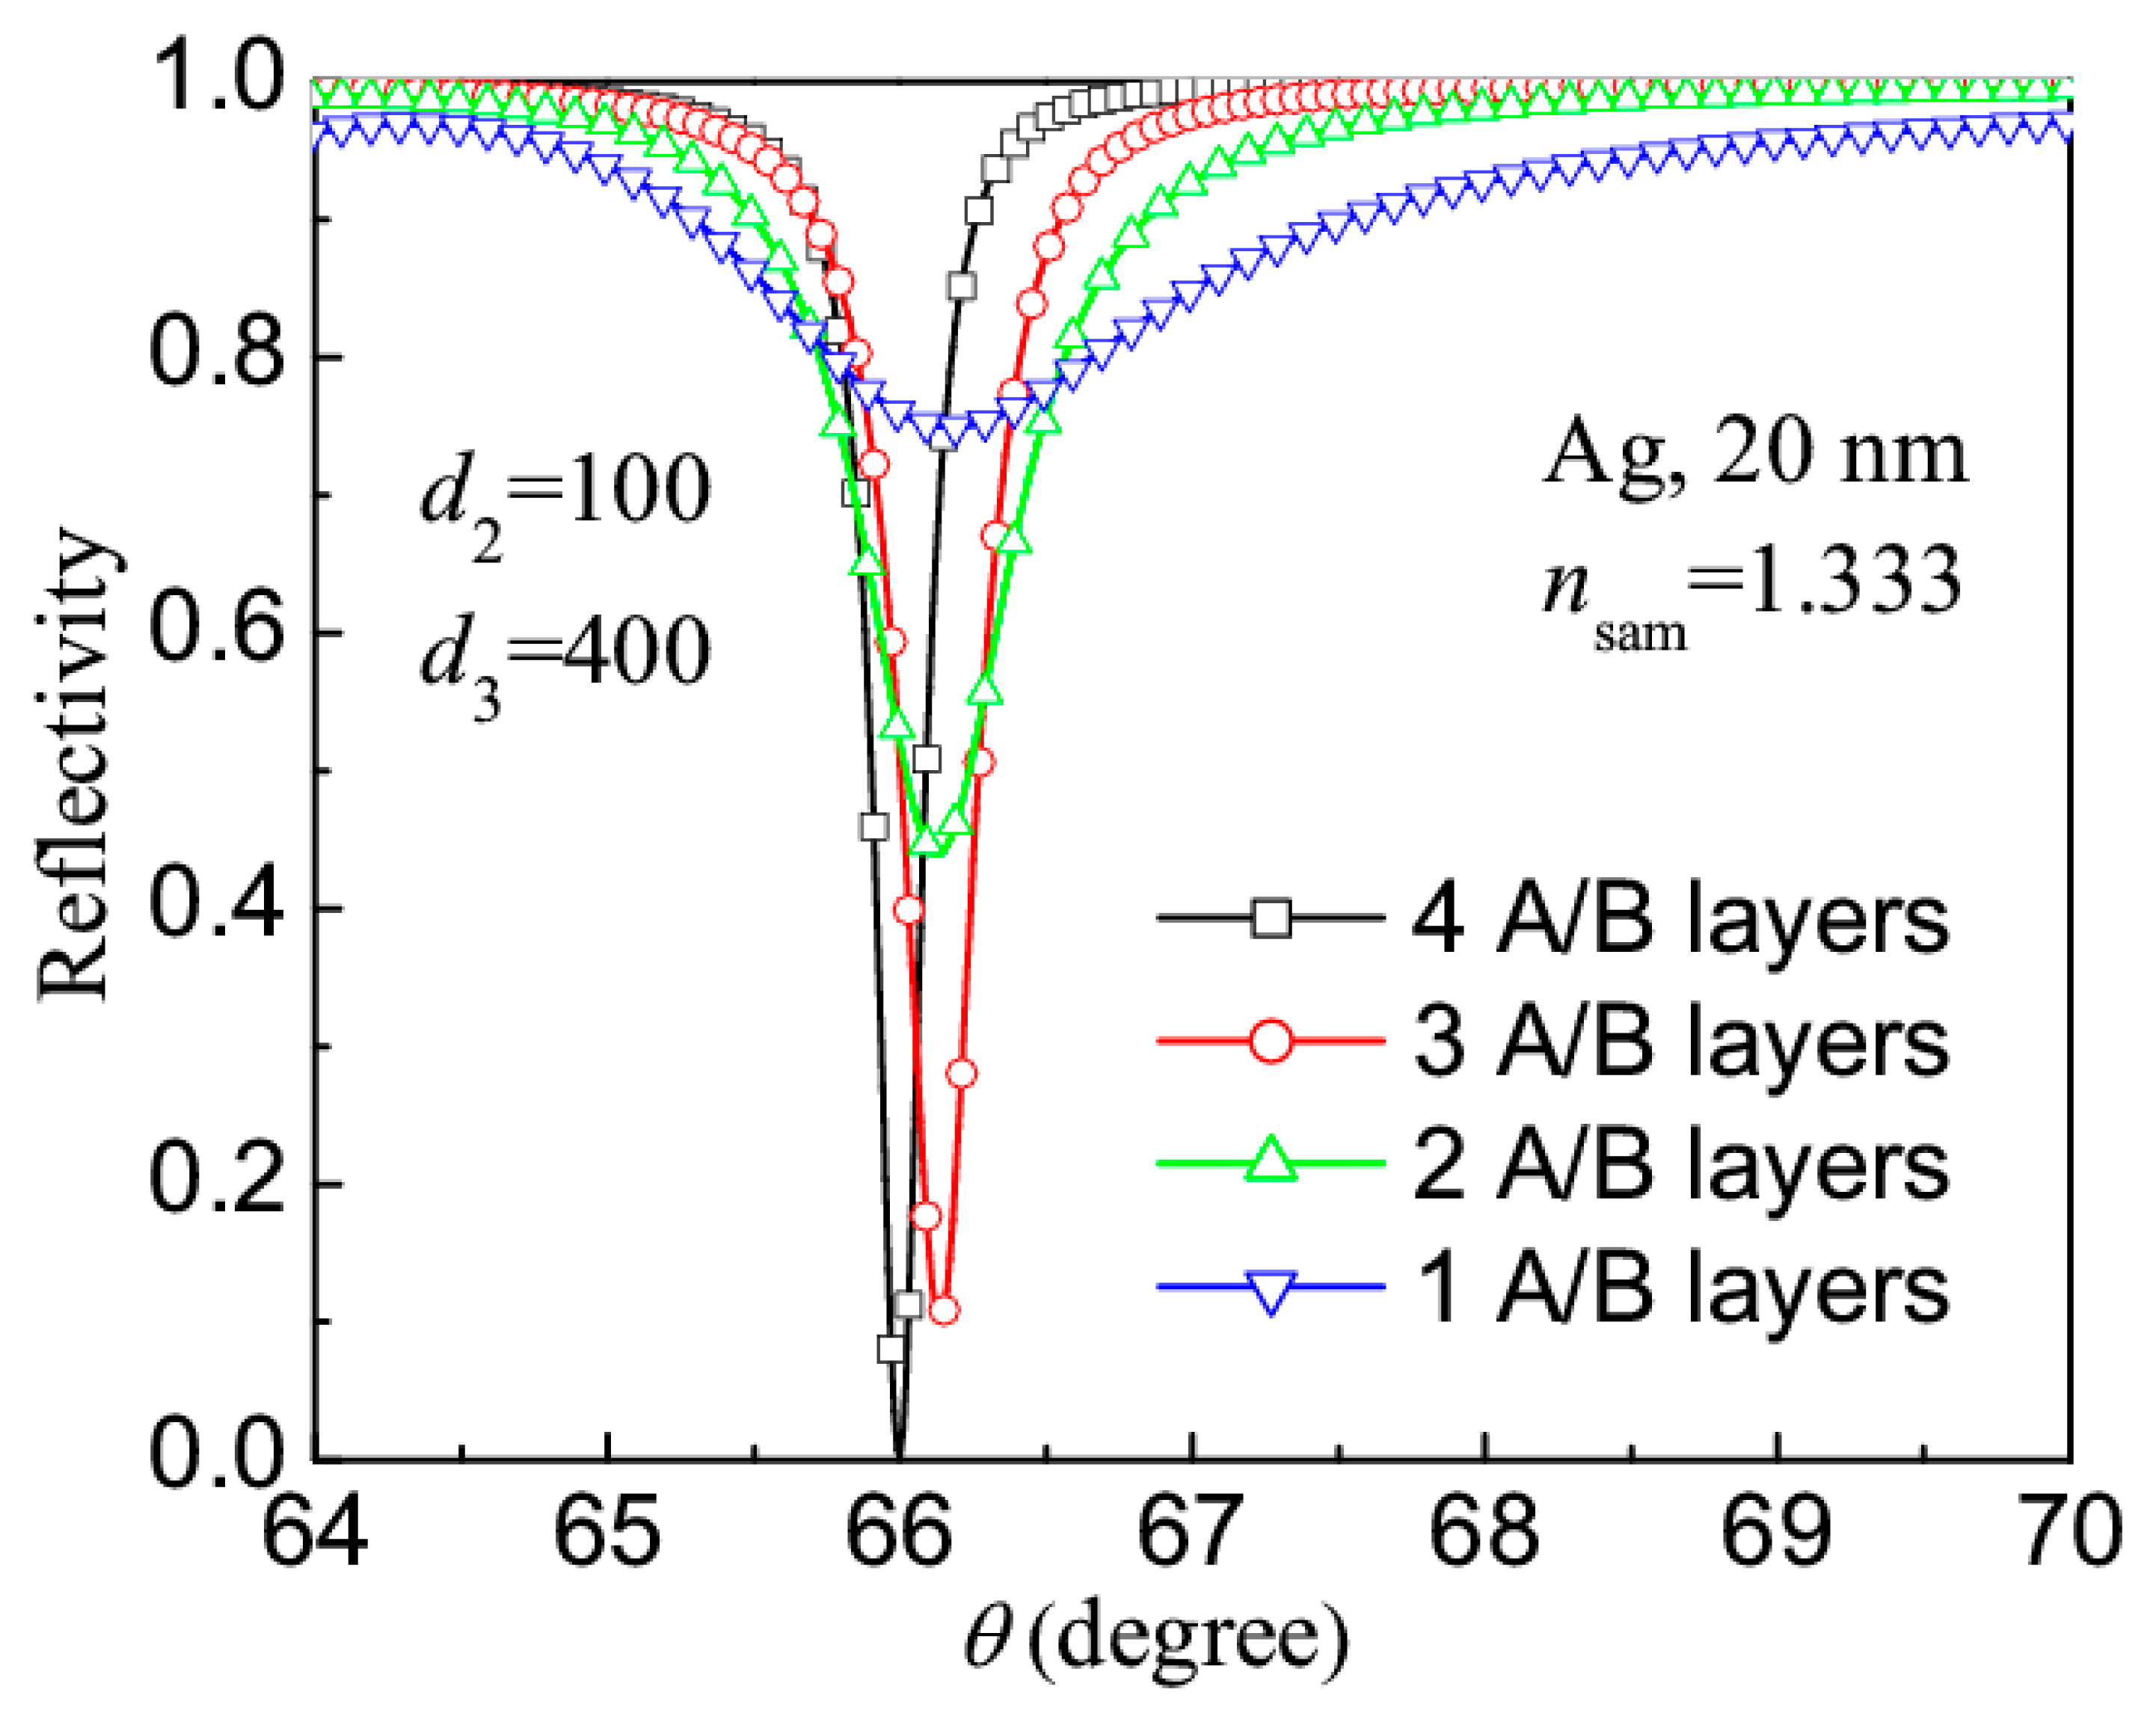
Firstly, to understand the effect of the number of A/B layers on the SPR, Figure 3 depicts the reflection spectra of the revised LRSPR sensors with different number of A/B layers (1, 2, 3 and 4), where the RI nsam = 1.3330, the thicknesses d2 = 100 nm and d3 = 400 nm were chosen. It can be seen that, the LRSPR sensor with one A/B layer has flat resonance spectrum (full width at half minimum, FWHM ΔθFWHM = 1.81°), the sensor with three A/B layers has a better resonance dip (ΔθFWHM = 0.30°) and the sensor with four A/B layers has a sharpest resonance dip (ΔθFWHM = 0.19°). We have also calculated the reflection spectra of the LRSPR sensors with five and more A/B layers, and found that their reflection spectra have no obvious improvement. In addition, the increase of A/B layers causes the preparation difficulty of the LRSPR sensor, so we take Y = 4 in the following discussion.
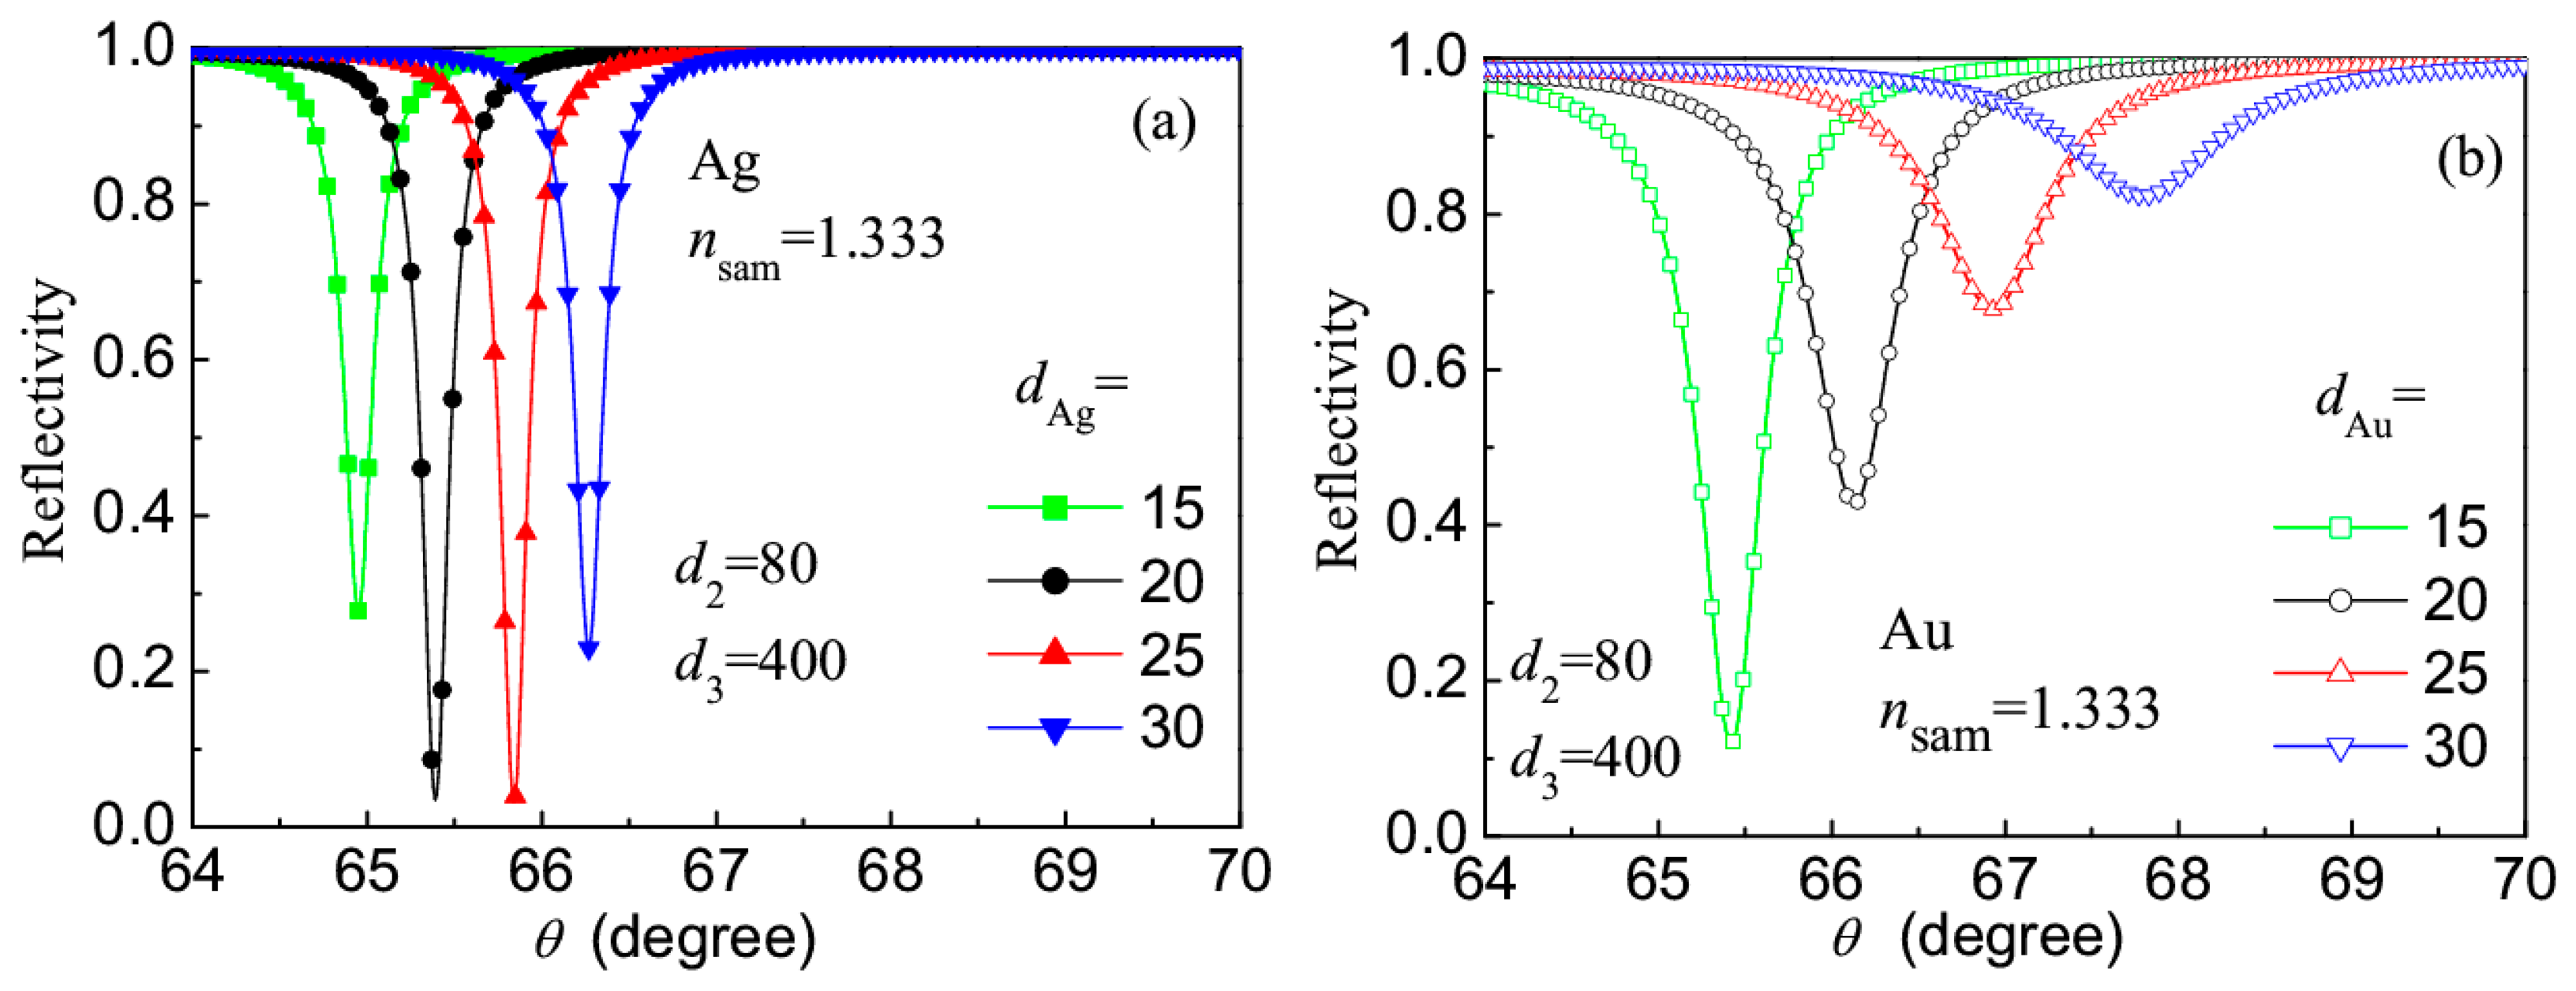
Then we have investigated the effects of different metals and thicknesses for the LRSPR sensor with 4 A/B layers. Figure 4 gives the reflection spectra of the sensors corresponding to metals Ag and Au with different thicknesses, where nsam = 1.333, d2 = 80 nm and d3 = 400 nm were chosen. For the sensors with Ag layer (Figure 4a), when the thickness of Ag layer changes from 15 nm to 30 nm, the resonance angle (θres) increases in the range of 64.9–66.3°, all the resonance dips are very sharp, and the best choice is the Ag layer of 20 nm. When using Au to prepare the metal layer of the sensor (Figure 4b), the resonance dips are wider, the signal-to-noise ratio (Δθres/ΔθFWHM) is lower, and it is recommended that its thickness should not be greater than 20 nm.
Coming from above discussions, better reflection spectra can be obtained by using the Ag layer of 20 nm, so such a metal layer was fixed in the following. Figure 5 shows the effects of the thicknesses d2 and d3 on the reflection spectrum of the revised LRSPR sensor, where nsam = 1.333 nm, d3 = 400 nm (a) or d2 = 100 nm (b) were fixed. It can be seen that, when d2 is in the range of 70–120 nm and d3 in the range of 300–450 nm, the reflection spectrum has better resonance dip.
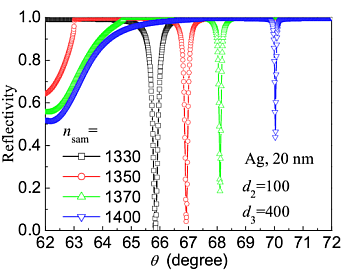
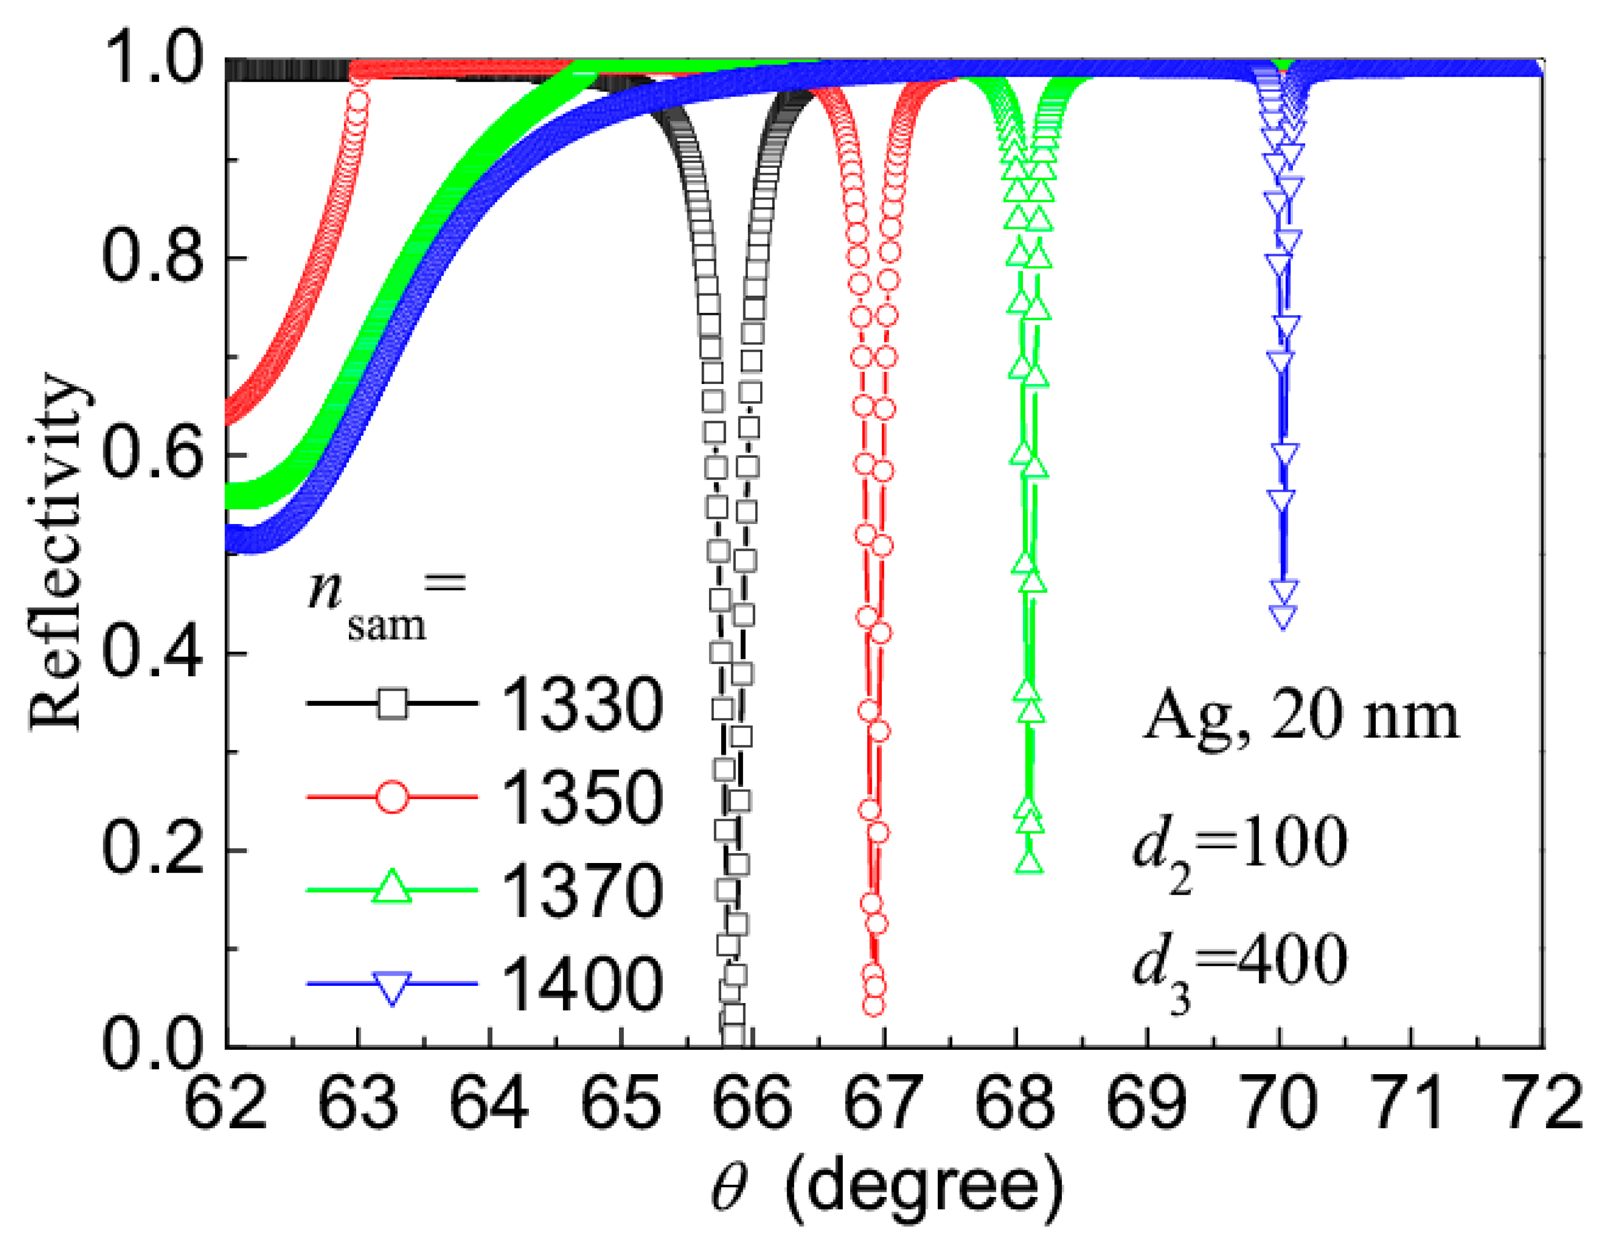
Finally, to understand the sensitivity (Δθres/Δnsam) and signal-to-noise ratio (Δθres/ΔθFWHM) of the revised LRSPR sensor, Figure 6 shows the effect of sample RI on the reflection spectrum of the revised LRSPR sensor, where d2 = 100 nm and d3 = 400 nm were fixed. When the sample RI increases from 1.330 to 1.400, the resonance angle increases linearly from 65.85° to 70.05°, the sensitivity Δθres/Δnsam is 60°/RIU approximately. Moreover, their spectrum width (ΔθFWHM < 0.2°) is smaller than one 10th of the spectrum width (ΔθFWHM > 2°) of the CSPR sensor, so their signal-to-noise ratio (Δθres/ΔθFWHM) is 10 times greater than that of the CSPR sensor.
3. Conclusions
We have proposed a revised LRSPR sensor with sharp reflection spectrum, it consists of a glass prism, a (A/B)4-type waveguide-coupled layer and a silver layer. Using the Ag layer with the thickness of about 20 nm, when the thickness of A layer (TiO2, RI = 2.232) is in the range of 70–120 nm and the thickness of B layer (SiO2, RI = 1.451) is in the range of 300–450 nm, the reflection spectrum of the revised LRSPR sensor has a better resonance dip with the FWHM of about 0.2°, which is smaller than one 10th of the spectrum width of the CSPR sensor. Moreover, when the sample RI increases from 1.330 to 1.400, the resonance angle increases linearly from 65.85° to 70.05° and the sensitivity of 60°/RIU was obtained.
Acknowledgments
This work is finically supported by the Project of National Science Foundation of China (No. 61475121, 50802069).
Author Contributions
Yutang Dai finished parts of figure drawing and paper writing; Yinquan Yuan finished the establishing of theoretical model, the simulations and discussions, and other works.
Conflict of Interest
The authors declare no conflict of interest.
References
- Homola, J. Present and future of surface plasmon resonance biosensors. Anal. Bioanal. Chem. 2003, 377, 528–539. [Google Scholar]
- Hoa, X.D.; Kirk, A.G.; Tabrizian, M. Towards integrated and sensitive surface plasmon resonance biosensors: A review of recent progress. Biosens. Bioelectron. 2007, 23, 151–160. [Google Scholar]
- Gupta, G.; Kondoh, J. Tuning and sensitivity enhancement of surface plasmon resonance sensor. Sens. Actuators B Chem. 2007, 122, 381–388. [Google Scholar]
- Agbor, N.E.; Cresswell, J.P.; Petty, M.C.; Monkman, A.P. An optical gas sensor based on polyaniline Langmuir-Blodgett films. Sens. Actuators B Chem. 1997, 41, 137–141. [Google Scholar]
- Chien, F.C.; Chen, S.J. A sensitivity comparison of optical biosensors based on four different surface plasmon resonance modes. Biosens. Bioelectron. 2004, 20, 633–642. [Google Scholar]
- Morjana, M.; Züchnerb, H.; Cammann, K. Contributions to a reliable hydrogen sensor based on surface plasmon surface resonance spectroscopy. Surf. Sci. 2009, 603, 1353–1359. [Google Scholar]
- Fernandez, C.J.; Manera, M.G.; Pellegrini, G.; Bersani, M.; Mattei, G.; Rella, R.; Vasanelli, L.; Mazzoldi, P. Surface plasmon resonance optical gas sensing of nanostructured ZnO films. Sens. Actuators B Chem. 2008, 130, 531–537. [Google Scholar]
- Piliarik, M.; Bockova, M.; Homola, J. Surface plasmon resonance biosensor for parallelized detection of protein biomarkers in diluted blood plasma. Biosens. Bioelectron. 2010, 26, 1656–1661. [Google Scholar]
- Hooper, I.R.; Rooth, M.; Sambles, J.R. Dual-channel differential surface plasmon ellipsometry for bio-chemical sensing. Biosens. Bioelectron. 2009, 25, 411–417. [Google Scholar]
- El-Basaty, A.B.; El-Brolossy, T.A.; Abdalla, S.; Negm, S.; Abdella, R.A.; Talaat, H. Surface plasmon sensor for NO2 gas. Surf. Interface Anal. 2008, 40, 1623–1626. [Google Scholar]
- Bolduc, O.R.; Live, L.S.; Masson, J.F. High-resolution surface plasmon resonance sensors based on a dove prism. Talanta 2009, 77, 1680–1687. [Google Scholar]
- Abbas, A.; Linman, M.J.; Cheng, Q. New trends in instrumental design for surface plasmon resonance-based biosensors. Biosens. Bioelectron. 2011, 26, 1815–1824. [Google Scholar]
- Kovacs, G.J.; Scott, G.D. Optical excitation of surface plasma waves in layered media. Phys. Rev. B 1977, 16, 1297–1311. [Google Scholar]
- Wang, K.; Wan, Y.; Zheng, Z.; He, F.; Hu, Z.; Zhu, J. A novel refractive index detection method in voltage scanning surface plasmon resonance system. Sens. Actuators B Chem. 2012, 169, 393–396. [Google Scholar]
- Ma, X.; Xu, X.; Zheng, Z.; Wang, K.; Su, Y.; Fan, J.; Zhang, R.; Song, L.; Wang, Z.; Zhu, J. Dynamically modulated intensity interrogation scheme using waveguide coupled surface plasmon resonance sensors. Sens. Actuators A Phys. 2010, 157, 9–14. [Google Scholar]
- Salamon, Z.; Macleod, H.A.; Tollin, G. Coupled plasmon-waveguide resonators: A new spectroscopic tool for probing proteolipid film structure and properties. Biophys. J. 1997, 73, 2791–2797. [Google Scholar]
- Lau, K.H.A.; Tan, L.S.; Tamada, K.; Sander, M.S.; Knoll, W. Highly sensitive detection of processes occurring inside nanoporous anodic alumina templates: A waveguide optical study. J. Phys. Chem. B 2004, 108, 10812–10818. [Google Scholar]
- Sarid, D. Long-range surface-plasma waves on very thin metal films. Phys. Rev. Lett. 1981, 47, 1927–1930. [Google Scholar]
- Quail, J.C.; Rako, J.G.; Simon, H.J. Long-range surface plasmon modes in silver and aluminum films. Opt. Lett. 1983, 8, 377–379. [Google Scholar]
- Nenninger, G.G.; Tobisk, P.; Homola, J. Long-range surface plasmons for high-resolution surface plasmon resonance sensors. Sens. Actuators B Chem. 2001, 74, 145–151. [Google Scholar]
- Slavik, R.; Homola, J. Ultrahigh resolution long range surface plasmon–based sensor. Sens. Actuators B Chem. 2007, 123, 10–12. [Google Scholar]
- Yuan, Y.; Ding, L.; Guo, Z. Numerical investigation for SPR-based optical fiber sensor. Sens. Actuators B Chem. 2011, 157, 240–245. [Google Scholar]


© 2014 by the authors; licensee MDPI, Basel, Switzerland. This article is an open access article distributed under the terms and conditions of the Creative Commons Attribution license ( http://creativecommons.org/licenses/by/3.0/).
Share and Cite
Yuan, Y.; Dai, Y. A Revised LRSPR Sensor with Sharp Reflection Spectrum. Sensors 2014, 14, 16664-16671. https://doi.org/10.3390/s140916664
Yuan Y, Dai Y. A Revised LRSPR Sensor with Sharp Reflection Spectrum. Sensors. 2014; 14(9):16664-16671. https://doi.org/10.3390/s140916664
Chicago/Turabian StyleYuan, Yinquan, and Yutang Dai. 2014. "A Revised LRSPR Sensor with Sharp Reflection Spectrum" Sensors 14, no. 9: 16664-16671. https://doi.org/10.3390/s140916664
APA StyleYuan, Y., & Dai, Y. (2014). A Revised LRSPR Sensor with Sharp Reflection Spectrum. Sensors, 14(9), 16664-16671. https://doi.org/10.3390/s140916664