Illumination of the Spatial Order of Intracellular pH by Genetically Encoded pH-Sensitive Sensors

Abstract
: Fluorescent proteins have been extensively used for engineering genetically encoded sensors that can monitor levels of ions, enzyme activities, redox potential, and metabolites. Certain fluorescent proteins possess specific pH-dependent spectroscopic features, and thus can be used as indicators of intracellular pH. Moreover, concatenated pH-sensitive proteins with target proteins pin the pH sensors to a definite location within the cell, compartment, or tissue. This study provides an overview of the continually expanding family of pH-sensitive fluorescent proteins that have become essential tools for studies of pH homeostasis and cell physiology. We describe and discuss the design of intensity-based and ratiometric pH sensors, their spectral properties and pH-dependency, as well as their performance. Finally, we illustrate some examples of the applications of pH sensors targeted at different subcellular compartments.1. Introduction
The regulation and homeostasis of pH within a cell and its subcellular compartments are crucial for the viability of any living cell, from the simplest prokaryotes to complex multicellular organisms. Stringent pH requirements are necessary for efficient metabolism, protein stability, ion channel activity, membrane trafficking, protein sorting, and proteolytic processing of proteins. Cellular compartments are protected from rapid, local changes in pH by intrinsic buffering capacity that is provided by various intracellular weak acids and bases. A more dynamic network for controlling intracellular pH (pHi) is pH homeostasis, which is composed of an ensemble of well-coordinated ion carriers, such as ion permeable channels, transporters, and pumps [1–4].
An important step forward in the understanding pH homeostasis has been achieved with the development of genetically encoded fluorescent pH-sensitive sensors, which provide a means for spatial and temporal imaging of pH dynamics. Fluorescent proteins (FPs) as intrinsic intracellular reporters have many advantages over conventional fluorescent dyes in live cell imaging. They are genetically encoded, therefore, no loading of dye is necessary, thereby enabling noninvasive imaging. The FPs can be precisely targeted to almost any organelle, compartment, or tissue. Moreover, FPs have been designed to respond to a greater variety of biological events and signals than conventional dyes. The sensors based on FPs have been used in living cells to report cellular concentrations of ions, second messengers cAMP and inositol phosphates, ATP, redox potential, reactive oxygen species, enzyme activities, and pH (review [5]).
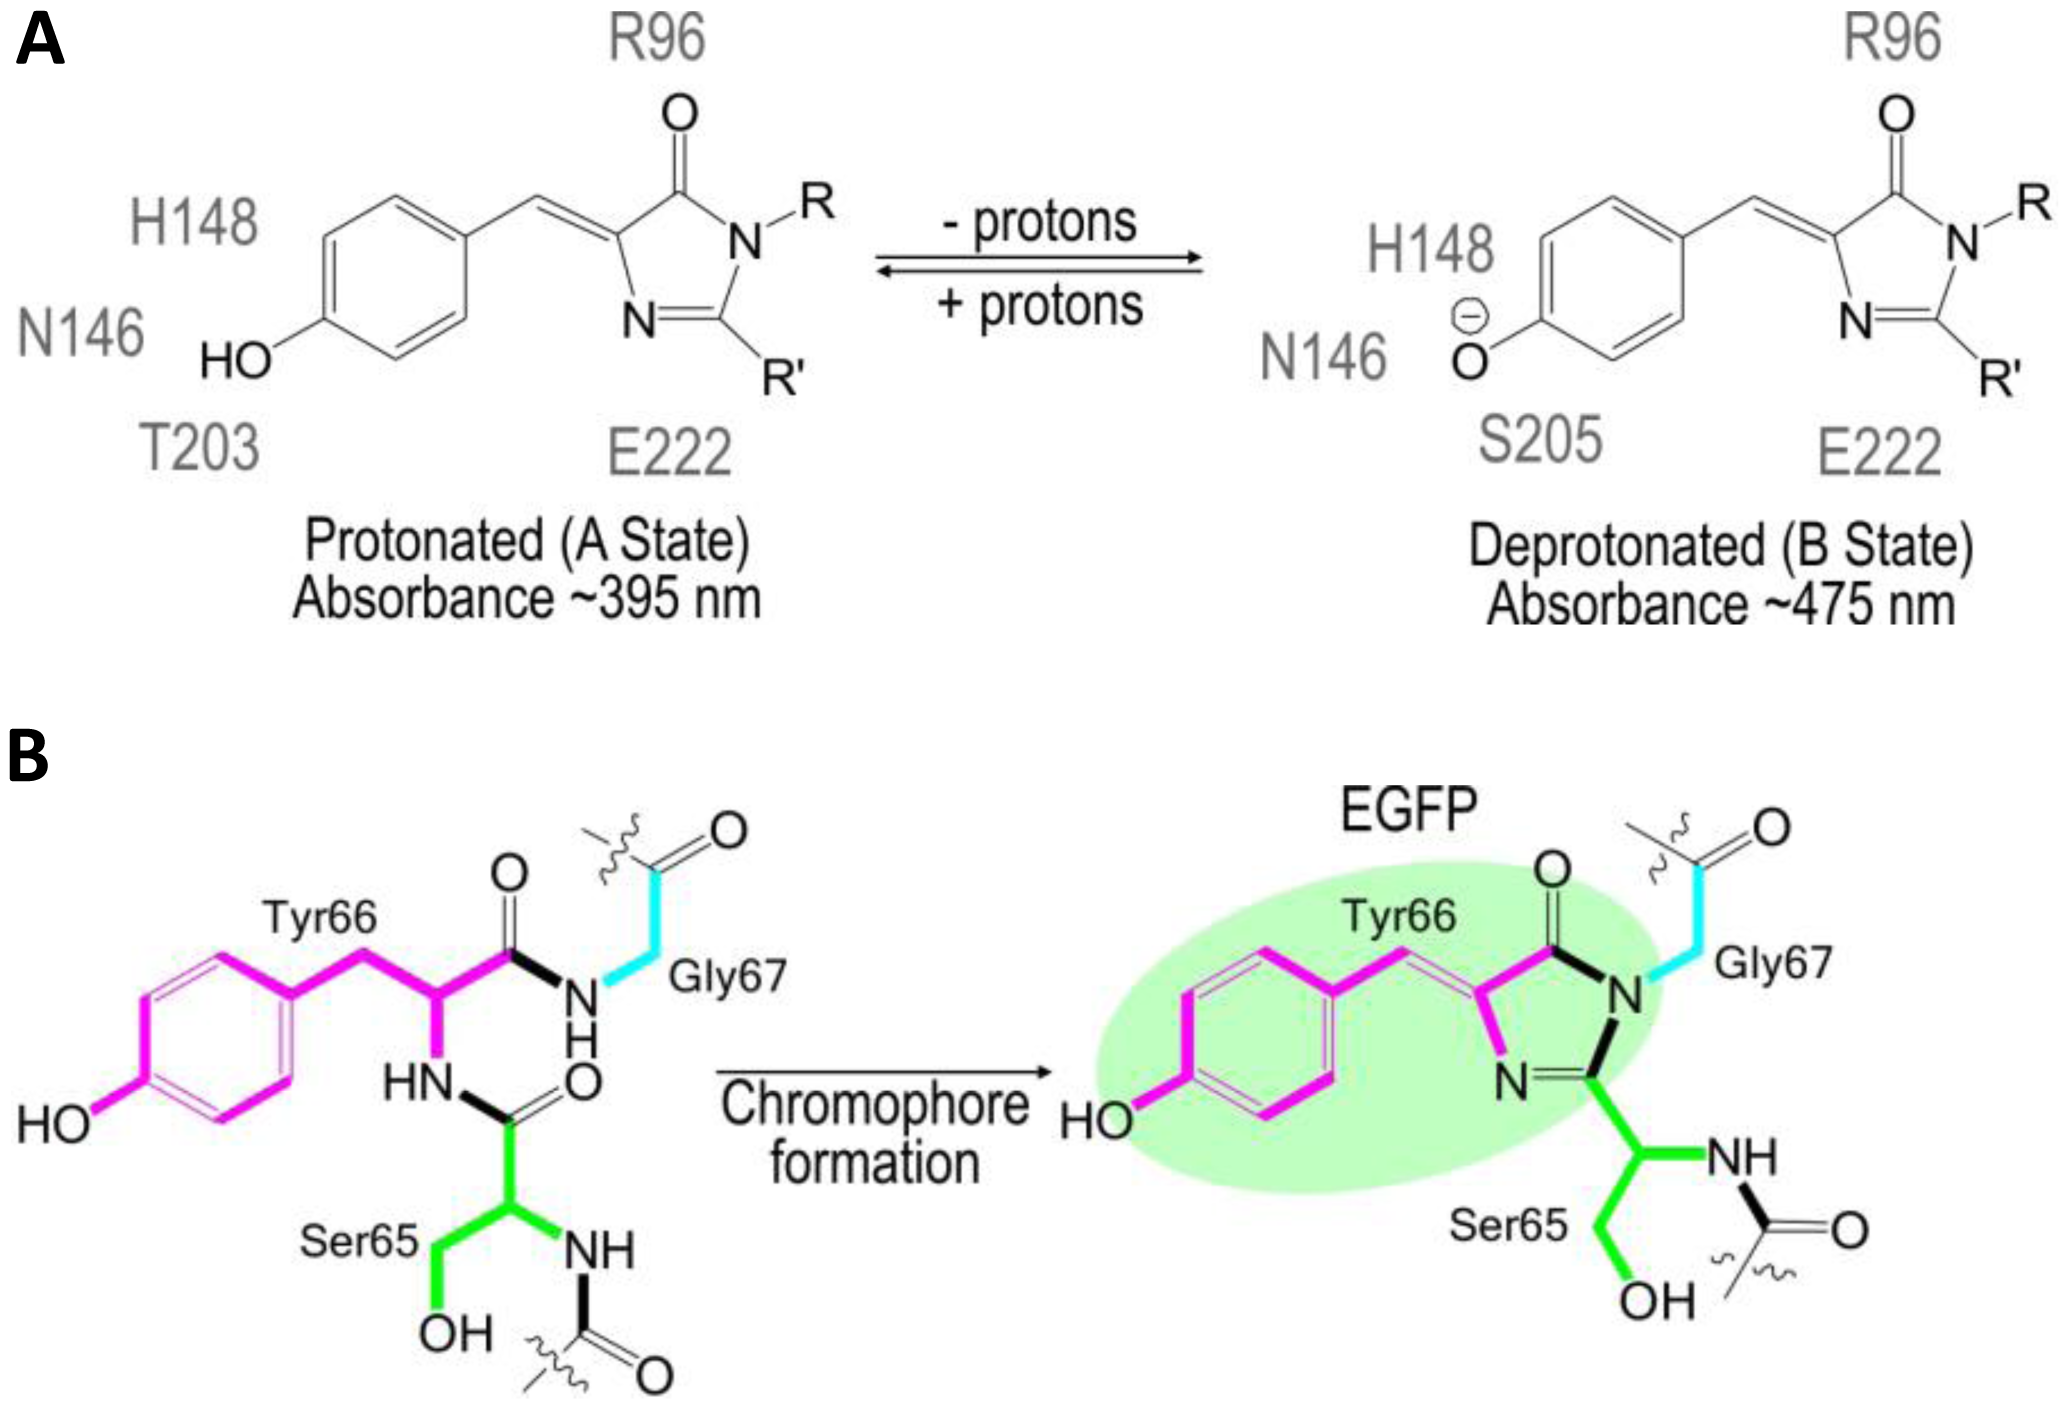
The use of FPs began with the identification and subsequent characterization of wild-type green fluorescent protein (wtGFP) from the jellyfish Aequorea victoria [5,6]. Within the β-barrel structure of GFP, three consecutive amino acids S65, Y66, G67 form by post-translational cyclization a chromophore that, by itself, is not fluorescent. Amino acids Q69, Q94, R96, H148, T203, S205, and E222 that are placed around the chromophore are necessary for GFP fluorescence [7]. These residues function as proton donors and acceptors and define spectral and photophysical properties of GFPs [8]. Bizzarri et al. [9] provide a detailed review of the physical and chemical characteristics of the chromophores of different GFP mutants. Briefly, the optical properties of protonated-neutral and deprotonated-anionic states differ among FPs. Among other parameters, pH also affects the equilibrium between protonated and deprotonated forms. Some FPs show pH-dependent absorption/ fluorescence spectra in the physiological pH range and are, therefore, used as pH sensors for live cell imaging (Figure 1).
Further, pH-sensitive FPs are divided in two groups: (i) intensity-based sensors and (ii) ratiometric pH-sensitive proteins with dual excitation and/or emission spectra. There is also a third group of pH-sensitive proteins—chimeric proteins, which are concatenated pH-sensitive FPs with another fluorescent or luminescent protein that gain novel pH-dependent spectral properties through fusion. Some of the most frequently used pH sensors are described below.
2. Intensity-Based pH Indicators
The protonated state of the wtGFP absorbs at 395 nm and emits at 508 nm, while the deprotonated state absorbs at 475 nm and emits at 503 nm [9]. The neutral, protonated state is progressively converted to the anionic, deprotonated state as the pH increases. The so-called intensity-based, nonratiometric pH sensors possess good pH responsiveness, but are characterized by very poor emission from the neutral chromophore (395-nm excitation). Due to the rather complex calibration of the intensity-based pH sensors, they are usually used to report changes in pHi rather than pHi itself. Many variations of pH-sensitive FPs have been created with random and targeted mutagenesis of the Aequorea wtGFP [5] or the Discosoma mRFP [10]. These FPs differ in terms of apparent pKa that defines an operational pH range of the sensor and by excitation/emission spectra that delineate the equipment used for analysis (Table 1).
Kneen et al. [11] were among the first to explore the possibility that the GFP could be used as a pH sensor in living cells. They synthesized four green GFP mutants with pKa values 6.0 (EGFP, GFP-F64L/ S65T), 5.9 (S65T), 6.1 (Y66H), and 4.8 (T203I). The absorbance and emission spectra of two S65T mutants are similar to that of the wtGFP with two absorption maxima at 390 and 490 nm, with the only excitation wavelength at 490 nm and emission at >510 nm. To evaluate the suitability of enhanced GFP (EGFP) as a pH sensor in living cells, the EGFP was expressed in cytosol, mitochondria, Golgi, and the endoplasmic reticulum of CHO and LLC-PK1 cells. Two other mutants (Y66H and T203I) have blue-shifted spectra with single maxima and parallel pH-dependent changes in absorbance and fluorescence [11]. In the same year, another blue-shifted pH sensitive protein was synthesized. Extensive mutagenesis of wtGFP generated an enhanced cyan GFP (ECFP); its absorption and emission spectra peak at 440 nm and 480 nm, respectively, with pKa 6.4 [12].
Independent of Kneen et al., Miesenbock et al. [13] generated a GFP mutant—termed ecliptic pHluorin—with pKa 7.1. Substitutions S147D, N149Q, T161I, S202F, Q204T, and A206T on wtGFP provoked a reduction in 395 nm excitation and an increase in 475 nm excitation, which is induced by a pH shift. During acidification, the e-pHluorin gradually loses fluorescence. The e-pHluorin is widely used for imaging vesicle fusion events because it is nonfluorescent at a pH lower than 6 at 475 nm excitation, but still weakly seen at 395 nm. A brighter version of the e-pHluorin, a superecliptic pHluorin (es-pHluorin) [14] contains two additional mutations, F64L and S65T, in the original ecliptic pHluorin, thereby leading to enhanced fluorescence with similar absorption/emission spectra. These two mutations are also characteristic of EGFP [11]. A plant ecliptic pHluorin—PEpHluorin [4]—is a fusion between a soluble-modified GFP (smGFP) [15] with F99S mutation and e-pHluorin with additional mutations M153T and V163A [4]. The presence of smGFP decreases pKa to 6.0 with an acidification-dependent decrease at excitation peaks 395 nm and 475 nm, recorded at 512 nm.
An enhanced yellow fluorescent protein (EYFP) has a yellow-shifted absorption and fluorophore emission with respect to conventional green FPs [12,17]. This shift in the spectra is the result of a T203Y substitution. Further, EYFP shows an acidification-dependent decrease in the absorbance peak at 514 nm, an emission peak at 527 nm, and a concomitant increase in the absorbance at 390 nm, which is nonfluorescent. An improved yellow FP mCitrine was generated by Q69M and V68L mutations to EYFP. These substitutions reduce sensitivity to chloride ions, improve maturation at 37 °C, and lower pKa to 5.7 [18,19]. The more acidic pKa classify mCitrine as a pH sensor suited for pH analysis of medial/trans-Golgi, as well as secretory and endocytic organelles [12].
Abad et al. [20] developed a sensor named mtAlpHi for analysis of mitochondrial alkaline pH with an apparent pKa of approximately 8.5. The sensor is composed of EYFP taken from camgaroo-2 [18]. A calmodulin from camgaroo-2 is replaced with aequorin, comprising 73 amino acids that contain second and third EF-hand domains. mtAlpHi undergoes changes only in fluorescent intensity upon pH changes; it is prone to potential artifacts of all nonratiometric indicators. However, the co-transfection with mtECFP largely circumvented this drawback.
Some pH-sensitive indicators have an excitation and emission shifted toward red spectra. These red-shifted FPs are particularly practical for multicolor labeling in combination with green or yellow FPs. Thus far, only pHTomato [24] and mNectarine [25] have been used for pH analysis in living cell imaging. The emission intensities of pHTomato are highly pH-dependent with a pKa of 7.8. Along the mtAlpHi [20], this is the highest determined pKa among intensity-based pH sensors, thereby making the sensor suitable for following mitochondrial pH [24]. The pH influences the fluorescence intensity of pHTomato, but not the excitation and emission waveforms. Conversely, the absorbance spectra of mNectarine [25] recorded at various pHs reveal complex changes in profile that appear to include a mixture of anionic cyan-absorbing (489 nm) and orange-absorbing (558 nm) forms of the protein at high pH, and a mixture of protonated violet-absorbing (387 nm) and blue-absorbing (453 nm) forms of the protein at low pH [25]. The apparent pKa of mNectarine is 6.9, with excitation at 558 nm and emission measured at 578 nm.
Recently, a new generation of pH-sensitive FPs has been developed with pKa values ranging from 5.3 to 6.5; however, they have not been tested as pH sensors in live cell experiments. The absorption/excitation spectrum for green FP mWasabi is narrower than that of EGFP with the same emission spectra; therefore, less cross-talk is expected when used in combination with blue- and cyan-shifted FPs [16]. The Clover is very bright yellow FP, with an acidic pKa of 6.2, thereby making it suitable for imaging pH changes of Golgi-network and secretory vesicles [21]. The FPs derived from the Discosoma mRFP are mainly red-shifted [23–26]. Further, Shaner et al. [22] developed two highly photostable mOrange variants by random and iterative mutagenesis. mOrange M163K and mOrange2— with pKa 7.5 and 6.5, respectively—exhibit enhanced photostability, efficient maturation, and increased pH sensitivity [22,23]. The other pH-sensitive red-shifted FPs are mRuby2, mKate2, mTangerine, and mKate. Their pKa varies from 5.3 to 6.2, which makes them suitable for imaging pH changes from <5.0 to 6.5 [21,26,27]. For example, the maturation of endosomes coincides with a pH reduction from 6.8 to <5.5 [1,28,29]. A drawback for mKate, mRuby2, and mTangerine pH sensors is that they are not very bright fluorophores with low quantum yield compared to other FPs. The problem can be elegantly solved by tethering two FPs, as done for mOrange [23].
3. Ratiometric Sensors Constituted by a Single Fluorescent Protein
The emission intensity of intensity-based pH indicators depends on the total concentration of fluorophore; therefore, it is difficult to determine whether observed changes in fluorescence are due to pH change or indicator concentration. An elegant way to circumvent the problem of the intensity-based pH indicators are ratiometric pH indicators that do not require an independent means of measuring the concentration of protein. Dual excitation ratiometric pH sensors have bimodal excitation spectra, and some also have dual-emission spectra with dose-dependent changes in excitation/emission at increasing acidity (Table 2). These features are an important advantage over the attributes of a single-wavelength FPs, such as e-pHluorin, because they make ratiometric sensors resistant to photo-bleaching and provide variability of indicator loading.
The first study on ratiometric GFP by excitation was that of Miesenbock et al. [13]. Ratiometric GFP also called ratio-pHluorin (r-pHluorin), and displays an increase in fluorescence at 508 nm after a 475-nm excitation concomitantly with a decrease after a 395-nm excitation upon a pH shift from 7.5 to 5.5, with apparent pKa of 6.9. The functionality of r-pHluorin has been initially tested expressed in trans-Golgi network, endosomes, and synapses. Subsequently, a modification to r-pHluorin was introduced to enhance the brightness of pHluorin, which was achieved with additional mutations F64L and S65T [30], which are characteristic for EGFP [11]. pHluorin2 is used for pH analysis in human cell lines and yeast Saccharomyces cerevisiae [30,31]. Further, a M153R mutation in the r-pHluorin increases the brightness of e-pHluorinM153R and its in vivo stability, while it does not affect the 410/470 nm excitation ratios at various pH values [32]. The r-pHluorin with mutation A206K named RaVC has been used to study the pHi of the filamentous fungus Aspergillus niger [33,34]. A plant dual-excitation ratiometric pHluorin, PRpHluorin—which is similar to PEpHluorin [4]—is a fusion between a soluble modified GFP (smGFP) [15] with F99S mutation and pHluorin with additional mutations M153T and V163A [4]. The presence of smGFP decreases pKa to 6.6 with no effect on the spectral waveforms of pHluorin.
Hanson et al. [35] introduced four ratiometric sensors named deGFP1 (S65T, H148G, and T203C), deGFP2 (S65T, C48S, and H148C), deGFP3 (S65T and T203C), and deGFP4 (S65T, C48S, H148C, and T203C) that are ratiometric by emission. The deGFPs have a pKa ranging from 6.8 to 8.0. With acidification, with the excitation of deGFPs at 400 nm, a green emission (peak at 515 nm) converts to a blue one with a peak at 460 nm. In addition, the anionic chromophore is directly excited at 480–500 nm, and only a green emission is detected. Therefore, the pH-dependent dual emission is defined at 460 and 515 nm for excitation of a neutral chromophore at 400 nm. The deGFPs are very promising for bioimaging applications, particularly for two-photon excitation.
E2GFP, a GFP (F64L, S65T, T203Y) variant [36], belongs to the yellow FP class and displays ratiometric characteristics similar to deGFPs [35]. The E2GFP is an excellent ratiometric sensor by excitation (e.g., λx 458 and 488 nm; λe 500–600; pKa 6.9) and by emission (λx 458 nm; λe 475–525 and 515–600 nm; pKa 7.5). The sensor is quenched by halide ions, but the ratiometric measurements are not affected due to its ratiometric characteristics. Subsequently, E1GFP [37] was developed; it is spectroscopically similar to E2GFP, but less sensitive to halide ions and with a pKa ranging from 6.4–6.6; therefore, it is more tailored for mildly acidic intracellular compartments. The fluorescence spectra are consistent with the presence of two pH-interconverting forms. Excitation at 408 and 473 nm yields a pH-dependent emission spectra with a peak at 508–510 nm, which is red-shifted (peak at 523 nm) as the pH increases. Further, for live cell imaging, two excitation-wavelength ratiometric setups were used: excitations 488 nm and 458 nm or 488 nm and 406 nm with an emission interval of 500 to 600 nm.
The sea cactus Cavernularia obesa GFP (CoGFP)—like deGFP and EnGFP—has pH-sensitive, ratiometric dual-excitation/emission properties, and dual-color emission maxima upon single-wavelength excitation [38]. The excitation at 388 nm leads to blue fluorescence with a peak at 456 nm at pH 5 and below, and green fluorescence with a peak at 507 nm at pH 7 and above. Excitation at 498 nm triggers green fluorescence with a peak at 507 nm from pH 5–9. Further, fluorescence at 507 nm is ratiometric to that at 456 and 388 nm excitation, with pKa 6.5. Additional mutations to wtCoGFP generated either brighter fluorescence or different spectral characteristics. It must be noted that only variant-0 has been tested further in live cell imaging.
Shulte et al. [39] developed a novel GFP variant isolated from the orange seapen Ptilosarcus gurneyi with good pH responsiveness and excellent dynamic ratio range. The Pt-GFP is ratiometric by excitation; however, the pH dependency of the fluorescence spectra is just opposite to that of pHluorin. The Pt-GFP with pKa 7.3 displays an increase in 540-nm fluorescence after a 390-nm excitation concomitantly with a decrease after a 510-nm excitation upon a pH shift from 7.5 to 5.5. The Pt-GFP sensor is also stable at a pH below 5, which is an advantageous feature when organelles with low pH are labeled.
Thus far, only one red-shifted ratiometric pH sensor has been identified. Tantama et al. [40] engineered a ratiometric pH sensor, pHRed by mutagenesis of the long Stokes-shifted fluorescent protein mKeima. The peak fluorescence emission of pHRed occurs at 610 nm. The acidification from pH 9 to 6 causes a 7-fold increase in the 585 nm peak intensity and a 4-fold decrease in the 440 nm peak intensity; both peaks respond with a pKa of 7.8. Moreover, pHRed exhibits a pH-dependent fluorescence lifetime that makes the pHRed suitable for imaging intracellular pH by fluorescence lifetime imaging microscopy (FLIM).
SypHer [41], a ratiometric circularly permutated YFP HyPer [42] with C199S mutation, is the only ratiometric pH sensor with a pKa of above 8. The pKa of 8.7 permits accurate measurements of mitochondrial pH. The fluorescence intensity at 535 nm increases markedly with pH at an excitation wavelength of around 490 nm and mildly decreases at an excitation wavelength of 405 nm.
4. Other genetically Encoded pH Sensitive Sensors
By joining two or more FPs with different pH-dependency of fluorescence spectra, a new chimeric FP with novel excitation/emission spectra and altered pH-dependency is synthesized (Table 3). This approach is mainly used to convert intensity-based FPs to ratiometric pH sensors. Using a synthetic biology approach, we can generate numerous combinations of FPs and tailor the FPs to our requirements.
Three novel ratiometric pH sensitive sensors GFpH, YFpH [43], and pHERP [44] were obtained by fusing GFPuv, a low-pH sensitivity mutant excitable at 380 nm, with an intensity-based pH sensitive GFP, EGFP, or EYFP. The YFpH and pHERP sensor are both fusions of GFPuv and EYFP, with changed order of named FPs. When excited at 380 nm and 480 nm, the GFpH emits at 510 nm. The pKa of GFpH is 5.6 (380 nm excitation) and 6.2 (480 nm excitation) and the apparent pKa is 6.2. The fluorescence maximum of YFpH and pHERP is 527 nm when excited at 480 nm and the apparent pKa is 6.5. Upon excitation at 380 nm, the emission of YFpH and pHERP shifts from 527 nm to 506 nm with the acidification.
Arosio et al. [45] developed the ratiometric sensor ClopHensor that is suited for real-time optical detection of chloride ions and pH in live cells. The ClopHensor exploits the spectral and chemical characteristics of the E2GFP anion-binding site [36] that is linked to the DsRed, a fluorescent protein, which is insensitive for protons and chloride ions. With tethering E2GFP to DsRed, the pH-sensitive spectral characteristics of E2GFP remain unchanged. Mutations H148 and V224L of ClopHensor shift pKa to more alkaline values and improve affinity for chloride ions [46].
pHusion [47] is composed of a tandem concatenation of EGFP and mRFP1, and also function as a ratiometric pH sensor. To obtain a 1:1 stoichiometry, the two fluorescent proteins are fused by a short peptide linker, permitting for ratiometric measurements of pH changes, where mRFP1 functions as an intramolecular reference.
The concatenation of pH-sensitive with pH-insensitive FPs can be used for the combination of virtually any FPs, assuming that the excitation and emission spectra of concatenated FPs do not overlap. Such fusions are sensitive for photo-bleaching; moreover, more sophisticated equipment is required due to multi-excitation/emission spectral properties.
5. pH in Cellular Organelles
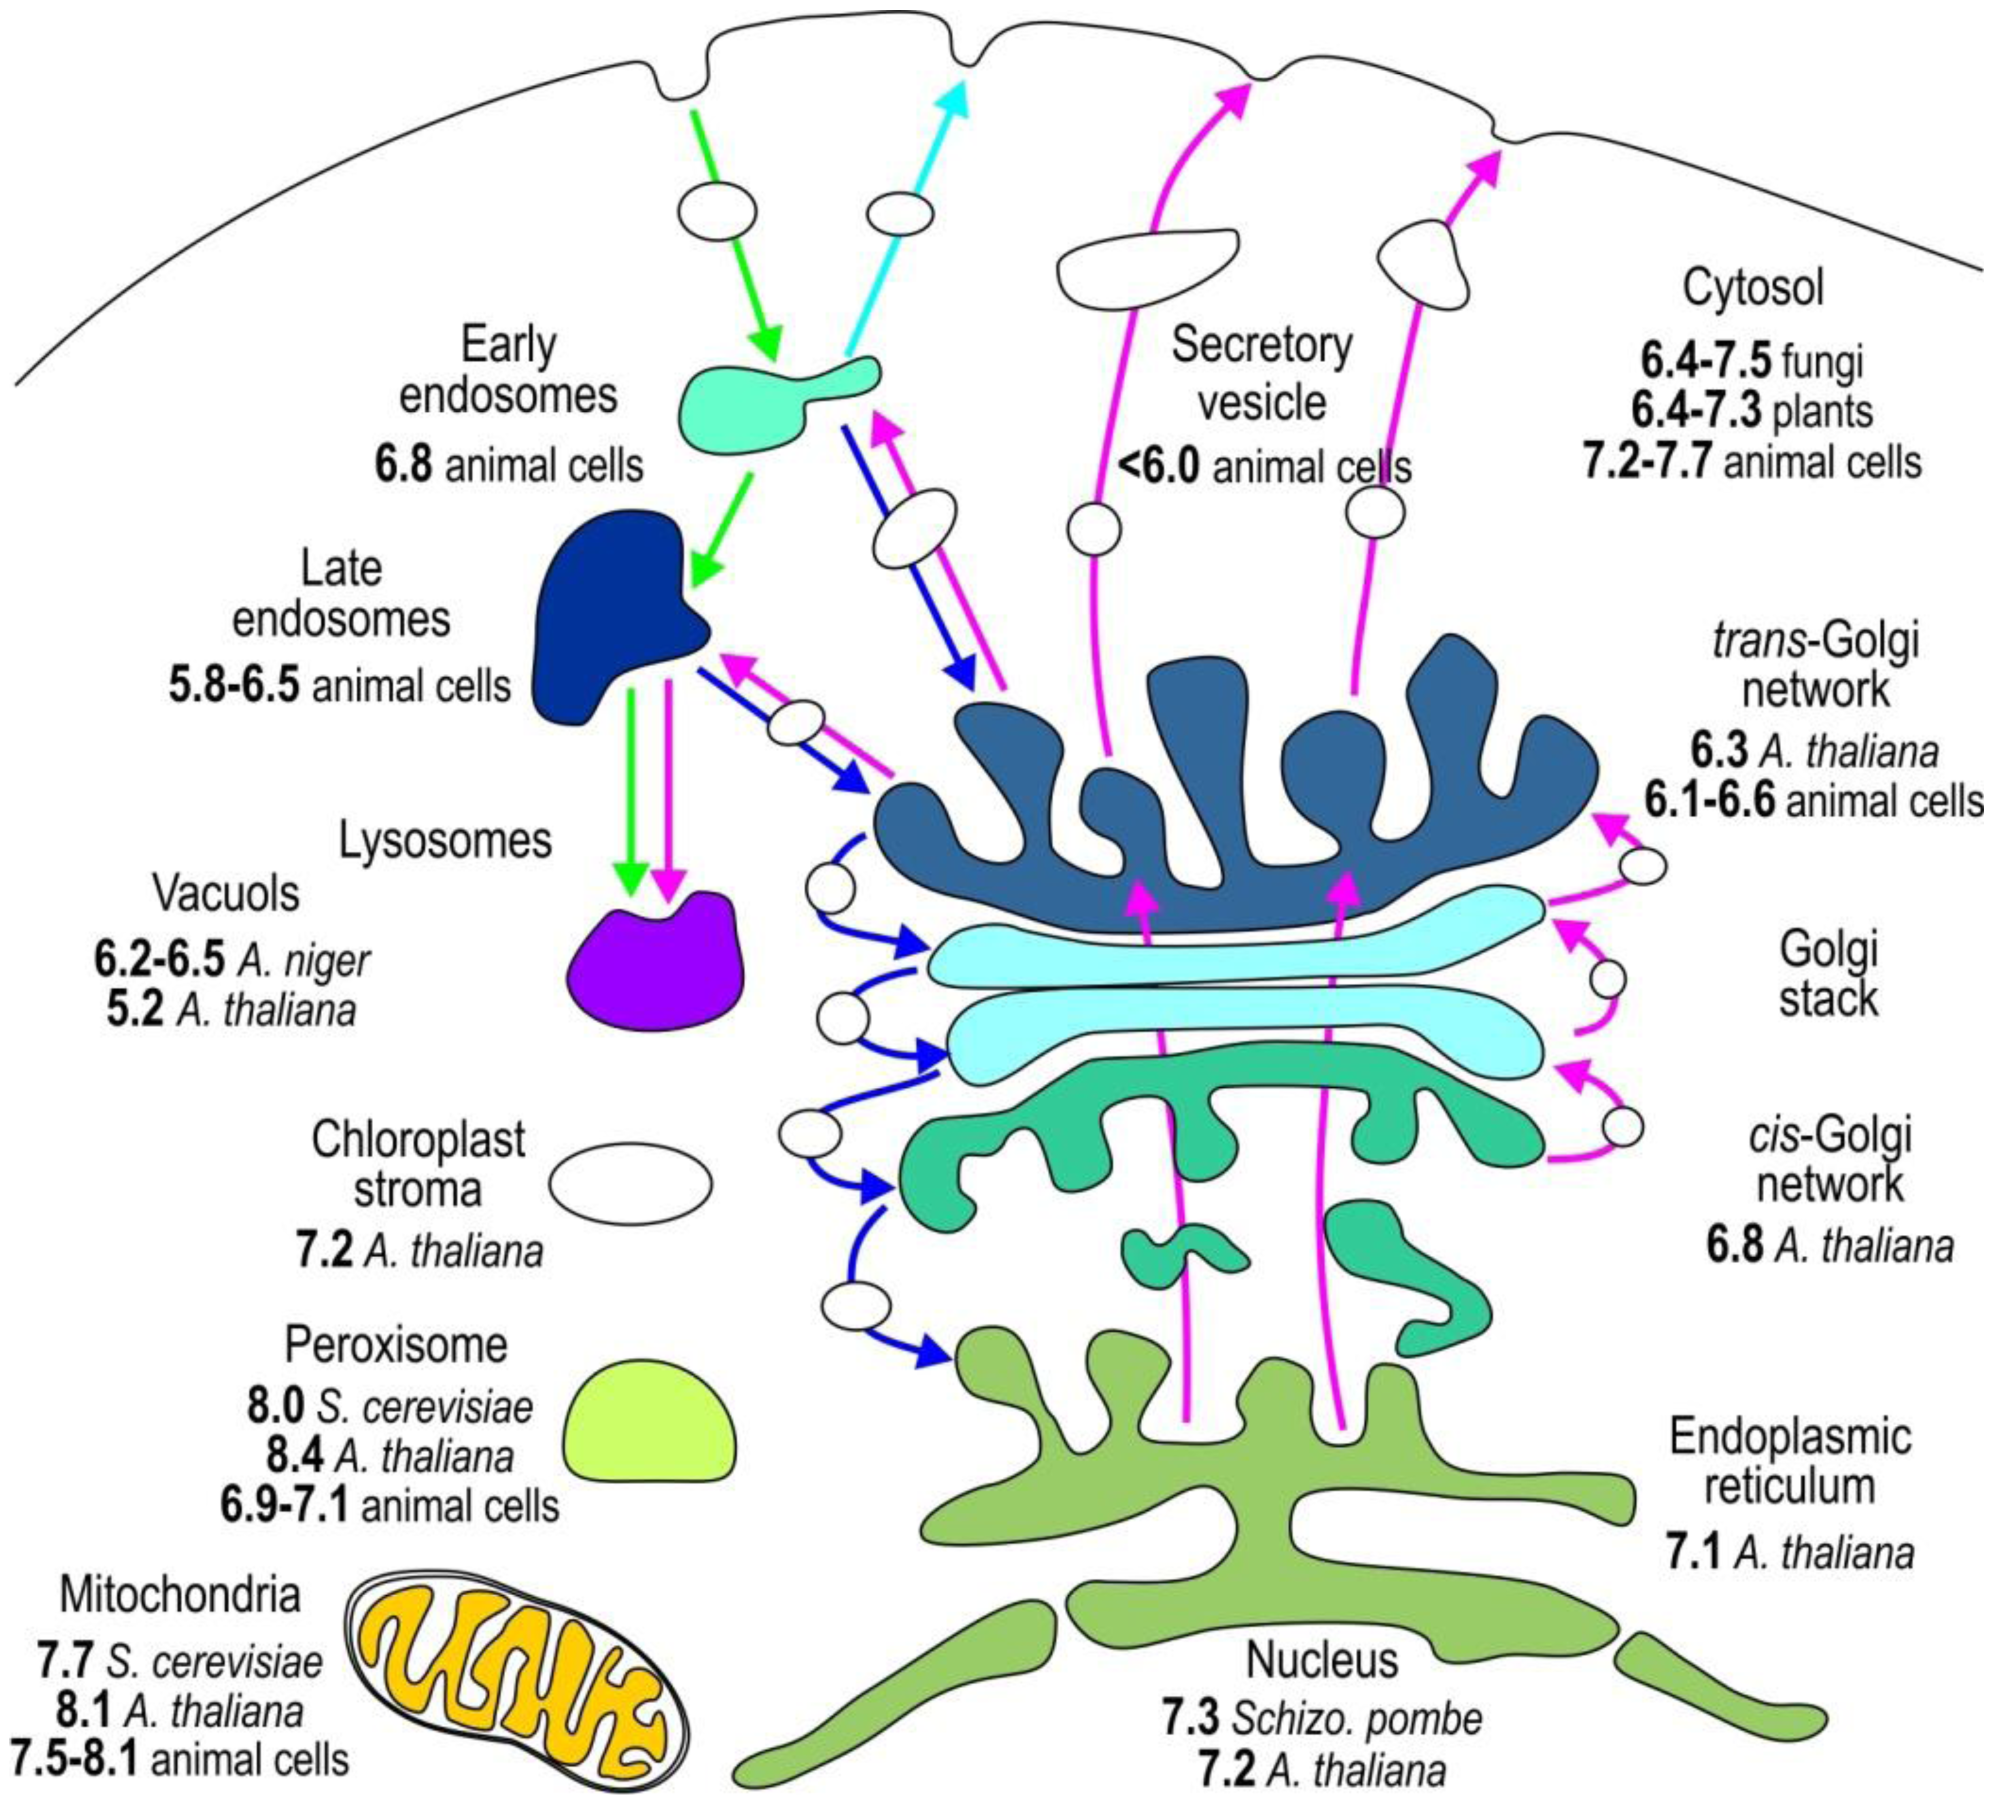
The compartmentalization of the eukaryotic cell provides distinct environmental conditions for the optimal operation of individual metabolic pathways. The function of individual organelles depends on the stringently regulated pH (Figure 2) because protons dictate the charge of macromolecules and generate transmembrane electric potential [1,3]. To study pHi in vivo, accurate pH determination is essential. In this section, we outline the genetically encoded sensors applied to monitor the pH of individual subcellular compartments (Table 4).
Most organelles, except nucleus, have their own specific pH value associated with the processes that occur in these compartments. The nuclear membrane has an abundance of pores that are a weak barrier for protons; therefore, nuclear pH (pHN) is similar to that of the surrounding cytosol. Both cytosolic pH (pHC) and pHN of various resting cells are slightly above neutral, between 7.2 and 7.7 (Figure 1, and see Tables 4, 5, 6 and 7 for references) [11,12,33,34,36,39,40,44,46,48]. To specifically relocate the pH sensor to the nucleus, a nuclear localization signal NLS is fused to pHluorin [4,49]. A cytosolic sublocation of pHluorin tethered with palmitoylation site, caveolin-1, α1B-adrenoreceptor, or hCTN3 revealed that the pH of these cytosolic microdomains is not uniform and is 7.3, 7.3, 6.8, or 6.5–7.5, respectively [25,43,46,50,51]. The pHC of yeasts S. cerevisiae, Candida glabrata, and Schizosaccharomyces pombe is highly influenced by environmental changes, such as nutrients and external pH. Their pHC differs from 6.4 when cells are starved to 7.5 when glucose is present in the media [31,49,52–55]. The pHC is also not uniform throughout plant tissues. The pHC of A. thaliana varies from 6.4 at the root cap to 7.3 in meristem cells, thereby proving the presence of significant pH gradients among different developmental regions in plant roots [4,15,47].
The pH sensors targeted to the lumen of endoplasmic reticulum via retrograde transport based on KDEL receptor show that the pH of endoplasmic reticulum (pHER) is very close to its pHC [4,11,56]. The luminal pH throughout the secretory pathway becomes progressively more acidic (Figure 2, Table 5). The cis-Golgi with pH 6.8 is more acidic than the endoplasmic reticulum [4], and the acidification becomes more apparent when the pH changes from 6.1 to 6.6 in the trans-Golgi network. Rivinoja et al. [57] used GT-EGFP to show that the medial/trans-Golgi pH in cancer cells MCF-7 and HT-29, SW-48, is significantly more alkaline (pH 6.75) than in control cells (pHG 5.9–6.5), thereby clearly emphasizing the importance of stringent pH homeostasis. Tagging subcellular domains of Golgi is rather difficult. Many Golgi proteins reside in endoplasmic reticulum for a short period of time, thereby indicating that proteins normally cycle between the Golgi and endoplasmic reticulum [58]. Furthermore, some Golgi proteins such as TGN38/46, a trans-Golgi network (TGN) protein [59], and GPP130, a cis-Golgi protein [60], cycle between the Golgi and endosomes. Directing the pH sensor to medial/trans-Golgi is achieved with N-terminal linking pHluorin to β-1, 4-galactosyltransferase [11,12,57,61], 2,6-sialyltransferase [44], and TGN38 in a trans-Golgi network [59]. ManI-PpHluorin—pHluorin fused with glycine max mannosyl-oligosaccharide 1,2-alpha-mannosidase—is used to specify the cis-Golgi luminal pH [4].
Due to the heterogeneity of secretory vesicles and their acidification during secretion, the analysis of vesicular pH presents a serious challenge (Table 6). Primarily, e-pHluorin is used for the analysis of vesicular dynamics; therefore, spatial and temporal pH changes rather than the pH of recycling vesicles are known. Synaptic vesicles maintain an acidic lumen with a resting pH value of 5.6 [13]. Therefore, instead of pHluorins, FPs with a pKa of almost 6 might be better suited for pH measurements of acidic subcellular compartments, including maturing endosomes. During the so-called process of de-granulation, lytic granules and synaptic vesicles release their content when fusing to the plasma membrane [62]. The dynamics of secretory vesicles have been studied using DsRed-FasL-es-pHluorin for visualizing fusion pore openings [62], VGLUT1-2xmOrange2, VGLUT1-pH, and synapto-pHluorin and SytIV-pHluorin for monitoring re-acidification of synaptic vesicles after endocytosis [11,13,14,23,24,63–66]. Since synaptophysin displays less background expression on the plasma membrane than synaptobrevin/VAMP2, synaptophysin is used for an improved sypHTomato reporter of vesicular turnover [24]. Dean et al. [67] used e-pHluorin to report the location and pH of organelles to which the synaptotagmin isoforms are targeted. Among 15 isoforms, only syt-1 and 2 are targeted to synaptic vesicles; the other 13 are located in dendrites and axons.
Spatial and temporal pH changes have been analyzed for many specialized vesicles, such as insulin secretory granules [68], large dense-core vesicles [45] and maturing endosomes [4,50,59]. pHluorin, ECFP, and E1GFP are targeted to vesicles through fusing the pH sensor to luminal site of proteins that are characteristic of those vesicles [4,30,50,56,59,68,69].
Peroxisomes [73], organelles that derived from endoplasmic reticulum, are involved in many different cellular functions, such as breakdown of fatty acids, polyamines and D-amino acids. r-pHluorin is directed to peroxisomes with peroxisomal targeting SKL/SRL peptide, and is used to measure peroxisomal pH, which range from 6.9 to 8.4 [4,55,70] (Table 7). A chitinase and an N-terminus of Rubisco activase (recA) protein fused to pHusion and PRpHluorin directed chimeric proteins to apoplasts and plastid stroma of Arabidopsis thaliana, respectively [4,47]. The pH of the cell cortex of Drosophila S2 cells was analyzed using pHMA sensor—pHluorin tagged to moesin [71].
Recent studies on mitochondrial pH present a good demonstration of the importance of the selection of a pH sensor that matches the pH of the subcellular compartment [74] (Table 7). The resting mitochondrial matrix pH (pHM) is markedly alkaline from 7.6 to 8.1 [4,11,12,20,40,41,55,72]. Previously, the pH sensors pHluorin, ECFP, EYFP, and ECFP with a pKa of approximately 7 have been used to measure pHM [11—13,74]. These sensors are insensitive to small pH changes at pHM; therefore, pHM dynamics are easily missed. Recent improvements in live cell fluorescence imaging have revealed that proton concentration rapidly fluctuates within individual mitochondria, as determined using mitoSypHer [39,75]. The pKa of ratiometric mitoSypHer is approximately 8, which is similar to the pKa of ratiometric pHRed [40] and intensity-based mtAlpHi [20] and pHTomato [24]—all of which are well-suited for pHM measurements.
6. Instrumentation
The intrinsic pH of studied subcellular compartments and the type of available equipment determine the selection of FPs for live cell imaging. Intensity-based pH sensors require a collection of data at one wavelength; therefore, rather basic equipment is necessary for one-wavelength intensity measurements. Conversely, a collection of fluorescence at two wavelengths is necessary for dual emission pH sensors; thus, instruments with multiple detectors and filters are needed. Dual excitation sensors, like ratiometric pHluorins, are analyzed with advanced equipment with two excitation sources. Moreover, the spatial analysis of pH within organelles is greatly benefitted with equipment that has a good resolution in Z-direction. Therefore, confocal microscopy is favored over wide-field fluorescent microscopy. The recent developments of highly effective imaging setups with improved resolution and speed, as well as supercontinuum laser have greatly improved the detection of pH in cultured cells and living organisms.
A traditional fluorescence spectroscopy is the most extensively applied technique for analyzing the pHi of yeast when pHluorin is used as a pH sensor [51–54]. Although spectroscopy rapidly records the average pHi of a population, it provides insufficient single-cell information.
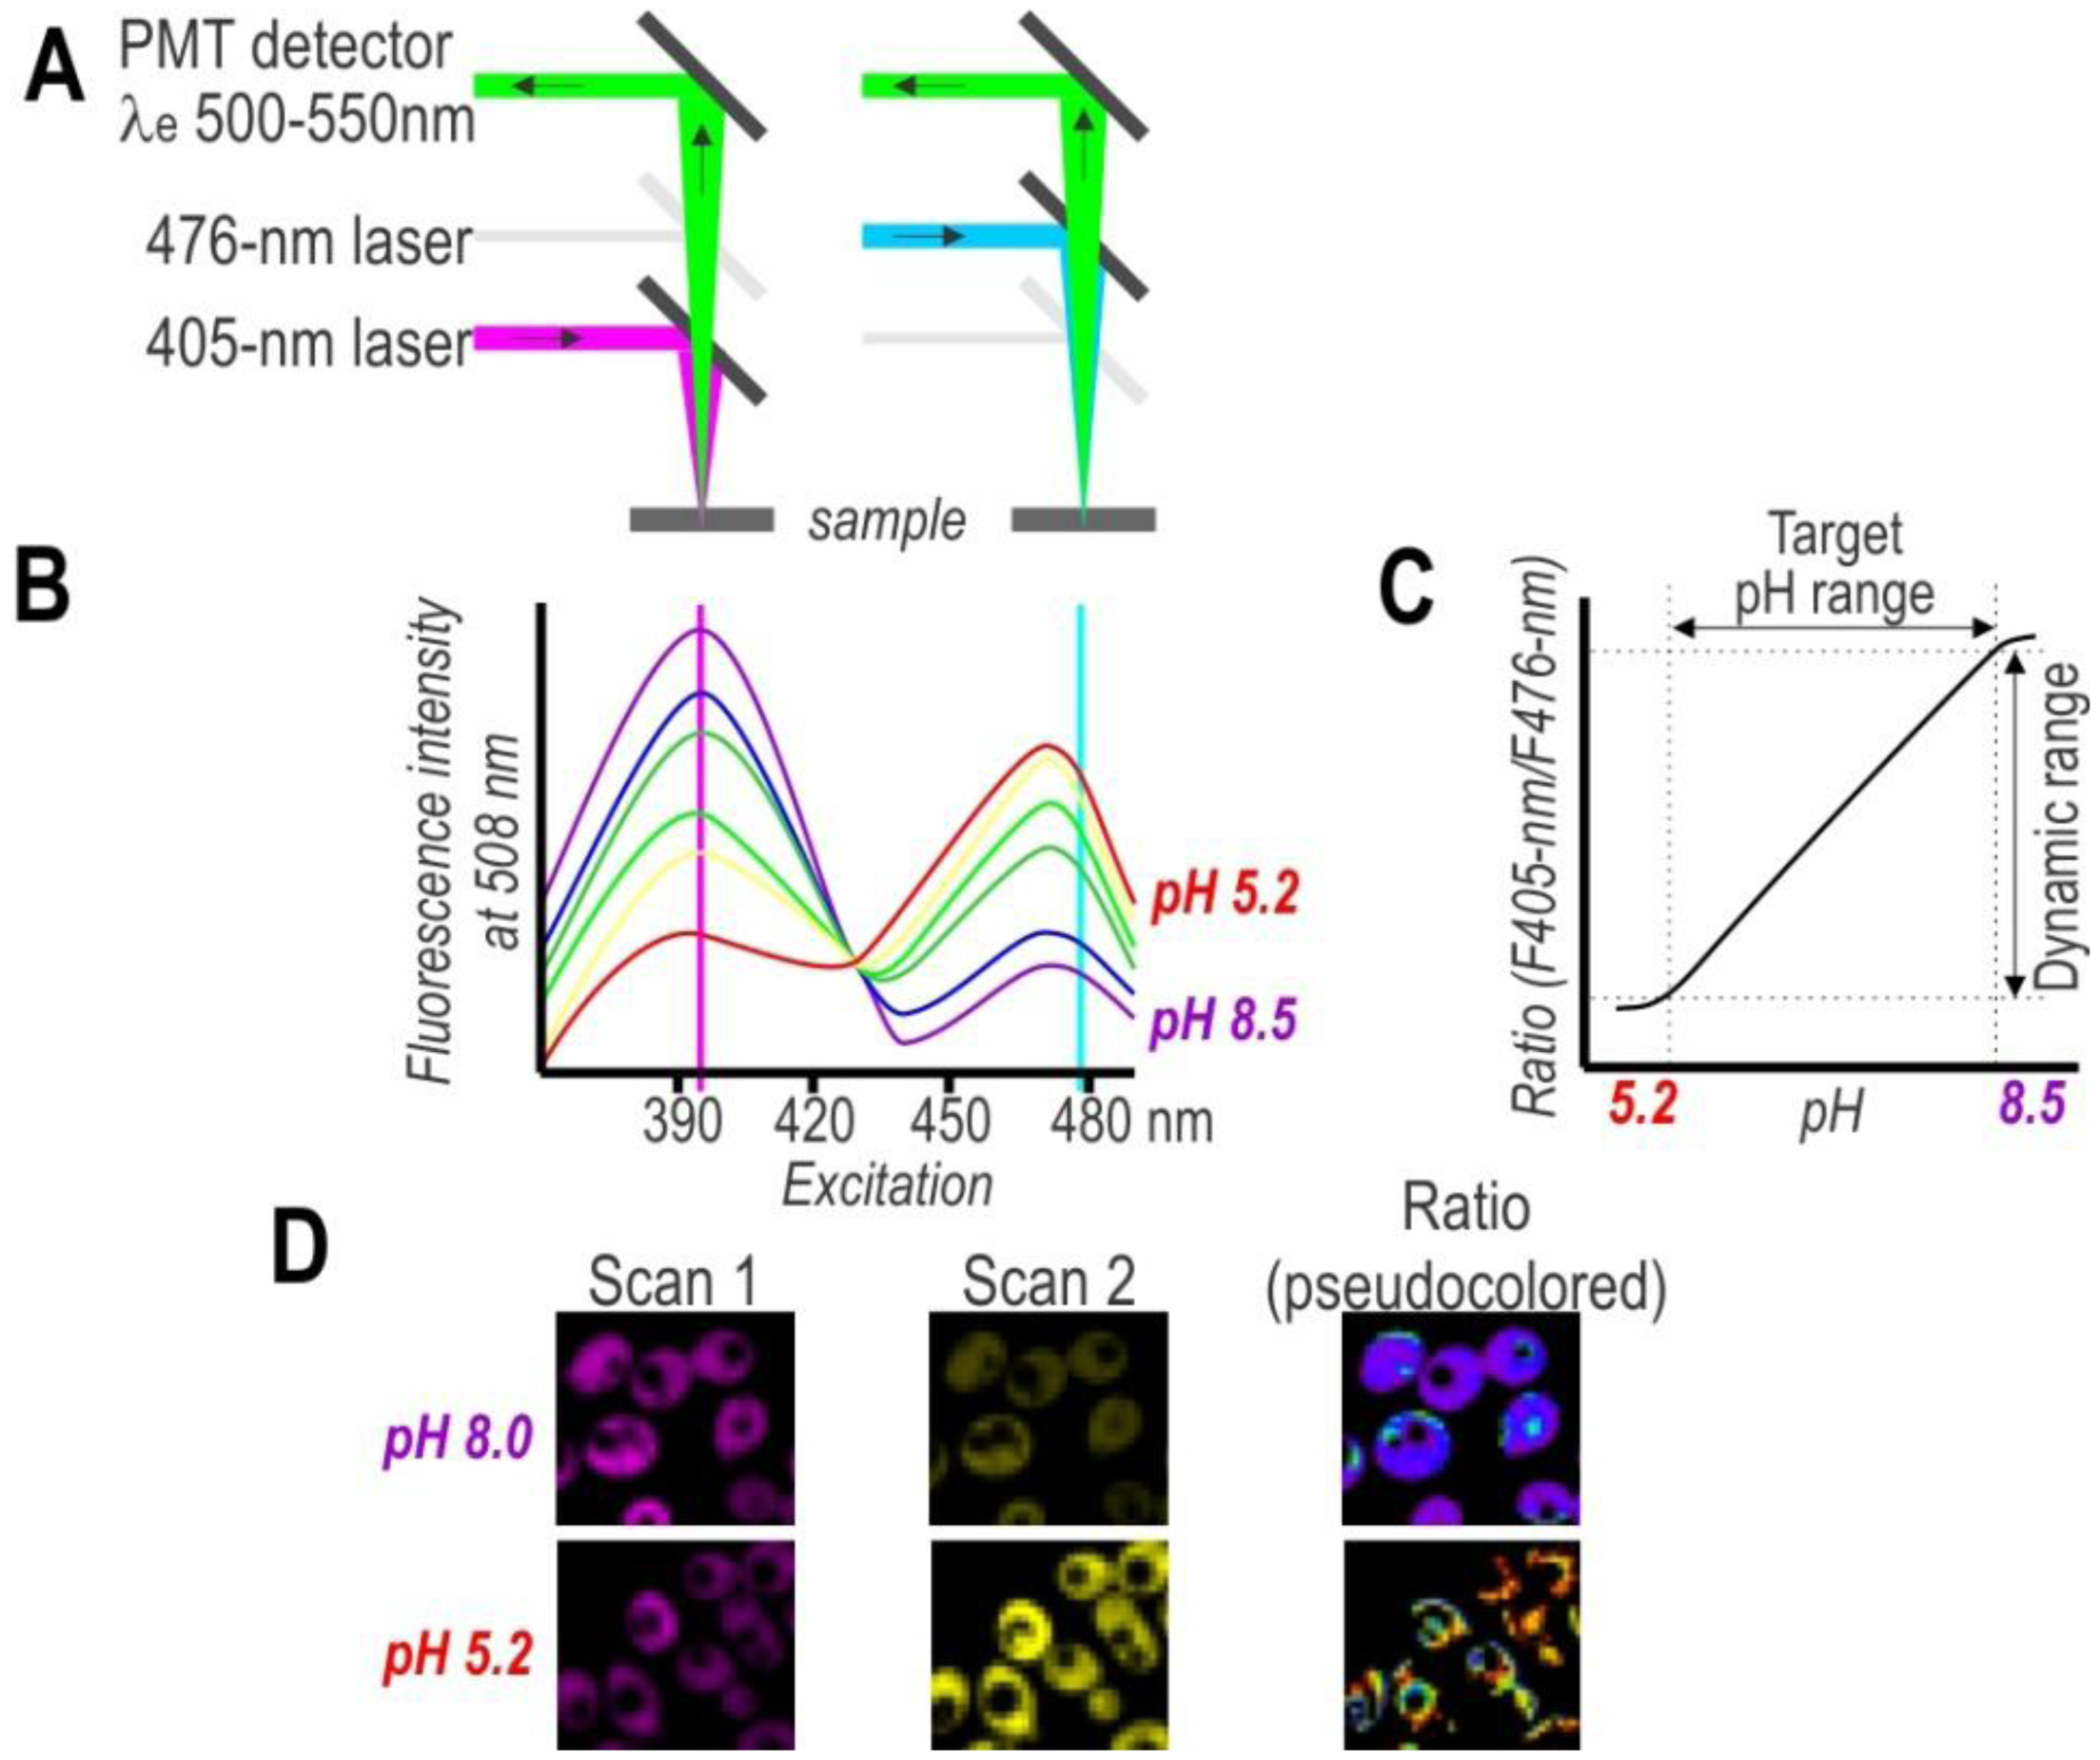
On the other hand, single-cell analysis offers more detailed insight into population variability, thereby facilitating a considerably deeper understanding of cell physiology. To obtain spatial distribution and a detailed mapping of the pH in single cells, researchers have used pH-sensitive FPs in combination with fluorescence microscopy (Figure 3). Despite the advantages of this approach, the primary drawback of this technique is the need to post-process images for evaluating subpopulation content. Nonetheless, the development of confocal microscopy revolutionized biological sciences and provided great tools for cellular imaging on a subcellular level. Thus, confocal microscopy with excellent resolution (xy 0.2–0.5 µm and z 0.6–1.5 µm) provides a very effective way to obtain high-resolution pH maps.
Historically, equipment dictated the evolution of fluorescent dyes and FPs. Therefore, cyan, green, and yellow FPs whose excitations correspond to the emission lines of the most widespread Argon laser are best studied (Table 1). Subsequently, microscopes equipped with violet and red laser along with Argon laser promoted the evolution of red- and far red-shifted FPs, as well as ratiometric pH sensors by excitation (Table 2). Advanced confocal microscopes equipped with multiple independent detectors permit simultaneous collection of several fluorescence signals, which agrees with ratiometric sensors by emission (deGFP [35], EnGFP [36,37], Wt-CoGFP [38], and pHusion [47]) and multicolor labeling. Multiphoton microscopy in cases of low photo-toxicity and photo-bleaching is an alternative to single-photon excitation confocal microscopy. The deGFPs and EnGFPs have the potential of two-photon ratiometric indicators [35–37,48]. Further, fluorescence life time microscopy (FLIM) offers an alternative solution for life cell imaging. pHRed [40] and ECPF [69] exhibit a pH-dependent fluorescence lifetime that can be used to image intracellular pH.
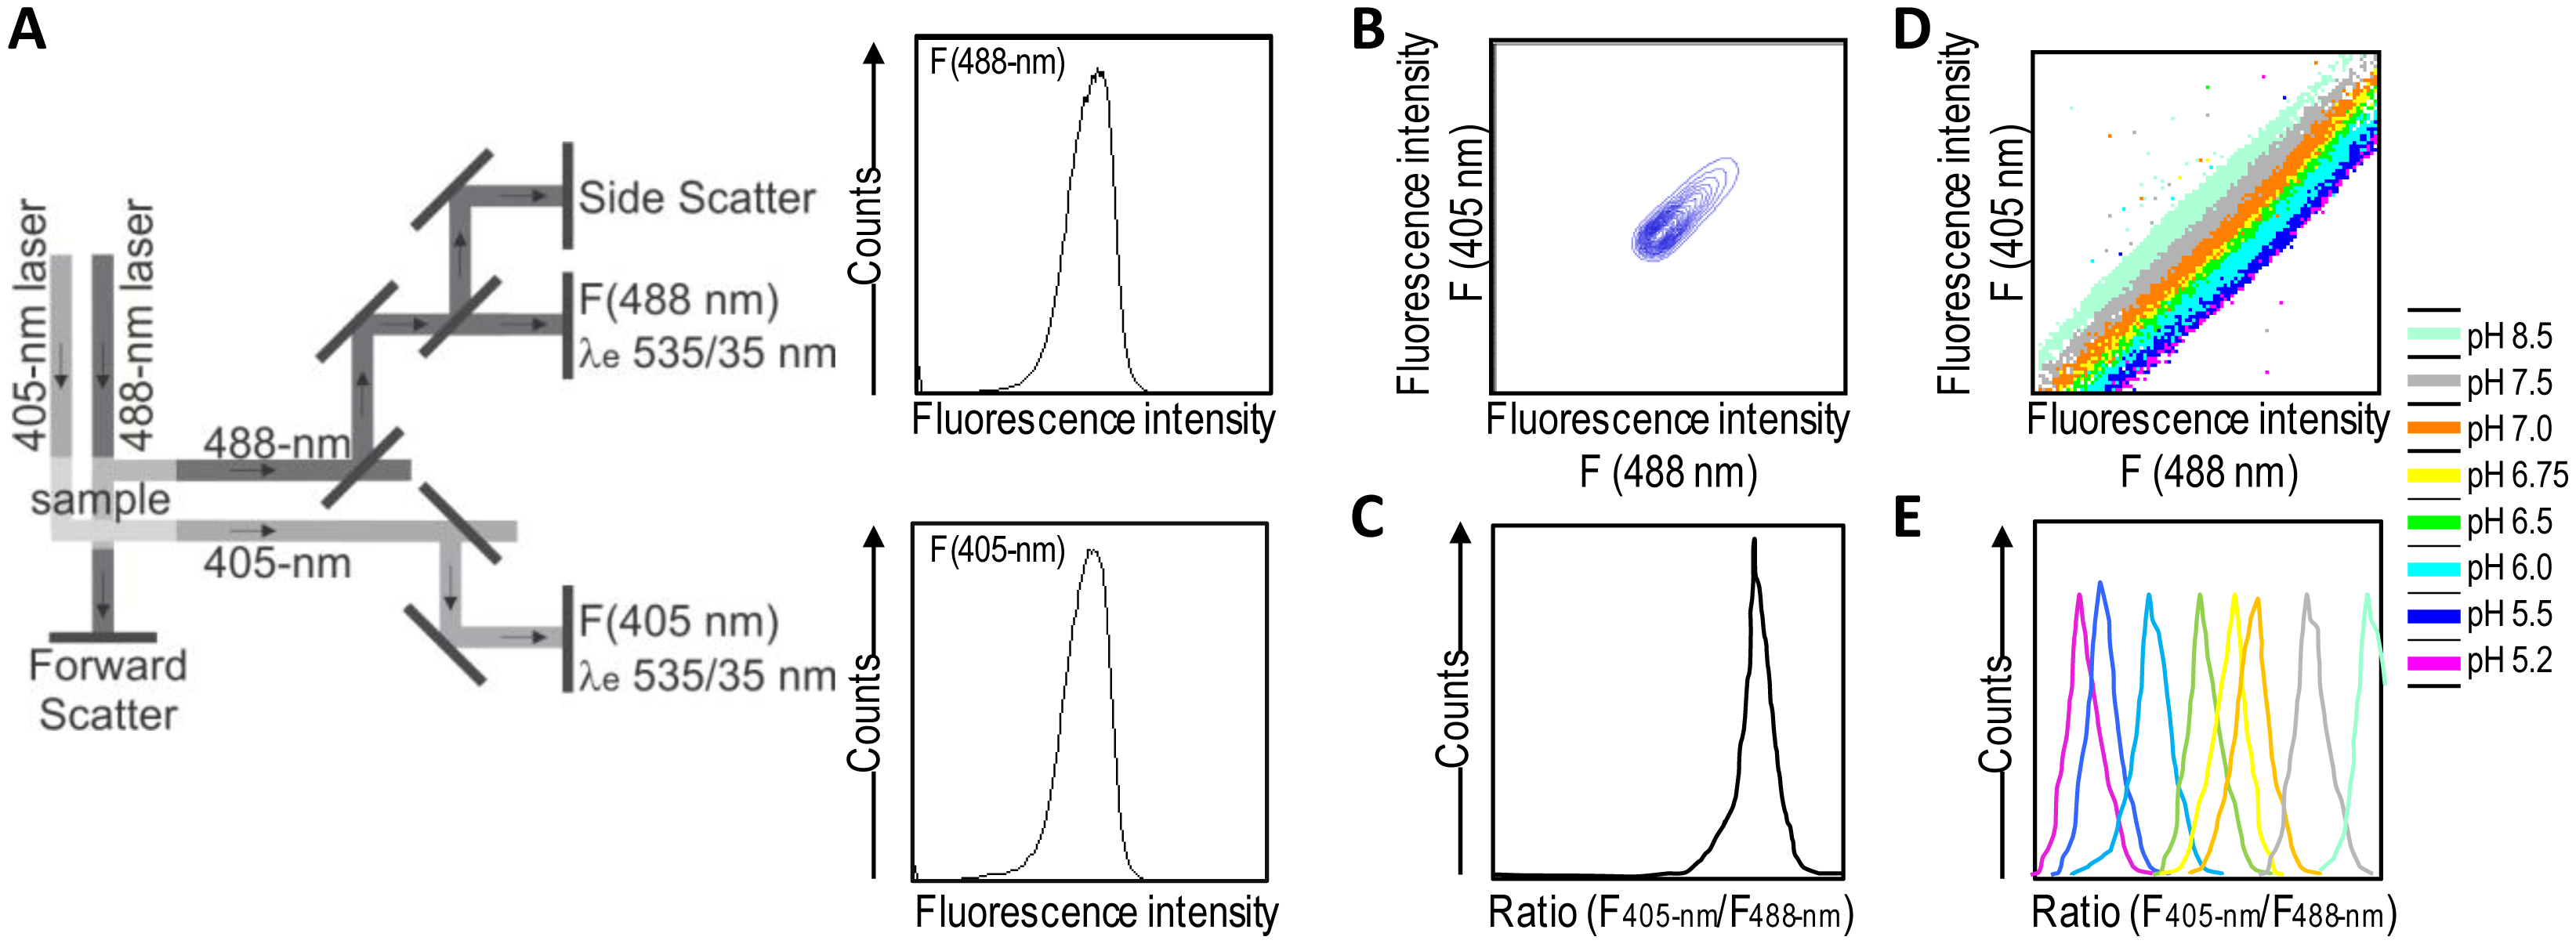
A good alternative to spectroscopy and microscopy is flow cytometry, which combines rapid high-throughput, analysis, and acquisition of multiparameter results at the single-cell level for each cell in a population. For the dual excitation of all pHluorin-based ratiometric pH probes, a flow cytometer equipped with split optics for 405- and 488-nm light paths is necessary [31,55] (Figure 4). After excitation with 488-nm and 405-nm laser light, green fluorescence is detected in separate channels, and the ratios of two fluorescence parameters (i.e., F405-nm and F488-nm) are calculated for every cell by dividing the emission signals. Finally, to correlate ratios with pH, a calibration curve that links fluorescence intensity ratios to pH is generated.
Ratiometric flow cytometry goes beyond microscopy for high-throughput analysis and screening with automatic post-processing of obtained data. Conversely, it does not permit the monitoring of particular individual cells over time, thereby making it a complementary solution rather than a replacement for microscopy techniques.
7. Conclusions
Undoubtedly, the maintenance of an appropriate pH within individual membrane-enclosed compartments is important for normal physiology of the cell and organelles. Over the previous decade, considerable progress has been made in understanding the pH regulatory mechanisms of the cell that progress in tandem with recent developments of highly effective imaging setups and genetically encoded pH-sensitive fluorescent sensors. In merely fifteen years, we have witnessed an expansion in genetically encoded pH-sensitive fluorescent proteins. pH sensors span almost the entire visible spectrum from green to red and with pKa that extends over the entire physiological pH range. Most modern FPs have been modified by random and/or iterative mutagenesis to optimize, improve, or enhance fluorescence characteristics and their stability as proteins. The sensors for virtually any subcellular location have been engineered from only a few building blocks. The interplay of sophisticated imaging techniques and transgene pH sensors has provided a very effective method for obtaining spatial and temporal high-resolution pH maps and the ability to monitor signaling dynamics on single-cell and subcellular levels.
In this review, we have described pH-sensitive fluorescent proteins that we consider to be useful or as having potential for generating novel sensors for live cell applications. The trend in the evolution of pH sensors is oriented toward generating brighter, photostable yellow and red ratiometric FPs to limit the cell damage that might be caused by the illumination of the fluorophore. Advances have been made for pH-sensitive FPs with narrow excitation and emission peaks to suit multicolor labeling. The narrow spectral peaks minimize the crosstalk between fluorophores, thereby providing more accurate results in multicolor analysis. With regard to developments in equipment, pH sensors that are suited for fluorescence lifetime microscopy and two-photon laser scanning fluorescence microscopy have been engineered. Transgene pH sensors are already changing the boundaries of our understanding of in vivo cellular pH dynamics at scales from the subcellular to the entire organism. Further, pH-sensitive FPs expressed in the cell and subcellular compartments provide the most physiologically relevant information on the spatial and temporal behavior of pH homeostasis. Overall, we anticipate that this overview will help in deciding which pH-sensitive fluorescent protein should be selected for forthcoming cellular imaging experiments, and how the selected pH sensor could be applied to obtain accurate answers to various questions in this regard.
Acknowledgments
This research was supported by the Slovenian Research Agency and EN-FIST, Centre of Excellence.
Conflicts of Interest
The authors declare no conflicts of interest.
References
- Casey, J.R.; Grinstein, S.; Orlowski, J. Sensors and regulators of intracellular pH. Nat. Rev. Mol. Cell Biol. 2010, 11, 50–61. [Google Scholar]
- Benčina, M.; Bagar, T.; Lah, L.; Kraševec, N. A comparative genomic analysis of calcium and proton signaling/homeostasis in Aspergillus species. Fungal Genet. Biol. 2009, 46, S93–S104. [Google Scholar]
- Orij, R.; Brul, S.; Smits, G.J. Intracellular pH is a tightly controlled signal in yeast. Biochim. Biophys. Acta. 2011, 1810, 933–944. [Google Scholar]
- Shen, J.; Zeng, Y.; Zhuang, X.; Sun, L.; Yao, X.; Pimpl, P.; Jiang, L. Organelle pH in the arabidopsis endomembrane system. Mol. Plant 2013, 6, 1419–1437. [Google Scholar]
- Day, R.N.; Davidson, M.W. The fluorescent protein palette: Tools for cellular imaging. Chem. Soc. Rev. 2009, 38, 2887–2921. [Google Scholar]
- Prasher, D.C.; Eckenrode, V.K.; Ward, W.W.; Prendergast, F.G.; Cormier, M.J. Primary structure of the Aequorea victoria green-fluorescent protein. Gene 1992, 111, 229–233. [Google Scholar]
- Brejc, K.; Sixma, T.K.; Kitts, P.A.; Kain, S.R.; Tsien, R.Y.; Ormö, M.; Remington, S.J. Structural basis for dual excitation and photoisomerization of the Aequorea victoria green fluorescent protein. Proc. Natl. Acad. Sci. USA 1997, 94, 2306–2311. [Google Scholar]
- Scharnagl, C.; Raupp-Kossmann, R.; Fischer, S.F. Molecular basis for pH sensitivity and proton transfer in green fluorescent protein: Protonation and conformational substates from electrostatic calculations. Biophys. J. 1999, 77, 1839–1857. [Google Scholar]
- Bizzarri, R.; Serresi, M.; Luin, S.; Beltram, F. Green fluorescent protein based pH indicators for in vivo use: A review. Anal. Bioanal. Chem. 2009, 393, 1107–1122. [Google Scholar]
- Shcherbakova, D.M.; Subach, O.M.; Verkhusha, V.V. Red fluorescent proteins: Advanced imaging applications and future design. Angew. Chem. 2012, 51, 10724–10738. [Google Scholar]
- Kneen, M.; Farinas, J.; Li, Y.; Verkman, A.S. Green fluorescent protein as a noninvasive intracellular pH indicator. Biophys. J. 1998, 74, 1591–1599. [Google Scholar]
- Llopis, J.; McCaffery, J.M.; Miyawaki, A.; Farquhar, M.G.; Tsien, R.Y. Measurement of cytosolic, mitochondrial, and Golgi pH in single living cells with green fluorescent proteins. Proc. Natl. Acad. Sci. USA 1998, 95, 6803–6808. [Google Scholar]
- Miesenböck, G.; de Angelis, D.A.; Rothman, J.E. Visualizing secretion and synaptic transmission with pH-sensitive green fluorescent proteins. Nature 1998, 394, 192–195. [Google Scholar]
- Sankaranarayanan, S.; de Angelis, D.; Rothman, J.E.; Ryan, T.A. The use of pHluorins for optical measurements of presynaptic activity. Biophys. J. 2000, 79, 2199–2208. [Google Scholar]
- Moseyko, N.; Feldman, L.J. Expression of pH-sensitive green fluorescent protein in Arabidopsis thaliana. Plant Cell Environ. 2001, 24, 557–563. [Google Scholar]
- Ai, H.-W.; Olenych, S.G.; Wong, P.; Davidson, M.W.; Campbell, R.E. Hue-shifted monomeric variants of Clavularia cyan fluorescent protein: Identification of the molecular determinants of color and applications in fluorescence imaging. BMC Biol. 2008, 6, 13. [Google Scholar]
- Wachter, R.M.; Elsliger, M.A.; Kallio, K.; Hanson, G.T.; Remington, S.J. Structural basis of spectral shifts in the yellow-emission variants of green fluorescent protein. Structure 1998, 6, 1267–1277. [Google Scholar]
- Griesbeck, O.; Baird, G.S.; Campbell, R.E.; Zacharias, D.A.; Tsien, R.Y. Reducing the environmental sensitivity of yellow fluorescent protein. Mechanism and applications. J. Biol. Chem. 2001, 276, 29188–29194. [Google Scholar]
- Miyawaki, A.; Griesbeck, O.; Heim, R.; Tsien, R.Y. Dynamic and quantitative Ca2+ measurements using improved cameleons. Proc. Natl. Acad. Sci. USA 1999, 96, 2135–2140. [Google Scholar]
- Abad, M.F.C.; Di Benedetto, G.; Magalhães, P.J.; Filippin, L.; Pozzan, T. Mitochondrial pH monitored by a new engineered green fluorescent protein mutant. J. Biol. Chem. 2004, 279, 11521–11529. [Google Scholar]
- Lam, A.J.; St-Pierre, F.; Gong, Y.; Marshall, J.D.; Cranfill, P.J.; Baird, M.A.; McKeown, M.R.; Wiedenmann, J.; Davidson, M.W.; Schnitzer, M.J.; et al. Improving FRET dynamic range with bright green and red fluorescent proteins. Nat. Methods 2012, 9, 1005–1012. [Google Scholar]
- Shaner, N.C.; Lin, M.Z.; McKeown, M.R.; Steinbach, P.A.; Hazelwood, K.L.; Davidson, M.W.; Tsien, R.Y. Improving the photostability of bright monomeric orange and red fluorescent proteins. Nat. Methods 2008, 5, 545–551. [Google Scholar]
- Li, H.; Foss, S.M.; Dobryy, Y.L.; Park, C.K.; Hires, S.A.; Shaner, N.C.; Tsien, R.Y.; Osborne, L.C.; Voglmaier, S.M. Concurrent imaging of synaptic vesicle recycling and calcium dynamics. Front. Mol. Neurosci. 2011, 4, 34. [Google Scholar]
- Li, Y.; Tsien, R.W. pHTomato, a red, genetically encoded indicator that enables multiplex interrogation of synaptic activity. Nat. Neurosci. 2012, 15, 1047–1053. [Google Scholar]
- Johnson, D.E.; Ai, H.-W.; Wong, P.; Young, J.D.; Campbell, R.E.; Casey, J.R. Red fluorescent protein pH biosensor to detect concentrative nucleoside transport. J. Biol. Chem. 2009, 284, 20499–20511. [Google Scholar]
- Shcherbo, D.; Murphy, C.S.; Ermakova, G.V.; Solovieva, E.A.; Chepurnykh, T.V.; Shcheglov, A.S.; Verkhusha, V.V.; Pletnev, V.Z.; Hazelwood, K.L.; Roche, P.M. Far-red fluorescent tags for protein imaging in living tissues. Biochem. J. 2009, 418, 567–574. [Google Scholar]
- Shaner, N.C.; Campbell, R.E.; Steinbach, P.A.; Giepmans, B.N.G.; Palmer, A.E.; Tsien, R.Y. Improved monomeric red, orange and yellow fluorescent proteins derived from Discosoma sp. red fluorescent protein. Nat. Biotechnol. 2004, 22, 1567–1572. [Google Scholar]
- Scott, C.C.; Gruenberg, J. Ion flux and the function of endosomes and lysosomes: pH is just the start: The flux of ions across endosomal membranes influences endosome function not only through regulation of the luminal pH. BioEssays 2011, 33, 103–110. [Google Scholar]
- Ohgaki, R.; van IJzendoorn, S.C.D.; Matsushita, M.; Hoekstra, D.; Kanazawa, H. Organellar Na+/H+ exchangers: Novel players in organelle pH regulation and their emerging functions. Biochemistry 2011, 50, 443–450. [Google Scholar]
- Mahon, M.J. pHluorin 2: An enhanced, ratiometric, pH-sensitive green florescent protein. Adv. Biosci. Biotechnol. 2011, 2, 132–137. [Google Scholar]
- Valkonen, M.; Mojzita, D.; Penttilä, M.; Benčina, M. Noninvasive high-throughput single-cell analysis of the intracellular pH of saccharomyces cerevisiae by ratiometric flow cytometry. Appl. Environ. Microbiol. 2013, 79, 7179–7187. [Google Scholar]
- Morimoto, Y.V.; Kojima, S.; Namba, K.; Minamino, T. M153R mutation in a pH-sensitive green fluorescent protein stabilizes its fusion proteins. PLoS One 2011, 6, e19598. [Google Scholar]
- Bagar, T.; Altenbach, K.; Read, N.D.; Benčina, M. Live-cell imaging and measurement of intracellular pH in filamentous fungi using a genetically encoded ratiometric probe. Eukaryot. Cell 2009, 8, 703–712. [Google Scholar]
- Bagar, T.; Benčina, M. Antiarrhythmic drug amiodarone displays antifungal activity, induces irregular calcium response and intracellular acidification of Aspergillus niger - amiodarone targets calcium and pH homeostasis of A. niger. Fungal Genet. Biol. 2012, 49, 779–791. [Google Scholar]
- Hanson, G.T.; McAnaney, T.B.; Park, E.S.; Rendell, M.E.P.; Yarbrough, D.K.; Chu, S.; Xi, L.; Boxer, S.G.; Montrose, M.H.; Remington, S.J. Green fluorescent protein variants as ratiometric dual emission pH sensors. 1. Structural characterization and preliminary application. Biochemistry 2002, 41, 15477–15488. [Google Scholar]
- Bizzarri, R.; Arcangeli, C.; Arosio, D.; Ricci, F.; Faraci, P.; Cardarelli, F.; Beltram, F. Development of a novel GFP-based ratiometric excitation and emission pH indicator for intracellular studies. Biophys. J. 2006, 90, 3300–3314. [Google Scholar]
- Bizzarri, R.; Nifosì, R.; Abbruzzetti, S.; Rocchia, W.; Guidi, S.; Arosio, D.; Garau, G.; Campanini, B.; Grandi, E.; Ricci, F.; et al. Green fluorescent protein ground states: The influence of a second protonation site near the chromophore. Biochemistry 2007, 46, 5494–5504. [Google Scholar]
- Ogoh, K.; Kinebuchi, T.; Murai, M.; Takahashi, T.; Ohmiya, Y.; Suzuki, H. Dual-color-emitting green fluorescent protein from the sea cactus Cavernularia obesa and its use as a pH indicator for fluorescence microscopy. Lumin 2013, 28, 582–591. [Google Scholar]
- Schulte, A.; Lorenzen, I.; Böttcher, M.; Plieth, C. A novel fluorescent pH probe for expression in plants. Plant Methods 2006, 2, 7. [Google Scholar]
- Tantama, M.; Hung, Y.P.; Yellen, G. Imaging intracellular pH in live cells with a genetically encoded red fluorescent protein sensor. J. Am. Chem. Soc. 2011, 133, 10034–10037. [Google Scholar]
- Poburko, D.; Santo-Domingo, J.; Demaurex, N. Dynamic regulation of the mitochondrial proton gradient during cytosolic calcium elevations. J. Biol. Chem. 2011, 286, 11672–11684. [Google Scholar]
- Belousov, V.V.; Fradkov, A.F.; Lukyanov, K.A.; Staroverov, D.B.; Shakhbazov, K.S.; Terskikh, A.V.; Lukyanov, S. Genetically encoded fluorescent indicator for intracellular hydrogen peroxide. Nat. Methods 2006, 3, 281–286. [Google Scholar]
- Awaji, T.; Hirasawa, A.; Shirakawa, H.; Tsujimoto, G.; Miyazaki, S. Novel green fluorescent protein-based ratiometric indicators for monitoring pH in defined intracellular microdomains. Biochem. Biophys. Res. Commun. 2001, 289, 457–462. [Google Scholar]
- Chandy, G.; Grabe, M.; Moore, H.P.; Machen, T.E. Proton leak and CFTR in regulation of Golgi pH in respiratory epithelial cells. Am. J. Physiol. 2001, 281, C908–C921. [Google Scholar]
- Arosio, D.; Ricci, F.; Marchetti, L.; Gualdani, R.; Albertazzi, L.; Beltram, F. Simultaneous intracellular chloride and pH measurements using a GFP-based sensor. Nat. Methods 2010, 7, 516–518. [Google Scholar]
- Mukhtarov, M.; Liguori, L.; Waseem, T.; Rocca, F.; Buldakova, S.; Arosio, D.; Bregestovski, P. Calibration and functional analysis of three genetically encoded Cl(-)/pH sensors. Front. Mol. Neurosci. 2013, 6, 9. [Google Scholar]
- Gjetting, K.S.K.; Ytting, C.K.; Schulz, A.; Fuglsang, A.T. Live imaging of intra- and extracellular pH in plants using pHusion, a novel genetically encoded biosensor. J. Exp. Bot. 2012, 63, 3207–3218. [Google Scholar]
- Raimondo, J.V.; Irkle, A.; Wefelmeyer, W.; Newey, S.E.; Akerman, C.J. Genetically encoded proton sensors reveal activity-dependent pH changes in neurons. Front. Mol. Neurosci. 2012, 5, 1–12. [Google Scholar]
- Karagiannis, J.; Young, P.G. Intracellular pH homeostasis during cell-cycle progression and growth state transition in Schizosaccharomyces pombe. J. Cell Sci. 2001, 114, 2929–2941. [Google Scholar]
- Serresi, M.; Bizzarri, R.; Cardarelli, F.; Beltram, F. Real-time measurement of endosomal acidification by a novel genetically encoded biosensor. Anal. Bioanal. Chem. 2009, 393, 1123–1133. [Google Scholar]
- Ullah, A.; Lopes, M.I.; Brul, S.; Smits, G.J. Intracellular pH homeostasis in Candida glabrata in infection-associated conditions. Microbiology 2013, 159, 803–813. [Google Scholar]
- Maresová, L.; Hosková, B.; Urbánková, E.; Chaloupka, R.; Sychrová, H. New applications of pHluorin—measuring intracellular pH of prototrophic yeasts and determining changes in the buffering capacity of strains with affected potassium homeostasis. Yeast 2010, 27, 317–325. [Google Scholar]
- Orij, R.; Postmus, J.; Ter Beek, A.; Brul, S.; Smits, G.J. In vivo measurement of cytosolic and mitochondrial pH using a pH-sensitive GFP derivative in Saccharomyces cerevisiae reveals a relation between intracellular pH and growth. Microbiology 2009, 155, 268–278. [Google Scholar]
- Martínez-Muñoz, G.A.; Kane, P. Vacuolar and plasma membrane proton pumps collaborate to achieve cytosolic pH homeostasis in yeast. J. Biol. Chem. 2008, 283, 20309–20319. [Google Scholar]
- Ayer, A.; Sanwald, J.; Pillay, B.A.; Meyer, A.J.; Perrone, G.G.; Dawes, I.W. Distinct redox regulation in sub-cellular compartments in response to various stress conditions in Saccharomyces cerevisiae. PLoS One 2013, 8. [Google Scholar] [CrossRef]
- Khiroug, S.S.; Pryazhnikov, E.; Coleman, S.K.; Jeromin, A.; Keinänen, K.; Khiroug, L. Dynamic visualization of membrane-inserted fraction of pHluorin-tagged channels using repetitive acidification technique. BMC Neurosci. 2009, 10, 141. [Google Scholar]
- Rivinoja, A.; Kokkonen, N.; Kellokumpu, I.; Kellokumpu, S. Elevated Golgi pH in breast and colorectal cancer cells correlates with the expression of oncofetal carbohydrate T-antigen. J. Cell. Physiol. 2006, 208, 167–174. [Google Scholar]
- Storrie, B. Maintenance of Golgi apparatus structure in the face of continuous protein recycling to the endoplasmic reticulum: Making ends meet. Int. Rev. Cytol. 2005, 244, 69–94. [Google Scholar]
- Disbrow, G.L.; Hanover, J.A.; Schlegel, R. Endoplasmic reticulum-localized human papillomavirus type 16 E5 protein alters endosomal pH but not trans-Golgi pH. J. Virol. 2005, 79, 5839–5846. [Google Scholar]
- Starr, T.; Forsten-Williams, K.; Storrie, B. Both post-Golgi and intra-Golgi cycling affect the distribution of the Golgi phosphoprotein GPP130. Traffic 2007, 8, 1265–1279. [Google Scholar]
- Lázaro-Diéguez, F.; Jiménez, N.; Barth, H.; Koster, A.J.; Renau-Piqueras, J.; Llopis, J.L.; Burger, K.N.J.; Egea, G. Actin filaments are involved in the maintenance of Golgi cisternae morphology and intra-Golgi pH. Cell Motil. Cytoskelet. 2006, 63, 778–791. [Google Scholar]
- Liu, D.; Martina, J.A.; Wu, X.S.; Hammer, J.A.; Long, E.O. Two modes of lytic granule fusion during degranulation by natural killer cells. Immunol. Cell Biol. 2011, 89, 728–738. [Google Scholar]
- Dean, C.; Liu, H.; Dunning, F.M.; Chang, P.Y.; Jackson, M.B.; Chapman, E.R. Synaptotagmin-IV modulates synaptic function and long-term potentiation by regulating BDNF release. Nat. Neurosci. 2009, 12, 767–776. [Google Scholar]
- Sankaranarayanan, S.; Ryan, T.A. Real-time measurements of vesicle-SNARE recycling in synapses of the central nervous system. Nat. Cell Biol. 2000, 2, 197–204. [Google Scholar]
- Voglmaier, S.M.; Kam, K.; Yang, H.; Fortin, D.L.; Hua, Z.; Nicoll, R.A.; Edwards, R.H. Distinct endocytic pathways control the rate and extent of synaptic vesicle protein recycling. Neuron 2006, 51, 71–84. [Google Scholar]
- Sinha, R.; Ahmed, S.; Jahn, R.; Klingauf, J. Two synaptobrevin molecules are sufficient for vesicle fusion in central nervous system synapses. Proc. Natl. Acad. Sci. USA 2011, 108, 14318–14323. [Google Scholar]
- Dean, C.; Dunning, F.M.; Liu, H.; Bomba-Warczak, E.; Martens, H.; Bharat, V.; Ahmed, S.; Chapman, E.R. Axonal and dendritic synaptotagmin isoforms revealed by a pHluorin-syt functional screen. Mol. Biol. Cell 2012, 23, 1715–1727. [Google Scholar]
- Ohara-Imaizumi, M.; Nakamichi, Y.; Tanaka, T.; Katsuta, H.; Ishida, H.; Nagamatsu, S. Monitoring of exocytosis and endocytosis of insulin secretory granules in the pancreatic beta-cell line MIN6 using pH-sensitive green fluorescent protein (pHluorin) and confocal laser microscopy. Biochem. J. 2002, 363, 73–80. [Google Scholar]
- Poëa-Guyon, S.; Pasquier, H.; Mérola, F.; Morel, N.; Erard, M. The enhanced cyan fluorescent protein: A sensitive pH sensor for fluorescence lifetime imaging. Anal. Bioanal. Chem. 2013, 405, 3983–3987. [Google Scholar]
- Jankowski, A.; Kim, J.H.; Collins, R.F.; Daneman, R.; Walton, P.; Grinstein, S. In situ measurements of the pH of mammalian peroxisomes using the fluorescent protein pHluorin. J. Biol. Chem. 2001, 276, 48748–48753. [Google Scholar]
- Fishilevich, E.; Fitzpatrick, J.A.J.; Minden, J.S. pHMA, a pH-sensitive GFP reporter for cell engulfment, in Drosophila embryos, tissues, and cells. Dev. Dyn. 2010, 239, 559–573. [Google Scholar]
- Vijayvergiya, C.; De Angelis, D.; Walther, M.; Kühn, H.; Duvoisin, R.M.; Smith, D.H.; Wiedmann, M. High-level expression of rabbit 15-lipoxygenase induces collapse of the mitochondrial pH gradient in cell culture. Biochemistry 2004, 43, 15296–15302. [Google Scholar]
- Ast, J.; Stiebler, A.C.; Freitag, J.; Bölker, M. Dual targeting of peroxisomal proteins. Front. Physiol. 2013, 4, 297. [Google Scholar]
- Schwarzländer, M.; Murphy, M.P.; Duchen, M.R.; Logan, D.C.; Fricker, M.D.; Halestrap, A.P.; Müller, F.L.; Rizzuto, R.; Dick, T.P.; Meyer, A.J.; et al. Mitochondrial “flashes”: A radical concept repHined. Trends Cell Biol 2012, 22, 503–508. [Google Scholar]
- Santo-Domingo, J.; Giacomello, M.; Poburko, D.; Scorrano, L.; Demaurex, N. OPA1 promotes pH flashes that spread between contiguous mitochondria without matrix protein exchange. EMBO J. 2013, 32, 1927–1940. [Google Scholar]

| pKa | λx1(nm) | λx2(nm) | λe(nm) | Quantum Yield | Reference | |
|---|---|---|---|---|---|---|
| ε (mM−1·cm−1) | ||||||
| Green FP | ||||||
| ECFP (GFP-K26R, F64L, S65T, Y66W, N146I, M153T, V163A, N164H, H231L) | 6.4 | b | 440 | 480 | 0.40 | [12] |
| 33 | ||||||
| EGFP (GFP-F64L, S65T, H231L) | 5.8 | 396a 29 | 489 | 509 | 0.60 | [11,12] |
| 60 | ||||||
| Ecliptic pHluorin (GenBank: AF058695) (GFP-S147D, N149Q, T161I, V163A, S175G, S202F, Q204T, A206T) | 7.1 | 396a | 476 | 508 | b | [13] |
| Superecliptic pHluorin (GenBank: AY533296) (e-pHluorin-F64L, S65T) | 7.2 | 396a | 476 | 508 | b | [14] |
| PEpHluorin | b | 395a | 475 | 512 | b | [4] |
| mWasabi (GenBank: EU024648) | 6.5 | b | 493 | 509 | 0.80 | [16] |
| 90 | ||||||
| Yellow FPs | ||||||
| EYFP (GFP-F64L, S65G, S72A, T203Y, H231L) | 7.1 | 390a | 514 | 527 | 0.61 | [12,17] |
| 84 | ||||||
| mCitrine(GFP-F64L, S65G, V68L, Q69M, S72A, T203Y, H231L) | 5.7 | b | 516 | 529 | 0.76 | [18,19] |
| 77 | ||||||
| mtAlpHi (S65G,V68L, Q69K, S72A, T203Y=Camgaroo2 calmodulin replaced with short aequorin) | 8.5 | b | 498 | 522 | b | [20] |
| Clover | 6.2 | b | 505 | 515 | 0.76 | [21] |
| 111 | ||||||
| Red FPs | ||||||
| mOrange2 (GenBank: DQ336159) (mOrange-Q64H, F99Y, E160K, G196D) | 6.5 | b | 549 | 565 | 0.60 | [22,23] |
| 58 | ||||||
| pHTomato (GenBank: JQ966306) (mStrawberry-F41T, Q66T, F83L, S182K, I194K, V195T, G196D) | 7.8 | b | 550 | 580 | b | [24] |
| mNectarine (GenBank: FJ439505) | 6.9 | b | 558 | 578 | b | [25] |
| 58 | ||||||
| mKate (GenBank: EU383029) | 6.2 | b | 588 | 635 | 0.28 | [26] |
| 32 | ||||||
| mKate2 (GenBank: JB331973) | 5.4 | b | 588 | 633 | 0.40 | [26] |
| 63 | ||||||
| mTangerine (GeneBank: AY678270) | 5.7 | b | 568 | 585 | 0.30 | [27] |
| 568 | ||||||
| mRuby2 | 5.3 | b | 559 | 600 | 0.38 | [21] |
| 43 | ||||||
aPoor or no emission at this wavelength excitation;bnot determined/not applicable.
| pK | λx1(nm) | λx2(nm) | λe1(nm) | λe2(nm) | Reference | ||
|---|---|---|---|---|---|---|---|
| ε (mM−1·cm−1) | |||||||
| pHluorins | |||||||
| R-pHluorin (GenBank: AF058694) (GFP-E132D, S147E, N149L, N164I, K166Q, I167V, R168H, L220F) | 6.9 | 395 | 475 | 508a | b | [13] | |
| R-pHluorin2 (R-pHluorin-F64L, Q80R, E132D, S175G) | 7.1 | 395 | 475 | 509a | b | [30,31] | |
| R-pHluorin(M153R) (R-pHluorin-M153R) | 7.1 | 395 | 475 | 509a | b | [32] | |
| pHGFP | b | 410 | 470 | 535a | b | [15] | |
| PrpHluorin (R-pHluorin for plants) | 6.6 | 395 | 475 | 515a | b | [4] | |
| RaVC (R-pHluorin-XX) | 7.1 | 395 | 476 | 508a | b | [33,34] | |
| deGFP | |||||||
| deGFP1 (S65T,Q80R, H148G, T203C) | 8.0 | 400 | 504 | 466 | 516 | [35] | |
| deGFP2 (S65T, C48S, Q80R, H148C) | 7.3 | 398 | 496 | 462 | 517 | [35] | |
| deGFP3 (S65T, Q80R, T203C) | 6.9 | 396 | 508 | 461 | 518 | [35] | |
| deGFP4 (S65T, C48S, Q80R, H148C, T203C) | 7.4 | 400 | 509 | 462 | 518 | [35] | |
| EnGFP | |||||||
| E2GFP (GFP-F64L, S65T, T203Y, L231H) | 6.9–7.5e | 423/401d | 515 | 510/523d | b | [36] | |
| 32/23 | 22 | ||||||
| E1GFP (GFP-F64L, T203Y) | 6.4–6.6e | 410/400d | 509 | 510/523d | b | [37] | |
| 31/29 | 5 | ||||||
| Others | |||||||
| Wt-CoGFP | 6.5e | 388 | 498 | 456/507d | 507 | [38] | |
| Pt-GFP | 7.3 | 390 | 502 | 508a | b | [39] | |
| pHRed (mKeima-A213S) | 7.8; 6.9c | 440 | 585 | 610a | b | [40] | |
| SypHer (HyPer-C199S) | 8.7 | 420 | 490 | 535a | b | [41] | |
aValid for both excitations (λx1 and λx2);bnot determined/not applicable;cpK determined with FLIM;dat pH<5/at pH>8,epK depends on combination of excitation/emission set up.
| pK | λx1(nm) | λx2(nm) | λe1(nm) | λe2(nm) | Reference | |
|---|---|---|---|---|---|---|
| GFpH GFPuv-EGFP | 6.1 | 380 | 480 | 510 | a | [43] |
| YfpH GFPuv-EYFP | 6.5 | 380 | 480 | 509/527 | a | [43] |
| pHERP EYFP-GGGLEDPRVPVEK-GFPuv | 6.5 | 397 | 515 | 520 | a | [44] |
| ClopHensor E2GFP-linker 20 aa-dsRedm | 6.8 | 458 and 488 | 543 for DsRed | 590 | 630 for DsRed | [45] |
| ClopHensor (H148G,V224L) | 7.3 | 458 and 488 | 543 for DsRed | 535 | 630 for DsRed | [46] |
| pHusion mRFP1-AVNAS-EGFP | 5.8 | 488 | 558 or 585 | 500–550 | 600–630 | [47] |
anot determined/not applicable.
| Sensor | Tag | pH | Organism/Cell Type | Instrumenta | Reference | |
|---|---|---|---|---|---|---|
| Cytosol | ||||||
| E2GFP | 7.2–7.3 | CHO, U-2 OS cells | Micro | [36] | ||
| E2GFP | 7.3–7.5 | Rat hippocampal neuron | Micro | [48] | ||
| deGFP4 | 7.4–7.7 | Rat hippocampal neuron | Micro | [48] | ||
| GFP-F64L/S65T | 7.4 | CHO-1K cells | Micro | [11] | ||
| EYFP | 7.4 | HeLa cells | Micro | [12] | ||
| SypHer | 7.2 | HeLa cells | Micro | [41] | ||
| pHRed | 7.4 | Neuro 2A cells | Micro | [40] | ||
| pHERP | 7.2–7.5 | Vero, CFT1, CHO cells | Micro | [44] | ||
| ClopHensor | 7.3, 7.7 | WSS1, PC12, CHO cells | Micro | [45,46] | ||
| ClopHensor (H148G/V224L) | 7.5–7.7 | CHO cells | Micro | [46] | ||
| PalmPalm-ClopHensor | Palmitoylation site | 7.3 | WSS1, PC12 cells | Micro | [46] | |
| GFpH | C-terminus α1B-adrenoreceptor | 6.8 | COS-7, CHO-K1 cells | Micro | [43] | |
| Caveolin-E1GFP | Caveolin-1 | 7.3 | HeLa cells | Micro | [50] | |
| hCNT3-mNectarine | Cytosolic site of hCNT3 | 6.5–7.5 | HEK cells | Micro | [25] | |
| RaVC | 7.4–7.7 | A. niger | Micro | [33,34] | ||
| pHluorin | 6.4–7.5c | S. cerevisiae FL100, S288c, ∑1278, ORY001, BY4742 | Spec | [52–54] | ||
| pHluorin, pHluorin2 | 7.0–7.5c | S. cerevisiae H4307, H3909, BY4743 | Micro Flow | [31,55] | ||
| pHluorin | 7.2–7.3 | Schizo. pombe | Micro | [49] | ||
| pHluorin | 7.0c | C. glabrata BG14 | Spec | [51] | ||
| pHusion | 6.4 | Arabidopsis mesophyll cell | Micro | [47] | ||
| pHGFP | 6.5–7.0 | A. thaliana root cap | Micro | [15] | ||
| pHGFP | 7.0–7.3 | A. thaliana meristem cells | Micro | [15] | ||
| PRpHluorin | 7.3 | A. thaliana | Micro | [4] | ||
| Nucleus | ||||||
| NLS–PRpHluorin | PKKKRKV | 7.2 | A. thaliana | Micro | [4] | |
| pHluorin-NLS | PKKKRKV | 7.3 | Schizo. pombe | Micro | [49] | |
| Endoplasmic reticulum | ||||||
| pHluorin-KDEL | KDEL at C-terminus of FP | b | Rat hippocampal neurons | Micro | [56] | |
| GFP-F64L/S65T-SEKDEL | SEKDEL at C-terminus of FP | b | CHO-K1, LLC-PK1 cells | Micro | [11] | |
| PpHluorin–HDEL | HDEL at C-terminus of FP | 7.1 | A. thaliana | Micro | [4] | |
aMicro, FLIM, spec, flow stand for microscopy, fluorescence life time microscopy, spectrophotometry and flow cytometry, respectively;bOnly pH changes are presented in the paper;cDependent on carbon source, external pH.
| Sensor | Tag | pH | Organism/Cell Type | Instrumenta | Reference | |
|---|---|---|---|---|---|---|
| Medial/ trans | GT-EGFP, GT-ECFP, GT-EYFP | β-1, 4-galactosyltransferase (N-terminal 81aa) | 6.6 | HeLa CHO-K1, LLC-PK1 cells | Micro | [11,12] |
| Medial/ trans | GT-EGFP/ GT-ECFP | β-1, 4-galactosyltransferase | 6.4 | HeLa cells | Micro | [61] |
| Medial/ trans | GT-EYFP/ GT-ECFP | β-1, 4-galactosyltransferase | 6.4 | HeLa cells | Micro | [61] |
| Medial/ trans | GT-EGFP | β-1, 4-galactosyltransferase | 6.8 | Cancer cells MCF-7, HT-29, SW-48 cells | Micro | [57] |
| Medial/ trans | GT-EGFP | β-1, 4-galactosyltransferase | 6.1–6.3 | COS7, CaCo2 cells, fibroblasts | Micro | [57] |
| Medial/ trans | ST-pHERP | 2,6-sialyltransferase (1-70 aa) | 6.4–6.6 | CFT1, Vero, CHO, HeLa cells | Micro | [44] |
| TGN | TGN38-pHluorin | Trans Golgi network protein | 6.4 | HEK cells | Micro | [59] |
| TGN | PpHluorin-BP80 (Y612A) | BP-80 vacuolar sorting receptor | 6.3 | A. thaliana | Micro | [4] |
| Cis | ManI–PpHluorin | mannosidase | 6.8 | A. thaliana | Micro | [4] |
aMicro, FLIM, spec, flow stand for microscopy, fluorescence life time microscopy, spectrophotometry and flow cytometry.
| Sensor | Tag | pH | Organism/Cell Type | Instrumenta | Reference | |
|---|---|---|---|---|---|---|
| Perforin containing granules | DsRed-FasL-pHluorin | Fas ligand | b | NKL cells | Micro | [62] |
| BDNF containing vesicles and Golgi | SytIV-pHluorin | Synaptotagmin-IV | b | Rat hippocampal neurons | Micro | [63] |
| Synaptic vesicles | pHluorin-syt | Luminal domain of synaptotagmins | b | Rat hippocampal neurons | Micro | [67] |
| Synaptic vesicles | syp-pHTomato | Synaptophysin | b | HEK, rat hippocampal neurons | Micro | [24] |
| Synaptic vesicles | VAMP2-pHTomato | Synaptobrevin/ VAMP2 | b | HEK, rat hippocampal neurons | Micro | [24] |
| Synaptic vesicles | GFP-F64L/S65T- | Synaptobrevin/ VAMP2 | b | CHO-K1, LLC-PK1 cells | Micro | [11] |
| Synaptic vesicles | VAMP-EGFP | Synaptobrevin/ VAMP2 | b | Rat hippocampal neurons | Micro | [14] |
| Synaptic vesicles | synapto-es-pHluorin | Synaptobrevin/ VAMP2 | b | Rat hippocampal neurons | Micro | [14] |
| Synaptic vesicles | VGLUT1-2xmOrange2 | Glutamate transporter 1 | b | Rat hippocampal neurons | Micro | [23] |
| Synaptic vesicles | vGluTpH | Glutamate transporter 1 | b | Rat hippocampal neurons | Micro | [24] |
| Synaptic vesicles | vGluT-pHl | Glutamate transporter 1 | b | Mouse hippocampal neurons | Micro | [66] |
| Synaptic vesicles | vGluT-pHl | Glutamate transporter 1 | b | Mouse hippocampal neurons | Micro | [66] |
| Synaptic vesicles | syp-pHl | Synaptophysin 1 | b | Mouse hippocampal neurons | Micro | [66] |
| PTH1R containing vesicles | hPTH1R-pHluorin2 | human parathyroid hormone 1 receptor | b | HEK293 cells | Micro | [30] |
| Secretory garnules | CgA-ECFP | Chromogranin B | 5.5 | PC12 cells | FLIM | [69] |
| Vesicles/ endoplasmic reticulum | pHluron-GluR-D | signal peptide-pHluorin-glutamate receptor | b | Rat hippocampal neurons | Micro | [56] |
| Insulin secretory granules | Phogrin-pHluorin | Signal peptide-pHluorin-phogrin | b | MIN6 cells | Micro | [68] |
| Insulin secretory granules | Insulin-pHluorin | Prepro-insulin | b | MIN6 cells | Micro | [68] |
| Large dense-core vesicles LDCV | NPY-ClopHensor | Neuropeptide Y, N-terminal signal | 5.2, 5.6 | PC12, WSS-1 cells | Micro | [45] |
| Early endosomes | Cellubrevin-r-pHluorin | Cellubrevin | 5.9 | HEK cells | Micro | [59] |
| Endosomes | Tat-E1GFP | Transactivator protein of human immunodeficiency virus-1 | 6.8 early/ 5.8–6.5 | HeLa cells | Micro | [50] |
| Multivesicular bodies | PRpHluorin–AtVSR2 | Vacuolar-sorting receptor 2 | 6.2 | A. thaliana | Micro | [4] |
| Vacuoles | aleurain–PRpHluorin | Aleurain | 5.2 | A. thaliana | Micro | [4] |
| Vacuoles | RaVC | 6.2–6.5 | A. niger | Micro | [33] |
aMicro, FLIM, spec, flow stand for microscopy, fluorescence life time microscopy, spectrophotometry and flow cytometry;bOnly pH changes are presented in the paper.
| Sensor | Tag | pH | Organism/Cell Type | Instrumenta | Reference | |||
|---|---|---|---|---|---|---|---|---|
| Peroxisomes | ||||||||
| pHluorin-SKL | SKL at C-terminus | 6.9–7.1 | CHO cells, human foreskin fibroblasts | Micro | [70] | |||
| pHluorin-SKL | SKL at C-terminus | 8.0 | S. cerevisiae BY4743 | Flow | [55] | |||
| PRpHluorin-SRL | SRL at C-terminus | 8.4 | A. thaliana | Micro | [4] | |||
| Other specialized compartments | ||||||||
| Cell cortex | pHMA | moesin 140 aa C-terminus actin binding domain | 7.0–7.4 | Drosophila S2 cells | Micro | [71] | ||
| Apoplasts | Apo-pHusion | Chitinase | b | A. thaliana mesophyll cell | Micro | [47] | ||
| Plastid stroma/ chloroplasts | RecA–PRpHluorin | Rubisco activase (N-terminus) | 7.2 | A. thaliana | Micro | [4] | ||
| Mitochondria | ||||||||
| mtAlpHi | COX-IV (1-12aa) | 8.1 | HeLa cells | Micro | [20] | |||
| MitoSypHer | COX-VIII (1-25aa) | 7.6 | HeLa cells | Micro | [39] | |||
| ECFPmito, EYFPmito | COX-IV (1-12aa) | 8.0/7.9 | HeLa/ cardiomyocytes | Micro | [12] | |||
| mito-pHluorin | COX-IV (1-12 aa)-RSGI linker | 7.7 | CV-1 cells | Micro | [72] | |||
| COX8-GFP-F64L/S65T | COX-VIII (1-25aa) | >7.5 | CHO-K1, LLC-PK1 | Micro | [11] | |||
| COX8-pHRed | COX-VIII (1-25aa) | 8.0 | Neuro 2A cells | Micro | [40] | |||
| COX4-pHluorin | COX-IV (1-25aa) | 7.7 | S. cerevisiae BY4743 | Flow | [55] | |||
| Mito-PpHluorin | β-subunit F1-ATPase | 8.1 | A. thaliana | Micro | [4] | |||
aMicro, FLIM, spec, flow stand for microscopy, fluorescence life time microscopy, spectrophotometry and flow cytometry;bOnly pH changes are presented in the paper.
© 2013 by the authors; licensee MDPI, Basel, Switzerland. This article is an open access article distributed under the terms and conditions of the Creative Commons Attribution license (http://creativecommons.org/licenses/by/3.0/).
Share and Cite
Benčina, M. Illumination of the Spatial Order of Intracellular pH by Genetically Encoded pH-Sensitive Sensors. Sensors 2013, 13, 16736-16758. https://doi.org/10.3390/s131216736
Benčina M. Illumination of the Spatial Order of Intracellular pH by Genetically Encoded pH-Sensitive Sensors. Sensors. 2013; 13(12):16736-16758. https://doi.org/10.3390/s131216736
Chicago/Turabian StyleBenčina, Mojca. 2013. "Illumination of the Spatial Order of Intracellular pH by Genetically Encoded pH-Sensitive Sensors" Sensors 13, no. 12: 16736-16758. https://doi.org/10.3390/s131216736
APA StyleBenčina, M. (2013). Illumination of the Spatial Order of Intracellular pH by Genetically Encoded pH-Sensitive Sensors. Sensors, 13(12), 16736-16758. https://doi.org/10.3390/s131216736