Metallo-Graphene Nanocomposite Electrocatalytic Platform for the Determination of Toxic Metal Ions


Abstract
: A Nafion-Graphene (Nafion-G) nanocomposite solution in combination with an in situ plated mercury film electrode was used as a highly sensitive electrochemical platform for the determination of Zn2+, Cd2+, Pb2+ and Cu2+ in 0.1 M acetate buffer (pH 4.6) by square-wave anodic stripping voltammetry (SWASV). Various operational parameters such as deposition potential, deposition time and electrode rotation speed were optimized. The Nafion-G nanocomposite sensing platform exhibited improved sensitivity for metal ion detection, in addition to well defined, reproducible and sharp stripping signals. The linear calibration curves ranged from 1 μg L−1 to 7 μg L−1 for individual analysis. The detection limits (3σ blank/slope) obtained were 0.07 μg L−1 for Pb2+, Zn2+ and Cu2+ and 0.08 μg L−1 for Cd2+ at a deposition time of 120 s. For practical applications recovery studies was done by spiking test samples with known concentrations and comparing the results with inductively coupled plasma mass spectrometry (ICP-MS) analyses. This was followed by real sample analysis.
1. Introduction
Heavy metals such as cadmium and lead pose a detrimental risk to human health and the environment due to their toxicity; even exposure to minuscule quantities can be life threatening. For example, the toxicity of lead in humans mainly arises from its mimicking action of occupying the calcium binding sites on numerous calcium-dependent proteins in cells resulting in the corresponding impairment of physiological functions [1]. On the other hand other metals such as zinc are essential nutrients, but over or under exposure can also be toxic [2].
The search for a rapid, sensitive and simple analytical method for trace metal monitoring is needed. At present the more popular techniques for analyzing trace heavy metals are based on spectroscopic techniques, namely atomic absorption spectroscopy, inductively coupled plasma-atomic emission spectroscopy (ICP-AES) and ICP-mass spectrometry (ICP-MS). However, spectroscopic methods are expensive, their availability is limited, they are not well suited for in situ measurements and require complicated instrumentation. Electrochemical (EC) techniques on the other hand are one of the best methods for detecting metals owing to their low cost, high sensitivity and portability.
Amongst all of the EC techniques, electrochemical stripping analysis is recognized as a powerful tool for trace metal analysis [2]. This technique is capable of measuring four to six analytes in a sample simultaneously in the sub parts per billion (sub-ppb) range. The instrumentation is compact and has a low power demand (small carbon footprint) and, requires no special installation or additional instrumentation and is suitable for on-site and in situ analysis [3,4]. Although stripping analysis is not a panacea for trace metal analysis, it does offer an alternative method. Electrochemical stripping analysis can also be used in complex matrices such as the determination of lead and cadmium in human hair [5], determination of zinc in oyster tissue and sewage sludge [6], as well as for the determination of lead and copper in wine [7].
The use of chemically modified electrodes, heated electrodes, microwave electrodes and insonated electrodes in stripping analysis to improve the sensitivity of the sensing interface for metal ion analysis have also been investigated [8–11]. In addition, the development of nanotechnology offers greater potential of increased sensitivity in metals analysis especially when incorporating of carbon nanotubes [12,13], ordered mesoporous carbon [14], functionalized mesoporous silica electrode [15], nanocrystalline diamond thin-film electrode [16] and the thick film modified graphite containing electrode [17], has greatly improved stripping signals but new materials are still needed to develop highly sensitive and antifouling metal ion sensing platforms.
Due to its excellent electronic, thermal and mechanical properties graphene, a single atom thick sheet of hexagonally arrayed sp2 bonded carbon atoms, has recently been attracting a lot of attention since it was first produced experimentally in 2004. It is suggested to be a very important material in device applications. Li et al. developed a cadmium sensing platform comprising of a Nafion-G coating onto which a mercury film was deposited [18].
In this work the use of SWASV together with a Nafion-G nanocomposite in combination with an in situ generated mercury film for the detection of Zn2+, Cd2+, Pb2+ and Cu2+ was investigated.
2. Experimental Section
2.1. Reagents
Nafion (5% wt in low aliphatic alcohols), was purchased from Aldrich, and then diluted to 1% Nafion with isopropyl alcohol. All chemicals used in this study were analytical reagent grade and used without further purification. Zn2+, Cd2+, Pb2+, Cu2+ and Hg2+ standard stock solutions (1,000 mg L−1, atomic absorption standard solution) were obtained from Sigma Aldrich and diluted as required. Sodium acetate and acetic acid were purchased from Aldrich. 0.1 M acetate buffer (pH 4.6) was used as supporting electrolyte. Ultra pure water (Millipore) was used for all preparations.
2.2. Apparatus
Square-wave anodic stripping voltammetry (SWASV) measurements were performed using a 797 VA COMPUTRACE instrument interfaced with a personal computer. The Nafion-G nanocomposite drop coated onto the glassy carbon electrode, served as the working electrode, with the Ag/AgCl (saturated KCl) and platinum electrode acting as the reference and auxiliary electrode respectively. All electrochemical experiments were carried out in a one compartment cell. The surface chemistries of graphite, graphite oxide and graphene were characterized on a Fourier Transform InfraRed spectrometer (Perkin Elmer Spectrum 100) and the structural properties were evaluated through X-ray diffraction (Phillips X-ray diffractometer) with Cu-Kα radiation. A tapping-mode atomic force microscope (Veeco Nanoman V) was employed to evaluate the morphology of graphite oxide and graphene, with special emphasis on estimating its thickness. The silicon tip [antimony (n) doped] had a curvature radius of 2.5–3.5 μm, a force constant of 1–5 N m−1 and a resonance frequency of 60–100 kHz. The samples for AFM were prepared by drop coating the graphene/water and graphene oxide/water (5 μL) dispersion onto a silicon wafer. Transmission electron microscopy images were taken on a Tecnai F20 HRTEM and the Raman spectra were recorded on a Dilor XY Raman spectrometer with a Coherent Innova 300 Argon laser with a 514.5 nm laser excitation.
2.3. Preparation of Graphene Solution
The graphite oxide was synthesized from graphite powder according to the literature with little modification [19,20]. Graphite oxide (100 mg) was dispersed in 100 mL of water and sonicated for 1 h, followed by the addition of 200 mg of NaBH4 to the dispersion. The mixture was stirred at 125 °C for 3 h. The black solid was isolated by centrifugation, washed with water and then dried.
2.4. Preparation of Modified Electrode
A 0.5 mg mL−1 graphene solution (100 μL) was mixed with an equal volume of 1.0 wt% Nafion-isopropyl alcohol solution by ultrasonication for ca. 30 min. or until fully dispersed. Then, a 5 μL aliquot of the mixture was coated onto the glassy carbon electrode (GC) to obtain the Nafion-G modified electrode [18].
2.5. Procedure for SWASV Analysis
The three electrodes were immersed into the electrochemical cell, containing 20 mL 0.1 M acetate buffer (pH 4.5), 10 mg L−1 Hg2+, and the target metal ions. The Nafion-G modified GC electrode with mercury film was plated in situ by spiking the sample with the required concentration of Hg2+ and simultaneously depositing Hg and the target metals on the surface of the electrode at −1.3 V for 120 s. Following the conditioning step, the stirring was stopped and after 10 s the voltammogram was recorded by applying a continuously changing square-wave potential (with a voltage step of 5 mV, amplitude of 25 mV, and frequency of 50 Hz). Prior to the next cycle, a cleaning step (60 s at 0.3 V, with solution stirring) was used to remove the target metals and metal film.
3. Results and Discussion
3.1. Morphology and Structural Characterization of Graphene
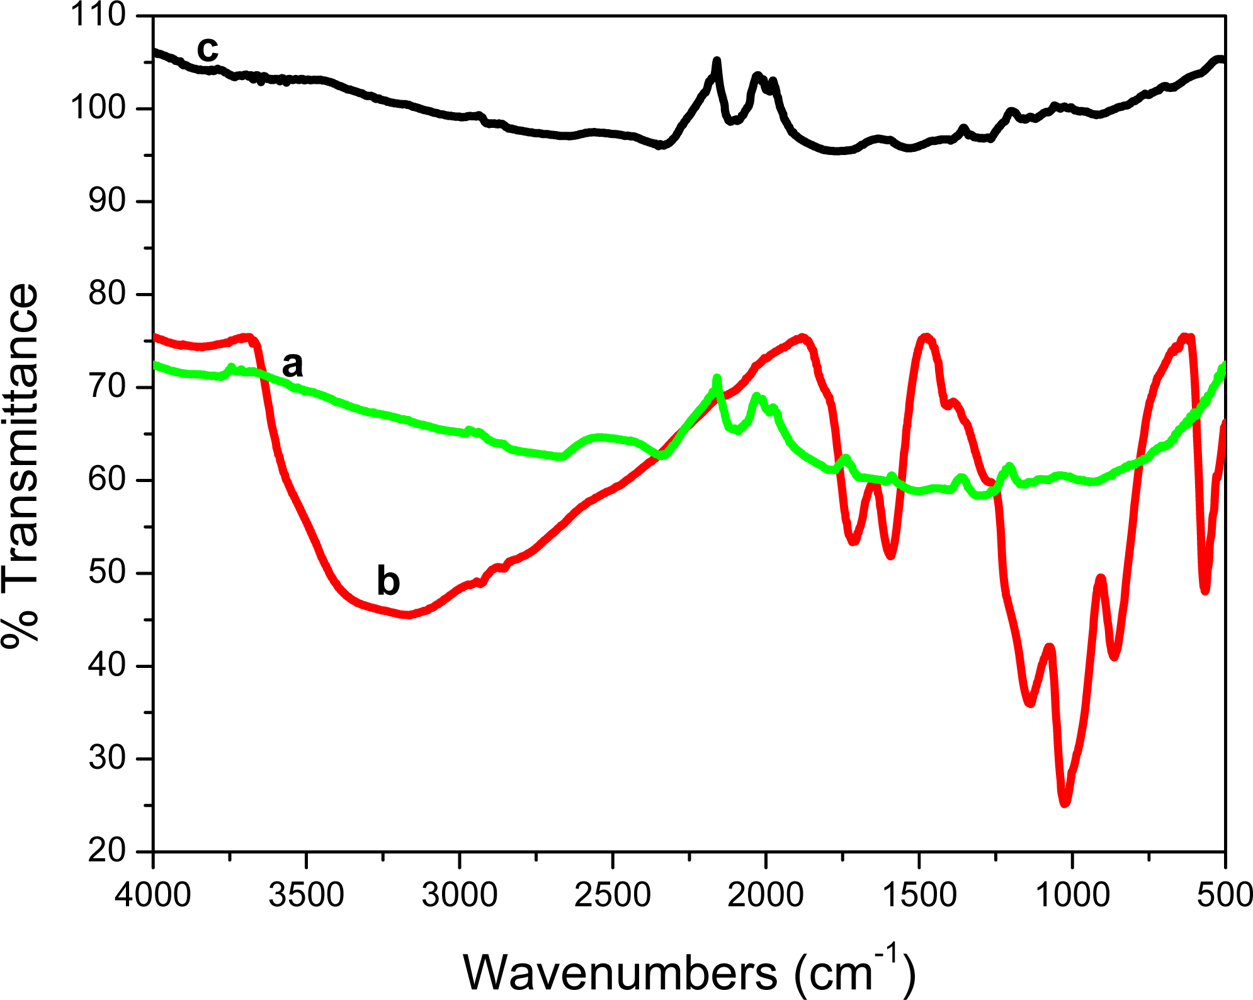
Figure 1 shows the Fourier Transform InfraRed (FT-IR) spectra of graphite, graphite oxide (GO) and graphene. For graphite, no distinct peaks are detected. GO however, showed a rich collection of transmission bands corresponding to C=O (1,719 cm−1), aromatic C=O (1,597 cm−1), carboxy C–O (1,411 cm−1, epoxy (1,283 cm−1) and O–H (3,400 cm−1) groups. After reduction with NaBH4 most of the functional groups were eliminated. These results concur with those reported by Chen et al. [21].
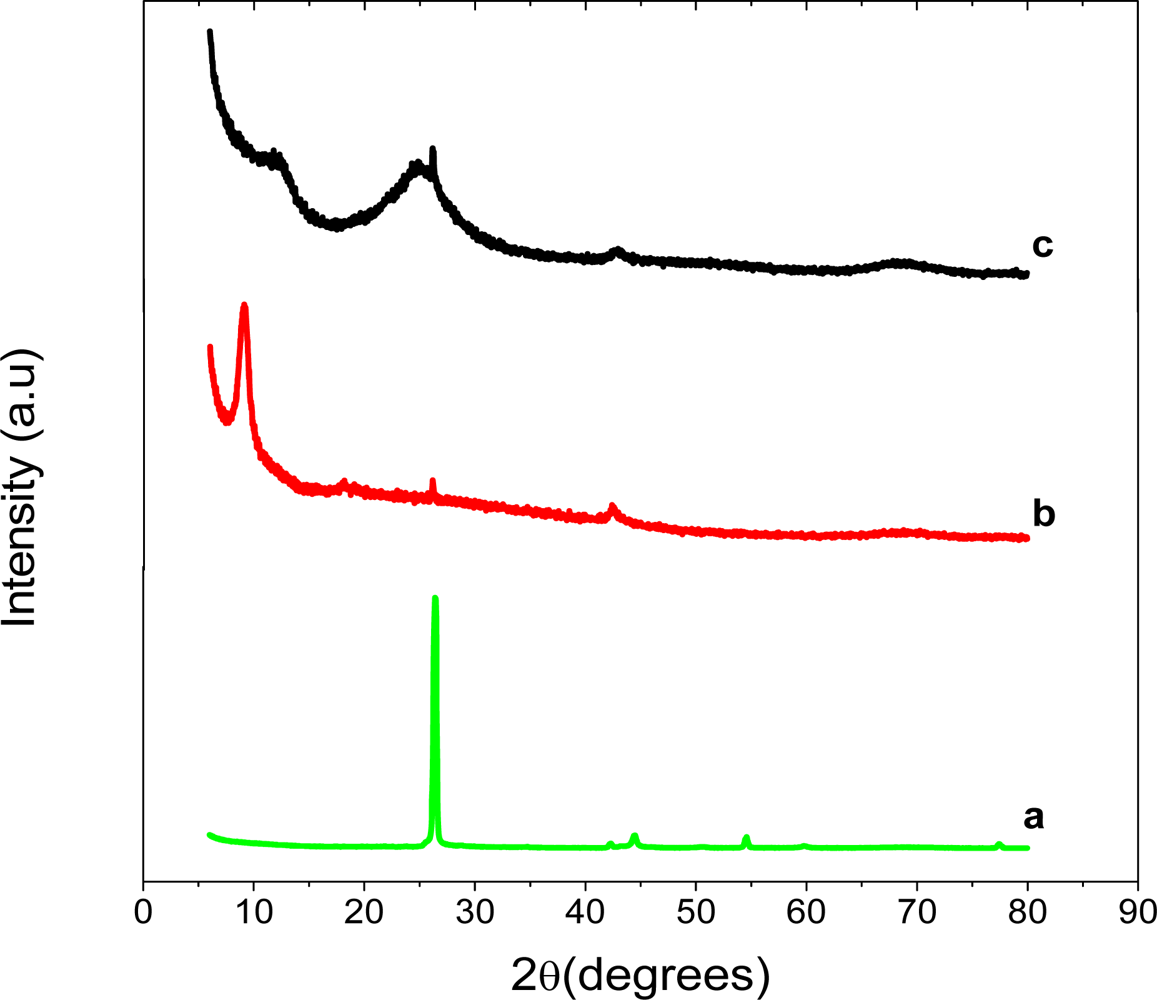
The XRD patterns of graphite, graphite oxide (GO) and graphene are shown in Figure 2. Graphite showed a very strong 002 peak at 26.37°, GO a 001 peak at 9.88° and graphene, 002 peak at 24.88°. The GO peak shift is due to the formation of hydroxyl, epoxy and carboxyl groups. After reduction to graphene some of the oxygen-containing functional groups are removed and this causes the graphene peak to shift to 24.88°. This suggests the conjugated graphene network (sp2 carbon) is reestablished during the reduction process, which is associated with the ring-opening of the epoxides.
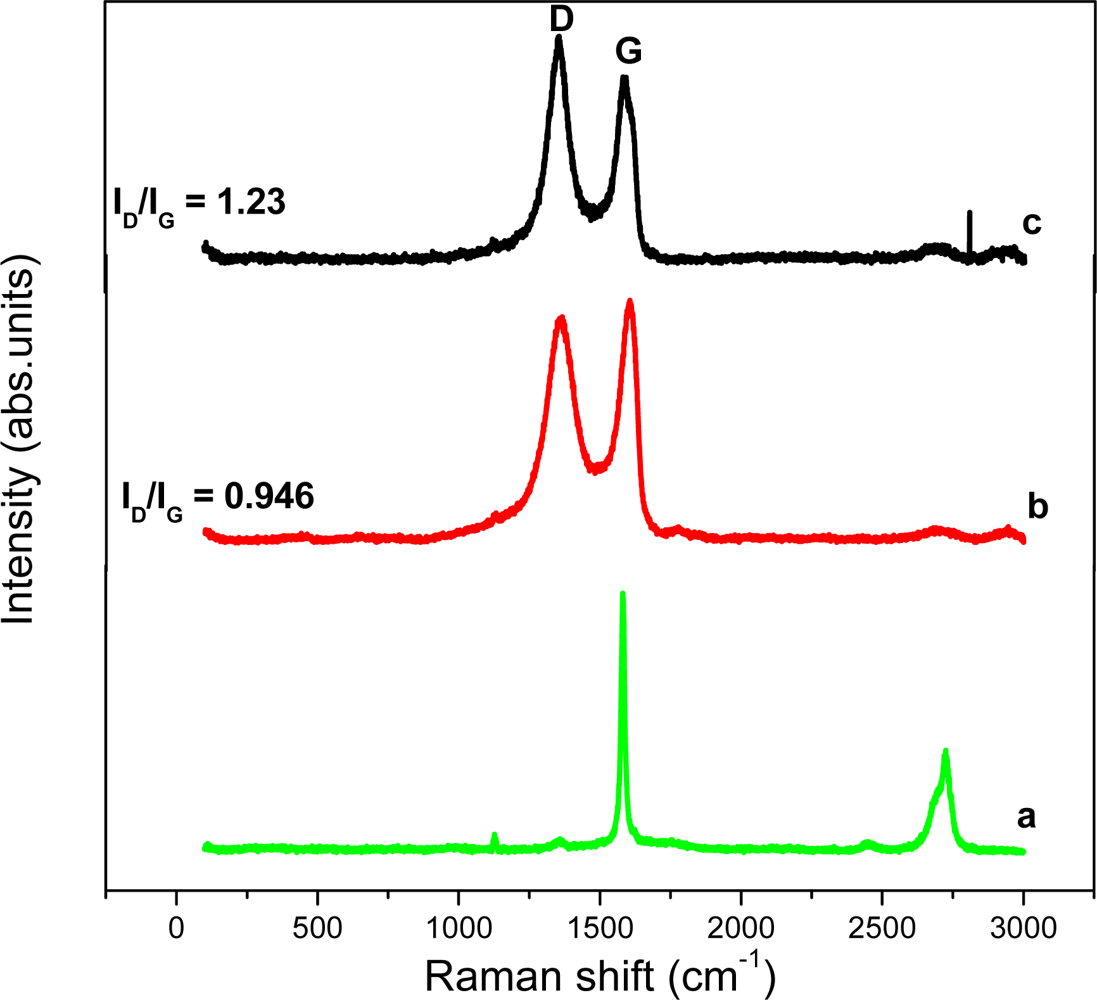
The Raman spectrum of graphite, GO and graphene is shown in Figure 3. The Raman spectra of the materials simply confirm the observations of the XRD patterns i.e., the changes of structure during the reduction process from GO to graphene. The intensity ratio (ID/IG) of D band and G band of GO is about 0.946, while the ID/IG of graphene is 1.23 due to the presence of unrepaired defects that remained after the removal of large amounts of oxygen-containing functional groups. This ID/IG ratio value is consistent with most chemical reduction reports by Fan et al. [22].
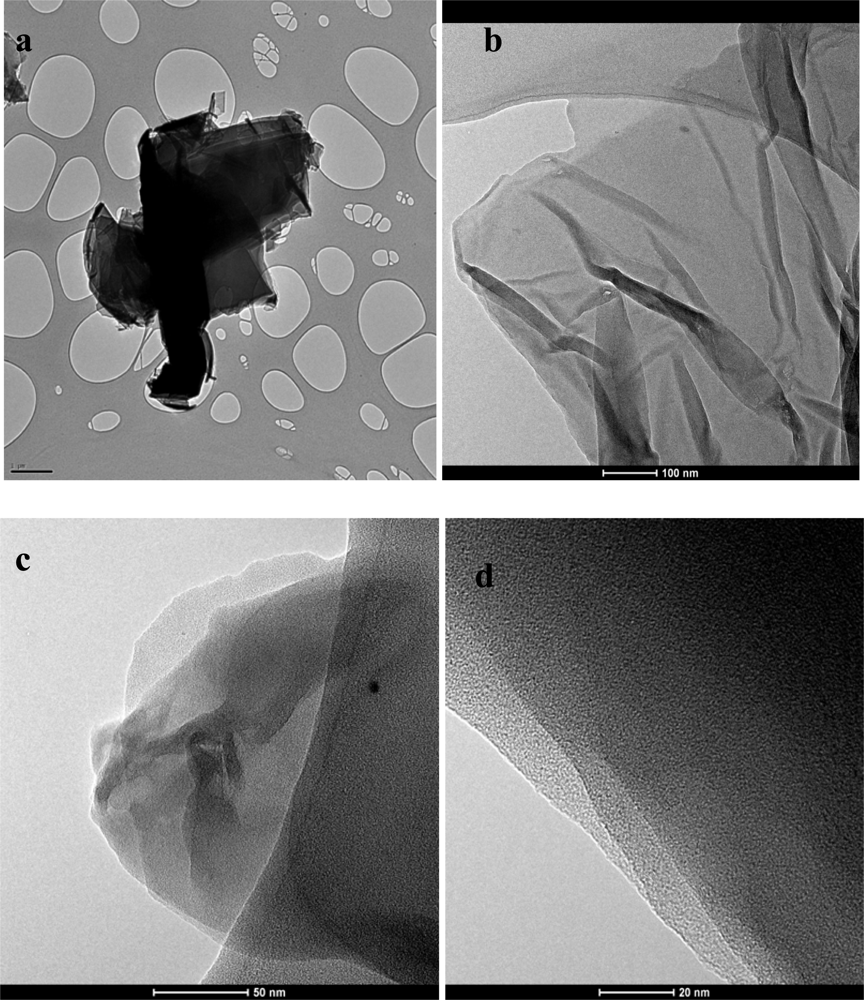
For further characterization Transmission Electron Microscopy (TEM) analysis was done. TEM samples were prepared by pipetting the graphene dispersion onto a holey mesh grid. The TEM image of graphite [Figure 4(a)], shows its graphitic structure as large thick dark flakes. Graphite cannot be exfoliated even when sonicated under the same conditions as GO. For GO [Figure 4(b)] large sheets were observed to be situated on top of the grid, resembling a wavy silk veil. The sheets are transparent and entangled with one another. The structure of graphene (reduced GO) is different from that of GO [Figure 4(c)]. At low magnification, the structure of graphene looks flat, with transparent layers on top of one another. The silk-like parts as well as the restacked parts can be seen. Wrinkles and folding are also observed on the surface as well as at the edges of the structure. Corrugation and scrolling are part of the intrinsic nature of graphene nanosheets, which results from the fact that the 2-D membrane structure becomes thermodynamically stable via bending [23]. Figure 4(d) shows a high resolution TEM (HRTEM) image of graphene. Layers of graphene can be seen in this image.
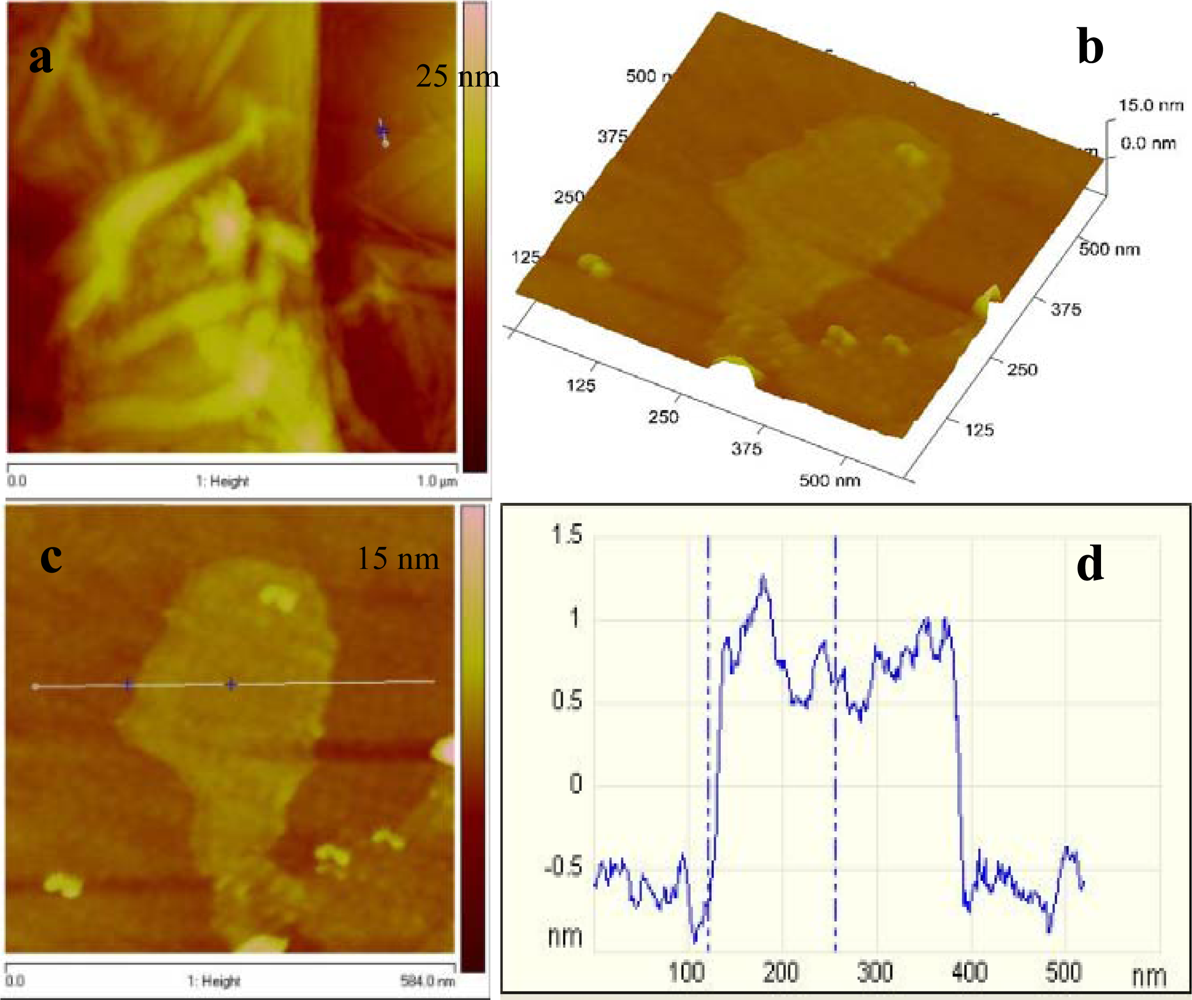
Atomic force microscopy (AFM) was also performed on graphene, to characterize the degree of exfoliation. Figure 5(a) represents the AFM topography image of graphene, wherein several graphene sheets were randomly deposited on the silicon substrate. A flat graphene sheet was selected for further investigation using the 3D view [Figure 5(b)]. The graphene surface was slightly rough and this could be due to the existence of some functional groups. The cross sectional view across the plain area of the sheet gave an estimated height of 1.3 nm which is consistent with that reported by Shen et al. [24].
3.2. Electrochemical Characterization of the Nafion-G Nanocomposite Film
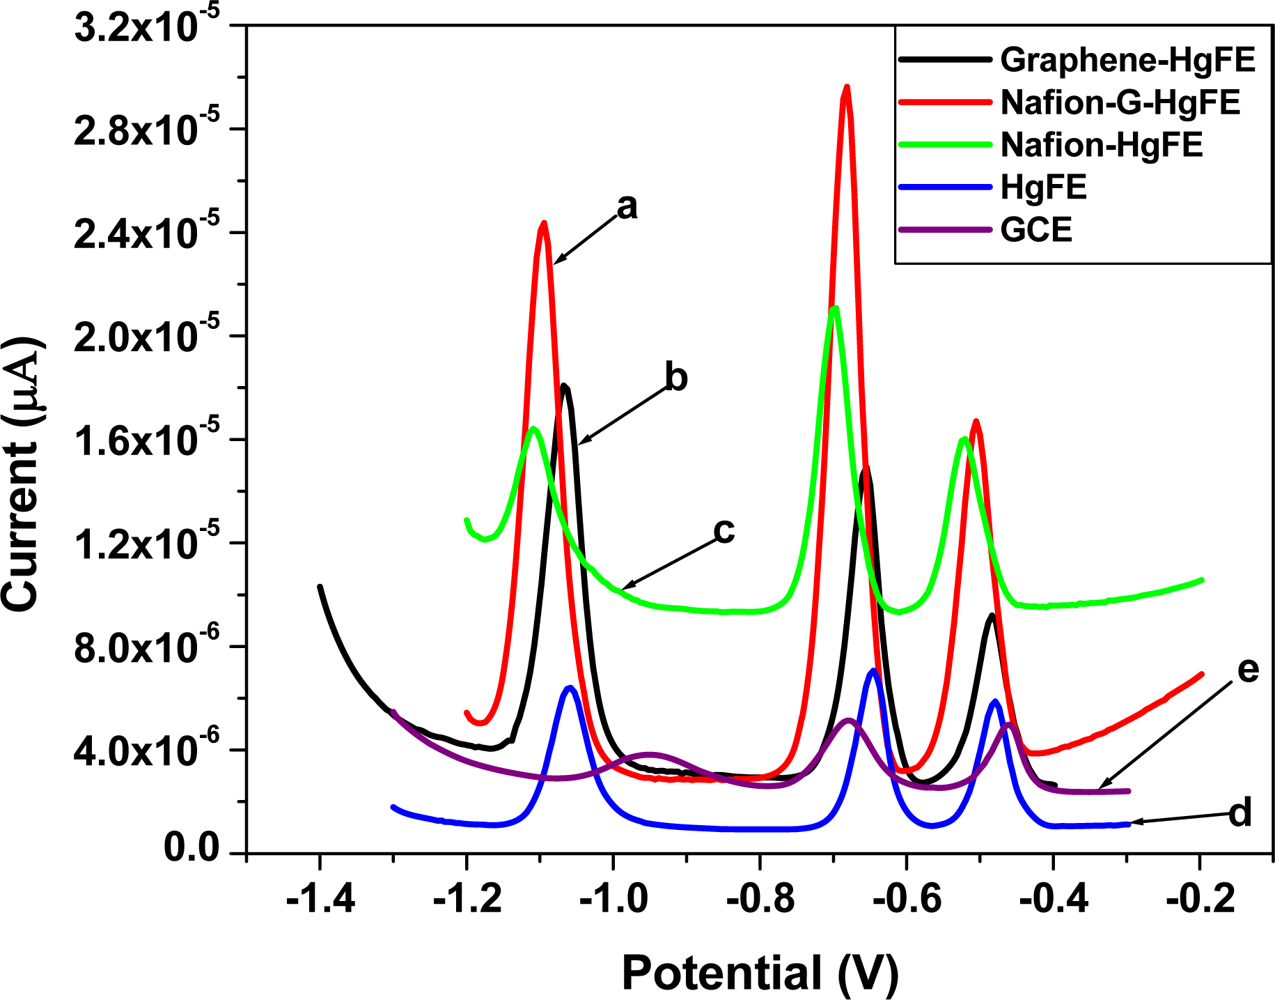
Figure 6 shows the SWASV analytical characteristics of different film coated GC electrodes e.g., Nafion (green line), Nafion-G (solid line), Graphene (black line) by in situ plated Hg-film, for Zn2+, Cd2+ and Pb2+ determination. The stripping voltammograms were obtained in a solution containing 30 μgL−1 of each of the target metals, 10 mgL−1 Hg2+ in 0.1 M acetate buffer (pH 4.6). The sharper higher peak current for the target metal ions on the five metal films were obtained at the Nafion-G-modified electrode, and is consistent with the voltammetric behaviors of carbon nanotubes/Nafion [12] and ordered mesoporous carbon/Nafion electrodes [14]. The signal enhancement may be attributed to the change of the morphologies and the structure as well as the interfacial electron-transfer properties. Each peak appearing at a certain peak potential in Figure 6, represents the point at which a particular metal strips out of the amalgam (stripping step) or is re-oxidized back into solution. The stripping potentials for Zn2+, Cd2+ and Pb2+ appear at approximately −1.1 V, −0.7 V and −0.5 V respectively; the redox reaction involved during stripping analysis is given by Equation (1):
3.3. The Effect of Experimental Variables
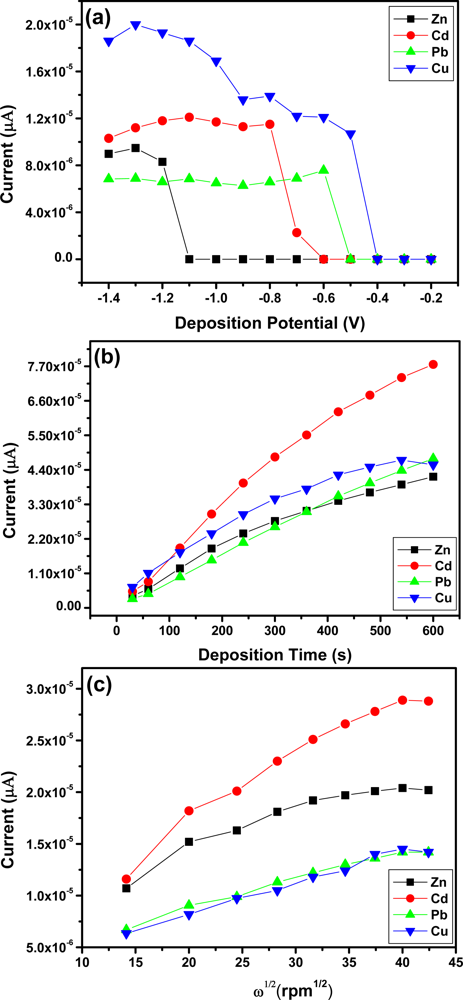
Figure 7(a) shows the effect of deposition potential on the peak current of Zn2+, Cd2+, Pb2+ and Cu2+ after 120 s, deposition was studied in the potential range from −0.2 V to −1.5 V. As the deposition potential shifts from −0.6 V to −1.2 V the stripping peak current increased and the more negative the peak potential became the peak currents started to reduce. The different trends observed for Zn2+, Cd2+, and Pb2+ and Cu2+ may be due to the different standard potentials. Thus −1.3 V was used as the optimal deposition potential for Zn2+, Cd2+ and Pb2+ in subsequent experiments whereas, an optimal deposition potential of −1.0 V was chosen for Cu2+.
The effect of deposition time on the peak currents of Zn2+, Cd2+, Pb2+ and Cu2+ was studied and the results obtained are shown in Figure 7(b). As the deposition time increased so did the stripping peak current of each metal ion. The increase occurred linearly with deposition time because of the increased amount of analyte on the Nafion-G modified electrode. A deposition time of 120 s was chosen for further analysis due to the rapid surface saturation which occurred after 120 s.
The effect of rotation speed during the pre-concentration step was also studied in the range 200–2,000 rpm [Figure 7(c)]. As the square-root of rotation speed of the stirring rod increased so did the stripping peak currents of Zn2+, Cd2+, Pb2+ and Cu2+ [28]. Establishing the optimum rotation speed facilitates the convective transport of the metal ions in solution to the working electrode surface and hence contributes towards the sensitivity of stripping analysis. A rotation speed of 1,000 rpm was chosen for further analysis.
3.4. Analytical Performance
Individual analysis of Zn2+, Cd2+, Pb2 and Cu2+
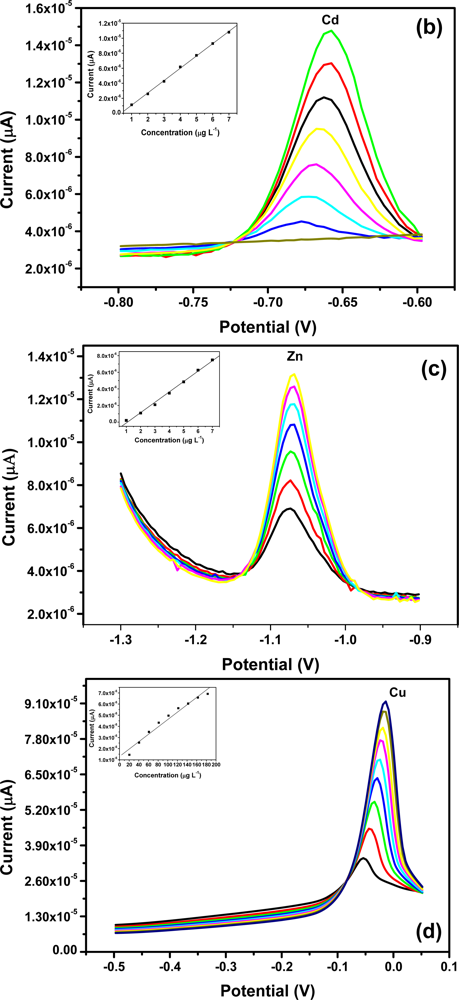
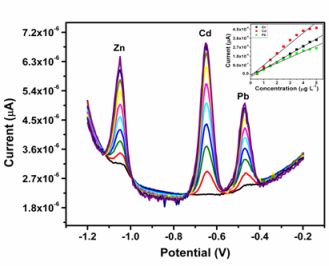
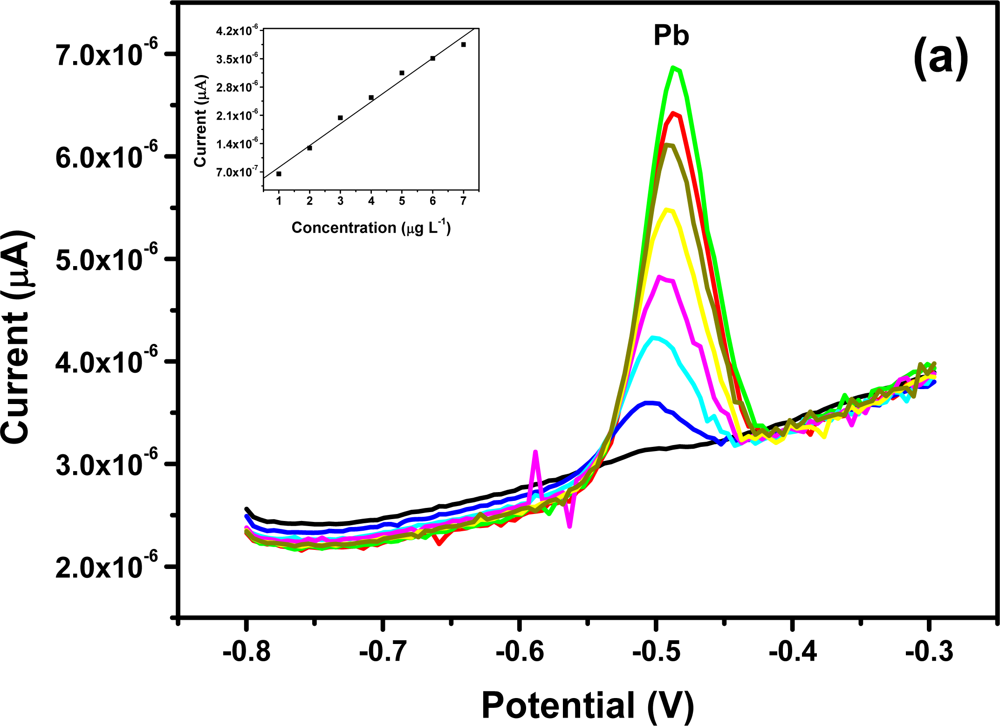
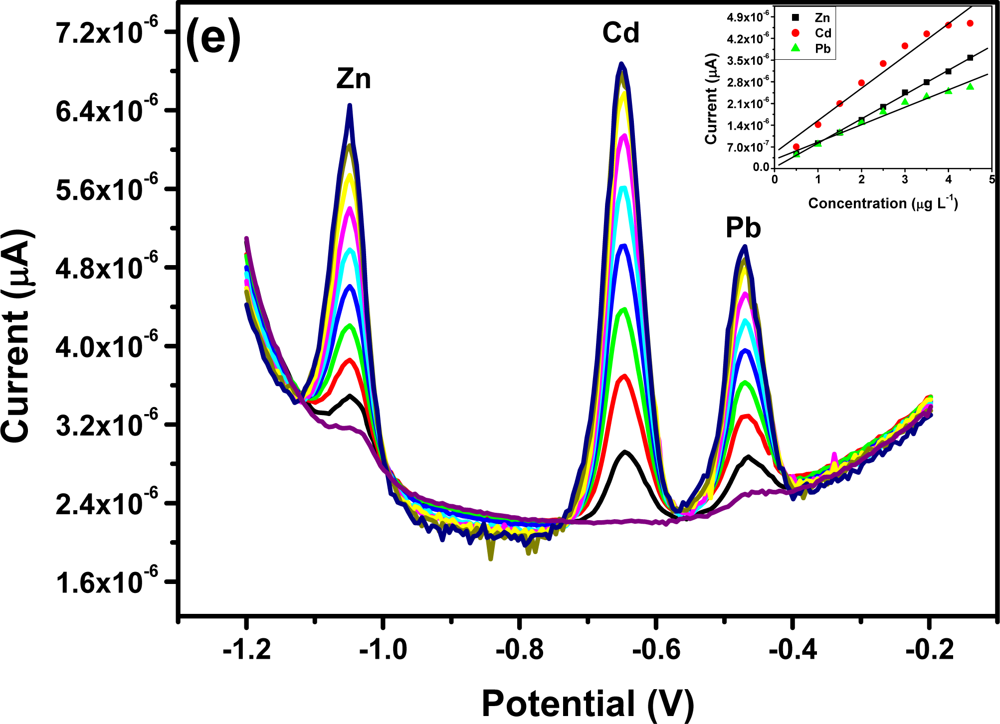
All four metals i.e., Zn2+, Cd2+, Pb2+ and Cu2+ were determined individually at the Nafion-G mercury film electrode using SWASV. Calibration plots [Figures 8(a–d)], for individual metal solutions ranging from 1–7 μg L−1 for Zn2+, Cd2+, Pb2+ and 20 μg L−1–180 μg L−1 for Cu2+, gave the sensitivities and detection limits shown in Table 1. A slight shift in the peak potentials of the metals with increasing metal ion concentration towards positive potential was observed and suggests an IR-drop effect. Figure 8(e) is the voltammograms for 0.5–5.0 μg L−1 of Zn2+, Cd2+ and Pb2+ at the Nafion-G-Hg film. The calibration plots [Figure 8(e)] for the simultaneous analysis of metals gave the sensitivities and detection limits shown in Table 2. Copper was not determined simultaneously with Zn2+, Cd2+ and Pb2+ due to the intermetallic interference which exists between Cu-Zn [25].
3.5. Comparison between Individual and Simultaneous Analysis
When comparing individual with simultaneous analysis, a difference in the sensitivities for some of the metals was observed. The sensitivity of Pb2+ remained relatively the same, whereas Cd2+ and Zn2+ showed a significant decrease when analyzed simultaneously. A similar trend was observed when Zn2+ was determined individually; here a sensitivity of 1.25 μA L μg−1 was obtained in comparison to 0.758 μA L μg−1 for the simultaneous determination.
In general, higher sensitivities were obtained for individual analysis, since only one of the metals binds to the limited number of active sites at the modified electrode surface and is involved in forming the amalgam film during the deposition step. However, during simultaneous analysis all metals present in solution compete for the limited number of active sites and are all co-deposited during the formation of the amalgam film. In addition, differences in sensitivities between individual and simultaneous determinations can also be attributed to the formation of intermetallic compounds between heavy metals when present together in the same solution [25]. The sensitivity of Pb2+ remained the same during both individual and simultaneous analysis since, it is most likely to be available for deposition whereas, the Cd2+ and Zn2+ are involved in a Zn-Cd intermetallic compound formation [26].
3.6. Detection Limits
The detection limits (3σ blank/slope) of the metals for both individual and simultaneous analysis were determined using a deposition time of 120 s and are summarized in Tables 1 and 2. A summary of previously reported analyses for Zn2+, Cd2+ and Pb2+ are shown in Table 3. The detection limits are lower for reference [18] and [39] since longer deposition times are being used to pre-concentrate the metal ions. In this work a shorter deposition time is being used, and therefore offers higher detection limits in comparison to those previously studied.
3.7. Application
The accuracy of the analysis at the Nafion-G modified electrode was evaluated through recovery studies. The electrolyte (0.1 M acetate buffer) was spiked with a known amount of metal ions and analyzed by SWASV using a deposition time of 120 s. Four replicates were run for each sample and their concentrations determined using the Standard Addition method. The recovery percentages of the metals are shown Table 4.
Individual analysis of Cd2+, Pb2+ and Cu2+ was done in the same solution whereas, Zn2+ was determined using a fresh sample. The reason being, that a very low recovery for Zn2+ was obtained when analyzed in the same sample as well as simultaneously. This is due to the competition of metals for the Nafion-G mercury film and also the intermetallic interaction which exists between Zn2+ and Cu2+. According to Lazar et al. [25], this interference is most pronounced when Zn2+ and Cu2+ are determined simultaneously, which is clearly shown from the results obtained (Table 4).
Results from Table 4 also show a variation in stripping voltammetry and ICP-MS analysis. This may be due to different interferences which are inherent to a particular technique and which ultimately influences the final result. Furthermore, the low ICP-MS results could also be due to the manner in which the samples were prepared.
For the purpose of practical applicability, a real water sample was collected from Edith Stephens Wetlands Park and Nafion-G HgFE was employed for the determination of Zn2+, Cd2+ and Pb2+ metal ions. The lake water was adjusted to pH 4.6 using sodium acetate buffer. A deposition time of 600 s was used for the analysis. The determination of metal ions in the lake water is hampered by the presence of organic compounds (e.g., humic acids) which may form stable complexes with the metal ions thus making the metal ions unavailable for analysis. In addition, these organic acids also absorb onto the surface of the working electrode thus decreasing the surface area of the electrode causing a reduction in the analytical signal. As a consequence a longer deposition time was used to obtain a signal [40]. The results obtained were compared with ICP-MS. The Nafion-G HgFE was sensitive enough to be able to detect Zn2+, Cd2+ and Pb2+ as shown in Table 5. However, for Cd2+, a higher result was obtained with ICP-MS compared to SWASV which may be due to the intrinsic difficulties of working associated with working at ultra-trace levels. The non-detection of Cu2+ can be attributed to the formation of stable copper complexes with organic compounds or humic acids.
4. Conclusions
A highly enhanced sensing platform based on the Nafion-graphene nanocomposite film was established for the individual as well as simultaneous determination of Zn2+, Cd2+, Pb2+ and Cu2+ by square-wave anodic stripping voltammetry. The nanocomposite film combining the advantages of graphene and the cation exchange capacity of Nafion enhanced the sensitivity of the target metal ions. Herein the cation exchange capacity of the Nafion and the enhanced electron conduction of graphene are combined to yield a sensing platform with enhanced sensitivity towards selected metal ions. The Nafion not only acts as an effective solubilizing agent for graphene nanocomposite but also as an antifouling coating to reduce the influence of surface-active macromolecules. The electrochemical sensing interface exhibited excellent stripping performances for trace analysis of Zn2+, Cd2+ and Pb2+ combining the advantages of graphene nanosheets together with the unique features of the in situ plating mercury film. The analytical application of the Nafion-G modified electrode was assessed by doing recovery studies followed by real sample analysis and the result for the Nafion-G-HgFE electrode was compared with the results obtained by ICP-MS. The detection limits obtained for each metal clearly showed that this technique is capable of detecting metals below the detection requirement of the Environmental Protective Agency (EPA) namely, Pb2+ (15 μg L−1), Cd2+ (5 μg L−1) and Zn2+ (5 mg L−1).
Acknowledgments
The authors would like to thank the financial support of SASOL.
References
- Lewis, AB; Cohen, SM. Addressing lead toxicity: Complexation of lead (II) with thiopyrone and hydroxypyridinethione O, S mixed chelators. Inorg. Chem 2009, 43, 6534–6536. [Google Scholar]
- Wang, J. Stripping Analysis: Principles, Instrumentation, and Application; VCH Publishers, Inc: Deerfield Beach, FL, USA, 1985. [Google Scholar]
- Sanna, GS; Pilo, MI; Piu, PC; Tapparo, A; Seeber, R. Determination of heavy metals in honey by anodic stripping voltammetry at microelectrodes. Anal. Chim. Acta 2000, 415, 165–173. [Google Scholar]
- Wu, HP. Dynamics and perfirmance of fast linear scan anodic stripping voltammetry of cadmium, lead and copper using in situ-generated ultrathin mercury films. Anal. Chem 1996, 68, 1639–1645. [Google Scholar]
- Kefala, G; Economou, A; Voulgaropoulos, A; Sofoniou, M. A study of bismuth-film electrodes for the detection of trace metals by anodic stripping voltammetry and their application to the determination of Pb and Zn in tapwater and human hair. Talanta 2003, 61, 603–610. [Google Scholar]
- Lau, OW. Determination of zinc in environmental samples by anodic stripping voltammetry. Anal. Chim. Acta 1998, 376, 197–207. [Google Scholar]
- Baldo, MA; Bragato, C; Daniele, S. Determination of lead and copper in wine by anodic stripping voltammetry with mercury microelectrodes: Assessment of the influence of sample pretreatment procedures. Analyst 1997, 122, 1–5. [Google Scholar]
- Akkermans, RP; Ball, JC; Rebbitt, TO; Marken, F; Compton, RG. Sono-electroanalysis: Application to the detection of lead in wine. Electrochim. Acta 1998, 43, 3443–3449. [Google Scholar]
- Cutress, IJ; Marken, F; Compton, RG. Microwave-assisted electroanalysis: A review. Electroanalysis 2009, 21, 113–123. [Google Scholar]
- Tsai, YC; Coles, BA; Compton, RG; Marken, F. Microwave activation of electrochemical processes: Square-wave voltammetric stripping detection of cadmium on the presence of the surfactant triton X. Electroanalysis 2001, 13, 639–645. [Google Scholar]
- Jasinski, M; Grundler, P; Flechig, GU; Wang, J. Anodic stripping voltammetry with a heated mercury film on a screen-printed carbon electrode. Electroanalysis 2001, 13, 34–36. [Google Scholar]
- Wu, KB; Hu, SS; Fei, JJ; Bai, W. Mercury-free simultaneous determination of Cd2+ and Pb2+ at a glassy carbon electrode modified with multi-wall carbon nanotubes. Anal. Chim. Acta 2003, 489, 215–221. [Google Scholar]
- Xu, H; Zeng, LP; Xing, SJ; Xian, YZ; Shi, GY; Jin, LT. Ultrasensitive voltammetric detection of trace lead (II), and cadmium (II) using MWCNTs-Nafion-Bismuth composite electrodes. Electroanalysis 2008, 20, 2644. [Google Scholar]
- Zhu, LD; Tian, CY; Yang, RL; Zhai, JL. Anodic stripping voltammetric determination of lead in tap water at an ordered mesoporous Carbon-Nafion composite film electrode. Electroanalysis 2008, 20, 527–533. [Google Scholar]
- Yantasee, W; Deibler, LA; Fryxell, GE; Timchalk, C; Lin, YH. Screen-printed electrodes modified with functionalized microporous silica for voltammetric analysis of toxic metal ions. Electrochem. Commun 2005, 7, 1170–1176. [Google Scholar]
- Sonthalia, P; McGaw, E; Show, Y; Swain, GM. Metal ion analysis in contaminated water using anodic stripping voltammetry and a nanocrystalline diamond thin-film electrode. Anal. Chim. Acta 2004, 522, 35–44. [Google Scholar]
- Brainina, KZ; Stozhko, NY; Belysheva, GM; In-zhevatova, OV; Kolydina, LI; Cremisini, C; Galletti, M. Determination of heavy metals in wine by anodic stripping voltammetry with thick modified electrode. Anal. Chim. Acta 2004, 514, 227–234. [Google Scholar]
- Li, J; Guo, S; Zhai, Y; Wang, E. Nafion–graphene nanocomposite film as enhanced sensing platform for ultrasensitive determination of cadmium. Electrochem. Commun 2009, 11, 1085–1088. [Google Scholar]
- Kovtyukhova, NI; Ollivier, PJ; Martin, BJ; Mallouk, TE; Chizhik, SA; Buzaneva, EV; Gorchinskiy, AD. Layer-by-layer assembly of ultrathin composite films from mictron-size graphite. Chem. Mater 1999, 11, 771. [Google Scholar]
- Hummers, WS; Offerman, RE. Preparation of graphitic oxide. J. Am. Chem. Soc 1958, 80, 1339. [Google Scholar]
- Chen, W; Yan, L; Bangal, PR. Preparation of graphene by the rapid and mild thermal reduction of graphene oxide induced by microwaves. CARBON 2010, 48, 1146–1152. [Google Scholar]
- Fan, Z; Wang, K; Wei, T; Yan, J; Song, L; Shao, B. An environmentally friendly and efficient route for the reduction of graphene oxide by aluminum powder. CARBON 2010, 48, 1670–1692. [Google Scholar]
- Wang, G; Shen, X; Wang, B; Yao, J; Park, J. Graphene nanosheets for enhanced lithium storage in lithium ion bateries. CARBON 2009, 47, 2049–2053. [Google Scholar]
- Shen, J; Hu, Y; Shi, M; Lu, X; Qin, C; Li, C; Ye, M. Fast and facile preparation of graphene oxide and reduced graphene oxide nanoplatelets. Chem. Mater 2009, 21, 3514–3520. [Google Scholar]
- Lazar, B; Nishri, A; Ben-Yaakov, S. Mutual interferences in the determination of Zn (II) and Cd (II) in seawater by anodic stripping voltammetry. J. Electroanal. Chem 1981, 125, 295–306. [Google Scholar]
- Fu, Y; Xu, M; Li, X; Du, M; Wang, J; Zhou, F. Voltammetric studies of cadmium- and zinc-containing metallothioneins at nafion-coated mercury thin film electrodes. Electroanalysis 2008, 20, 888–893. [Google Scholar]
- Tesarova, E; Baldrianova, L; Hocevar, SB; Svancara, I; Vytras, K; Ogorevc, B. Anodic stripping voltammetric measurement of trace heavy metals at antimony film carbon paste electrode. Electrochim. Acta 2009, 54, 1506–1510. [Google Scholar]
- Hwang, GH; Han, WK; Park, JS; Kang, SG. Determination of trace metals by anodic stripping voltammetry using a bismuth-modified carbon nanotube electrode. Talanta 2008, 76, 301–308. [Google Scholar]
- Svancara, I; Baldrianova, L; Tesarova, E; Hocevar, SB; Elsuccary, SAA; Economou, A; Sotiropoulos, S; Ogorevc, B; Vytras, K. Recent advances in anodic stripping voltammetry with bismuth-modified carbon paste electrodes. Electroanalysis 2006, 18, 177. [Google Scholar]
- Lee, GK; Lee, HM; Rhee, CK. Bismuth nano-powder electrode for trace anaysis of heavy metals using anodic stripping voltammetry. Electrochem. Commun 2007, 9, 2514–2518. [Google Scholar]
- Wu, Y; Li, NB; Luo, HQ. Simultaneous measurement of Pb, Cd and Zn using differential pulse anodic stripping voltammetry at a bismuth/poly (p-aminobenzene sulfonic acid) film electrode. Sensor Actuat 2008, 133, 677–681. [Google Scholar]
- Rico, MAG; Ollivares-Marin, M; Gil, EP. Modification of carbon screen printed electrodes by adsorption of chemically synthesized Bi nanoparticles for the voltammetric stripping detection of Zn (II), Cd (II) and Pb (II). Talanta 2009, 80, 631–635. [Google Scholar]
- Tall, OEI; Jaffrezic-Renault, N; Sigaud, M; Vittori, O. Anodic stripping voltammetry of heavy metals at nanocrystalline boron-doped diamond electrode. Electroanalysis 2007, 18, 177–185. [Google Scholar]
- Rahacek, V; Hotovy, I; Vojs, M; Mika, F. Bismuth film electrodes for heavy metal determination. Microsyst. Technol 2008, 14, 491–498. [Google Scholar]
- McGaw, E; Swain, GM. A comparison of boron-doped diamond thin film and Hg-coated glassy carbon electrodes for anodic stripping voltammetric determination of heavy metals in aqueous media. Anal. Chim. Acta 2006, 575, 180–189. [Google Scholar]
- Siriangkhawut, W; Pencharee, S; Grudpan, K; Jakmunee, J. Sequential injection monosegmented flow voltammetric determination of cadmium and lead using a bismuth film working electrode. Talanta 2009, 79, 1118–1124. [Google Scholar]
- Torma, F; Kadar, M; Toth, K; Tatar, E. Nafion/2,2′-bipyridyl-modified bismuth film electrode for anodic stripping volatmmetry. Anal. Chim. Acta 2008, 619, 173–182. [Google Scholar]
- Kefala, G; Economou, A. Polymer-coated bismuth film electrode for the determination of trace matals by sequentail-injection analysis/anodic stripping volatmmetry. Anal. Chim. Acta 2006, 576, 283–289. [Google Scholar]
- Li, J; Guo, S; Zhai, Y; Wanga, E. High-sensitivity determination of lead and cadmium based on the Nafion-graphene composite film. Anal. Chim. Acta 2009, 649, 196–201. [Google Scholar]
- Sosnin, EA; Batalova, VN; Buyanova, EY; Tarasenko, VF. Comparative study of interference elimination in heavy metals control by anodic stripping voltammetry. PHYCON 2003, 1, 349–351. [Google Scholar]


| Electrode | Individual | Sensitivity (μA L μg−1) | R2 | Detection limit (μg L−1) |
|---|---|---|---|---|
| Pb2+ | 0.541 ± 0.06 | 0.992 | 0.07 | |
| Nafion-G HgFE | Cd2+ | 1.64 ± 0.13 | 0.999 | 0.08 |
| Zn2+ | 1.25 ± 0.22 | 0.997 | 0.07 | |
| Cu2+ | 12.95 ± 1.13 | 0.985 | 0.13 |
| Electrode | Simultaneous | Sensitivity (μA L μg−1) | R2 | Detection Limit (μg L−1) |
|---|---|---|---|---|
| Pb2+ | 0.557 ± 0.04 | 0.990 | 0.07 | |
| Nafion-G HgFE | Cd2+ | 1.070 ± 0.10 | 0.983 | 0.13 |
| Zn2+ | 0.758 ± 0.07 | 0.999 | 0.14 |
| Detected Metal | Electrode Type | Deposition Time | Electrochemical Stripping Technique | Detection Limit (μg L−1) | Reference Number |
|---|---|---|---|---|---|
| Pb2+, Cd2+ | Sb film C-paste | 120 s | SWASV | Pb2+ = 0.8 Cd2+ = 0.2 | [27] |
| Pb2+, Cd2+, Zn2+ | Bi-C-nanotube | 300 s | SWASV | Pb2+ = 1.3 Cd2+ = 0.7 Zn2+ = 12 | [28] |
| Pb2+, Cd2+ | Bi film C-paste | 120 s | SWASV | Pb2+ = 0.8 Cd2+ = 1.0 | [29] |
| Pb2+, Cd2+ | Bi nanopowder on carbon | 180 s | SWASV | Pb2+ = 0.15 Cd2+ = 0.07 | [30] |
| Pb2+, Cd2+, Zn2+ | Bi/poly (p-ABSA) | 240 s | DPASV | Pb2+ = 0.8 Cd2+ = 0.63 Zn2+ = 0.62 | [31] |
| Pb2+, Cd2+, Zn2+ | Bi nanoparticles on screen printed C | 120 s | SWASV | Pb2+ = 0.9 Cd2+ = 1.3 Zn2+ = 2.6 | [32] |
| Pb2+, Cd2+, Zn2+, Cu2+ | Boron-doped diamond | 60 s | DPASV | Pb2+ = 1.15 Cd2+ = 0.36 Zn2+ = 1.6 | [33] |
| Pb2+, Cd2+, Zn2+ | Disc graphite BiFE | 120 s | SWASV | Pb2+ = 0.497 Cd2+ = 0.325 Zn2+ = 0.785 | [34] |
| Pb2+, Cd2+, Zn2+, Cu2+, Ag+ | Boron-doped diamond | DPASV | Pb2+ = 5.0 Cd2+ = 1.0 Zn2+ = 50 | [35] | |
| Pb2+, Cd2+, Zn2+, Cu2+, Ag+ | Mercury film electrode | DPASV | Pb2+ = 5.0 Cd2+ = 1.0 Zn2+ = 10 | [35] | |
| Pb2+, Cd2+ | BiFE | 90 s | SWASV | Pb2+ = 6.9 Cd2+ = 1.4 | [36] |
| Pb2+, Cd2+, Zn2+ | NC(Bpy)BiFE | 120 s | SWASV | Pb2+ = 0.077 Cd2+ = 0.12 Zn2+ = 0.56 | [37] |
| Pb2+, Cd2+, Zn2+ | NC BiFE | SWASV | Pb2+ = 2 Cd2+ = 2 Zn2+ = 6 | [38] | |
| Cd2+ | Nafion-G HgFE | 500 s | DPASV | Cd2+ = 0.005 | [18] |
| Pb2+, Cd2+ | Nafion-G BiFE | 300 s | DPASV | Pb2+ = 0.02 Cd2+ = 0.02 | [39] |
| Pb2+, Cd2+, Zn2+ | Nafion-G HgFE | 120 s | SWASV | Pb2+ = 0.04 Cd2+ = 0.08 Zn2+ = 0.07 | In this work |
| Electrode | Individual | Simultaneous | ICP-MS |
|---|---|---|---|
| Pb2+ | 100.2% | 78.5% | 72.0% |
| Cd2+ | 113.9% | 90.8% | 71.2% |
| Zn2+ | 69.0% | 19.8% | 94.2% |
| Cu2+ | 89.0% | 64.0% | 84.1% |
| Metals | Individual (μg L−1) | ICP-MS (μg L−1) |
|---|---|---|
| Pb2+ | 0.534 ± 0.042 | 0.520 ± 0.01 |
| Cd2+ | 0.1403 ± 0.005 | <0.009 ± 2.9 × 10⁻⁵ – 0.65 ± 0.02 |
| Zn2+ | 1.817 ± 0.499 | 2.301 ± 0.03 |
| Cu2+ | Not Detected | 5.780 ± 0.08 |
© 2011 by the authors; licensee MDPI, Basel, Switzerland. This article is an open access article distributed under the terms and conditions of the Creative Commons Attribution license (http://creativecommons.org/licenses/by/3.0/).
Share and Cite
Willemse, C.M.; Tlhomelang, K.; Jahed, N.; Baker, P.G.; Iwuoha, E.I. Metallo-Graphene Nanocomposite Electrocatalytic Platform for the Determination of Toxic Metal Ions. Sensors 2011, 11, 3970-3987. https://doi.org/10.3390/s110403970
Willemse CM, Tlhomelang K, Jahed N, Baker PG, Iwuoha EI. Metallo-Graphene Nanocomposite Electrocatalytic Platform for the Determination of Toxic Metal Ions. Sensors. 2011; 11(4):3970-3987. https://doi.org/10.3390/s110403970
Chicago/Turabian StyleWillemse, Chandre M., Khotso Tlhomelang, Nazeem Jahed, Priscilla G. Baker, and Emmanuel I. Iwuoha. 2011. "Metallo-Graphene Nanocomposite Electrocatalytic Platform for the Determination of Toxic Metal Ions" Sensors 11, no. 4: 3970-3987. https://doi.org/10.3390/s110403970
APA StyleWillemse, C. M., Tlhomelang, K., Jahed, N., Baker, P. G., & Iwuoha, E. I. (2011). Metallo-Graphene Nanocomposite Electrocatalytic Platform for the Determination of Toxic Metal Ions. Sensors, 11(4), 3970-3987. https://doi.org/10.3390/s110403970