Optimization of Anodized-Aluminum Pressure-Sensitive Paint by Controlling Luminophore Concentration


Abstract
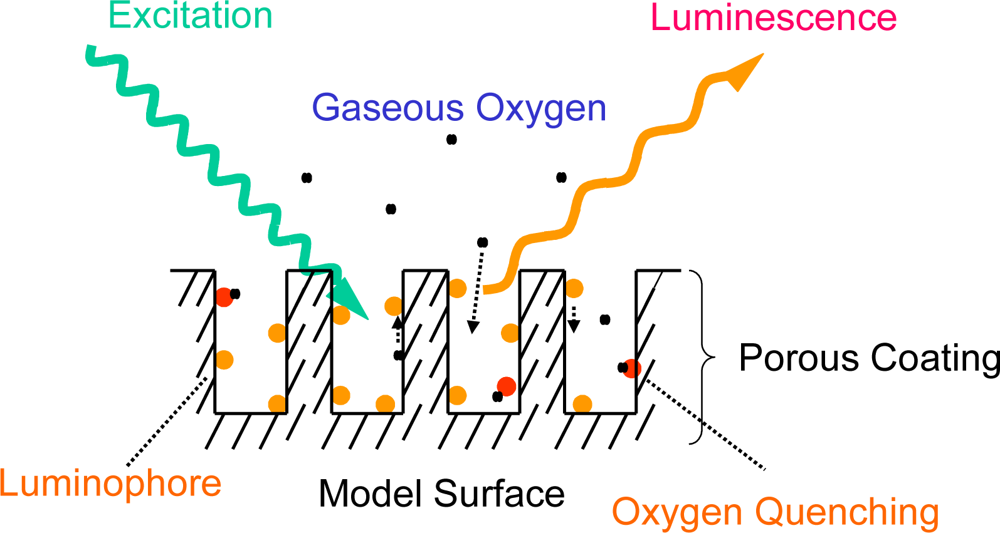
:1. Introduction
2. Experiment
2.1. Sample Conditions
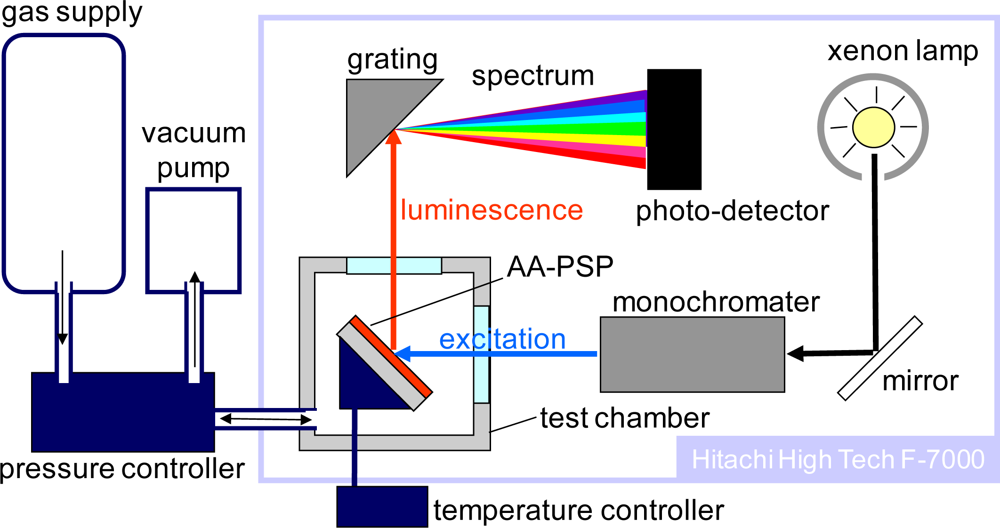
2.2. Calibration System
2.3. Pressure Sensitivity
2.4. Temperature Dependency
2.5. Signal Level
3. Results
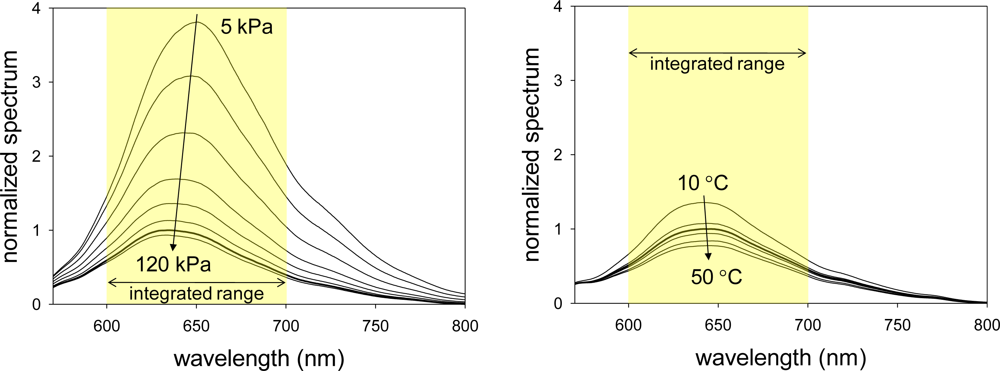
3.1. AA-PSP Spectrum
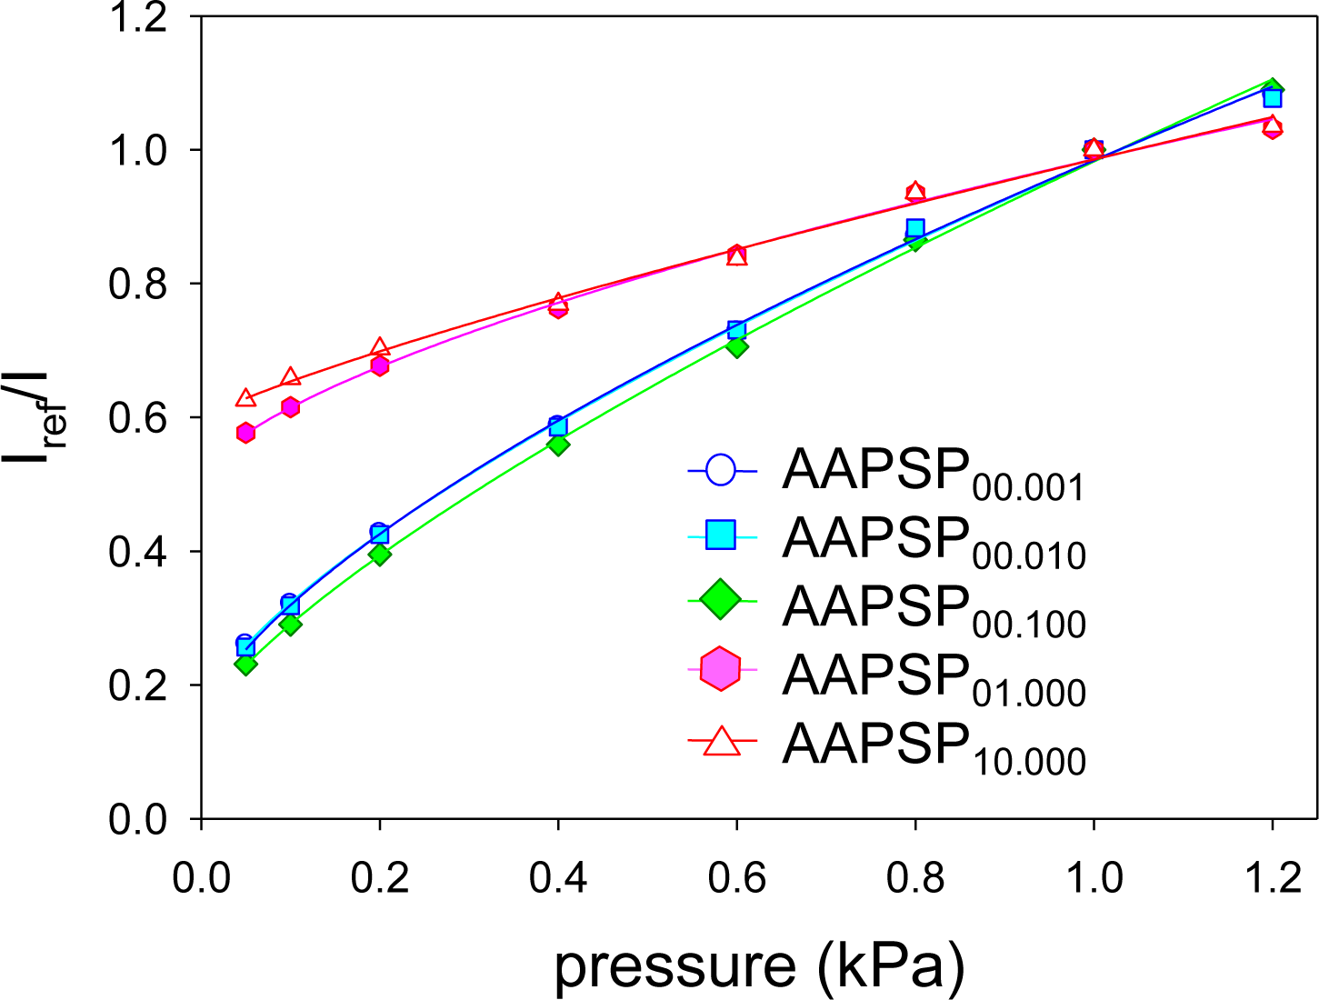
3.2. Pressure Calibration
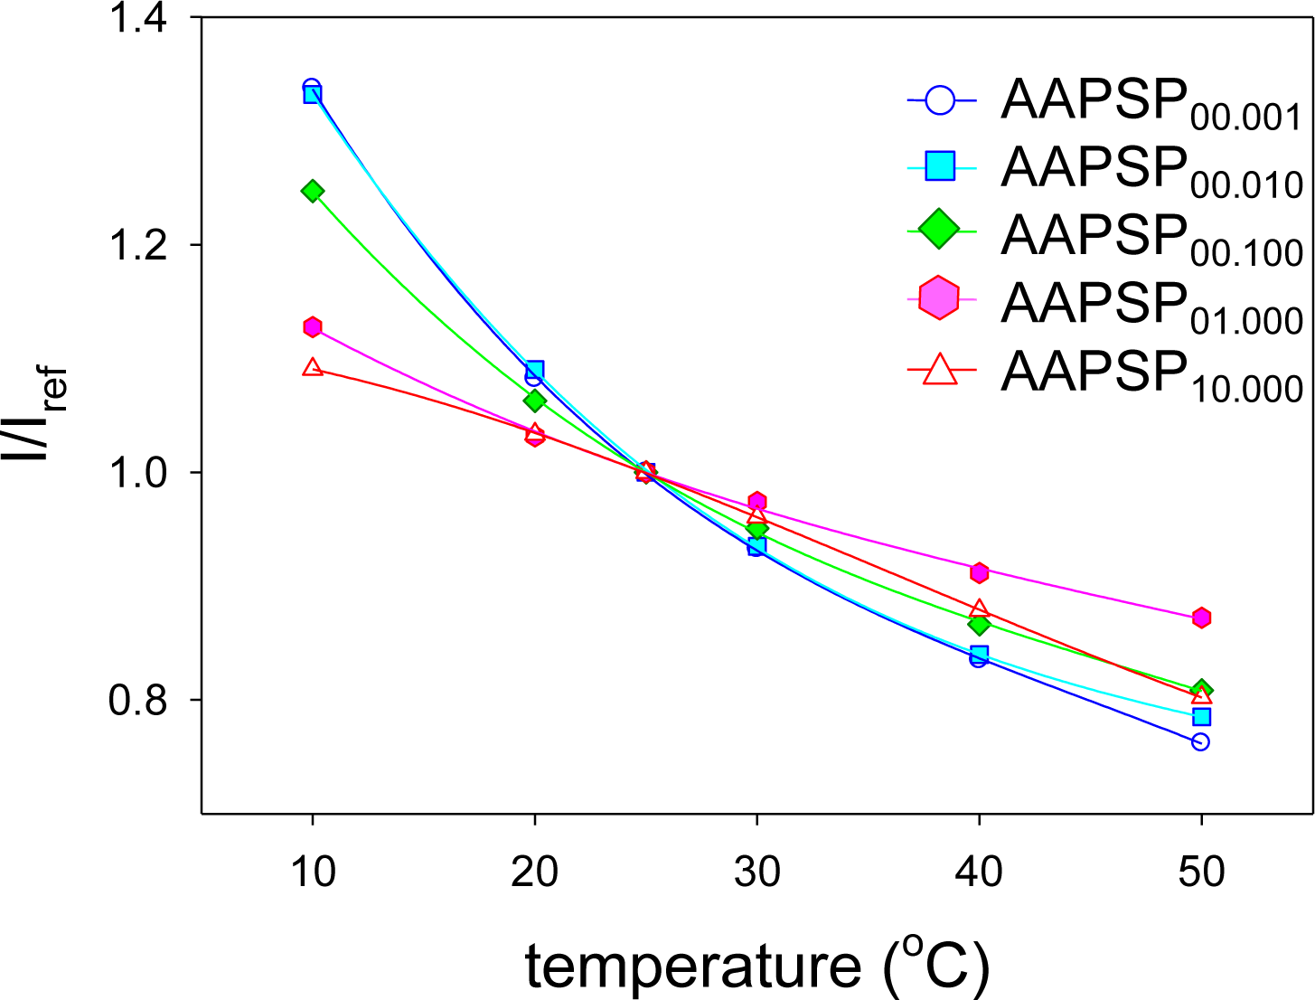
3.3. Temperature Calibration
3.4. Luminescent Signal
4. Discussion
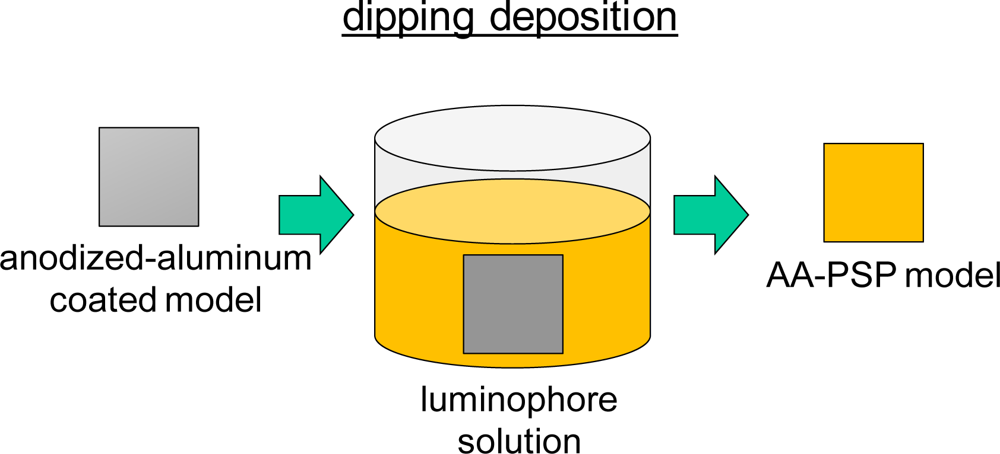
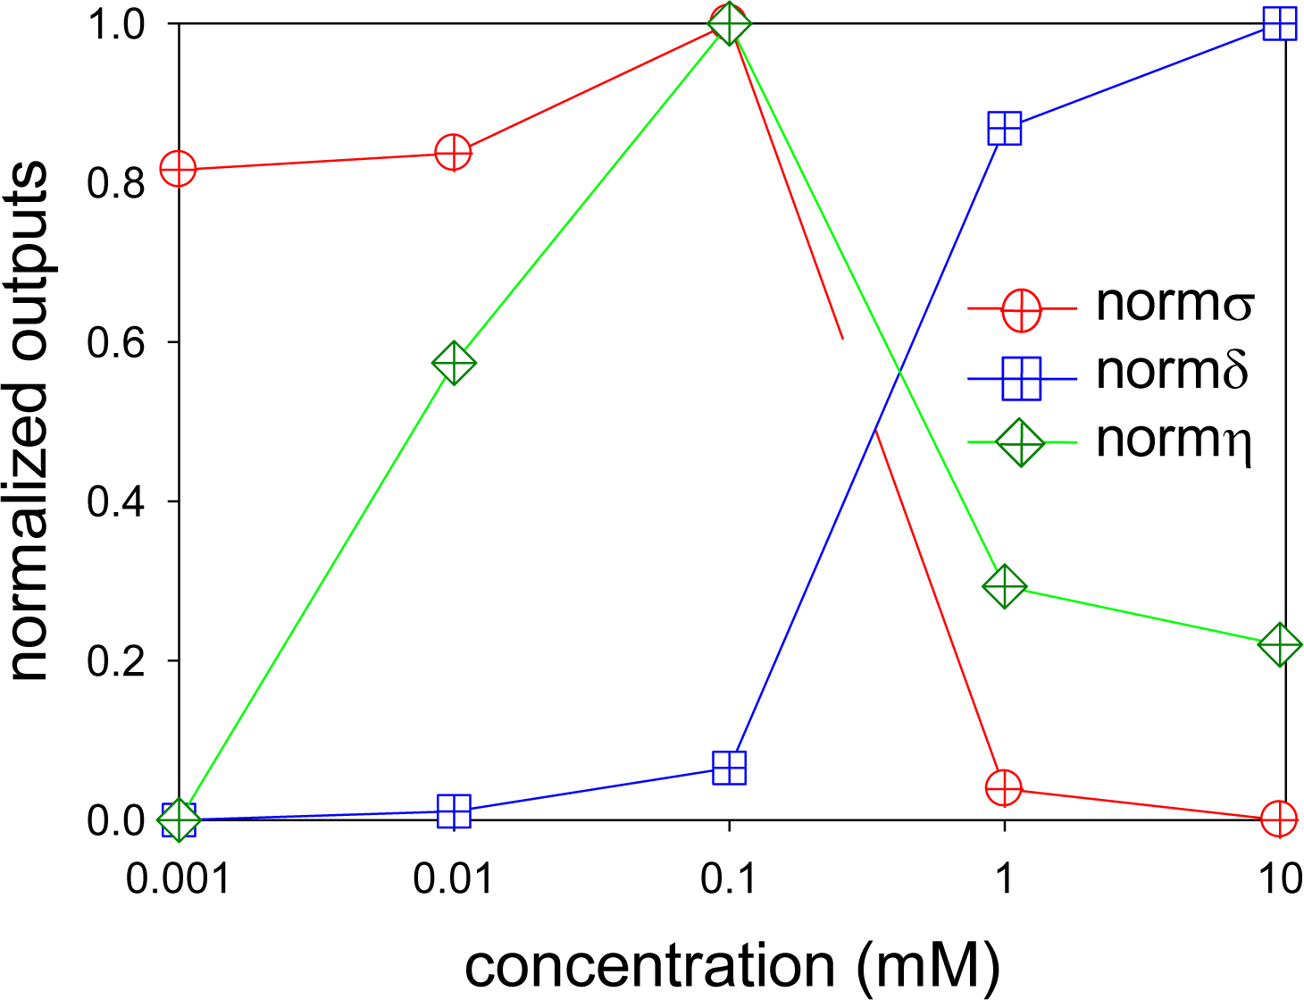
4.1. Optimum Luminophore Concentration for Dipping Deposition Method
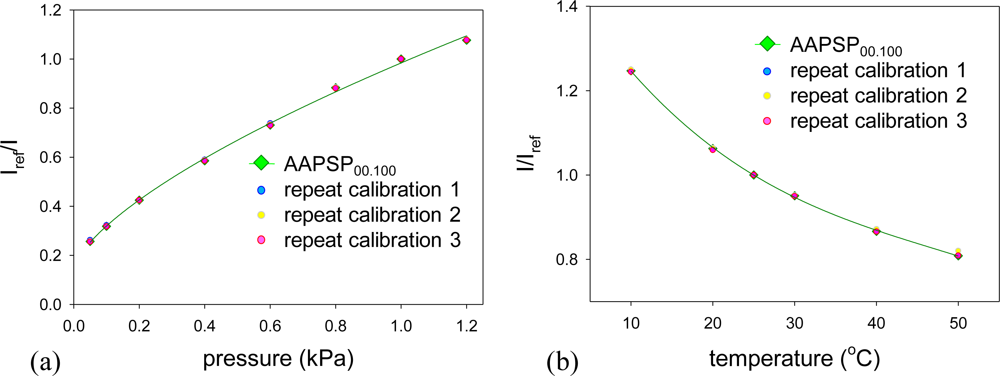
4.2. Repeatability
4. Conclusions
Acknowledgments
References
- Kameda, M; Tabei, T; Nakakita, K; Sakaue, H; Asai, K. Image Measurement of Unsteady Pressure Fluctuation by a Pressure-Sensitive Coating on Porous Anodized Aluminum. Meas. Sci. Technol 2005, 16, 2517–2524. [Google Scholar]
- Kameda, M; Tezuka, N; Hangai, T; Asai, K; Nakakita, K; Amao, M. Adsorptive Pressure-Sensitive Coatings on Porous Anodized Aluminum. Meas. Sci. Technol 2004, 15, 489–500. [Google Scholar]
- Sakaue, H. Luminophore Application Method of Anodized Aluminum Pressure Sensitive Paint as a Fast Responding Global Pressure Sensor. Rev. Sci. Instrum 2005, 76, 084101. [Google Scholar]
- Liu, T; Sullivan, JP. Pressure and Temperature Sensitive Paints; Springer Verlag: Heidelberg, Germany, 2004; pp. 27–31, Chapter 7. [Google Scholar]
- Lakowicz, JR. Principles of Fluorescence Spectroscopy; Kluwer Academic/Plenum Publishers: New York, NY, USA, 1999; Chapter 1.4.A. [Google Scholar]
- Liu, T; Guille, M; Sullivan, JP. Accuracy of Pressure Sensitive Paint. AIAA J 2001, 40, 103–112. [Google Scholar]


| Sample ID | Luminophore Concentration (mM) |
|---|---|
| AAPSP00.001 | 0.001 |
| AAPSP00.010 | 0.01 |
| AAPSP00.100 | 0.1 |
| AAPSP01.000 | 1 |
| AAPSP10.000 | 10 |
| Sample ID | Pressure Sensitivity σ (%) | Temperature Dependency δ (%/°C) | Signal Level η (%) |
|---|---|---|---|
| AAPSP00.001 | 57 | −1.44 | 27.5 |
| AAPSP00.010 | 58 | −1.43 | 69.1 |
| AAPSP00.100 | 62 | −1.38 | 100.0 |
| AAPSP01.000 | 33 | −0.73 | 48.7 |
| AAPSP10.000 | 31 | −0.62 | 43.4 |
| Sample ID | nopt *1 | nopt *2 | nopt *3 |
|---|---|---|---|
| AAPSP00.001 | 0.8160 | 0.2720 | 0.0816 |
| AAPSP00.010 | 0.8368 | 0.4738 | 0.1497 |
| AAPSP00.100 | 1.0000 | 0.6884 | 0.2522 |
| AAPSP01.000 | 0.0389 | 0.4001 | 0.7278 |
| AAPSP10.000 | 0.0000 | 0.4066 | 0.8220 |
© 2010 by the authors licensee MDPI, Basel, Switzerland. This article is an open access article distributed under the terms and conditions of the Creative Commons Attribution license (http://creativecommons.org/licenses/by/3.0/).
Share and Cite
Sakaue, H.; Ishii, K. Optimization of Anodized-Aluminum Pressure-Sensitive Paint by Controlling Luminophore Concentration. Sensors 2010, 10, 6836-6847. https://doi.org/10.3390/s100706836
Sakaue H, Ishii K. Optimization of Anodized-Aluminum Pressure-Sensitive Paint by Controlling Luminophore Concentration. Sensors. 2010; 10(7):6836-6847. https://doi.org/10.3390/s100706836
Chicago/Turabian StyleSakaue, Hirotaka, and Keiko Ishii. 2010. "Optimization of Anodized-Aluminum Pressure-Sensitive Paint by Controlling Luminophore Concentration" Sensors 10, no. 7: 6836-6847. https://doi.org/10.3390/s100706836
APA StyleSakaue, H., & Ishii, K. (2010). Optimization of Anodized-Aluminum Pressure-Sensitive Paint by Controlling Luminophore Concentration. Sensors, 10(7), 6836-6847. https://doi.org/10.3390/s100706836