Classification of Agarwood Oil Using an Electronic Nose

Abstract
:1. Introduction
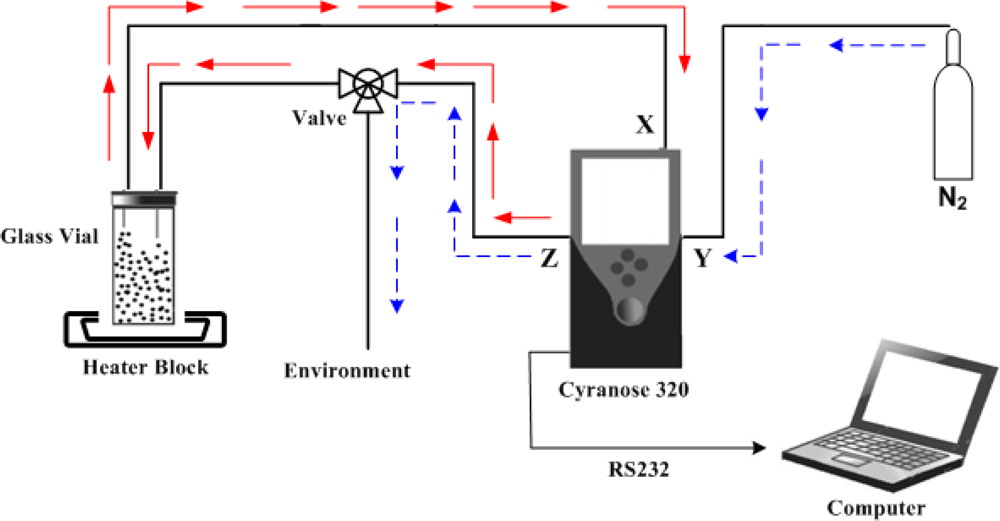
2. Experimental
3. Results and Discussion
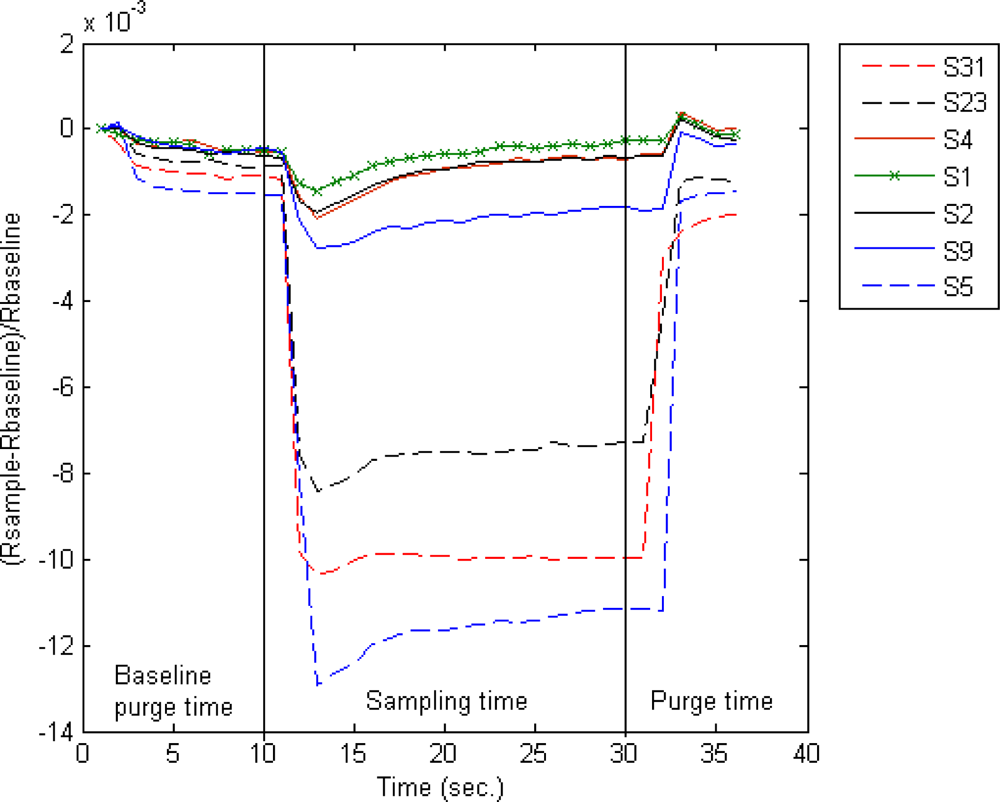
3.1. Smellprint
3.2. Statistical Analysis
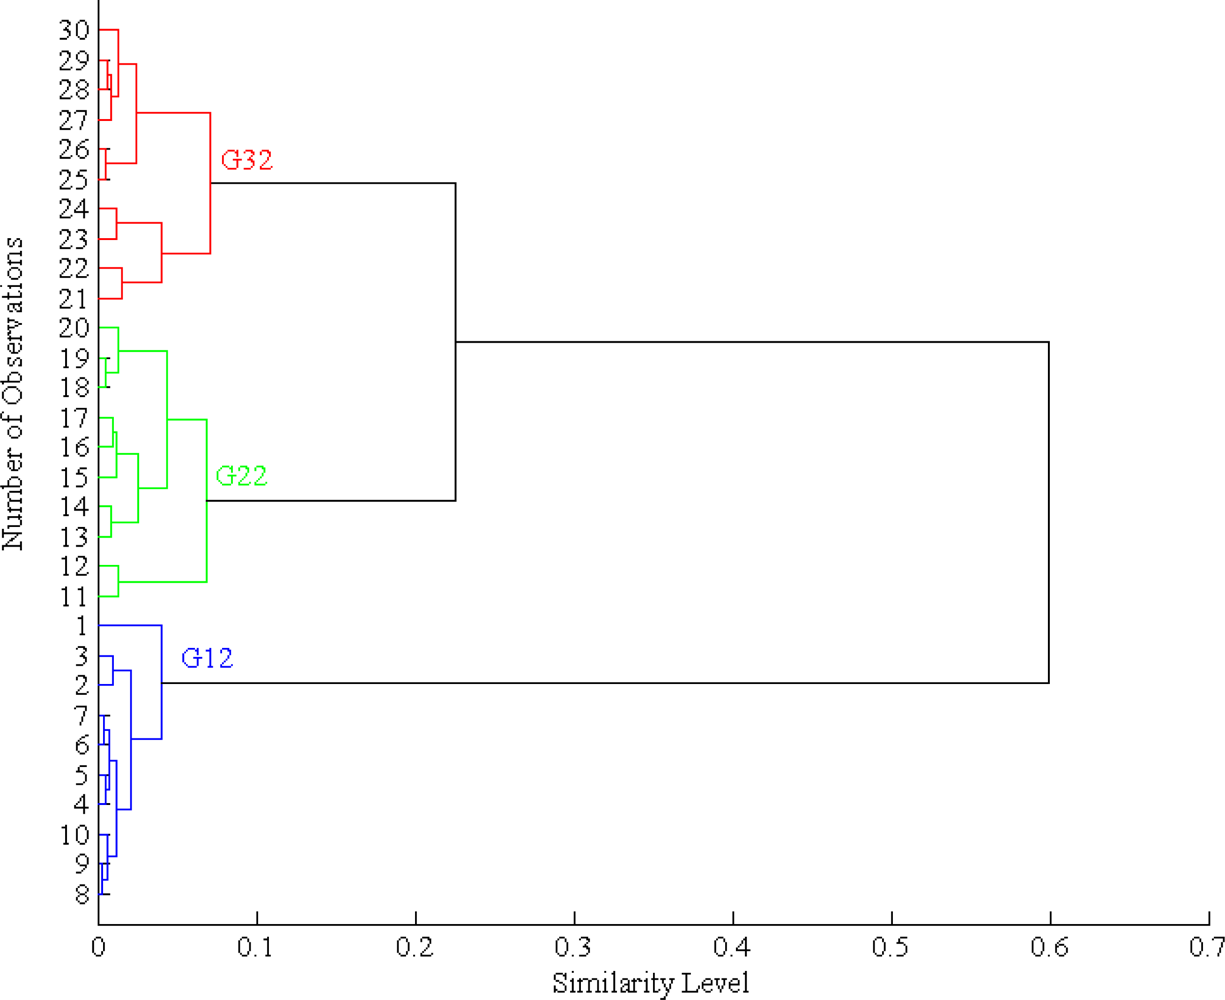
3.2.1. Hierarchical Cluster Analysis (HCA)
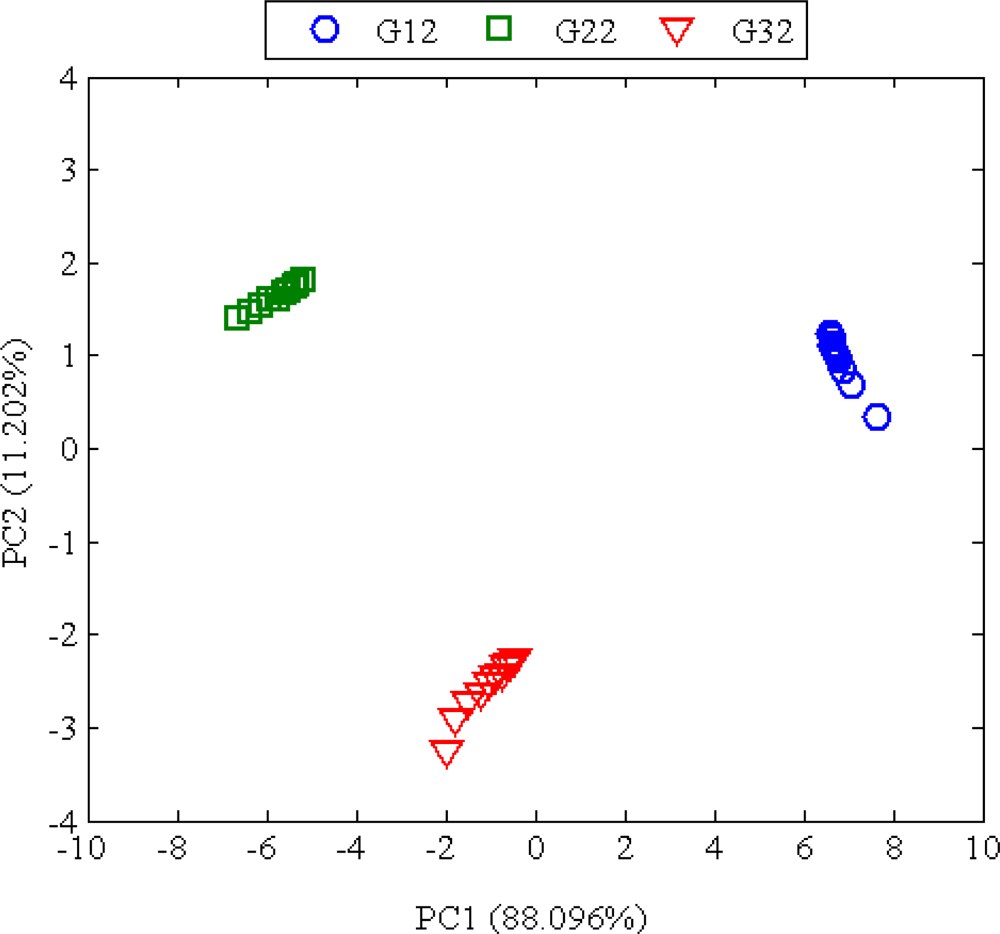
3.2.2. Principal Component Analysis (PCA)
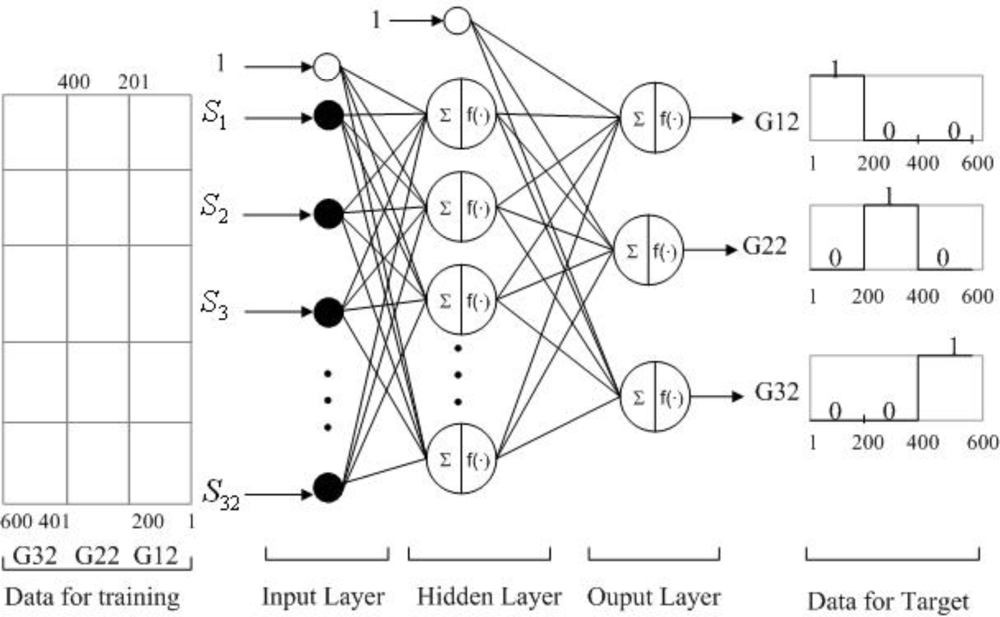
3.3. Artificial Neural Network (ANN)
3.3.1. Result from 32 Sensors as Input
3.3.2. Results from Selected Sensors
4. Conclusions
Acknowledgments
References
- Persoon, G.A. Growing ‘the wood of the Gods’: Agarwood production in Southeast Asia. In Smallholder Tree Growing for Rural 245 Development and Environmental Services; Snelder, D.J., Lasco, R.D., Eds.; Springer: Dordrecht, The Netherlands, 2008; pp. 245–262. [Google Scholar]
- Barden, A.; Anak, N.A.; Mulliken, T.; Song, M. Hearth of the Matter: Agarwood Use and Trade and CITES Implementation for Aquilaria Malaccensis; Traffic Network Report 1998–2000; TRAFFIC International: Cambridge, UK, 2000; pp. 1–51. [Google Scholar]
- Keller, P.E. Mimicking biology: applications of cognitive systems to electronic noses. Proceedings of IEEE International Symposium on Intelligent Control/Intelligent Systems and Semiotics, Cambridge, MA, USA, September 1999.
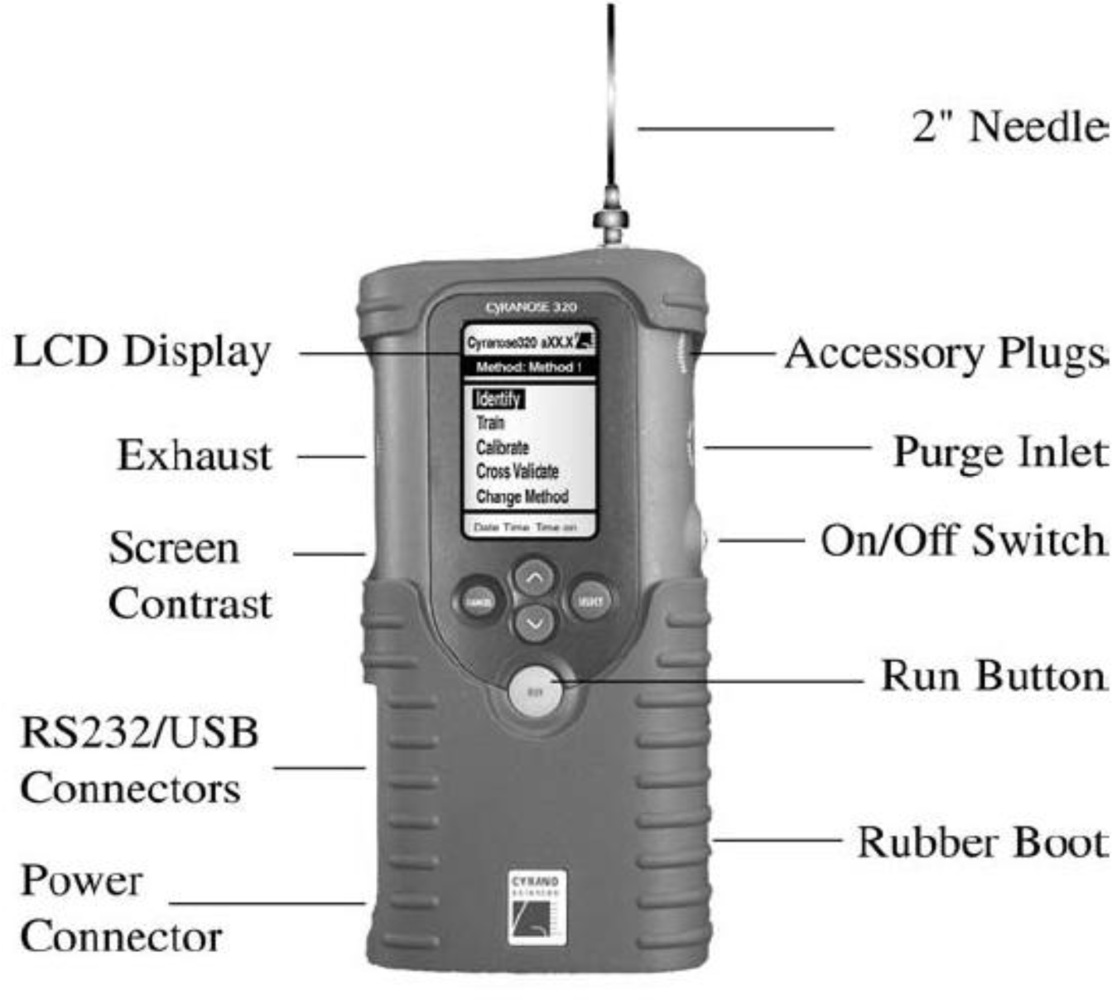
- Cyranose 320 User Manual; Smith Detection: Pasadena, CA, USA, 2004.
- Gardner, J.W.; Bartlett, P.N. Electronic Noses: Principles and Applications; Oxford University Press: New York, NY, USA, 1999. [Google Scholar]
- Luo, D.; Hosseini, H.G.; Stewart, J.R. Application of ANN with extracted parameters from an electronic nose in cigarette brand identification. Sens. Actuat. B: Chem 2004, 99, 253–257. [Google Scholar]
- Scott, S.M.; James, D.; Ali, Z. Review: Data analysis for electronic nose systems. Microchim. Acta 2007, 156, 183–207. [Google Scholar]
- Hines, E.L.; Iobet, E.L.; Gardner, J.W. Electronic noses: a review of signal processing techniques. Proceedings of IEEE Circuits Device System, Salte Lake City, UT, USA, December 1999; 146.
- Jolliffe, I.T. Principal Component Analysis, 2nd ed.; Springer-Verlag: New York, NY, USA, 2002. [Google Scholar]
- Penza, M.; Cassano, G. Application of principal component analysis and artificial neural networks to recognize the individual VOCs of methanol/2-propanol in a binary mixture by SAW multi-sensor array. Sens. Actuat. B: Chem 2003, 89, 269–284. [Google Scholar]
- Gardner, J.W.; Boilot, P.; Hines, E.L. Enhancing electronic nose performance by sensor selection using a new integer-based genetic algorithm approach. Sens. Actuat. B: Chem 2005, 106, 114–121. [Google Scholar]
- Dutta, R.; Das, A.; Stocks, N.G.; Morgan, D. Stochastic resonance-based electronic nose: A novel way to classify bacteria. Sens. Actuat. B: Chem 2006, 115, 17–27. [Google Scholar]


| Sensors | 32 polymer carbon black composites |
| Operating Temperature | 0 to 40 °C (32 to 104 °F) |
| Response Time | 10 sec |
| Sampling Pump | Low: 50 mL/min, Medium: 120 mL/min, |
| High: 180 mL/min. | |
| Communication | RS–232 @ 9,600 to 57,600 bps |
| Algorithms | PCA, KNN, K-means, CDA |
| Run time | Pump speed | |
|---|---|---|
| Baseline purge time | 10 sec | 120 mL/min |
| Sampling time | ||
| Draw 1 | 20 sec | 180 mL/min |
| Purge time | ||
| 1st air intake purge | 5 sec | 180 mL/min |
| 2nd sample gas purge | 30 sec | 180 mL/min |
| Digital filtering | On | |
| Substrate heater temperature | 42 °C | |
| Training repeat count | 10 | |
| No. | Sensor selection | MSE | Gradient | Sample | Target | ANN Output (Averaged) | Accuracy | ||||
|---|---|---|---|---|---|---|---|---|---|---|---|
| T1 | T2 | T3 | O1 | O2 | O3 | ||||||
| 1 | All | 5.7133 × 10⁻⁸ | 0.3536 | G12 | 1 | 0 | 0 | 0.9999 | 0.0001 | 0.0000 | 100% |
| G22 | 0 | 1 | 0 | 0.0003 | 0.9997 | 0.0000 | 100% | ||||
| G32 | 0 | 0 | 1 | 0.0005 | 0.0002 | 0.9997 | 100% | ||||
| No | Sensor number | The summation of correlation coefficient | Sensor number | Loadings for PC1 |
|---|---|---|---|---|
| 1 | 23 | 5.4960 | 23 | −0.03041 |
| 2 | 31 | 16.016 | 31 | −0.09815 |
| 3 | 1 | 19.334 | 1 | −0.12595 |
| 4 | 2 | 24.291 | 2 | −0.15748 |
| 5 | 4 | 25.343 | 4 | −0.16391 |
| 6 | 9 | 25.714 | 9 | −0.16607 |
| 7 | 5 | 26.599 | 5 | −0.17615 |
| No. | Sensor selection | MSE | Gradient | Sample | Target | ANN Output (Averaged) | Accuracy | |||||
|---|---|---|---|---|---|---|---|---|---|---|---|---|
| T1 | T2 | T3 | O1 | O2 | O3 | |||||||
| 1 | S23, S31, S1, S2, S4 | 8.2038 × 10⁻⁹ | 0.1074 | G12 | 1 | 0 | 0 | 0.9983 | 0.0045 | 0.0070 | 100% | |
| G22 | 0 | 1 | 0 | 0.0001 | 0.9999 | 0.0070 | 100% | |||||
| G32 | 0 | 0 | 1 | 0.0001 | 0.0000 | 0.9999 | 100% | |||||
| 2 | S23 and S31 | 8.9927 × 10⁻⁸ | 0.00246 | G12 | 1 | 0 | 0 | 0.9803 | 0.0125 | 0.0070 | 100% | |
| G22 | 0 | 1 | 0 | 0.0010 | 0.9999 | 0.0009 | 100% | |||||
| G32 | 0 | 0 | 1 | 0.6203 | 0.0000 | 0.3797 | 37.18% | |||||
© 2010 by the authors; licensee MDPI, Basel, Switzerland. This article is an open-access article distributed under the terms and conditions of the Creative Commons Attribution license ( http://creativecommons.org/licenses/by/3.0/).
Share and Cite
Hidayat, W.; Shakaff, A.Y.M.; Ahmad, M.N.; Adom, A.H. Classification of Agarwood Oil Using an Electronic Nose. Sensors 2010, 10, 4675-4685. https://doi.org/10.3390/s100504675
Hidayat W, Shakaff AYM, Ahmad MN, Adom AH. Classification of Agarwood Oil Using an Electronic Nose. Sensors. 2010; 10(5):4675-4685. https://doi.org/10.3390/s100504675
Chicago/Turabian StyleHidayat, Wahyu, Ali Yeon Md. Shakaff, Mohd Noor Ahmad, and Abdul Hamid Adom. 2010. "Classification of Agarwood Oil Using an Electronic Nose" Sensors 10, no. 5: 4675-4685. https://doi.org/10.3390/s100504675
APA StyleHidayat, W., Shakaff, A. Y. M., Ahmad, M. N., & Adom, A. H. (2010). Classification of Agarwood Oil Using an Electronic Nose. Sensors, 10(5), 4675-4685. https://doi.org/10.3390/s100504675