Article

Structure of Fungal Communities in Sub-Irrigated Agricultural Soil from Cerrado Floodplains

1
Department of Agricultural Sciences and Technology, Universidade Federal do Tocantins, Rua Badejos, 69-Jd Sevilha, Campus Universitário, Gurupi 77410-530, TO, Brazil
2
Cell and Molecular Biology Laboratory, Center for Nuclear Energy in Agriculture, University of São Paulo, Avenida Centenario 303, Piracicaba 13400-970, Brazil
3
Biotechnology Laboratory, Universidade Federal do Tocantins, Quadra 109 Norte, Av. NS 15, ALCNO 14 s/n, Campus Universitário, Palmas 77001-090, TO, Brazil
4
Department of Environmental Technology and Water Resources, University of Brasília, Brasilia 70040-010, Brazil
5
Environmental Microbiology and Biotechnology Laboratory, Universidade Federal do Tocantins, Quadra 109 Norte, Av. NS 15, ALCNO 14 s/n, Campus Universitário, Palmas 77001-090, Brazil
*
Author to whom correspondence should be addressed.
Diversity 2016, 8(2), 13; https://doi.org/10.3390/d8020013
Submission received: 1 November 2015 / Revised: 4 April 2016 / Accepted: 16 May 2016 / Published: 19 May 2016
(This article belongs to the Special Issue Soil Microbes Diversity and Soil Function)

Abstract

:
This study aimed to evaluate the influence of soybean cultivation on the fungal community structure in a tropical floodplain area. Soil samples were collected from two different soybean cropland sites and a control area under native vegetation. The soil samples were collected at a depth of 0–10 cm soil during the off-season in July 2013. The genetic structure of the soil fungal microbial community was analyzed using the automated ribosomal intergenic spacer analysis (ARISA) technique. Among the 26 phylotypes with abundance levels higher than 1% detected in the control area, five were also detected in the area cultivated for five years, and none of them was shared between the control area and the area cultivated for eight years. Analysis of similarity (ANOSIM) revealed differences in fungal community structure between the control area and the soybean cropland sites, and also between the soybean cropland sites. ANOSIM results were confirmed by multivariate statistics, which additionally revealed a nutrient-dependent relation for the fungal community structure in agricultural soil managed for eight consecutive years. The results indicated that land use affects soil chemical properties and richness and structure of the soil fungal microbial community in a tropical floodplain agricultural area, and the effects became more evident to the extent that soil was cultivated for soybean for more time.

1. Introduction

Tropical biomes are home to the largest biodiversity in the world and fungal species are important components of the biodiversity in these environments [1]. Among the soil-colonizing microorganisms, fungi are usually one of the most abundant groups in terms of biomass and physiological activity [2], and they are essential for the survival of other organisms. In soil, fungi are essential for nutrient cycling via the metabolism of complex organic materials [3,4], and they are vitally important for the good growth of most plants, including crops, through the development of mycorrhizal associations [5].
In Cerrado areas, the conversion of the natural vegetation into mixed farming operating systems involving agriculture and animal raising causes changes in soil properties [6,7]. The physical, chemical and biological attributes of the soil are affected by several conditions related to the type of soil preparation used in each management system; the effects on these attributes are dependent on the intensity of soil disturbance, traffic of farm tractors, type of equipment used, management of plant waste, and moisture conditions in the soil at the time of tillage [8]. Despite previous findings in areas of the Cerrado biome [9,10,11], there is a lack of information about the impact of soil agricultural management on the fungal microbial community in Cerrado areas.
Culture methods can recover only a small percentage of the total fungal community because many fungal species do not grow or produce spores in culture media. More recently, DNA-based molecular analyses of environmental samples have broadened our understanding of the microbial diversity, allowing the characterization of complex microbial communities without needing to culture the microorganisms [12]. The molecular technique based on the analysis of the ribosomal intergenic spacer technique (ARISA), developed by Fisher and Triplett [13], has been adequate and efficient for the analysis of microbial communities, including the study of the profiles of fungal communities in the soil [14,15,16,17].
In the present study, we focused on the interpretation of ecological aspects of the soil fungal microbial communities in agricultural and natural sites located at Cerrado floodplains by DNA-based molecular approach. Understanding the effects of soil agricultural management on the dynamics of the soil fungal microbial community structure is important because of the impacts of these microorganisms on the soil quality and agricultural productivity. In this sense, the aim of this study was to evaluate the structure of fungal communities in sub-irrigated agricultural soil from Cerrado floodplains located in the state of Tocantins. The explicit relationship between the fungal community structure and soil chemical properties was examined by multivariate statistical analyses.

2. Materials and Methods

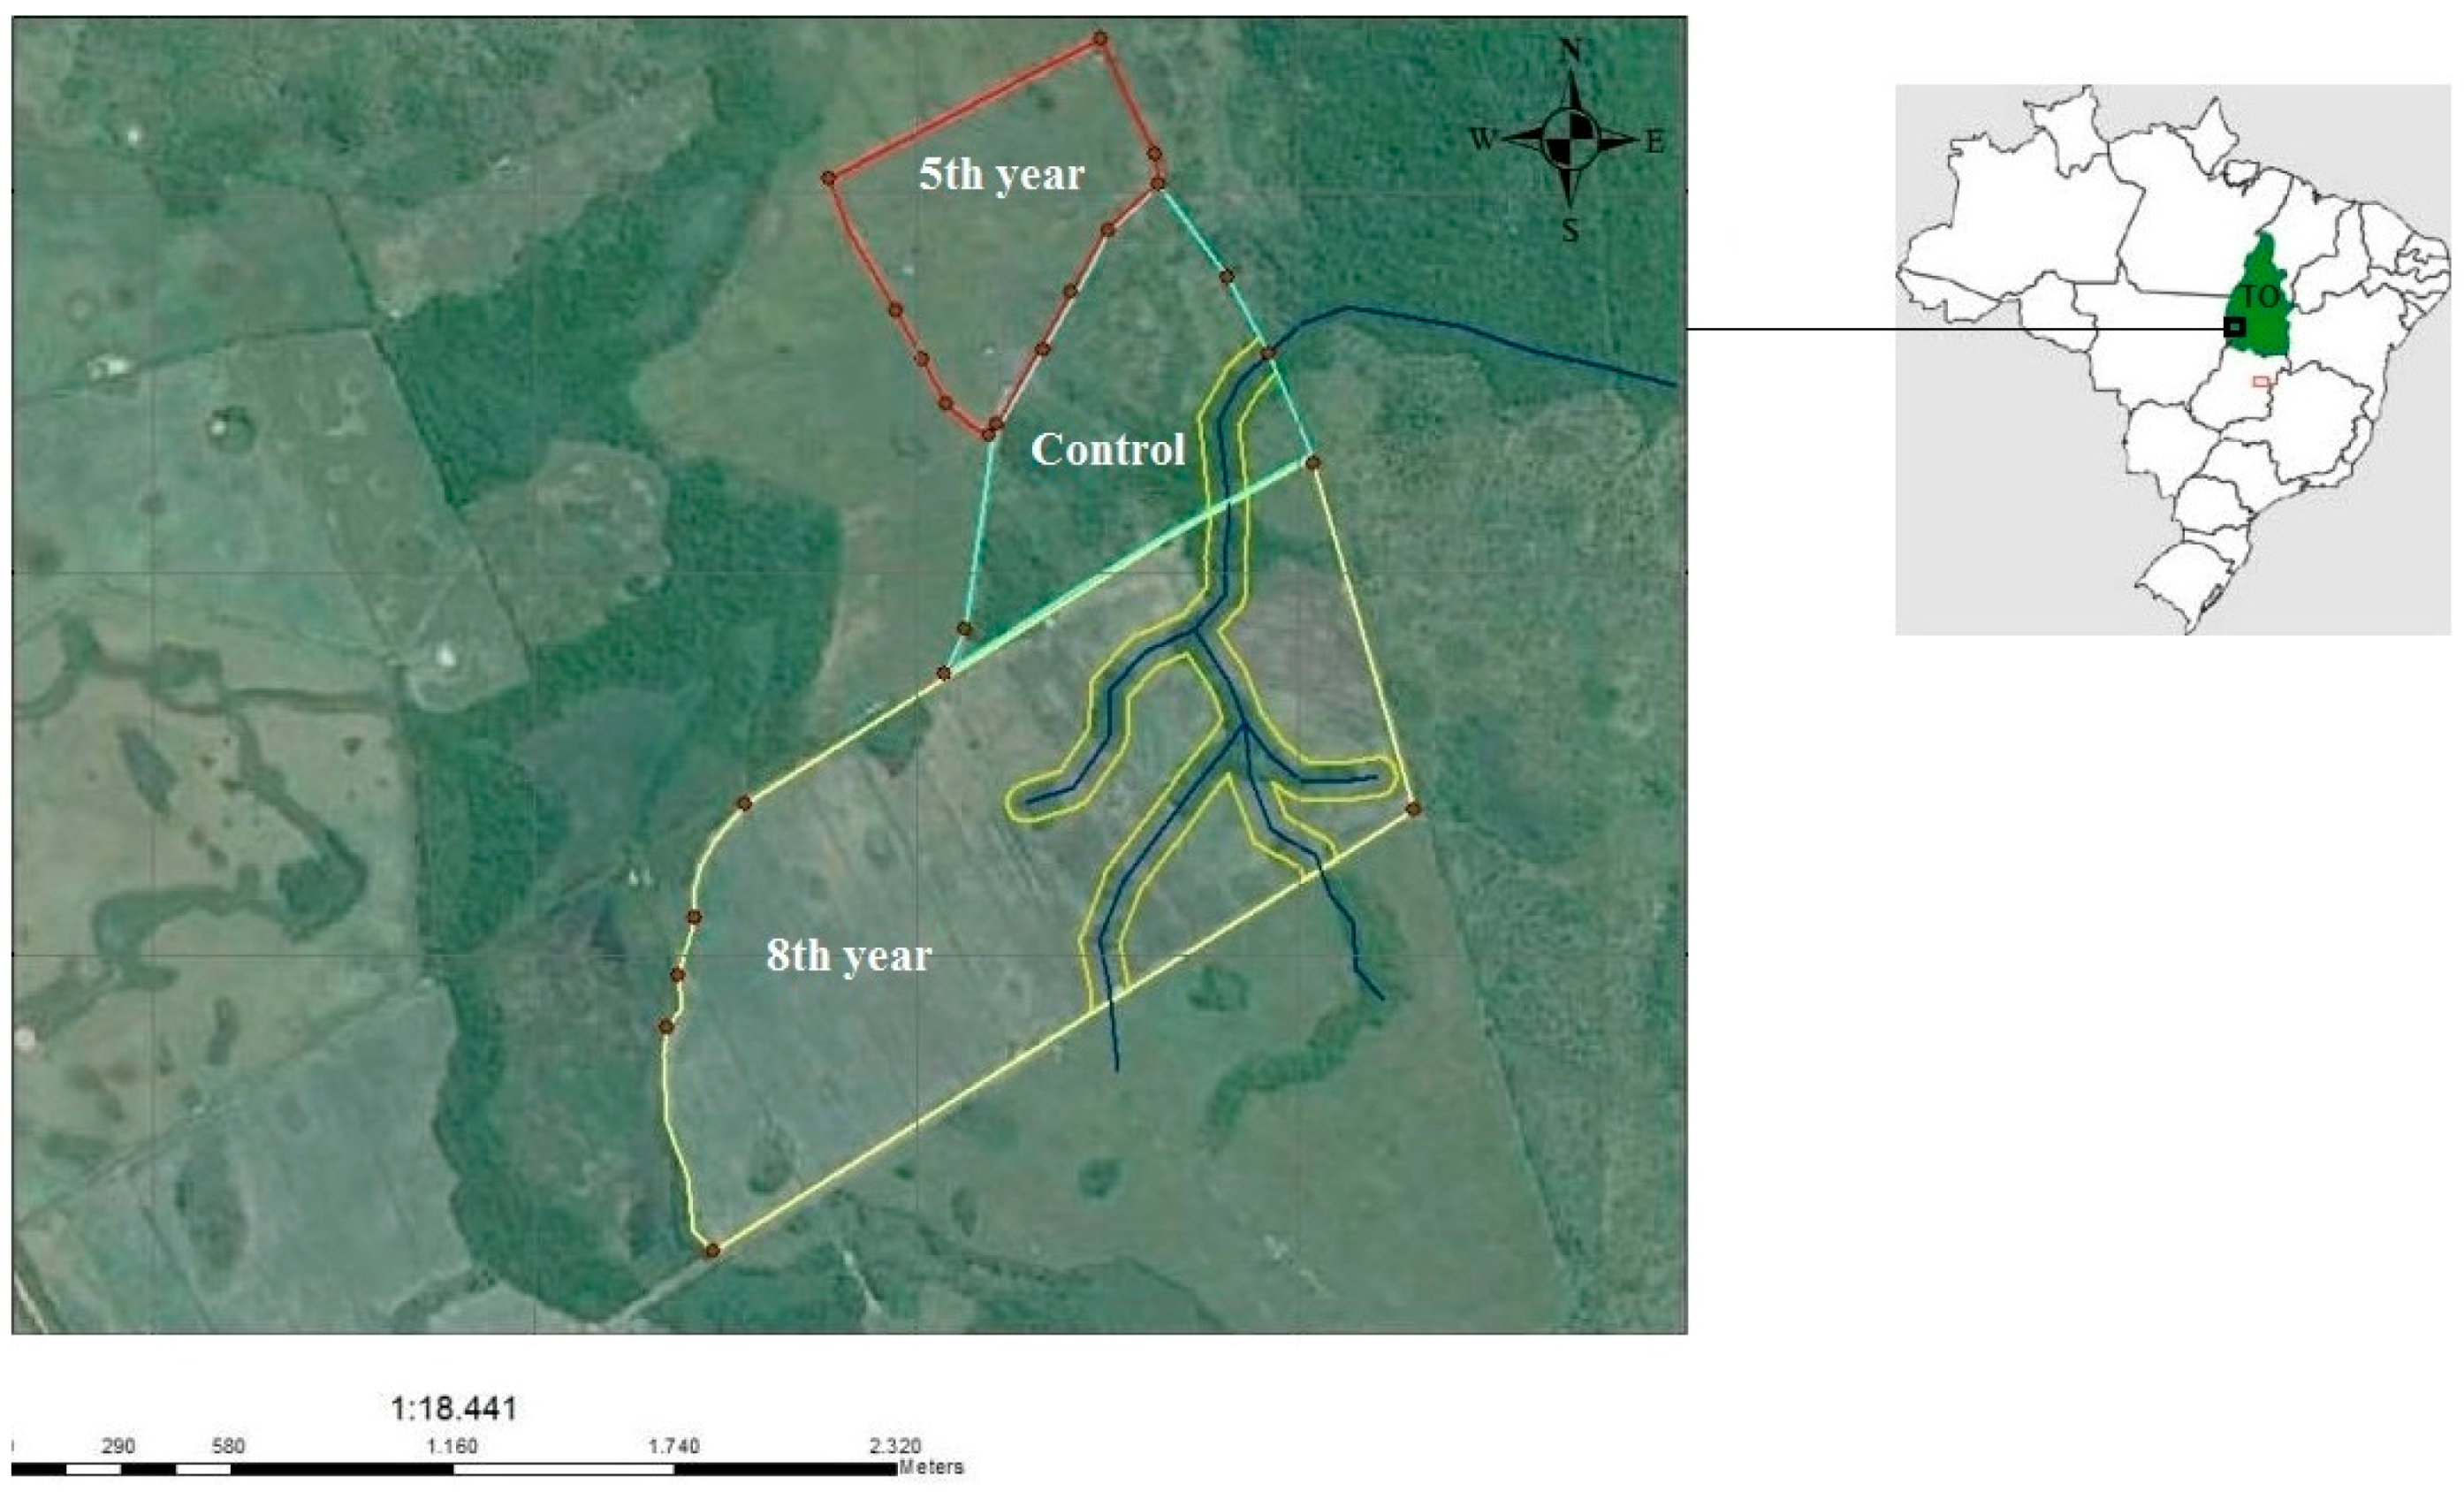
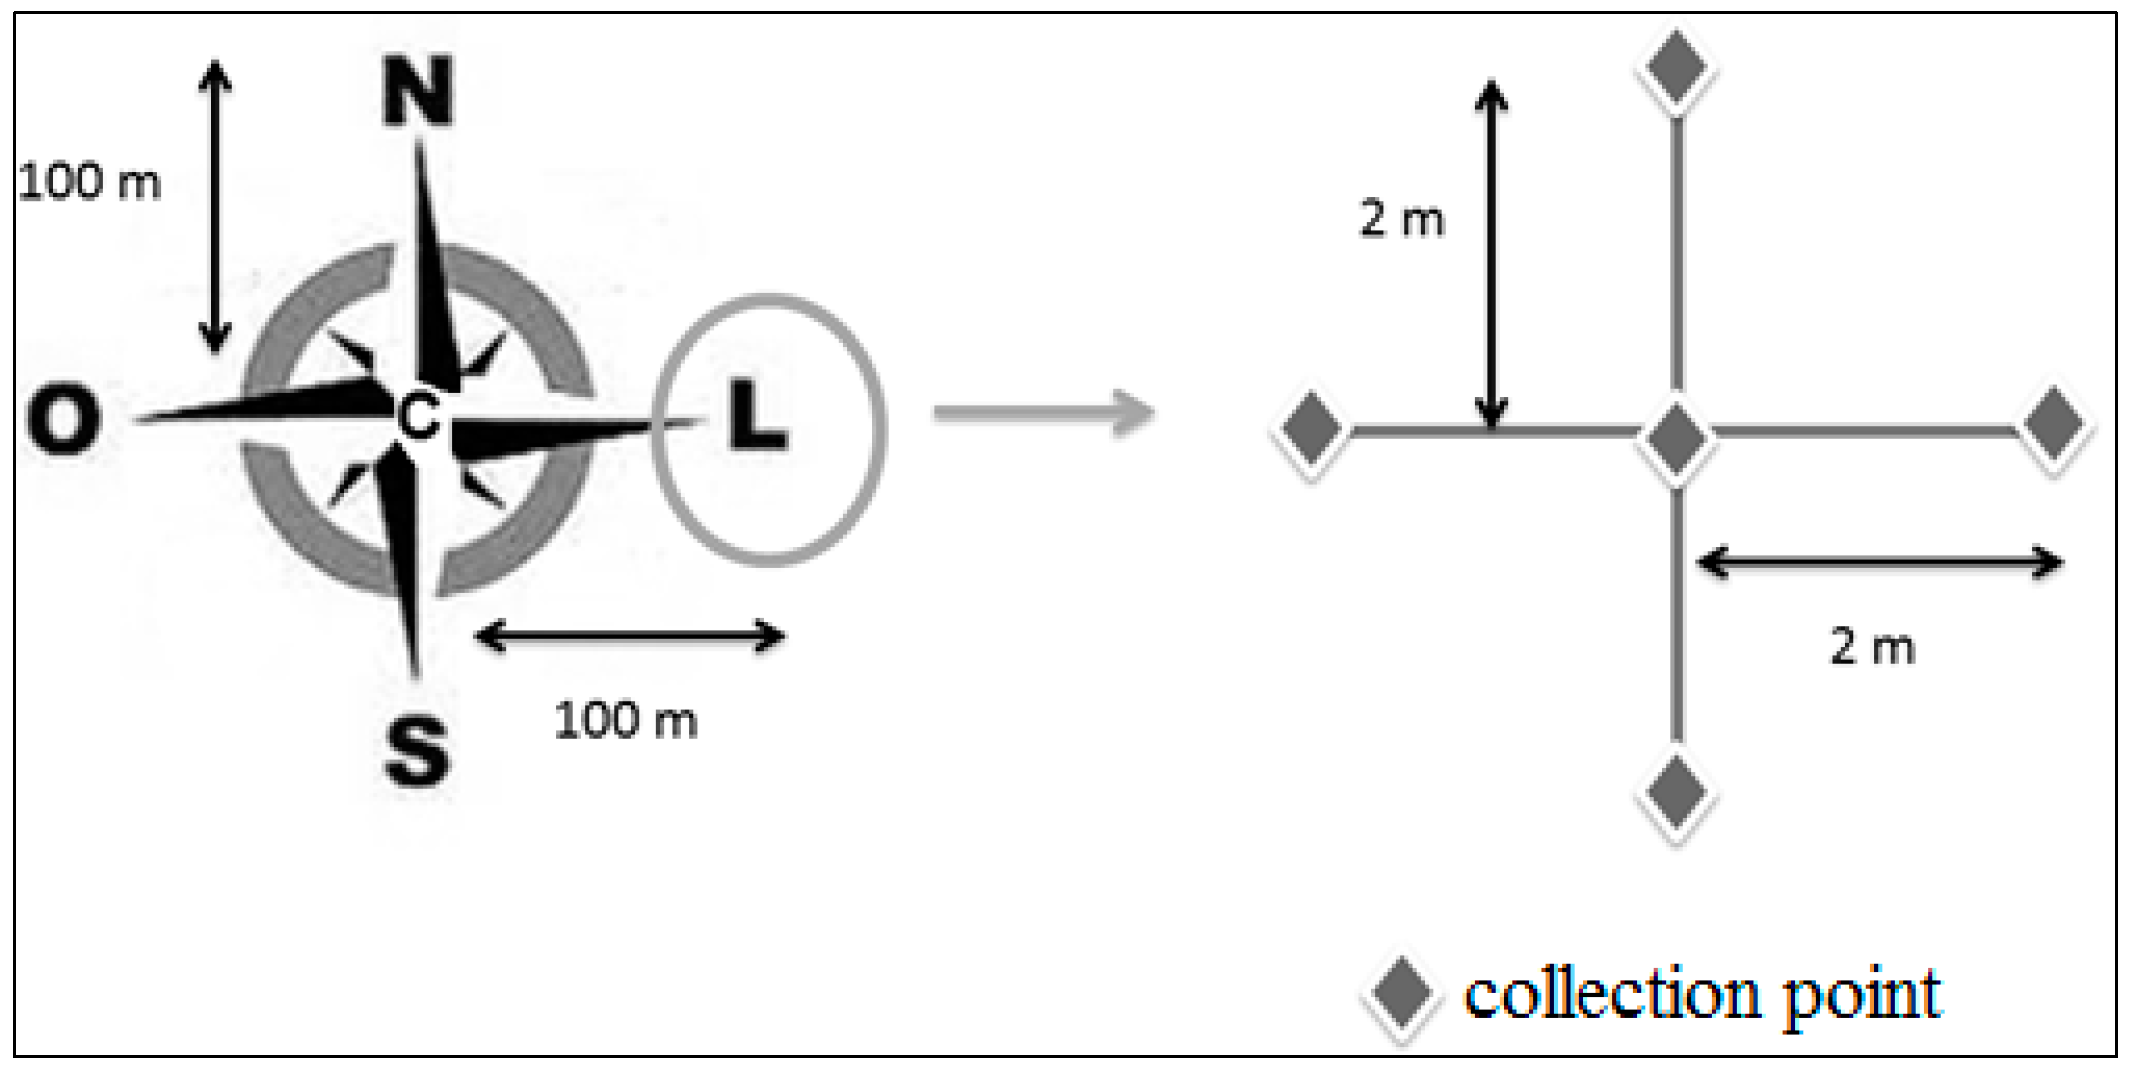
2.1. Study Areas and Soil Sampling

Between the states of Tocantins and Mato Grosso, in the Araguaia plain, an ecotone area is formed between the Cerrado and Amazon biomes and is regularly flooded during the rainy season for four to five months. This ecotone covers approximately 600,000 square kilometers, and consists of several physiognomies that form a vegetation mosaic [18]. The large floodplain in the state of Tocantins covers an area larger than 500,000 hectares [19] and is used intensively for the cultivation of grains and fruits. In this region, the areas evaluated are located in the Praia Alta farm, in the municipality of Lagoa da Confusão (10°47′21.37″S, 49°37′26.51″W), in the state of Tocantins (Figure 1). According to Köppen’s classification, the climate of the region is Aw, tropical with wet summers and dry winters [20]. The large-scale agriculture model in the Araguaia floodplains is based on large land holdings, heavy machinery and high input of pesticides and fertilizers together with huge landscape alteration through irrigation channel-building and river damming. In the Araguaia plain, there are two cropping seasons—one during the rainy season and other in the dry season—both heavily dependent on pesticides and soil remediation, especially by the application of lime.
Two soybean cultivation areas (where soybean was cultivated for five and eight consecutive years using a no-tillage system) and an area with native vegetation composed of a dense forest and thick undergrowth (control) were sampled. Mineral fertilization consisting of 80 kg·ha−1 P2O5 (triple superphosphate), 400 kg·ha−1 of CaSO4·2H2O (single superphosphate), 80 kg·ha−1 K2O (potassium oxide), 135 kg·ha−1 P2O5 (potassium chloride), and a liming treatment were applied to both the soybean cultivation areas. Before sowing, the seeds of the cultivar of soybean Glycine max (L.) Merril, were inoculated with Bradyrhizobium japonicum, in a concentration of 1010 viable cells per kg of seed, which is a common practice for soybean cultivation in Brazil. In each of the three study areas, soil samples were collected during the off-season period in July 2013, which is the period of soybean cultivation in the region.
Five sites were sampled from each study area. Initially, a central site was established randomly in space and sampled. From this central site, four other sampling sites were demarcated, located south, north, east, and west at a distance of 100 m from the central site. Soil samples were collected from each of the five sites at a depth of 0–10 cm using the aforementioned sampling distribution at a distance of 2 m from the central site (Figure 2). Sterilized PVC tubes (diameter of 5 cm and length of 10 cm) were used for collection of the soil samples.
In total, 25 soil samples were collected from each study area, and the five samples obtained from each site (center, south, north, east, and west) were mixed, totaling five samples for each area. Before sample mixing, a cylindrical sub-sample was collected from the center the each PVC tube using a Falcon tube (length of 15 cm and diameter of 2 cm); these subsamples were homogenized and then stored in an UltraFreezer at −80 °C until they were used for the extraction of genomic DNA for the molecular analysis of the fungal communities. The remainder of each set of soil samples was used for the analysis of chemical properties.

2.2. Soil Chemical Characteristics and Statistical Analysis

Soil chemical analysis consisted of soil fertility properties determination, such as soil pH, organic matter (OM), phosphorus (P), sulfur (S), potassium (K), calcium (Ca), magnesium (Mg), aluminum (Al), potential acidity (H + Al), cation exchange capacity (CEC), exchangeable bases (SB) (i.e., the sum of Ca, Mg, and K), sodium (Na), zinc (Zn), boron (B), copper (Cu), iron (Fe), and manganese (Mn). Soil chemical properties were determined according to EMBRAPA [21]. Analysis of variance (ANOVA) was used to assess differences in the chemical properties of the soils. The statistical comparison of soil samples was performed using Statistica v. 10.0 Software (Statsoft Inc., Tulsa, OK, USA).

2.3. Genomic DNA Extraction and PCR-ARISA of the 18S-28S Ribosomal Intergenic Spacer

DNA was extracted from the subsamples of each area in triplicate using the Power Soil DNA Isolation Kit (MoBio Laboratories Inc., Carlsbad, CA, USA). A total of 0.25 g of each sample was transferred to centrifuge tubes containing glass microbeads, after which the tubes were shaken gently for sample homogenization, and DNA was extracted according to the instructions provided by the manufacturer. For DNA qualification, a 5-µL aliquot of the extracted DNA was resolved by electrophoresis in agarose gel (1% w/v) containing ethidium bromide (0.5 µg/mL of gel) using tryptic soy broth (TSB) buffer (100 mM Tris-HCl, 1% sodium dodecyl sulfate, and 2% 2-mercaptoethanol) at 80 volts for approximately 40 min [22]. A 2-µL aliquot of Low Mass DNA Ladder (Invitrogen Technology, Carlsbad, CA, USA) was used as the molecular standard. DNA products were also quantified spectrophotometrically by taking absorbance readings at 260 and 280 nm (NanoDrop® ND-1000 UV/VIS-spectrophotometer, Peqlab Biotechnologie GmbH, Erlangen, Germany). The extracted DNA was stored at −20 °C until use.
For amplification reactions of the 18S-28S intergenic spacer, the primers 3126Tf (5′-AGT TTA ATA TCA GGC TGC GGT-3′) and 2234Cr (5′-GTT GAA CCT TCC GTA GGT GC-3′) were used [14]. For fluorescence detection, the 5′ end of the primer 3126Tf was labeled with 6-carboxyfluorescein (FAM). The reactions were prepared to a final volume of 25 µL using 2.5 µL of 10× PCR buffer, 1.5 µL of 50 mM MgCl2, 0.5 µL of 10 mM dNTPs, 1.0 µL of each primer at 5 pmol/ µL, 1.0 µL of 10 ng DNA, 0.2 µL of Platinum Taq DNA Polymerase (Invitrogen) at 5 U/µL, and 17.3 µL of sterile water. The reactions were performed using a thermocycler (GeneAmp PCR System Model 9700, Applied Biosystems, Foster City, CA, USA) under the following conditions: 1 cycle at 94 °C for 3 min (pre-denaturation), 35 cycles at 94 °C for 30 s (denaturation), 59 °C for 45 s (annealing), 72 °C for 1 min (extension), and 1 cycle at 72 °C for 15 min (final extension). Electrophoresis was performed using 1% agarose gels in TSB buffer at 90 volts for 1 hour to assess the quality of the samples [22]. The gels were documented using Kodak Digital Science 1D software (Scientific Imaging Systems). PCR-ARISA products were purified using the QIAquick PCR Purification kit (Qiagen, Valencia, CA, USA) according to the manufacturer’s instructions and were resolved by electrophoresis in 1% agarose gel as described above.

2.4. Automated Analysis of the 18S-28S Ribosomal Intergenic Spacer

Gene sequencing was performed using an ABI PRISM 3100 genetic analyzer (Applied Biosystems, Foster City, CA, USA). For sample loading, a 1-µL aliquot of the purified PCR product was mixed with 8.75 µL of Hi-Di formamide and 0.25 µL of GeneScan™ 500 ROX length standard (Applied Biosystems, Foster City, CA, USA). Before loading, the samples were denatured for 5 min at 95 °C and cooled to 0 °C for 4 min.
The quality of the electropherograms generated by automated capillary electrophoresis was assessed using Peak Scanner software v. 1.0 (http://www.appliedbiosystems.com, Applied Biosystems, Foster City, CA, USA). In summary, in each electropherogram generated by DNA fingerprinting, the fluorescence unit of each peak was converted into data related to the total fluorescence. For this purpose, the value attributed to the fluorescence of each peak was divided by the total fluorescence of the sample [23].

2.5. Statistical Analysis of the Data Obtained Using ARISA Technique

For statistical analysis of the data obtained using the ARISA technique, intergenic spacer sizes between 50 and 800 base pairs were considered. Analysis of similarity (ANOSIM) was performed using Primer software v. 5.0 (Primer-E Ltd., Plymouth, UK). ANOSIM is a method of multivariate data analysis based on permutations [24] and it was used to test the differences between samples from different locations. The statistical analysis of significant differences in the richness of fragments of the 18S-8S ribosomal intergenic spacer from the fungal species present in the three study areas was evaluated using Tukey’s test. The statistical comparison of soil samples was performed using Statistica v. 10.0 software (http://www.statsoft.com, Statsoft Inc., Tulsa, OK, USA). A redundancy analysis (RDA) was performed with the package “vegan” BiodiversityR [25] for the program R [26]. Relative intensity data obtained with ARISA were submitted to Hellinger transformation before input into RDA. RDA is an ordination technique that seeks the most prominent linear gradients in multivariate data sets, under the constraint that the gradients are linear combinations of a set of explanatory variables. Eleven soil properties were included in this analysis after stepwise selection (inflation factor <10)–phosphorus (P), potassium (K), calcium (Ca), magnesium (Mg), potential acidity (H+Al), sum of bases (SB), sodium (Na), zinc (Zn), copper (Cu), iron (Fe), and manganese (Mn). Forward selection and the Monte Carlo permutation test were applied with 1000 random permutations to verify the significance of soil chemical properties upon the soil fungal microbial community structure.

3. Results and Discussion

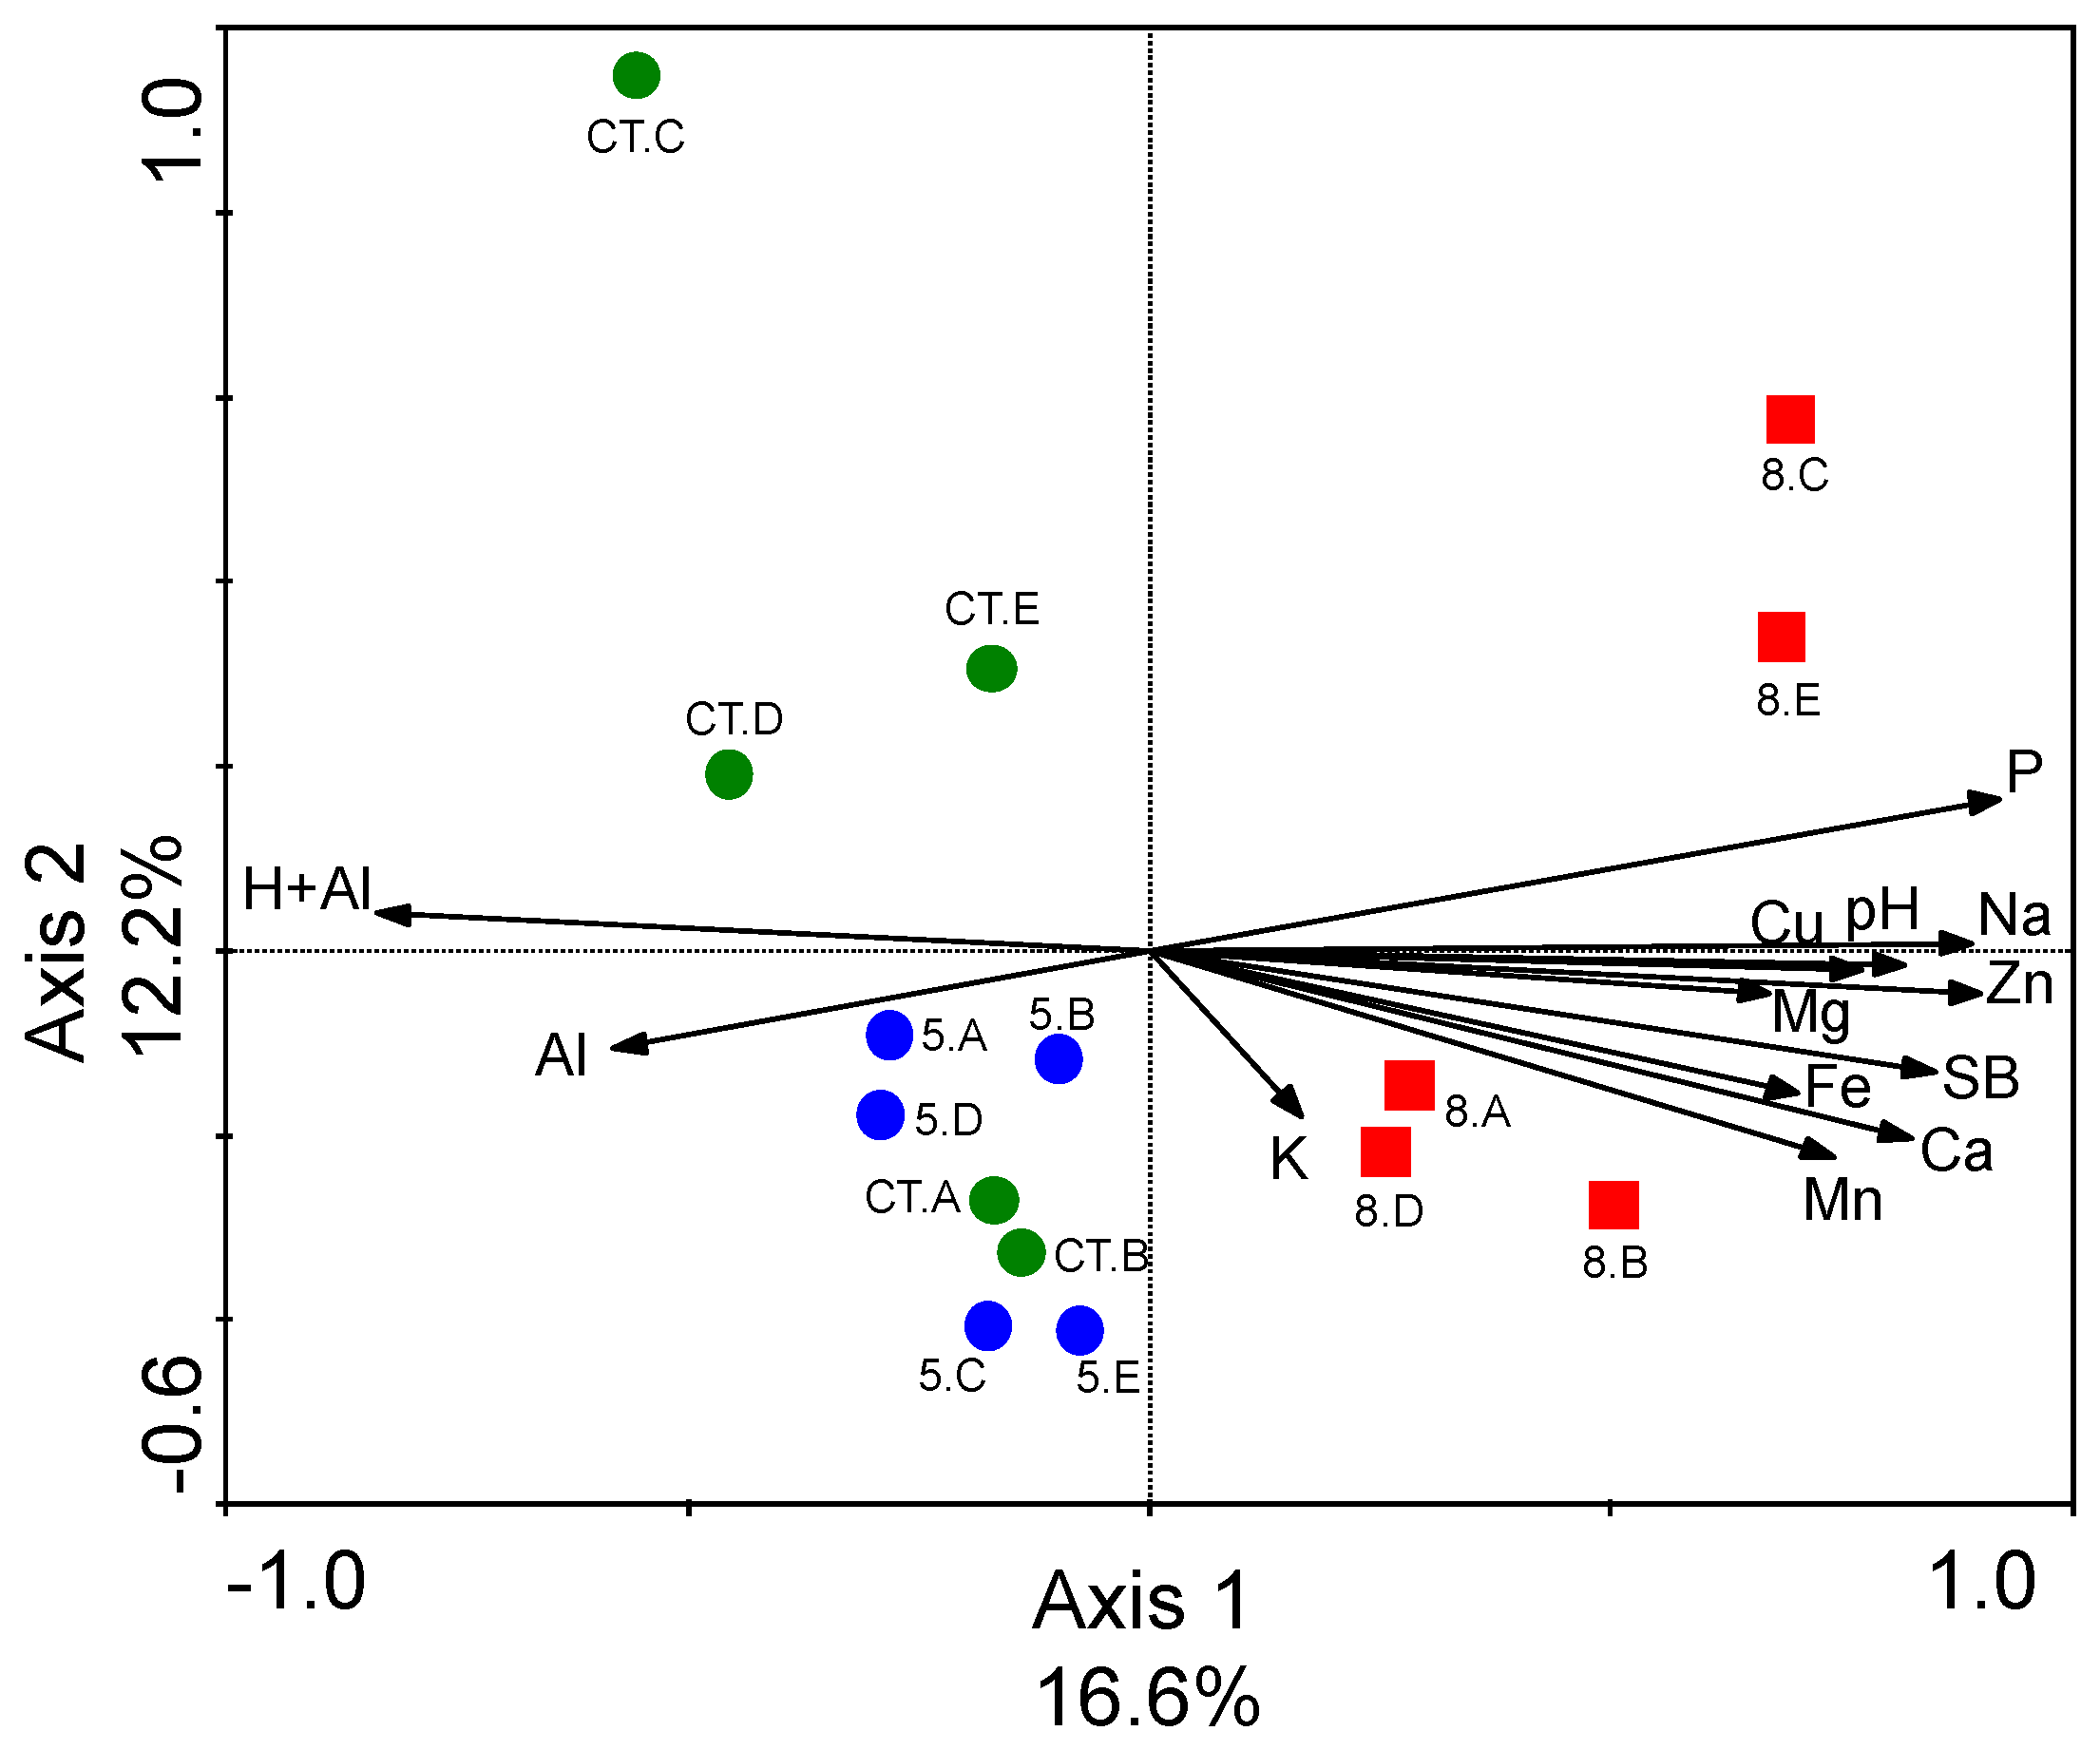
3.1. Differences in Soil Chemical Characteristics

Different soil chemical properties revealed significant differences between soybean cultivated soils and control soils, and also between soybean cropland area cultivated for five and eight years (Table 1). Higher Al content was found in control soils in comparison to soils from soybean cultivated areas. In contrast, control soils showed lower P, Ca, Zn, Cu, and Mn content, sum of bases (SB), and pH, than soybean cultivated soils. Soils from area cultivated for eight years showed higher nutrient availability than area cultivated for five years. Liming practice in agriculture is based on calculation of the necessity of Ca and Mg by the plant, tolerance to Al and clay content. In acidic tropical soils, changing in soil chemical properties due lime requirement for agricultural practices includes a increase in H+ activity, a decrease in Al toxicity, an increase in Ca and Mg availability, and benefits associated with Ca as a complementary ion on the cation exchange complex [7,27,28,29].

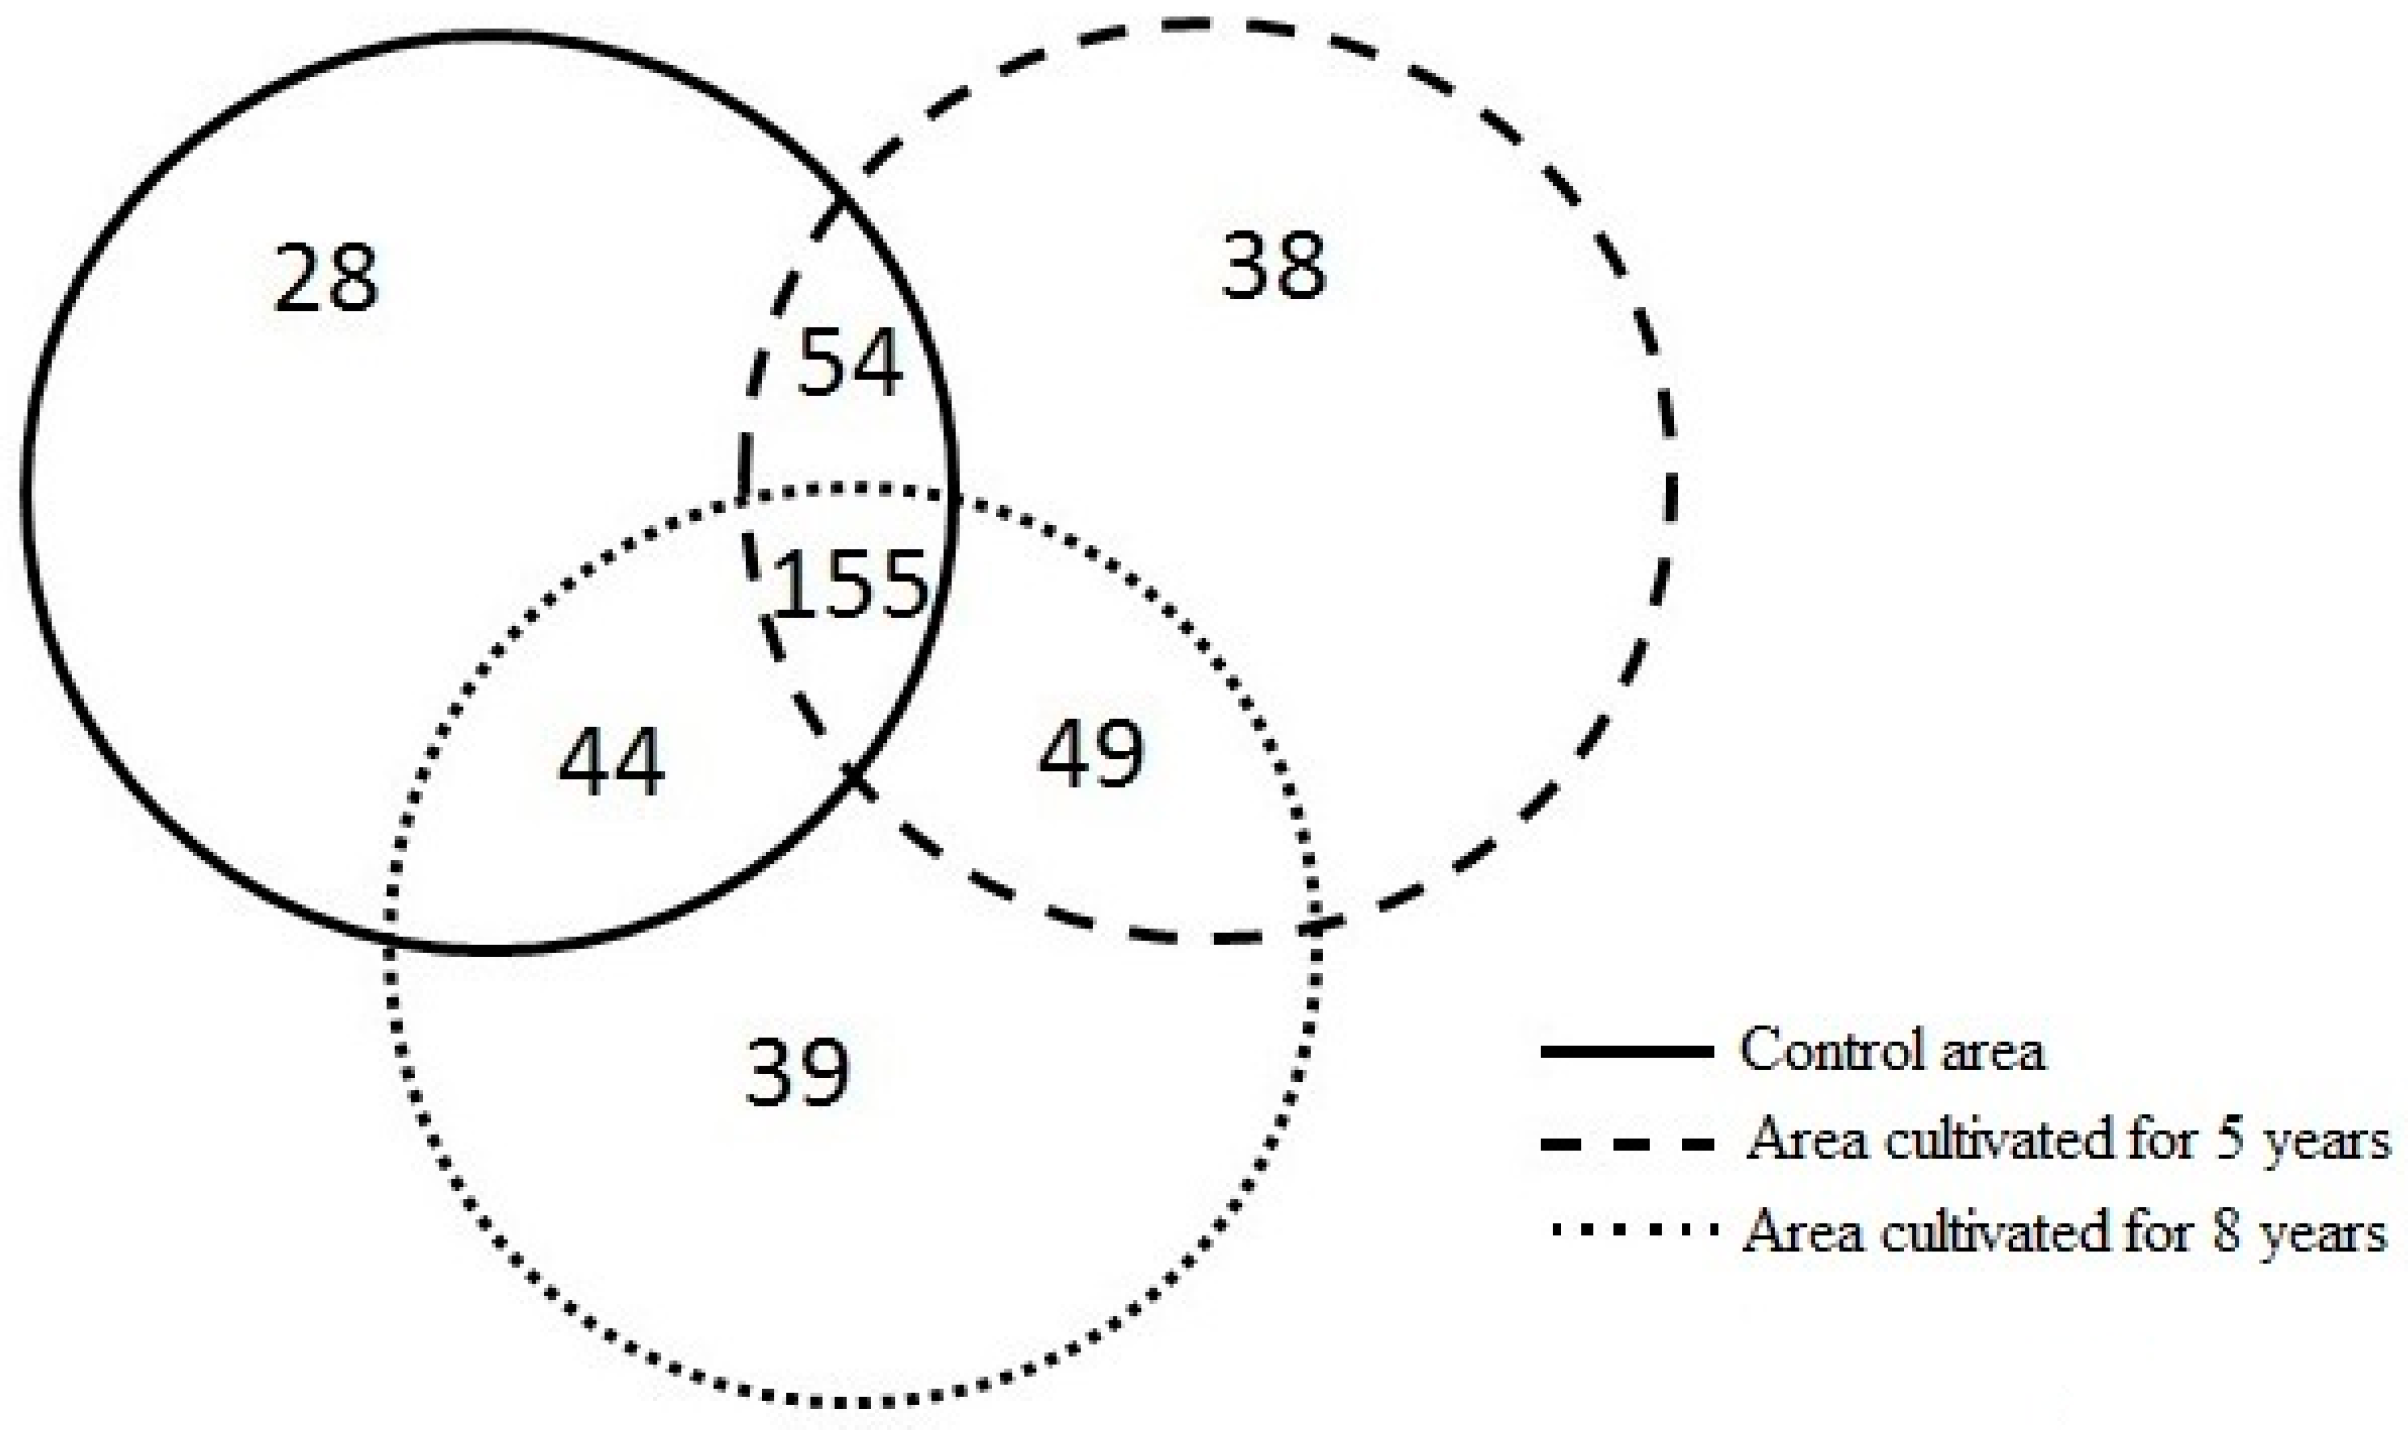
3.2. Differences in Richness and Abundance of Phylotypes in the Soil Fungal Microbial Communities

The lengths of the fragments of the 18S-28S ribosomal intergenic spacer from the fungal microbial communities present in the three areas evaluated using ARISA were compared on the basis of the richness and relative abundance of these fragments, and each ARISA fragment length (AFL) was considered a distinct phylotype. Analysis of the electropherograms indicated the presence of 281 phylotypes in the control area and 296 and 287 phylotypes in the areas cultivated for five and eight consecutive years, respectively (Table 2).
Venn diagram was used to identify the intersections and peculiarities between the study areas and the numbers of unique and shared phylotypes (Figure 3). Single phylotypes were considered those that were unique to a specific area. Among the 26 phylotypes with relative abundance levels higher than 1% present in the control area, five were also present in the area cultivated for five years. Only two phylotypes were shared between the areas cultivated for five and eight years. None phylotype was shared between the control area and the area cultivated for eight years, indicating that the fungal community that dominated this cultivated area may be quite distinct from that in the control area.
The areas evaluated shared 155 phylotypes with each other when their abundance levels were not considered. The control area shared 55 phylotypes with the area cultivated for five years and 44 phylotypes with the area cultivated for eight years. It is assumed that the agricultural activities in the area cultivated for five years, despite the soybean cultivation, did not inhibit the survival of its soil fungal microbial communities. The fewer phylotypes shared between the control area and the area cultivated for 8 years indicates that the soil cultivated for eight years likely underwent prolonged changes that affected the occurrence of distinct native fungal phylotypes. Buckley and Schmidt [30] compared the structures of microbial communities in farmland areas abandoned for different periods and under distinct successional stages of regeneration with the communities present in frequently cultivated and never-cultivated areas. These authors showed that the structures present in never-cultivated areas differed significantly from those in the frequently cultivated areas. The structures present in areas abandoned for nine years were still similar to those found in frequently cultivated areas. However, the microbial community structures in areas abandoned for over 45 years were similar to those found in never-cultivated areas. These results suggest that long periods of regeneration of forest ecosystems are required for the restoration of microbial communities to their original structures.
In this study, the control area had the highest number of phylotypes with abundance levels more than 1%, which belong to dominant organisms present in the community. Navarrete et al. [16] evaluated the molecular diversity of microbial communities in distinct agricultural systems in the Amazon and found that soils from primary forests had the highest richness in the fungal microbial community compared with soils from secondary forests, crops, and pastures. Other studies on fungal community in tropical areas showed that forest-to-agriculture conversion can alters the abundance of members in soil fungal microbial communities [31,32]. In Cerrado, Castro et al. [9] showed decrease in soil fungal microbial community diversity after soybean cultivation. Bresolin et al. [11] studied soil fungal microbial communities in native Cerrado and no-tillage soybean monoculture area, and their results revealed different alterations in soil fungal microbial communities due to soil cover changes (fallow vs. growth period) and crop development. The authors discussed their results based on differences in the pattern of root exudates potentially affecting the soil fungal microbial community.

3.3. Differences in Soil Fungal Microbial Community Structures

The ANOSIM of the dataset generated using ARISA indicated differences in the structures of the fungal communities between the areas evaluated. The R-values expressed the level of separation of the soil fungal microbial community structures in each area as a function of the period of land use on a scale varying between 0 (indistinguishable) and 1 (completely separated). R > 0.75 indicates well separated microorganism clusters, R > 0.5 indicates distinct but overlapping clusters, and R < 0.5 indicates relatively indistinct clusters [33]. The R-values of the control area in relation to the areas cultivated for five and eight years were 0.576 (p = 0.002) and 0.748 (p = 0.002), respectively. The two cultivated areas had the highest dissimilarity (R = 0.864, p = 0.001). In general, ANOSIM indicated structural differences in soil fungal communities between the study areas. The sites from the area cultivated for eight years did not showed overlap with sites from the control area and from the area cultivated for five years. Some of the sites from the control area were clustered with sites from the area cultivated for five years, indicating an overlap between these sites, according to similarity analysis.
The structure of fungal communities was correlated with the chemical constituents of the soil, organized according to the redundancy analysis (RDA). RDA has been used to correlate biotic factors with environmental conditions, seasonal fluctuations, and different conditions present in the areas evaluated, including physico-chemical characteristics of the soil [34,35,36]. The spatial coordinates of the fungal communities and the chemical properties of the soil are shown in Figure 4.
A total of 28.8% of all variation was explained by the first two RDA axes (Figure 4). RDA results showed that soil fungal microbial community structures from area cultivated for eight years were related to nutrient-linked soil chemical properties, such as phosphorus (P), copper (Cu), potassium (K), calcium (Ca), magnesium (Mg), sodium (Na), zinc (Zn), iron (Fe), manganese (Mn), and also the sum of bases (SB), and pH (Figure 2). Navarrete et al. [16] also showed acidity and nutrient-linked soil chemical properties more closely associated with fungal microbial community structures from agricultural soil. RDA did not revealed distinct clusters for the control area and the area cultivated for five years. In the control area, soil fungal microbial community structures were more closely associated with potential acidity (H + Al), while in the area cultivated for five years they were more closely associated with aluminum content (Al). The differences observed in the structures of fungal communities in these areas reflect their environmental differences and distinct chemical characteristics.

4. Conclusions

Based on a multi-analytical approach that incorporated molecular analysis of soil fungal microbial community structure, soil chemical properties measurements and statistical analysis, our study showed that the richness and structure of fungal communities in sub-irrigated agricultural soil in Cerrado floodplains is affected by soil agricultural management for soybean cultivation, mainly through changes in soil chemical properties such as soil acidity and nutrient availability. Differences in soil chemical properties and ecological aspects of the soil fungal microbial communities between soils from areas under native vegetation and soybean cultivation indicated that soil agricultural management for consecutive years affects soil chemical and microbiological properties in tropical floodplain areas, and the effects become more evident to the extent that soil is used for agriculture for more time. Based on the results, richness and community structure are reliable ecological parameters to analyze the impact of agriculture in soils from Cerrado floodplains.

Acknowledgments

The authors thank CNPq for the financial support of this work (552548/2011-1 and 485801/2011-6) and scholarships (141388/2012-9) and SMT productivity scholarship). WPOJ thanks UFT for productivity scholarship. AAN was supported by São Paulo Research Foundation (FAPESP 2012/13321-7).

Author Contributions

Conceived and designed the study: Paula B. de Morais, Elainy Cristina A. M. Oliveira. Performed research Elainy Cristina A. M. Oliveira, Acacio A. Navarrete, Alana de A. Valadares, Paula B. de Morais, Joenes M. Peluzio, Waldesse P. de O. Junior, Siu M. Tsai. Contributed new reagents/analytic tools: Paula B. de Morais, Siu M. Tsai, Acacio A. Navarrete. Wrote the paper: Elainy Cristina A. M. Oliveira, Acacio A. Navarrete, Paula B. de Morais.

Conflicts of Interest

The authors declare no conflict of interest.

References

  1. Satish, N.; Sultana, S.; Nanjundiah, V. Diversity of soil fungi in a tropical deciduous forest in Mudumalai, southern India. Curr. Sci. 2007, 93, 669–677. [Google Scholar]
  2. Bills, G.F.; Christensen, M.; Powell, M.; Thorn, G. Saprobic soil fungi. In Biodiversity of Fungi: Inventory and Monitoring Methods; Mueller, G.M., Bills, G.F., Foster, M.S., Eds.; Elsevier: Burlington, MA, USA, 2004; pp. 271–302. [Google Scholar]
  3. Treseder, K.K. Nutrient acquisition strategies of fungi and their relation to elevated atmospheric CO2. In The Fungal Community: Its Organization and Role in the Ecosystem; Dighton, J., White, J.F., Oudemans, P, Eds.; CRC Press: Boca Ration, FL, USA, 2005; pp. 713–731. [Google Scholar]
  4. Watling, R. Fungal conservation: Some impressions–A personal view. In The Fungal Community: Its Organization and Role in the Ecosystem; Dighton, J., White, J.F., Oudemans, P., Eds.; CRC Press: Boca Ration, FL, USA, 2005; pp. 881–896. [Google Scholar]
  5. Miransari, M. Contribution of arbuscular mycorrhizal symbiosis to plant growth under different types of soil stress. Plant Biol. 2010, 12, 563–569. [Google Scholar] [CrossRef] [PubMed]
  6. Costa, E.A.; Goedert, W.J.; Souza, D.M.G. Qualidade de solo submetido a sistemas de cultivo com preparo convencional e plantio direto. Pesqui. Agropecu. Bras. 2006, 41, 1185–1191. [Google Scholar] [CrossRef]
  7. Carneiro, M.A.C.; Souza, E.D.; Reis, E.F.; Pereira, H.S.; Azevedo, W.R. Atributos físicos, químicos e biológicos de solo de Cerrado sob diferentes sistemas de uso e manejo. Revista Bras. Ciênc. Solo 2009, 33, 147–157. (In Spanish) [Google Scholar] [CrossRef]
  8. Vieira, M.J.; Muzilli, O. Características físicas de um Latossolo Vermelho-Escuro sob diferentes sistemas de manejo. Pesqui. Agropecu. Bras. 1984, 19, 873–882. [Google Scholar]
  9. Castro, A.P.; Quirino, B.F.; Pappas, G., Jr.; Kurokawa, A.S.; Neto, E.L.; Kruger, R.H. Diversity of soil fungal communities of Cerrado and its closely surrounding agriculture fields. Arch. Microbiol. 2008, 190, 129–139. [Google Scholar] [CrossRef] [PubMed]
  10. Castro, A.P.; Silva, M.R.S.S.; Quirino, B.F.; Bustamante, M.M.C.; Krüger, R.H. Microbial diversity in cerrado biome (Neotropical savanna) soils. PLoS ONE 2016. [Google Scholar] [CrossRef]
  11. Bresolin, J.D.; Bustamante, M.M.C.; Krüger, R.H.; Silva, M.R.S.S.; Perez, K.S. Structure and composition of bacterial and fungal community in soil under soybean monoculture in the brazilian cerrado. Braz. J. Microbiol. 2010, 41, 391–403. [Google Scholar] [CrossRef] [PubMed]
  12. O´Brien, H.E.; Parrent, J.L.; Jackson, J.A.; Moncalvo, J.M.; Vilgalys, R. Fungal community analisys by large-scale sequencing of environmental samples. Appl. Environ. Microbiol. 2005, 71, 5544–5550. [Google Scholar] [CrossRef] [PubMed]
  13. Fisher, M.M.; Triplett, E.W. Automated approach for ribosomal intergenic spacer analysis of microbial diversity and its application to freshwater bacterial communities. Appl. Environ. Microbiol. 1999, 65, 4630–4636. [Google Scholar] [PubMed]
  14. Ranjard, L.; Poly, F.; Lata, J.C.; Mougel, C.; Thioulouse, J.; Nazaret, S. Characterization of bacterial and fungal soil communities by automated ribosomal intergenic spacer analysis fingerprints: Biological and methodological variability. Appl. Environ. Microbiol. 2001, 67, 4479–4487. [Google Scholar] [CrossRef] [PubMed]
  15. Lejon, D.P.H.; Chaussod, R.; Ranger, J.; Ranjard, L. Microbial community structure and density under different tree species in an acid forest soil (Morvan, France). Microb. Ecol. 2005, 50, 614–625. [Google Scholar] [CrossRef] [PubMed]
  16. Navarrete, A.A.; Cannavan, F.S.; Taketani, R.G.; Tsai, S.M. A molecular survey of the diversity of microbial communities in different Amazonian agricultural model systems. Diversity 2010, 2, 787–809. [Google Scholar] [CrossRef]
  17. Jouquet, P.; Maron, P.A.; Nowak, V.; Duc, T.T. Utilization of microbial abundance and diversity as indicators of the origin of soil aggregates produced by earthworms. Soil Biol. Biochem. 2013, 57, 950–952. [Google Scholar] [CrossRef]
  18. Eiten, G. Vegetation near Santa Teresinha, NE Mato Grosso. Acta Amazon. 1985, 15, 275–301. [Google Scholar] [CrossRef]
  19. Kichel, E.; Fidelis, R.R.; dos Santos, M.M.; Brandão, D.R.; Cancellier, E.L.; do Nascimento, I.R. Efeito do Nitrogênio em genótipos de arroz cultivados em várzea úmida do Estado do Tocantins. Rev. Ceres 2011, 58, 84–89. (In Spanish) [Google Scholar] [CrossRef]
  20. Mileski, E. Aspecto da vegetação e do ecossistema da Ilha do bananal. In Mapa Fitoecológico e Indicadores da Pressão Antrópica; Secretária de Assuntos Estratégicos: Brasília, Brazil, 1994; p. 104. (In Spanish) [Google Scholar]
  21. Embrapa. Manual de Métodos de Análise de Solos; Embrapa Solos: Rio de Janeiro, Brazil, 2011; p. 230. Available online: https://www.embrapa.br/busca-de-publicacoes/-/publicacao/990374/manual-de-metodos-de-analise-de-solo (accessed on 10 March 2016). (In Spanish)
  22. Brody, J.R.; Kern, S.E. Sodium boric acid: Atriz-less, cooler conductive medium for DNA electrophoresis. BioTechniques 2004, 36, 214–216. [Google Scholar] [PubMed]
  23. Culman, S.W.; Gauch, H.G.; Blackwood, C.B.; Thies, J.E. Analysis of T-RFLP data using analysis of variance and ordination methods: A comparative study. J. Microbiol. Methods 2008, 75, 55–63. [Google Scholar] [CrossRef] [PubMed]
  24. Mucha, A.P.; Teixeira, C.; Reis, I.; Magalhães, C.; Bordalo, A.A.; Almeida, C.M.R. Response of a salt marsh microbial community to metal contamination. Estuar. Coast. Shelf Sci. 2013, 130, 81–88. [Google Scholar] [CrossRef]
  25. Kindt, R.; Coe, R. A manual and software for common statistical methods and biodiversity studies. In Tree Diversity Analysis; World Agroforestry Centre (ICRAF): Nairobi, Kenya, 2005. [Google Scholar]
  26. R Development Core Team. R: A Language and Environment for Statistical Computing; R Foundation for Statistical Computing: Vienna, Austria, 2007. [Google Scholar]
  27. Ernani, P.R.; Ribeiro, M.F.S.; Bayer, C. Chemical modifications caused by liming below the limed layer in a predominantly variable charge acid soil. Commun. Soil Sci. Plant Anal. 2004, 35, 889–901. [Google Scholar] [CrossRef]
  28. Caires, E.F.; Garbuio, F.J.; Churka, S.; Barth, G.; Corrêa, J.C.L. Effects of soil acidity amelioration by surface liming on no-till corn, soybean, and wheat root growth and yield. Eur. J. Agron. 2008, 28, 57–64. [Google Scholar] [CrossRef]
  29. Moreira, A.; Fageria, N.K. Liming influence on soil chemical properties, nutritional status and yield of alfalfa grown in acid soil. Rev. Bras. Ciênc. Solo 2010, 34, 1231–1239. [Google Scholar] [CrossRef]
  30. Buckley, D.H.; Schmidt, T.M. Diversity and dynamics of microbial communities in soils from agro-ecosystems. Appl. Environ. Microbiol. 2003, 5, 441–452. [Google Scholar] [CrossRef]
  31. Rambelli, A.; Persiani, A.M.; Maggi, O.; Lunghini, D.; Onofri, S.; Riess, S.; Dowgiallo, G.; Puppi, G. Comparative studies on microfungi in tropical ecosystems. In Mycological Studies in South Western Ivory Coast Forest; Report No. 1; MAB, UNESCO: Paris, France, 1983; p. 102. [Google Scholar]
  32. Maggi, O.; Persiani, A.M.; Casado, M.A.; Pineda, F.D. Edaphic mycoflora recovery in tropical forests after shifting cultivation. Acta Oecol. 1990, 11, 337–350. [Google Scholar]
  33. Clarke, K.R.; Gorley, R.N. PRIMER 6.0: User Manual/Tutorial; PRIMER-E: Plymouth, UK, 2006. [Google Scholar]
  34. Hitzl, W.; Henrich, M.; Kessel, M.; Insam, H. Application of multivariate analysis of variance and related techniques in soil studies with substrate utilization tests. J. Microbiol. Methods 1997, 30, 81–89. [Google Scholar] [CrossRef]
  35. Xu, J. Microbial ecology in the age of genomics and metagenomics: concepts, tools, and recent advances. Mol. Ecol. 2006, 15, 1713–1731. [Google Scholar] [CrossRef] [PubMed]
  36. Ramette, A. Multivariate analyses in microbial ecology. FEMS Microbiol. Ecol. 2007, 62, 142–160. [Google Scholar] [CrossRef] [PubMed]
Figure 1. Location of the study areas in the Lagoa da Confusão municipality, State of Tocantins, Brazil.
Diversity 08 00013 g001
Figure 2. Schematic representation of the study design used in the collection of soil samples from each study area.
Diversity 08 00013 g002
Figure 3. Venn diagram showing the number of unique and shared phylotypes found in the soil fungal microbial communities between the study areas.
Diversity 08 00013 g003
Figure 4. Constrained ordination diagram for sample plots (green circle = CT, control area; blue circle = area cultivated for five years; red square = area cultivated for eight years) in the first two redundancy analysis (RDA) axes based on the soil chemical characteristics of the different sampling sites and their relationship with the structure of soil fungal microbial communities identified using ARISA. A, B, C, D, and E are replicate soil cores for each sampling site. P: phosphorus; K: potassium; Ca: calcium; Mg: magnesium; H + Al: potential acidity; SB: sum of bases; Na: sodium; Zn: zinc; Cu: copper; Fe: iron; Mn: manganese. Arrows indicate correlation between the chemical parameters and sample community structure. The significance (p < 0.05) of these correlations was evaluated via the Monte Carlo permutation test.
Diversity 08 00013 g004
Table 1. Soil chemical properties of the 0 to 10 cm topsoil layer at different study areas.
Chemical PropertiesStudy Areas
Native Vegetation (Control Area)Area Cultivated for Five YearsArea Cultivated for Eight Years
pH4.4 (1) c (2) ± 0.11 (3)4.6 b ± 0.085.0 a ± 0.07
OM89.6 a ± 16.7886.6 a ± 11.8260.2 a ± 20.37
P8.8 b ± 0.9720.2 a ± 7.6746.3 a ± 11.78
S3.1 a ± 0.323.8 a ± 0.433.4 a ± 1.06
K46.6 b ± 8.2994.8 a ± 35.4075.8 a,b ± 16.85
Ca0.68 c ± 0.531.92 b ± 0.413.5 a ± 0.46
Mg0.76 b ± 0.590.92 b ± 0.081.8 a ± 0.33
Al1.04 a ± 0.410.5 b ± 0.450.28 b ± 0.04
H + Al10.0 a ± 1.208.8 a ± 0.457.2 b ± 0.56
CEC11.55 a ± 1.3311.92 a ± 0.1712.77 a ± 0.89
SB13.38 c ± 6.2125.84 b ± 3.6943.62 a ± 2.41
Na21.2 b ± 4.1419.6 b ± 1.6729.6 a ± 2.96
Zn0.78 c ± 0.824.0 b ± 0.888.1 a ± 1.60
B0.22 a ± 0.050.19 a ± 0.030.23 a ± 0.05
Cu1.2 b ± 0.462.1 a,b ± 0.583.22 a ± 1.00
Fe47.84 b ± 12.2773.16 a,b ± 13.6386.78 a ± 20.18
Mn9.2 b ± 3.418.8 a ± 3.6523.84 a ± 3.32
pH (CaCl2); OM–organic matter (g/dm3); P, S, K (mg/dm3); Ca, Mg, Al, H + Al, SB, and CEC–Cation Exchange Capacity (cmolc/dm3); Na, Zn, B, Cu, Fe, Mn (mg/dm3); (1) Average for each of five replicates of soil; (2) Values with the same letters (a, b and c) were not significantly different (p < 0.05) based on a Tukey’s HSD test; (3) Standard deviation of the average for each of five replicates of soil.
Table 2. Phylotypes in each study area, the total number of phylotypes in each sampling area, the number of phylotypes with abundance levels larger and smaller than 1%, and the number of shared phylotypes.
Study AreasSampling Site in Each AreaNumber of Phylotypes in Each Sampling SiteTotal Number of Phylotypes *Number of Phylotypes with Abundance Levels < 1%Number of Phylotypes with Abundance Levels > 1%Number of Phylotypes with Abundance Levels > 1% Shared Between the Control Area and the Area Cultivated for Five YearsNumber of Phylotypes with Abundance Levels > 1% Shared Between the Control Area and the Area Cultivated for Eight YearsNumber of Phylotypes with Abundance Levels > 1% Shared Between the Area Cultivated for Five and Eight Years
Control areaA10228125526502
B126
C76
D86
E115
Area cultivated for 5 yearsA9829627323
B88
C123
D144
E118
Area cultivated for 8 yearsA9428727017
B98
C104
D149
E156
* The presence or absence of phylotype was considered. The phylotypes that appeared in two or more sites from the same area were counted only once.

