Article

Untangling the Genetic Basis of Fibrolytic Specialization by Lachnospiraceae and Ruminococcaceae in Diverse Gut Communities

1
Department of Microbiology, University of Massachusetts, Amherst, MA 01003, USA
2
Department of Biology, University of Massachusetts, Amherst, MA 01003, USA
3
Department of Veterinary and Animal Sciences, University of Massachusetts, Amherst, MA 01003, USA
*
Author to whom correspondence should be addressed.
Diversity 2013, 5(3), 627-640; https://doi.org/10.3390/d5030627
Submission received: 17 May 2013 / Revised: 21 June 2013 / Accepted: 26 June 2013 / Published: 9 August 2013
(This article belongs to the Special Issue Microbial Ecology and Diversity)

Abstract

:
The Lachnospiraceae and Ruminococcaceae are two of the most abundant families from the order Clostridiales found in the mammalian gut environment, and have been associated with the maintenance of gut health. While they are both diverse groups, they share a common role as active plant degraders. By comparing the genomes of the Lachnospiraceae and Ruminococcaceae with the Clostridiaceae, a more commonly free-living group, we identify key carbohydrate-active enzymes, sugar transport mechanisms, and metabolic pathways that distinguish these two commensal groups as specialists for the degradation of complex plant material.

1. Introduction

1.1. Taxonomic Revision of the Clostridiales Is a Work in Progress

Classically, the genus Clostridium was described as comprising spore-forming, non-sulfate reducing obligate anaerobic bacteria with a gram-positive cell wall. Over the years, the classification and naming of new species based on phenotypic traits has led to much confusion about the relationships between taxa in this and related groups. In fact, many species classified as Clostridium are more closely related to members of other genera than to the type species, Clostridium butyricum [1,2] Prior to 2009, the order Clostridiales was divided into eight families, many of which were recognized at the time to be paraphyletic [3]. The most recent taxonomic revision of the Phylum Firmicutes in Bergey’s Manual of Systematic Bacteriology [4], divided the Clostridiales into ten named families. An additional nine families were identified as Incertae sedis (Latin for uncertain placement) in an effort to regroup species found to fall outside of the named families.
In the past decades, surveys of 16S rRNA gene sequence diversity have led to the identification of thousands of novel taxa and a new appreciation for the overwhelming diversity of the microbial world. At the same time, knowledge about the roles of new species in their environments has remained scanty [5]. For diverse groups with confusing taxonomic structure, such as the clostridia, linking the phylogeny of novel, uncultured taxa to possible ecological and/or physiological roles requires extensive prior knowledge and time-consuming literature review.

1.2. Lachnospiraceae and Ruminococcaceae are Active Members of the Gut Environment

Abundance estimates based on 16S rRNA surveys suggest that Firmicutes comprise between 50–80% of the taxa in the core human gut microbiota [6,7], and more than 84% of the active fraction [8]. Lachnospiraceae and Ruminococcaceae are the most abundant Firmicute families in gut environments, accounting for roughly 50% and 30% of phylotypes respectively [6,9]. Lachnospiraceae such as Eubacterium rectale, Eubacterium ventriosum, Coprococcus sp. and Roseburia sp. have been associated with the production of butyrate necessary for the health of colonic epithelial tissue [10,11], and have been shown to be depleted in inflammatory bowel disease [12]. Unusual polysaccharide binding and degradation strategieshave been described in Ruminococcus flavefaciens [13,14], while another Ruminococcaceae, Faecalibacterium prausnitzii, has been shown to be depleted in Crohn’s disease [15].

1.3. The Complexity of Plant Material Poses Challenges for Bacterial Decomposition

Plant biomass is a fibrous composite of fibrils and sheets of cellulose, hemicellulose, lignin, waxes, pectin, and proteins forming a complex network that provides support for the plant while resisting attack from bacteria and fungi. Due to the size and complexity of the substrate, bacterial glycoside hydrolases (GH) are generally produced extracellularly. In anoxic environments such as the gut, bacteria utilize complexed, multienzyme catalytic systems found on the cell surface or in organelles called cellulosomes. These complexes are modular in design and often include one or more carbohydrate-binding modules (CBM) that attach to the substrate enabling easy access [16,17]. Surveys of plant degradation in the rumen show that bacteria that can degrade easily available substrates colonize plant material first, and that these communities are replaced by others capable of degrading more recalcitrant substrates such as cellulose [18]. Non-adherent Bacteriodes sp. and Bifidobacterium sp. have been shown to outcompete gram-positive bacteria (such as Firmicutes) for easily hydrolysable starch [19,20], while Lachnospiraceae and Ruminococcaceae persist in fibrolytic communities and are uniquely suited to degrade a wide variety of recalcitrant substrates [18].

1.4. Genomic Clues to Fibrolytic Function in Gut Environments

With progress of the Human Microbiome Project and other efforts to understand the complexity of microbial communities living on and inside of humans, an increasing number of sequenced genomes and datasets have been released [21]. Here we use genomic data to describe two families of Clostridiales that are highly abundant in the human gut microbiota, the Lachnospiraceae and the Ruminococcaceae. By comparing the distribution and abundance of carbohydrate-active enzymes and transporters, and the differences in key metabolic pathways present in the genomes of each group, we reveal genetic components supporting plant degradation by these fibrolytic specialists, and provide clues to help distinguish gut microbes from their primarily free-living relatives in the Clostridiaceae.

2. Experimental Section

2.1. Phylogenetic Arrangement of Lachnospiraceae, Clostridiaceae, and Ruminococcaceae

Sixty eight high quality (greater than 1,200 bases) 16S rRNA sequences of representative taxa from each family in the most recent taxonomic revision of the Phylum Firmicutes in Bergey’s Manual of Systematic Bacteriology [4] were downloaded from the Ribosomal Database Project website [22], and aligned using MUSCLE [23]. A maximum likelihood tree was created from these sequences with 500 bootstrap replicates using Escherichia/Shigella coli (ATCC 11775T; X80725) as the outgroup. Tree building was accomplished using the Tamura_Nei model [24] with default parameters in the program MEGA [25]. Tree visualization was carried out using Figtree [26].

2.2. Habitat Association by Group

Isolation site and habitat preference (gut vs. non-gut) was determined for listed members of each group from either the IMG (Integrated Microbial Genomes) metadata table [27] and published reports of isolation or 16S surveys. Pathogenic organisms were treated as non-gut residents if they were not reported to be part of the normal gut flora of a mammalian species. Logistic regression was performed to test whether each group was more likely to be gut associated, and the Wald test was used to test whether group assignment significantly predicted gut association.

2.3. Comparative Analysis of Carbohydrate-Active Enzymes

The numbers of carbohydrate-active genes and gene families were tabulated for each member of the Lachnospiraceae, Clostridiaceae, and Ruminococcaceae found in the Carbohydrate-Active enZymes Database (CAZy) [28] (Table S1). GH and CBM families represented in greater than 50% of total taxa (more than 15 of 31) and a difference of greater than two times in average abundance between any two groups were chosen for further analysis. All statistical analyses were done in R [29] using the package MASS [30]. Gene counts for each family and individual genes were tested for normality using the Shapiro-Wilk test [31]. Due to overdispersion and zero values across the data set, we did not transform the data [32]. Instead, we compared the fits of the negative binomial and Poisson regression models for the gene counts for each family. Clostridiaceae was used as a reference. Significance was estimated from the model with the best fit as determined by the p-values reported for likelihood ratio tests comparing both models.
Genomes were further searched for enzymes from each significant GH and CBM family using the genome comparison tool in the Integrated Microbial Genomes system [27]. Enzymes with significantly different abundances per group were identified by the best fit between negative binomial and Poisson regression models as described above for each GH and CBM family. Enzyme functions were assigned using UniprotKB [33].

2.4. Comparative Analysis of Sugar Transport Genes

Genomes from each member of the Lachnospiraceae, Clostridiaceae, and Ruminococcaceae found in the IMG database [27] were compared in terms of numbers of carbohydrate transport genes. Specifically, genomes were searched for 63 PTS (phosphotransferase system) genes, and 137 ABC (Adenosine triphosphate-binding cassette) transporter genes identified by KEGG orthology [34]. Gene counts for each taxa were tabulated and the difference between groups for each category of transporter genes was tested using the best fit between negative binomial or Poisson regression models as determined by likelihood ratio test (p-value < 0.05) as described earlier. Individual genes were chosen for further analysis if they had an average number of copies per taxa of at least 1% in any group. Significant differences between counts for these genes between families were estimated as described above for each category.

2.5. Comparative Analysis of Metabolic Pathways

Metabolic pathways characterized in Ecocyc [35] for each member of the Lachnospiraceae, Clostridiaceae, and Ruminococcaceae in the Biocyc database system [36] (Table S1) were tabulated for each pathway class. Significantly different pathway classes between the three families were identified using either one-way ANOVA (for data with a normal distribution based on the Shapiro-Wilks test) [31] or the best fit between negative binomial or Poisson regression models as described above.
For carbohydrate degradation pathways showing a difference between families, the percentage of genomes in each family containing the pathway was determined to highlight differences between families for these functions.

3. Results and Discussion

3.1. Phylogenetic Arrangement of Lachnospiraceae, Clostridiaceae, and Ruminococcaceae

The topology of the 16S rRNA neighbor-joining tree for the representative taxa chosen for this study confirms the clustering of the Lachnospiraceae, Clostridiaceae, and Ruminococcaceae into distinct clades (Figure 1) with the exception of Clostridium sporosphaeroides DSM 1294, which is identified as a Lachnospiraceae in Bergey’s newest revision [4] yet clearly clusters with the Ruminococcaceae.
Figure 1. Molecular Phylogenetic analysis by Maximum Likelihood method: Phylogeny was inferred using the Maximum Likelihood method based on the Tamura-Nei model [24]. The tree with the highest log likelihood (−16219.1561) is shown. The percentage of trees in which the associated taxa clustered together (of 500 bootstrap replicates) is shown next to the branches. Initial tree(s) for the heuristic search were obtained automatically by applying Neighbor-Join and BioNJ algorithms to a matrix of pairwise distances estimated using the Maximum Composite Likelihood (MCL) approach, and then selecting the topology with superior log likelihood value. The tree is drawn to scale, with branch lengths measured in the number of substitutions per site. The analysis involved 69 nucleotide sequences. Codon positions included were 1st + 2nd + 3rd + Noncoding. All positions containing gaps and missing data were eliminated. There were a total of 984 positions in the final dataset. Evolutionary analyses were conducted in MEGA5 [25].
Diversity 05 00627 g001

3.2. Habitat Association by Group

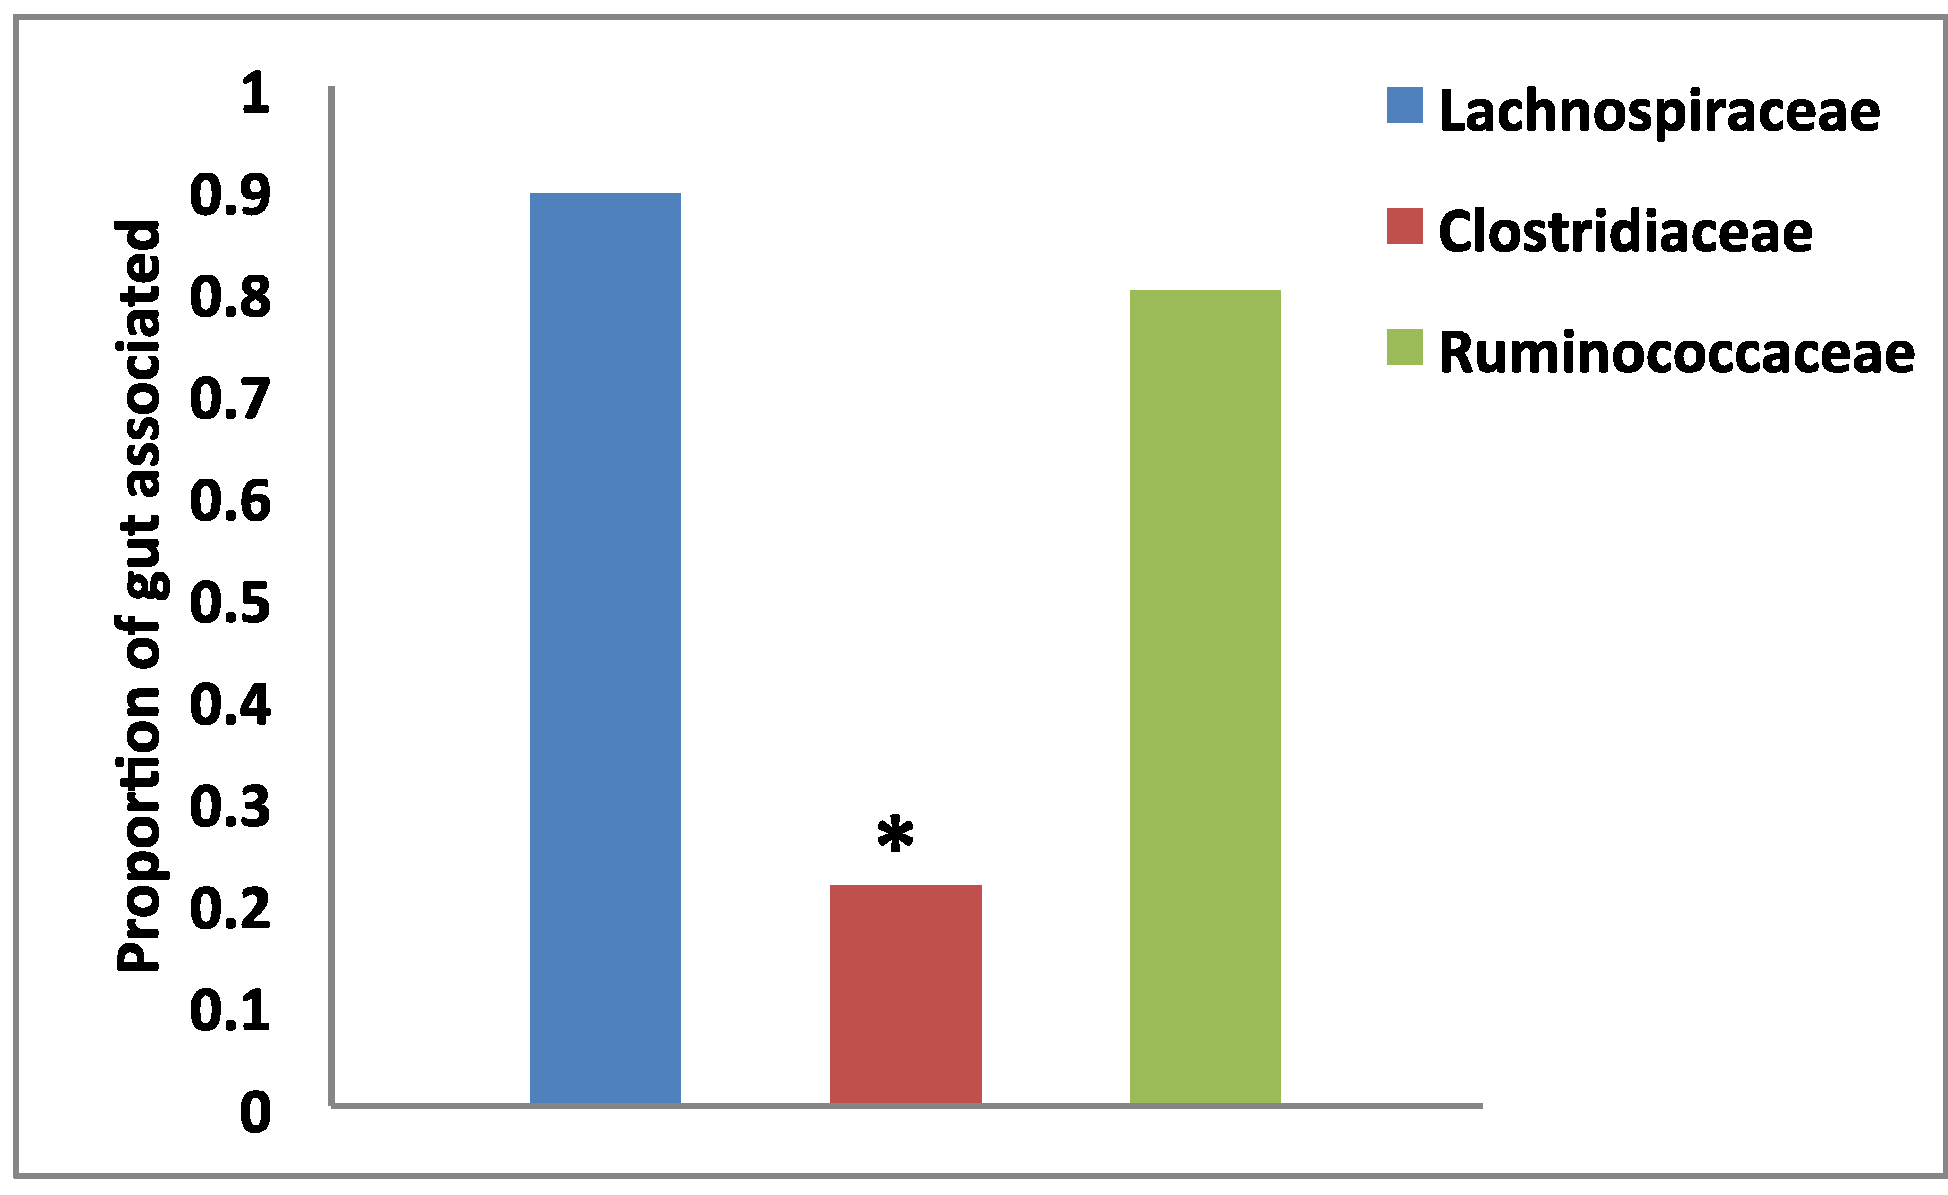
The logit model concluded that the three groups differ significantly in their likelihood to be gut associated (Figure 2). The Wald test predicted that the Ruminococcaceae and Lachnospiraceae were more likely than the Clostridiaceae to be gut associated (X2 = 17.5, df = 2, P (>X2) = 0.00016).
Figure 2. Proportion of members of each family that are gut associated. The Clostridiaceae are less likely to be gut associated based on logistical regression model predictions (p-value < 0.05) tested using the Wald test (Χ2 = 17.5, df = 2, P (>Χ2) = 0.00016).
Diversity 05 00627 g002

3.3. Comparative Analysis of Carbohydrate-Active Enzymes

The Lachnospiraceae, Clostridiaceae, and Ruminococcaceae differ with respect to the average numbers of carbohydrate-active genes and gene families, particularly the glycoside hydrolases (GH) and carbohydrate-binding modules (CBM) (Figure 3), which are more abundant and more diverse in the Lachnospiraceae and Ruminococcaceae.
Figure 3. Comparison of Carbohydrate-Active enZymes (CAZy) with respect to abundance in the genomes of Lachnospiraceae, Clostridiaceae, and Ruminococcaceae. (a) Average numbers of CAZy families per group. (b) Average numbers of CAZy genes per group. CAZy enzyme classes indicated as follows: GH = glycoside hydrolase, GTF = glucosyltransferase, CE = carbohydrate esterase, PL = polysaccharide lyase. (*) Groups showing significant differences in either one-way ANOVA testing (for data with a normal distribution based on the Shapiro-Wilks test) or the best fit between negative binomial and Poisson models as described above.
Diversity 05 00627 g003
A closer look at the average numbers of genes per GH family reveals that significant differences exist between these groups for thirteen GH families most of which include enzymes used to degrade complex plant polymers. With the exception of GH1, all of these families are more highly represented in the Lachnospiraceae, and Ruminococcaceae (Figure 4). GH2, GH3, GH43, and GH51 are associated with cleaving pectin and hemicellulose sidechains, GH5 and GH9 contain cellulases, GH13 and GH31 consist of starch-degrading alpha-glucosidases, while GH10 includes xylanases. GH94 contains phosphorylases that cleave beta-glycosidic bonds in cellobiose, cellodextrin and chitobiose.
Figure 4. Glycoside hydrolase families with significantly different patterns of abundance in the genomes of Lachnospiraceae, Clostridiaceae, and Ruminococcaceae based on best fit between negative binomial or Poisson regression models (Clostridiaceae as reference) as determined by likelihood ratio test (p-value < 0.05).
Diversity 05 00627 g004
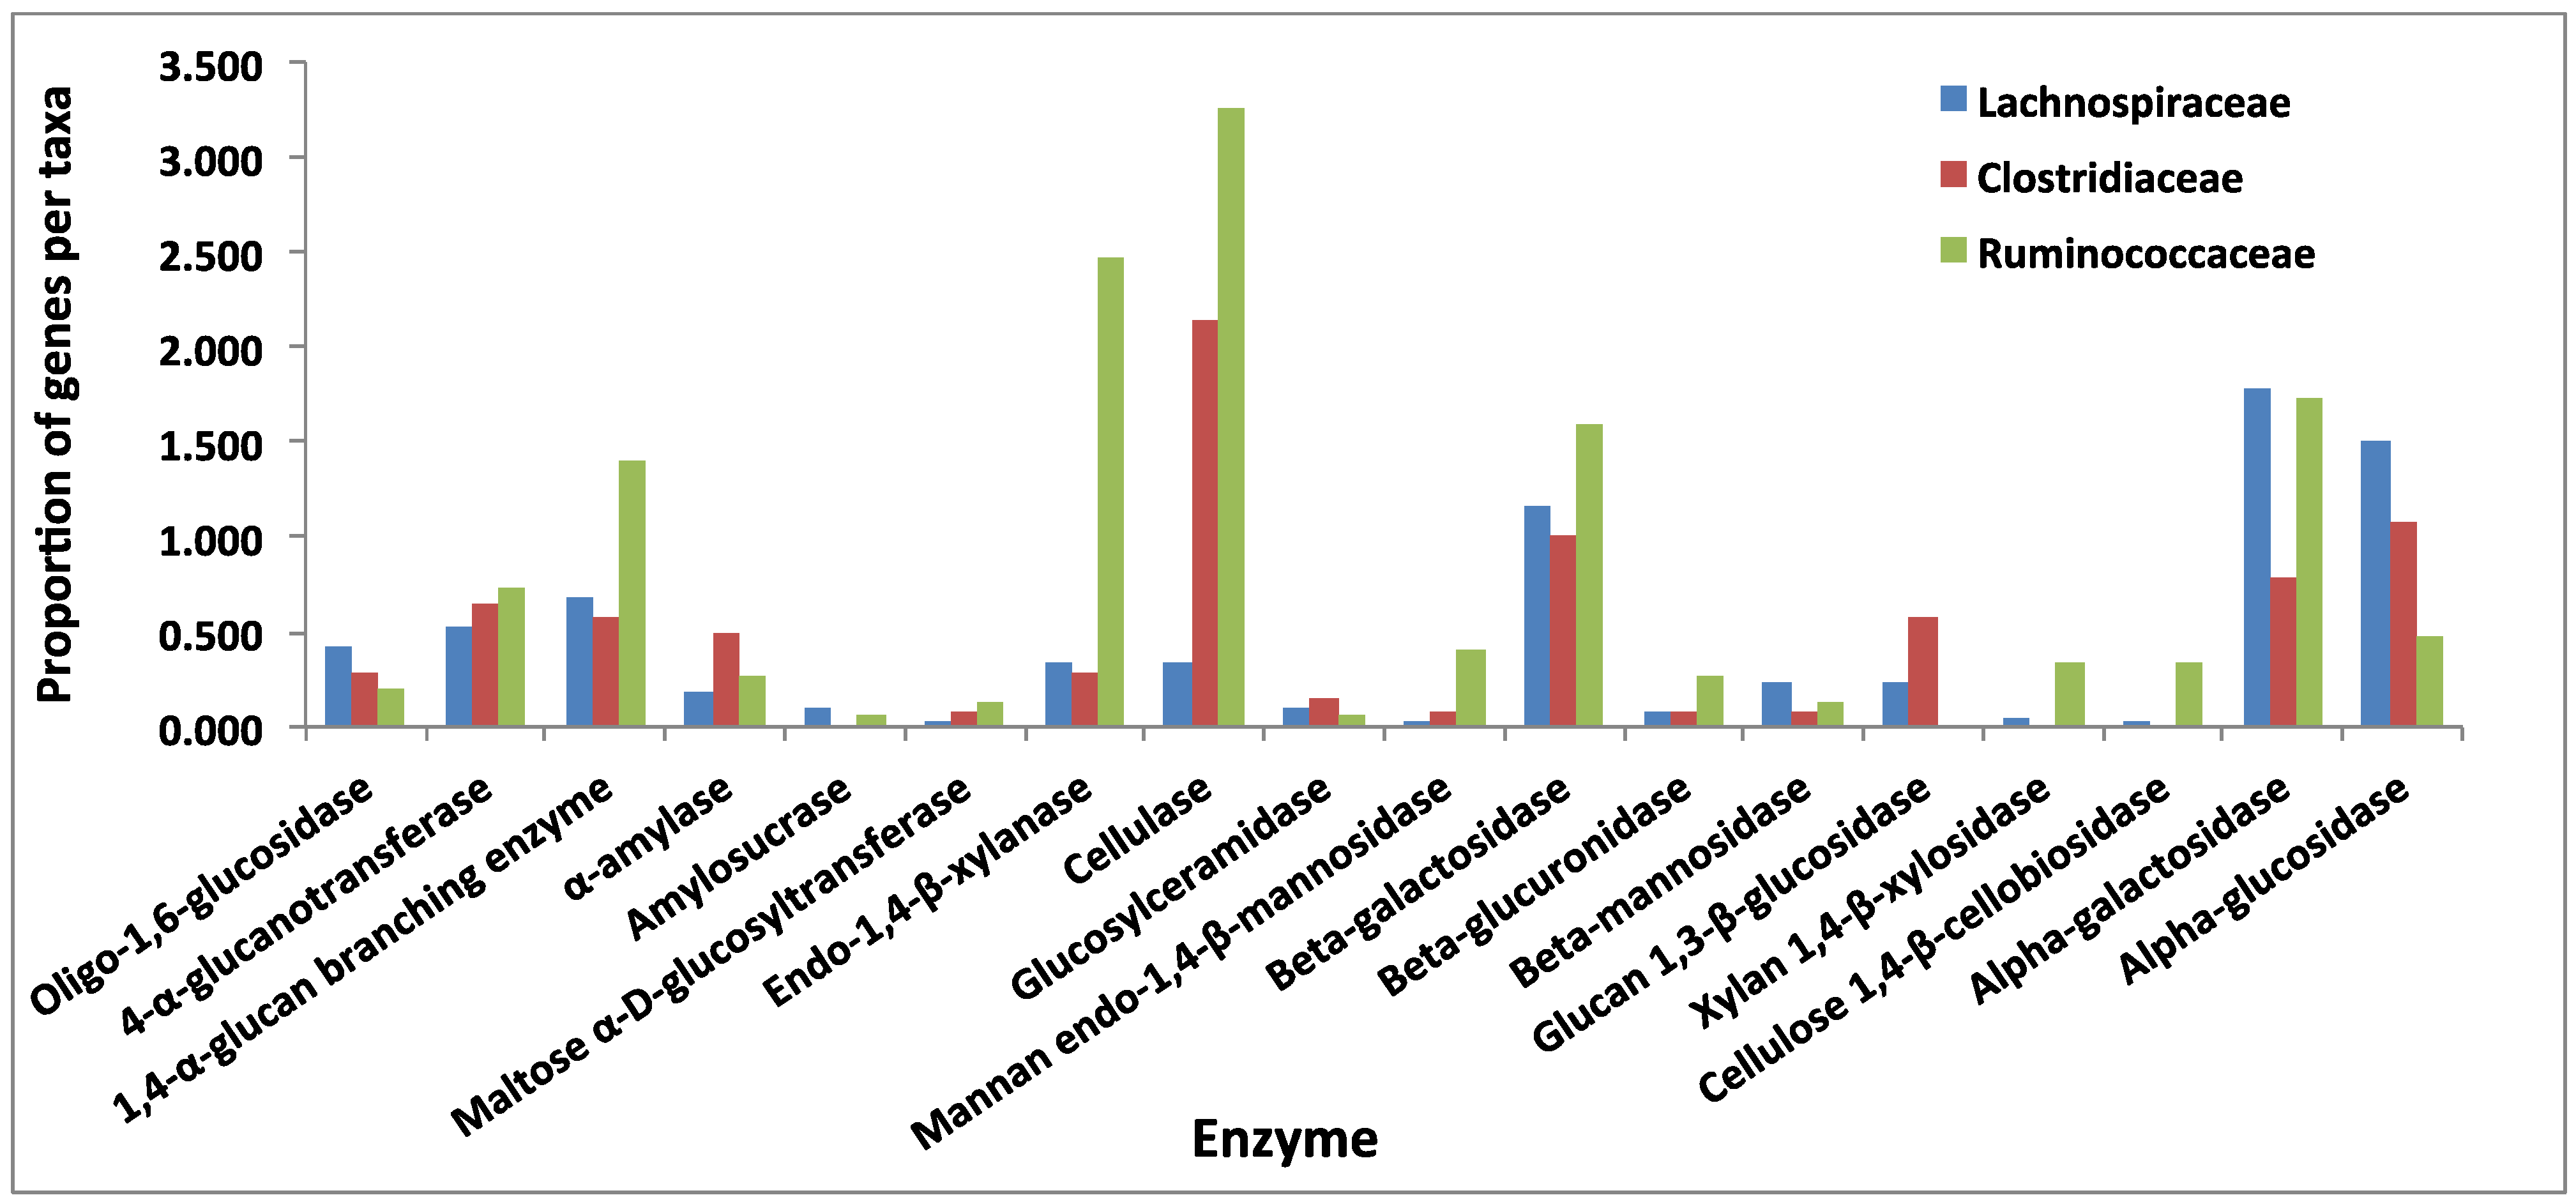
When GH enzyme families are broken into individual enzymes (Figure 5; Activities are given in Table S2), differences between microbial families related to specific plant degradation processes are revealed. The enzyme that differs significantly between the genomes of Lachnospiraceae, Clostridiaceae, and Ruminococcaceae in the GH1 family is a beta-glucosidase (EC: 3.2.1.21), which is found in almost every GH family. Considering other GH families, the Lachnospiraceae and Ruminococcaceae have higher numbers of genes equipped to degrade a wide variety of polysaccharides. The Ruminococcaceae are enriched in endo-1, 4-beta-xylanase and cellulase genes, while both groups have higher numbers of alpha-glucosidases and both alpha and beta-galactosidases. Thus, members of these microbial families are better equipped to cleave the cellulose and hemicellulose components of plant material.
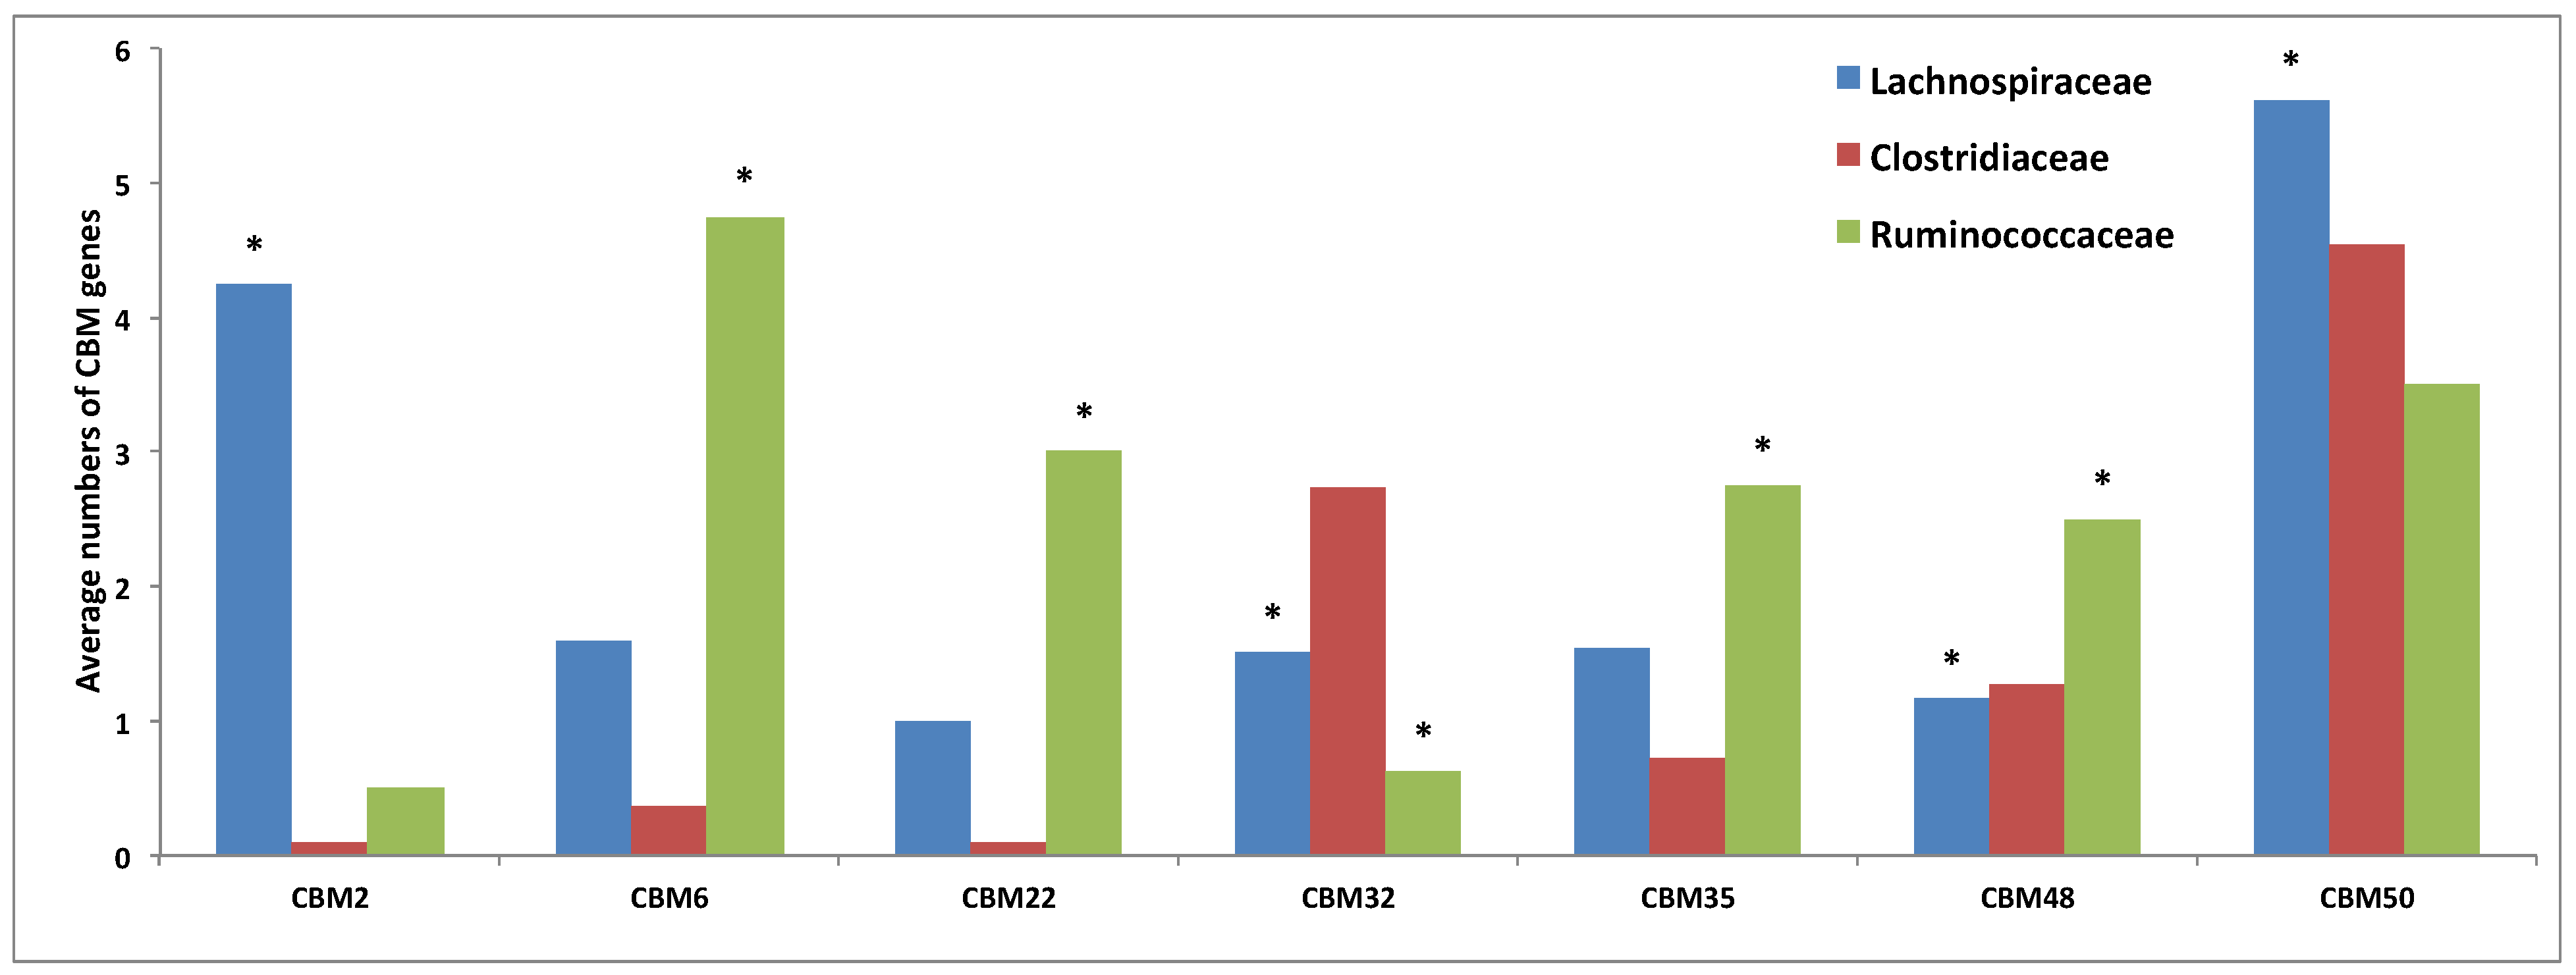
Carbohydrate-binding modules that differ significantly between the Lachnospiraceae, Clostridiaceae, and Ruminococcaceae include CBM6, CBM22, and CBM48 (Figure 6; Activities are given on Table S3). All are significantly enriched in the Ruminococcaceae which has been shown to have unusual substrate binding capabilities [14]. CBM6 binds to both cellulose and hemicellulose components of plant material, while CBM22 binds primarily to xylan, and CBM48 is associated with glycogen.
Figure 5. Specific glycoside hydrolase enzymes that differ significantly in abundance between the genomes of Lachnospiraceae, Clostridiaceae, and Ruminococcaceae based on best fit between negative binomial or Poisson regression models (Clostridiaceae as reference) as determined by likelihood ratio test (p-value < 0.05).
Diversity 05 00627 g005
Figure 6. Carbohydrate-binding module (CBM) families with (*) significantly different patterns of abundance in the genomes of Lachnospiraceae, Clostridiaceae, and Ruminococcaceae based on best fit between negative binomial or Poisson regression models (Clostridiaceae as reference) as determined by likelihood ratio test (p-value < 0.05).
Diversity 05 00627 g006

3.4. Comparative Analysis of Transporter Proteins

Genomes of the Clostridiaceae contained more PTS (phosphotransferase) genes than the Lachnospiraceae or Ruminococcaceae, while the later two groups were more highly enriched in ABC (ATP-binding cassette) genes (Figure 7).
PTS systems transport a wide variety of mono- and disaccharides, especially hexoses such as glucose [37]. In PTS transport, substrates are phosphorylated upon entry, which makes their subsequent metabolism efficient, and also provides a means for regulation and preferential sugar utilization via catabolite repression [38]. Thus, PTS transport enables bacteria living in carbohydrate-limited environments, such as soils and sediments, to efficiently utilize and compete for substrates as they become available.
Figure 7. A comparison of the average abundance of phosphotransferase system (PTS) and ATP-binding cassette (ABC) transporter genes in Lachnospiraceae, Clostridiaceae, and Ruminococcaceae genomes from the IMG database [27]. (*) Genes showing significant differences between groups (Clostridiaceae as reference) in best fit between negative binomial or Poisson regression models as determined by the likelihood ratio test (p-value < 0.05).
Diversity 05 00627 g007
ABC transporters, on the other hand, tend to carry oligosaccharides, and have less preference for hexoses [39,40]. Oligosaccharide import is energetically favorable because it enables the conservation of the energy of hydrolysis intracellularly. Regulation of ABC transporters is less well studied than for PTS; however, they are thought to be controlled by proteins acting to block specific domains [41]. The abundance of ATP transporters in the Lachnospiraceae and Ruminococcaceae is consistent with their capacity to utilize complex plant material, and transport degradation products of various sizes and compositions. Since carbon is not limited and is present as a range of complex polymers in the gut environment, the ability to utilize many different substrates may be more advantageous than the efficient intake of a preferred carbon source.
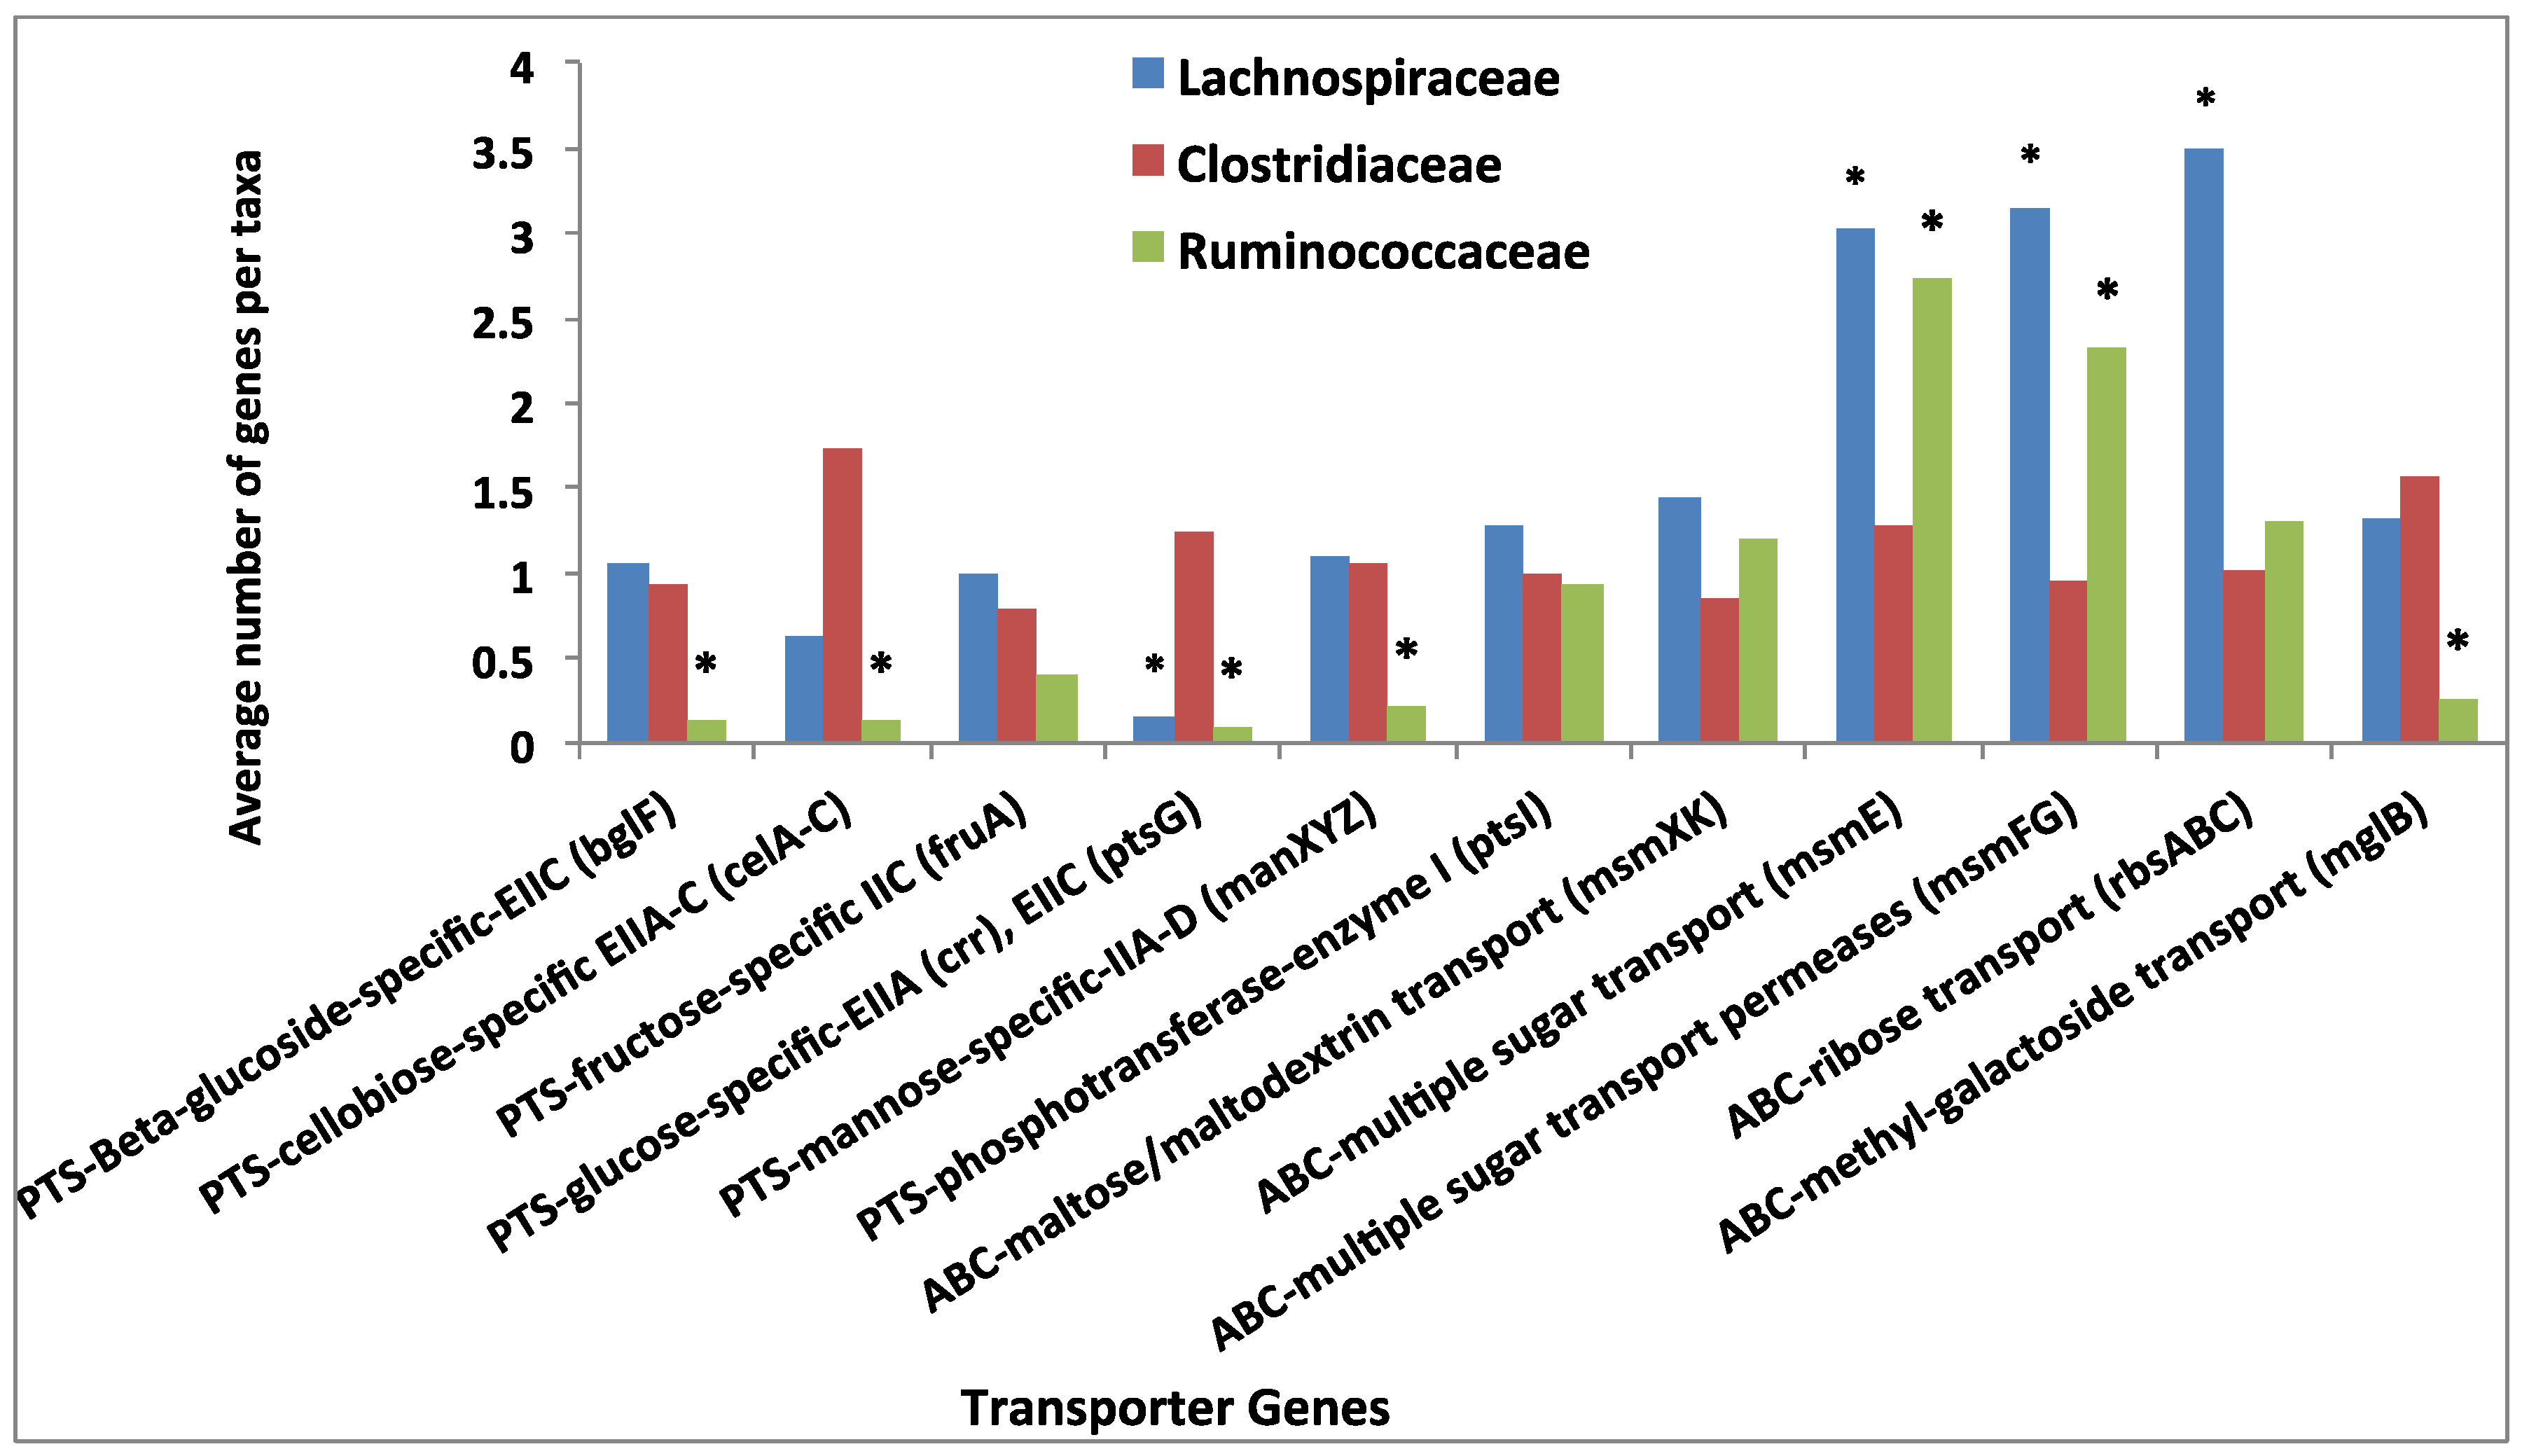
On the single gene level, the average abundance of sugar transport genes in each genome of Lachnospiraceae, Clostridiaceae, and Ruminococcaceae demonstrates the preference of the Clostridiaceae for simple hexoses such as glucose and cellobiose, and the wider range of substrates, including pentoses, transported by the Lachnospiraceae and Ruminococcaceae (Figure 8).
Figure 8. A comparison of average abundance of sugar transport genes in each genome of Lachnospiraceae, Clostridiaceae, and Ruminococcaceae. (*) Genes showing significant differences between groups (Clostridiaceae as reference) in best fit between negative binomial or Poisson regression models as determined by the likelihood ratio test (p-value < 0.05).
Diversity 05 00627 g008
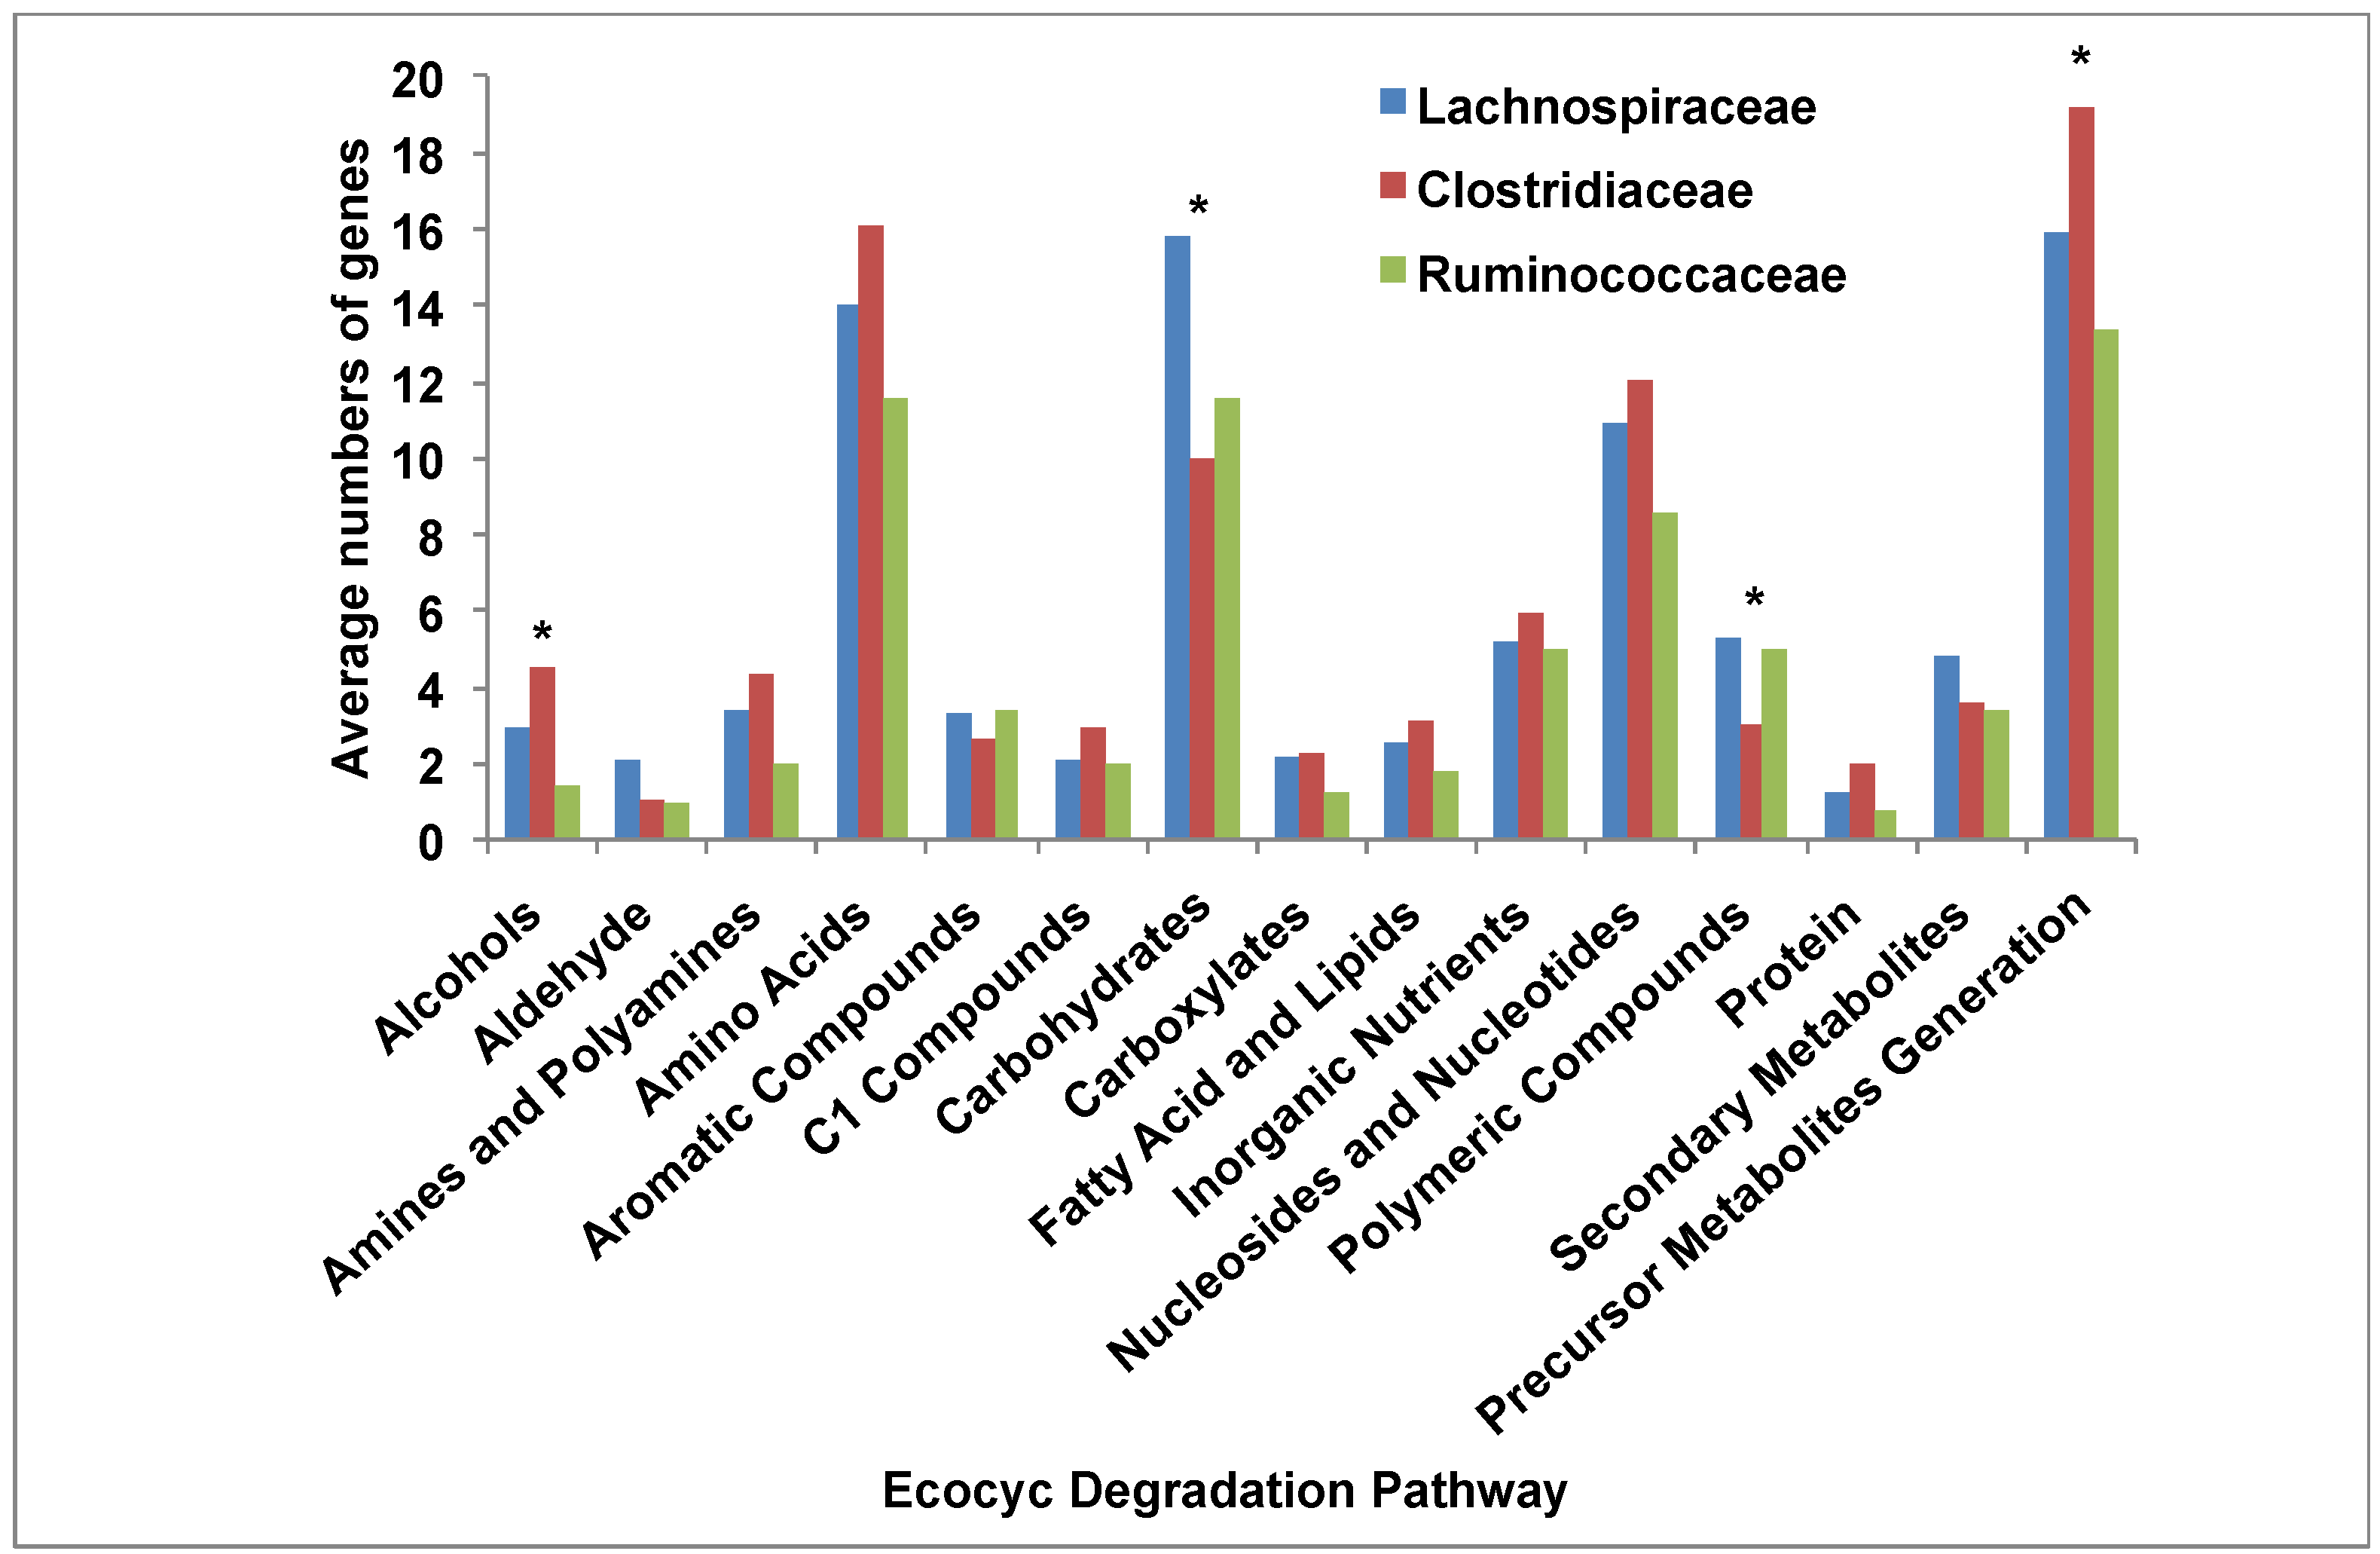
Figure 9. A comparison of average abundance of genes in each Ecocyc degradation [35] pathway for Lachnospiraceae, Clostridiaceae, and Ruminococcaceae genomes. (*) Pathways showing significant differences between groups in either one-way ANOVA testing (for normal data) (p-value < 0.05) or the best fit between negative binomial or Poisson regression models as determined by the likelihood ratio test (p-value < 0.05).
Diversity 05 00627 g009

3.5. Comparative Analysis of Metabolic Pathways
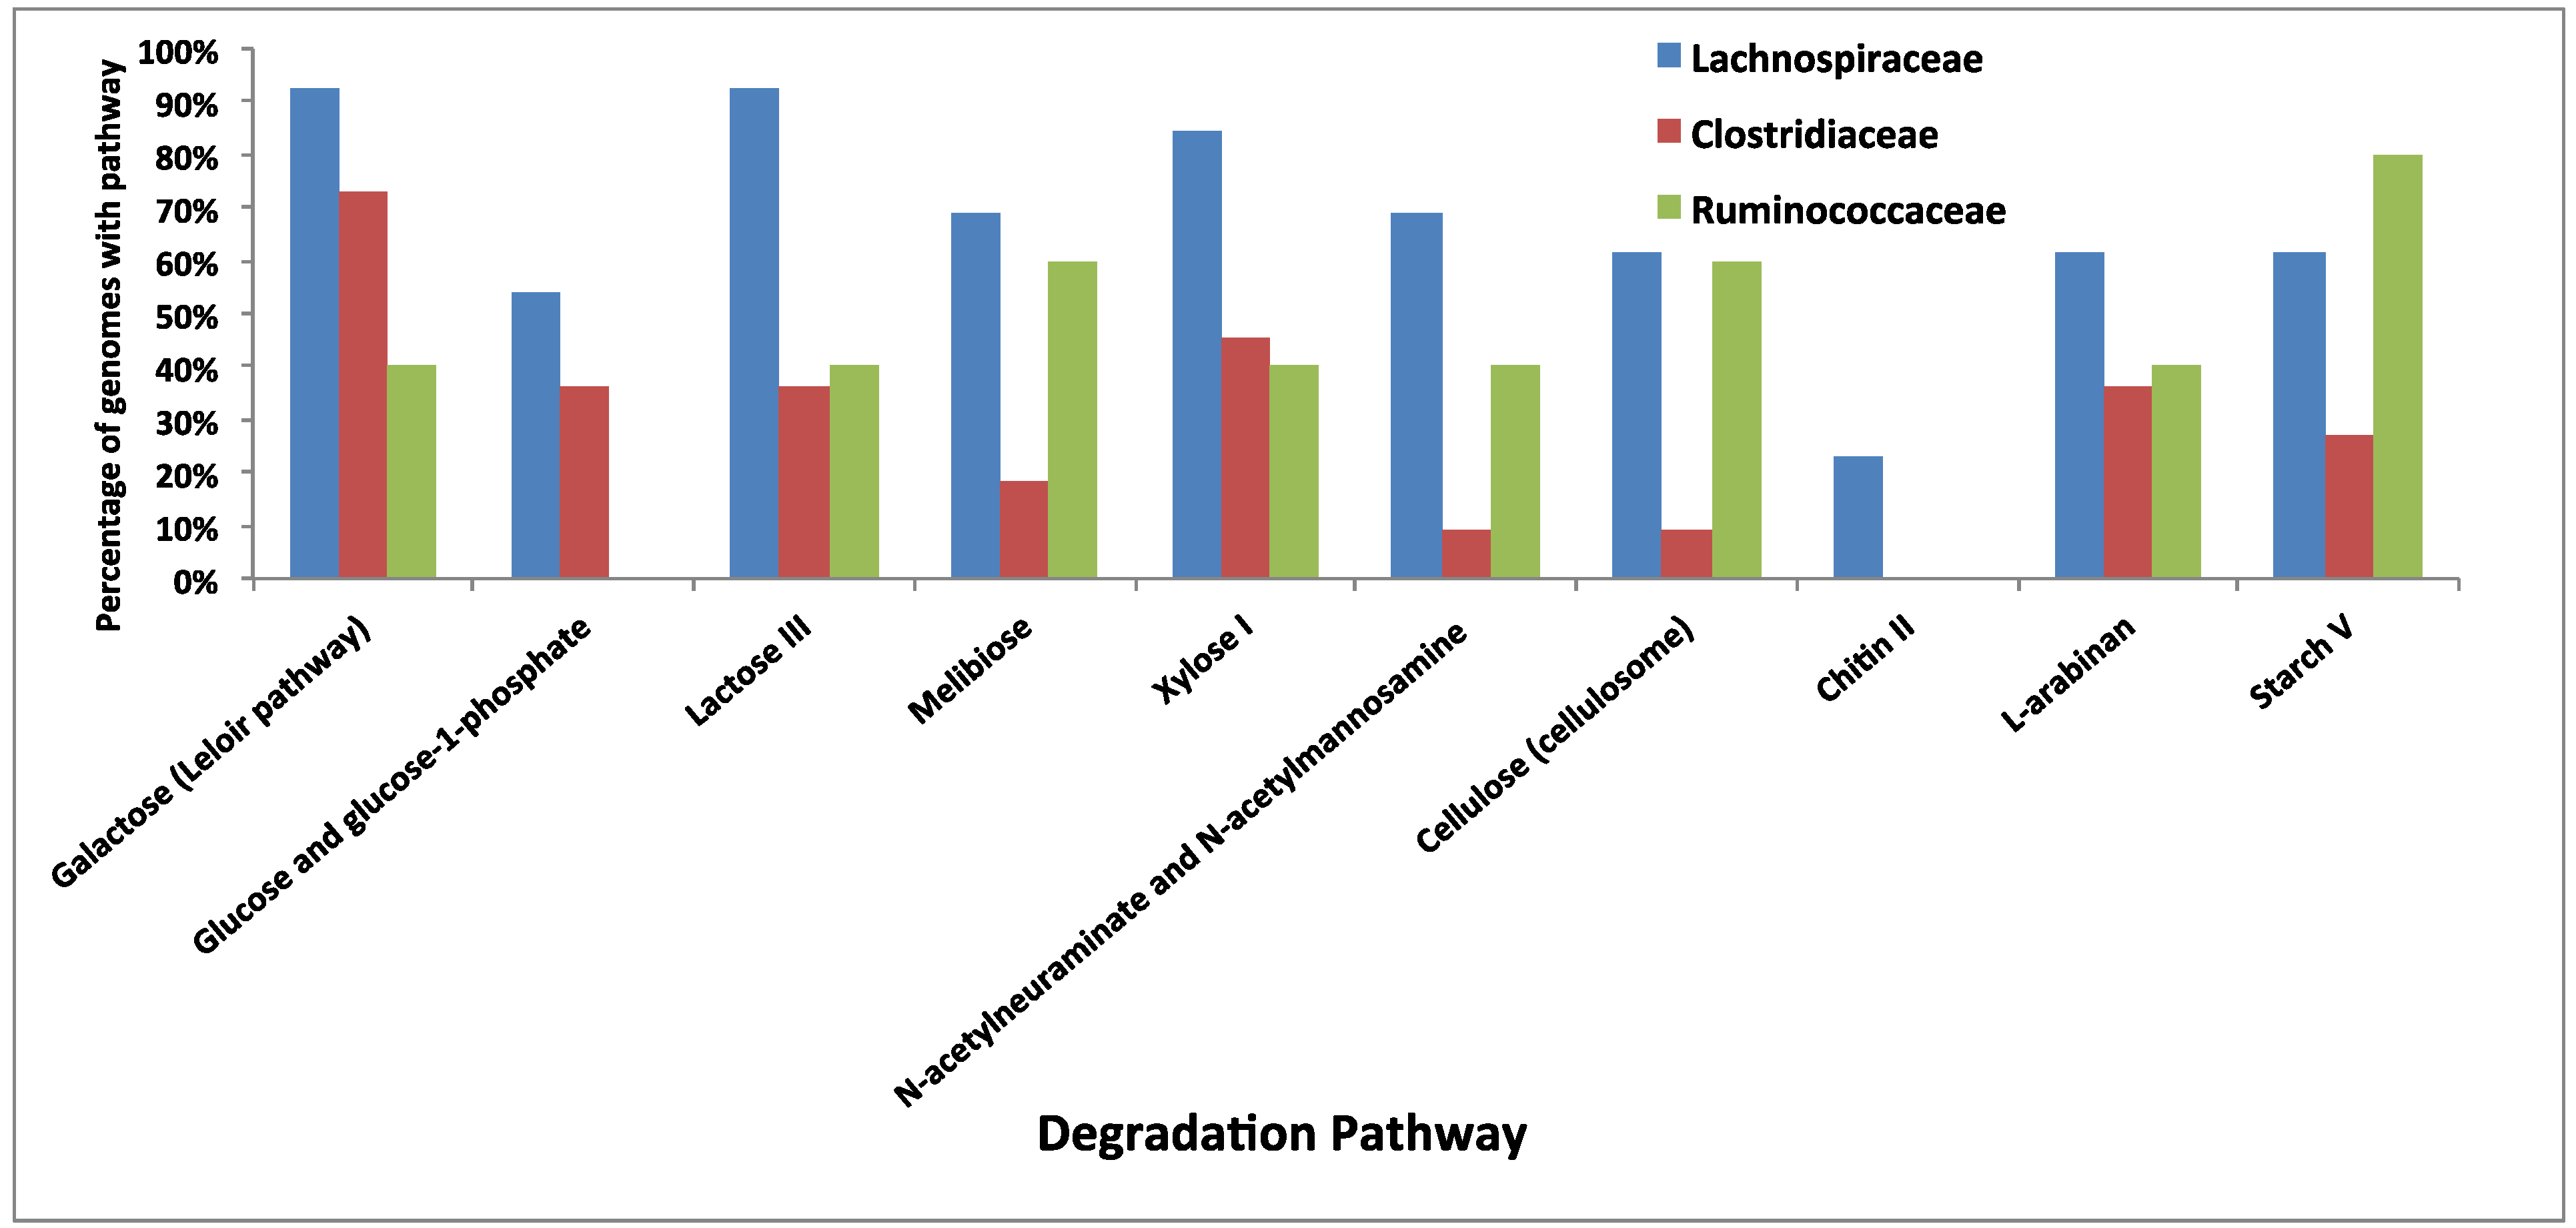
Four metabolic pathways were found to differ in terms of average number of genes between the Lachnospiraceae, Clostridiaceae, and Ruminococcaceae, namely alcohol degradation, carbohydrate degradation, polymeric compound degradation, and generation of precursor metabolites and energy (Figure 9). Considering degradation pathway classes for carbohydrates and polymeric compounds, ten specific pathways were identified as differing between the Lachnospiraceae, Clostridiaceae, and Ruminococcaceae (Figure 10) revealing the capacity to break down a full range of plant-derived substrates including cellulose, hemicellulose, and starch.
Figure 10. Breakdown of Carbohydrate and Polymeric Compound Degradation showing percentages for pathways found to be significantly different between Lachnospiraceae, Clostridiaceae, and Ruminococcaceae (indicated by (*) in Figure 9). Roman numerals reference specific pathway designations in Ecocyc [35].
Diversity 05 00627 g010

4. Conclusions

Genome comparisons of the carbohydrate-active enzymes, transporters, and metabolic pathways of the Lachnospiraceae and Ruminococcaceae in comparison with the Clostridiaceae as described here reveal these groups to be more highly specialized for the degradation of complex plant material.
In gut environments the ability to degrade cellulose and hemicellulose components of plant material enables members of the Lachnospiraceae and Ruminococcaceae to decompose substrates that are indigestible by the host. These compounds are then fermented and converted into short chain fatty acids (mainly acetate, butyrate, and propionate) that can be absorbed and used for energy by the host.

Acknowledgments

This research was supported by U.S. Department of Energy grant DE-FG02-02ER15330 and Cooperative State Research, Extension, Education Service, U.S. Department of Agriculture, Massachusetts Agricultural Experiment Station Project No. MAS00923 to SL, Project No. MAS009582 to JB, and the National Science Foundation Graduate Research Fellowship Program to AB.

Conflict of Interest

The authors declare no conflict of interest.

Supplementary Materials

Supplementary materials can be accessed at: https://www.mdpi.com/1424-2818/5/3/627/s1.

References and Notes

  1. Collins, M.D.; Lawson, P.A.; Willems, A.; Cordoba, J.J.; Fernandez-Garayzabal, J.; Garcia, P.; Cai, J.; Hippe, H.; Farrow, J.A.E. The phylogeny of the genus Clostridium: proposal of five new genera and eleven new species combinations. Int. J. Syst. Bacteriol. 1994, 44, 812–826. [Google Scholar] [CrossRef]
  2. Stackebrandt, E.; Rainey, F.A. Phylogenic relationships. In The Clostridia: Molecular Biology and Pathogenesis; Rood, J.I., McClane, B.A., Songer, J.G., Titball, R.W., Eds.; Academic Press: New York, NY, USA, 1997. [Google Scholar]
  3. Garrity, G.M.; Bell, J.A.; Lilburn, T. The Proteobacteria, Part A, Introductory Essays: The Revised Road Map to the Manual. In Bergey’s Manual® of Systematic Bacteriology; Brenner, D.J., Krieg, N.R., Staley, J.T., Garrity, G.M., Eds.; Springer: New York, NY, USA, 2005. [Google Scholar]
  4. Ludwig, W.; Schleifer, K.-H.; Whitman, W.B. Revised road map to the phylum Firmicutes. In Bergey’s Manual® of Systematic Bacteriology; Vos, P., Garrity, G.M., Jones, D., Krieg, N.R., Ludwig, W., Rainey, F.A., Schleifer, K-H., Whitman, W.B., Eds.; Springer: New York, NY, USA, 2009. [Google Scholar]
  5. De Long, E.F. The microbial ocean from genomes to biomes. Nature 2009, 459, 200–206. [Google Scholar] [CrossRef]
  6. Jalanka-Tuovinen, J.; Salonen, A.; Nikkila, J.; Immonen, O.; Kekkonen, R.; Lahti, L.; Palva, A.; de Vos, W.M. Intestinal Microbiota in Healthy Adults: Temporal Analysis Reveals Individual and Common Core and Relation to Intestinal Symptoms. PLoS One 2011, 6, e23035. [Google Scholar] [CrossRef]
  7. Turnbaugh, P.J.; Hamady, M.; Yatsunenko, T.; Cantarel, B.L.; Duncan, A.; Ley, R.E.; Sogin, M.L.; Jones, W.J.; Roe, B.A.; Affourtit, J.P. A core gut microbiome in obese and lean twins. Nature 2008, 457, 480–484. [Google Scholar]
  8. Peris-Bondia, F.; Latorre, A.; Artacho, A.; Moya, A.; D’Auria, G. The Active Human Gut Microbiota Differs from the Total Microbiota. PLoS One 2011, 6, e22448. [Google Scholar]
  9. Tap, J.; Mondot, S.; Levenez, F.; Pelletier, E.; Caron, C.; Furet, J.; Ugarte, E.; Muñoz-Tamayo, R.; Paslier, D.L.E; Nalin, R. Towards the human intestinal microbiota phylogenetic core. Environ. Microbiol. 2009, 11, 2574–2584. [Google Scholar] [CrossRef]
  10. Barcenilla, A.; Pryde, S.E.; Martin, J.C.; Duncan, S.H.; Stewart, C.S.; Henderson, C.; Flint, H.J. Phylogenetic Relationships of Butyrate-Producing Bacteria from the Human Gut. Appl. Environ. Microbiol. 2000, 66, 1654–1661. [Google Scholar] [CrossRef]
  11. Duncan, S.H.; Barcenilla, A.; Stewart, C.S.; Pryde, S.E.; Flint, H.J. Acetate utilization and butyryl coenzyme A (CoA): acetate-CoA transferase in butyrate-producing bacteria from the human large intestine. Appl. Environ. Microbiol. 2002, 68, 5186–5190. [Google Scholar] [CrossRef]
  12. Frank, D.N.; Amand, A.L.S.; Feldman, R.A.; Boedeker, E.C.; Harpaz, N.; Pace, N.R. Molecular-phylogenetic characterization of microbial community imbalances in human inflammatory bowel diseases. Proc. Natl. Acad. Sci. USA 2007, 104, 13780–13785. [Google Scholar]
  13. Flint, H.J.; Bayer, E.A.; Rincon, M.T.; Lamed, R.; White, B.A. Polysaccharide utilization by gut bacteria: potential for new insights from genomic analysis. Nat. Rev. Microbiol. 2008, 6, 121–131. [Google Scholar] [CrossRef]
  14. Ding, S.-Y.; Rincon, M.T.; Lamed, R.; Martin, J.C.; McCrae, S.I.; Aurilia, V.; Shoham, Y.; Bayer, E.A.; Flint, H.J. Cellulosomal Scaffoldin-Like Proteins from Ruminococcus. flavefaciens. J. Bacteriol. 2001, 183, 1945–1953. [Google Scholar] [CrossRef]
  15. Fujimoto, T.; Imaeda, H.; Takahashi, K.; Kasumi, E.; Bamba, S.; Fujiyama, Y.; Andoh, A. Decreased abundance of Faecalibacterium prausnitzii in the gut microbiota of Crohn’s disease. J. Gastroen. Hepatol. 2013, 28, 613–619. [Google Scholar] [CrossRef]
  16. Leschine, S. Cellulose Degradation in Anaerobic Environments. Annu. Rev. Microbiol. 1995, 49, 399–426. [Google Scholar] [CrossRef]
  17. Lynd, L.R.; Weimer, P.J.; van Zyl, W.H.; Pretorius, I.S. Microbial Cellulose Utilization: Fundamentals and Biotechnology. Microbiol. Mol. Biol. Rev. 2002, 66, 506–577. [Google Scholar] [CrossRef]
  18. Brulc, J.M.; Antonopoulosb, D.A.; Millera, M.E.B.; Wilsona, M.K.; Yannarella, A.C.; Dinsdaled, E.A.; Edwardsd, R.E.; Frankh, E.D.; Emersoni, J.B.; Wacklini, P.; et al. Gene-centric metagenomics of the fiber-adherent bovine rumen microbiome reveals forage specific glycoside hydrolases. Proc. Natl. Acad. Sci. USA 2009, 106, 1948–1953. [Google Scholar] [CrossRef]
  19. Macfarlane, S.; Macfarlane, G.T. Composition and Metabolic Activities of Bacterial Biofilms Colonizing Food Residues in the Human Gut. Appl. Environ. Microbiol. 2006, 72, 6204–6211. [Google Scholar] [CrossRef]
  20. Cameron, E.A.; Maynard, M.A.; Smith, C.J.; Smith, T.J.; Koropatkin, N.M.; Martens, E.C. Multidomain Carbohydrate-binding Proteins Involved in Bacteroides thetaiotaomicron Starch Metabolism. J. Biol. Chem. 2012, 287, 34614–34625. [Google Scholar]
  21. Proctor, L.M. The Human Microbiome Project in 2011 and Beyond. Cell Host Microbe 2011, 10, 287–291. [Google Scholar] [CrossRef]
  22. Cole, J.R. The Ribosomal Database Project (RDP-II): Sequences and tools for high-throughput rRNA analysis. Nucleic Acids Res. 2004, 33, D294–D296. [Google Scholar] [CrossRef]
  23. Edgar, R.C. MUSCLE: multiple sequence alignment with high accuracy and high throughput. Nucleic Acids Res. 2004, 32, 1792–1797. [Google Scholar] [CrossRef]
  24. Tamura, K.; Nei, M. Estimation of the number of nucleotide substitutions in the control region of mitochondrial DNA in humans and chimpanzees. Mol. Biol. Evol. 1993, 10, 512–526. [Google Scholar]
  25. Tamura, K.; Peterson, D.; Peterson, N.; Stecher, G.; Nei, M.; Kumar, S. MEGA5: Molecular Evolutionary Genetics Analysis Using Maximum Likelihood, Evolutionary Distance, and Maximum Parsimony Methods. Mol. Biol. Evol. 2011, 28, 2731–2739. [Google Scholar] [CrossRef]
  26. FigTree. version 1.3.1. Available online: http://tree.bio.ed.ac.uk/software/figtree/ (accessed on 17 May 2013).
  27. Markowitz, V.M.; Chen, I.M.A.; Palaniappan, K.; Chu, K.; Szeto, E.; Gretchkin, Y. IMG: the integrated microbial genomes database and comparative analysis system. Nucleic Acids Res. 2011, 40, D115–D122. [Google Scholar]
  28. Cantarel, B.L.; Coutinho, P.M.; Rancurel, C.; Bernard, T.; Lombard, V.; Henrissat, B. The Carbohydrate-Active EnZymes database (CAZy): an expert resource for Glycogenomics. Nucleic Acids Res. 2009, 37, D233–D238. [Google Scholar] [CrossRef]
  29. R Core Team, R: A Language and Environment for Statistical Computing; R Foundation for Statistical Computing: Vienna, Austria, 2012; Version 2.15.1.
  30. Venables, W.N.; Ripley, B.D. Modern Applied Statistics with S. Available online: http://www.stats.ox.ac.uk/pub/MASS4 (accessed on 17 May 2013).
  31. Shapiro, S.S.; Wilk, M.B. An analysis of variance test for normality (complete samples). Biometrika 1965, 52, 591–611. [Google Scholar]
  32. O’Hara, R.B.; Kotze, D.J. Do not log-transform count data. Methods Ecol. Evol. 2010, 1, 118–122. [Google Scholar] [CrossRef]
  33. The UniProt Consortium. Reorganizing the protein space at the Universal Protein Resource (UniProt). Nucleic Acids Res. 2011, 40, D71–D75. [CrossRef]
  34. Kanehisa, M.; Goto, S.; Sato, Y.; Furumichi, M.; Tanabe, M. KEGG for integration and interpretation of large-scale molecular data sets. Nucleic Acids Res. 2011, 40, D109–D114. [Google Scholar]
  35. Keseler, I.M.; Mackie, A.; Peralta-Gil, M.; Santos-Zavaleta, A.; Gama-Castro, S.; Bonavides-Martinez, C.; Fulcher, C.; Huerta, A.M.; Kothari, A.; Krummenacker, M. EcoCyc: fusing model organism databases with systems biology. Nucleic Acids Res. 2012, 41, D605–D612. [Google Scholar]
  36. Karp, P.D. Expansion of the BioCyc collection of pathway/genome databases to 160 genomes. Nucleic Acids Res. 2005, 33, 6083–6089. [Google Scholar] [CrossRef]
  37. Saier, M.H. Families of transmembrane sugar transport proteins. Mol. Microbiol. 2000, 35, 699–710. [Google Scholar] [CrossRef]
  38. Brückner, R.; Titgemeyer, F. Carbon catabolite repression in bacteria: choice of the carbon source and autoregulatory limitation of sugar utilization. FEMS Microbiol. Lett. 2002, 209, 141–148. [Google Scholar] [CrossRef]
  39. Jojima, T.; Omumasaba, C.A.; Inui, M.; Yukawa, H. Sugar transporters in efficient utilization of mixed sugar substrates: current knowledge and outlook. Appl. Microbiol. Biotechnol. 2009, 85, 471–480. [Google Scholar]
  40. Stülke, J.; Hillen, W. Regulation of carbon catabolism in Bacillus species. Annu. Rev. Microbiol. 2000, 54, 849–880. [Google Scholar] [CrossRef]
  41. Rees, D.C.; Johnson, E.; Lewinson, O. ABC transporters: the power to change. Nat. Rev. Mol. Cell Biol. 2009, 10, 218–227. [Google Scholar] [CrossRef]