Article

Multidimensional Scaling Analysis of Morphological Spike Traits in Local Wheat Genotypes from the Van Lake Basin

1
Department of Plant and Animal Production, Gevas Vocational School, Van Yuzuncu Yil University, 65090 Van, Türkiye
2
Institute of Natural and Applied Sciences, Van Yuzuncu Yil University, 65090 Van, Türkiye
3
Department of Field Crops, Faculty of Agriculture, Van Yuzuncu Yil University, 65090 Van, Türkiye
4
Department of Zootechnics, Biometrics and Genetics Branch, Faculty of Agriculture, Canakkale March 18 University, 17020 Canakkale, Türkiye
5
Department of Life, Health and Environmental Sciences, University of L’Aquila, Via Vetoio, 67100 L’Aquila, Italy
*
Authors to whom correspondence should be addressed.
Diversity 2025, 17(9), 663; https://doi.org/10.3390/d17090663
Submission received: 18 July 2025 / Revised: 14 September 2025 / Accepted: 16 September 2025 / Published: 22 September 2025
(This article belongs to the Special Issue Plant Adaptation and Survival Under Global Environmental Change)

Simple Summary

Wheat is one of the most important crops for both farmers and consumers in Turkey and around the world. Many local wheat varieties, also known as landraces, are still grown by farmers in the Van Lake Basin of Eastern Anatolia. These varieties are the result of centuries of farmer selection and adaptation to the local environment. In this study, we collected 588 wheat samples from 127 farmer fields around the basin and compared them based on simple visible traits such as the length of the spike, number of seeds, color of the glumes and awns, and grain size. By using a method that allows us to group plants based on similarities, we found that most local wheat varieties were similar to each other, but some showed clear differences. This means that the wheat varieties grown by farmers are not all the same but still carry valuable variation. Such diversity is important because it helps wheat adapt to challenges, such as drought, cold, or poor soils. Our findings highlight the cultural and agricultural importance of these landraces and show that they can serve as a valuable source of new traits for breeding improved wheat varieties in the future.

Abstract

Wheat landraces are considered a valuable resource of potential phenotypic variation that could be used in germplasm improvement. Here, we examined 588 local wheat genotypes collected from farmers’ fields at 127 locations around Van Lake Basin and evaluated the morphological diversity and trait associations using Multidimensional Scaling Analysis. Spike and yield traits were measured and scored according to the UPOV and ICARDA phenotypic characterization criteria. Multidimensional Scaling Analysis divided the wheat samples into four main groups based on the number of spikelets (NOS), number of fertile spikelets (NFS), thousand-grain weight (TGW), and number of seeds per spike (NSS) and indicated a strong correlation between NOS and NFS. Furthermore, the analysis revealed that the glume and awn color of most of the genotypes was black, and they were within the locally known Karakılçık group. Only two genotypes were excluded from the Karakılçık group; No. 231 was within the Geverik local wheat group, and genotype No. 579 was found to be Tir. The Hevidik and Kirik groups had the same spike color, but the Hevidik group had spikes similar to compactum wheat, whereas the Kirik group had larger spikes. Finally, genotype No. 57 varied from all other genotypes when all the measured traits were taken into consideration. Overall, the Van Lake Basin landraces combine broad similarity with meaningful phenotypic heterogeneity shaped by local environments and traditional on-farm selection. These findings provide practical cues for conservation efforts and for the use of landraces as valuable resources in future wheat breeding programs.

1. Introduction

Wheat is one of the most cultivated crops in the world and in Turkey. The world’s total production in 2021 was more than 770.8 million tons harvested from 220.7 million hectares, and 17.65 million tons from 6.62 million hectares in Turkey [1]. It is a strategic crop and a critical source of calories and carbohydrates and contains a considerable amount of a range of elements that are crucial for health, such as protein, vitamins (especially B vitamins), dietary fiber, and phytochemicals [2,3]. Wheat is the primary source of food, energy, and protein for 40% of the global population, particularly in Europe, North America, and the western and northern portions of Asia.
Wheat landraces are populations that have developed in subsistence farming communities as a result of “millennia-long,” “artificial” human selection, mediated by human migration, exchanging seeds, and natural selection [4]. Their adaptability to specific agro-climatic conditions while maintaining considerable diversity between and within populations constitutes a reservoir of genetic and phenotypic diversity that is essential for the future of breeding as well as for the development of new agricultural systems and new products [5]. Landraces are gaining popularity due to the loss of phenotypic and genetic diversity caused by the Green Revolution, conventional breeding, and industrial agriculture. As a result, understanding their genetic diversity and preserving it for future generations is critical.
Turkey holds a significant position in terms of plant genetic resources. Since the beginning of the twentieth century, diversity in Turkish wheat has attracted considerable scientific attention. Several researchers conducted early exploration and collection missions to obtain and evaluate local germplasm [6,7]. Two of the gene centers—the Mediterranean and Near East—intersect in present-day Turkey [8]. Bonjean and colleagues emphasized that a large part of this region falls within the Fertile Crescent, which is considered the primary center of wheat origin and diversification [9]. Molecular analyses further support this hypothesis. Heun et al. (1997) identified the Karacadağ region in southeastern Turkey as a likely site for the initial domestication of einkorn wheat [10]. Similarly, Özkan et al. (2011) and Salamini et al. (2002) highlighted the significance of Turkish germplasm in the domestication of emmer wheat through genetic and geographical evidence [11,12]. Archaeobotanical findings also confirm that wheat was cultivated in Anatolia for over 10,000 years before its global spread [13,14].
The Van Lake Basin, located in Eastern Anatolia and near the heart of the Fertile Crescent, harbors considerable genetic diversity in wild and cultivated Triticeae species. Historically, the basin served as an important agricultural hub, especially during the Urartian period. Archaeobotanical excavations at key Urartian sites—such as Ayanis and Yoncatepe—have revealed charred remains of barley, hulled wheats, and free-threshing wheats, indicating a long-standing cereal cultivation tradition in the region [15,16]. These findings suggest that the Van Lake Basin has long been a center for wheat diversity and continues to be a valuable reservoir for genetic resources.
Turkey, as a renowned agricultural country, should sustain and expand its current grain production potential for the benefit of both its people and the global population. However, production is not at the projected level, even though it is self-sufficient in wheat [17]. Global climate change has resulted in a significant decline in wheat productivity, and it is expected that extreme drought scenarios, higher temperatures, and severe disease will have a greater influence on plant production than now. To tackle these challenges, it is necessary to create new cultivars with resistance genes to biotic and abiotic stress. Landraces are frequently more stress-tolerant than current cultivars and constitute an important source of germplasm for meeting the demands of sustainable agriculture in the face of climate change [18,19].
This study represents the first systematic and extensive collection effort targeting local wheat landraces in the Van Lake Basin. Farmers traditionally named the genotypes they cultivated based on spike morphology, assigning names, such as Kirik, Hevidik, Geverik, Karakılçık (Black awn), Tir, and Toptopik. However, field evaluations revealed that several morphological and physiological traits of the populations were not well known to farmers, indicating that traditional naming does not always reflect underlying phenotypic variation. Similar observations have been made in other regions, where farmer-assigned names do not necessarily capture the intra-population genetic or morphological diversity [20]. Until now, there has been no quantitative information available regarding the species composition and morphological variation of wheat landraces grown in the Van Lake Basin. In this study, we provide such data by analyzing a large number of samples and assessing phenotypic diversity and trait associations based on spike and grain morphological characteristics. This approach aligns with prior work on Turkish wheat landraces, which has demonstrated considerable phenotypic and genetic diversity across different agroecological zones [21,22]. The objective of this study was to characterize the phenotypic variation among wheat landraces collected from the Van Lake Basin based on spike and grain morphological traits. Using Multidimensional Scaling (MDS), we aimed to identify major trait associations and to evaluate whether traditional farmer classifications (e.g., Karakılçık, Tir, Hevidik, Kirik) are reflected in morphological groupings. Although landrace studies often emphasize genetic diversity, our work focuses solely on morphological characteristics as indicators of phenotypic diversity. We did not perform genetic analyses in this study but instead concentrated on spike and grain morphological traits to capture phenotypic variation.

2. Materials and Methods

2.1. Plant Sampling and Measurements

In this study, 588 individual wheat spikes were collected from 127 farmer fields (Figure 1) across the Van Lake Basin region (Turkey). Instead, each distinct spike morphology sampled from a given location was considered a separate genotype. The geographical coordinates and altitudes of all sampling sites were recorded and are presented in Supplementary Table S3.
A total of 588 individual spikes representing each population were classified. The spikes were prepared to examine the spike length, total number of spikelets, number of fertile spikelets, ratio of awn to spike at the tip of the spike, spike density, awn color, glume color, glume hairiness in sterile spikelet, grain characteristics (color, shape, size, vitreousness, fullness), number of grains per spike, and thousand-grain weight (Table 1).
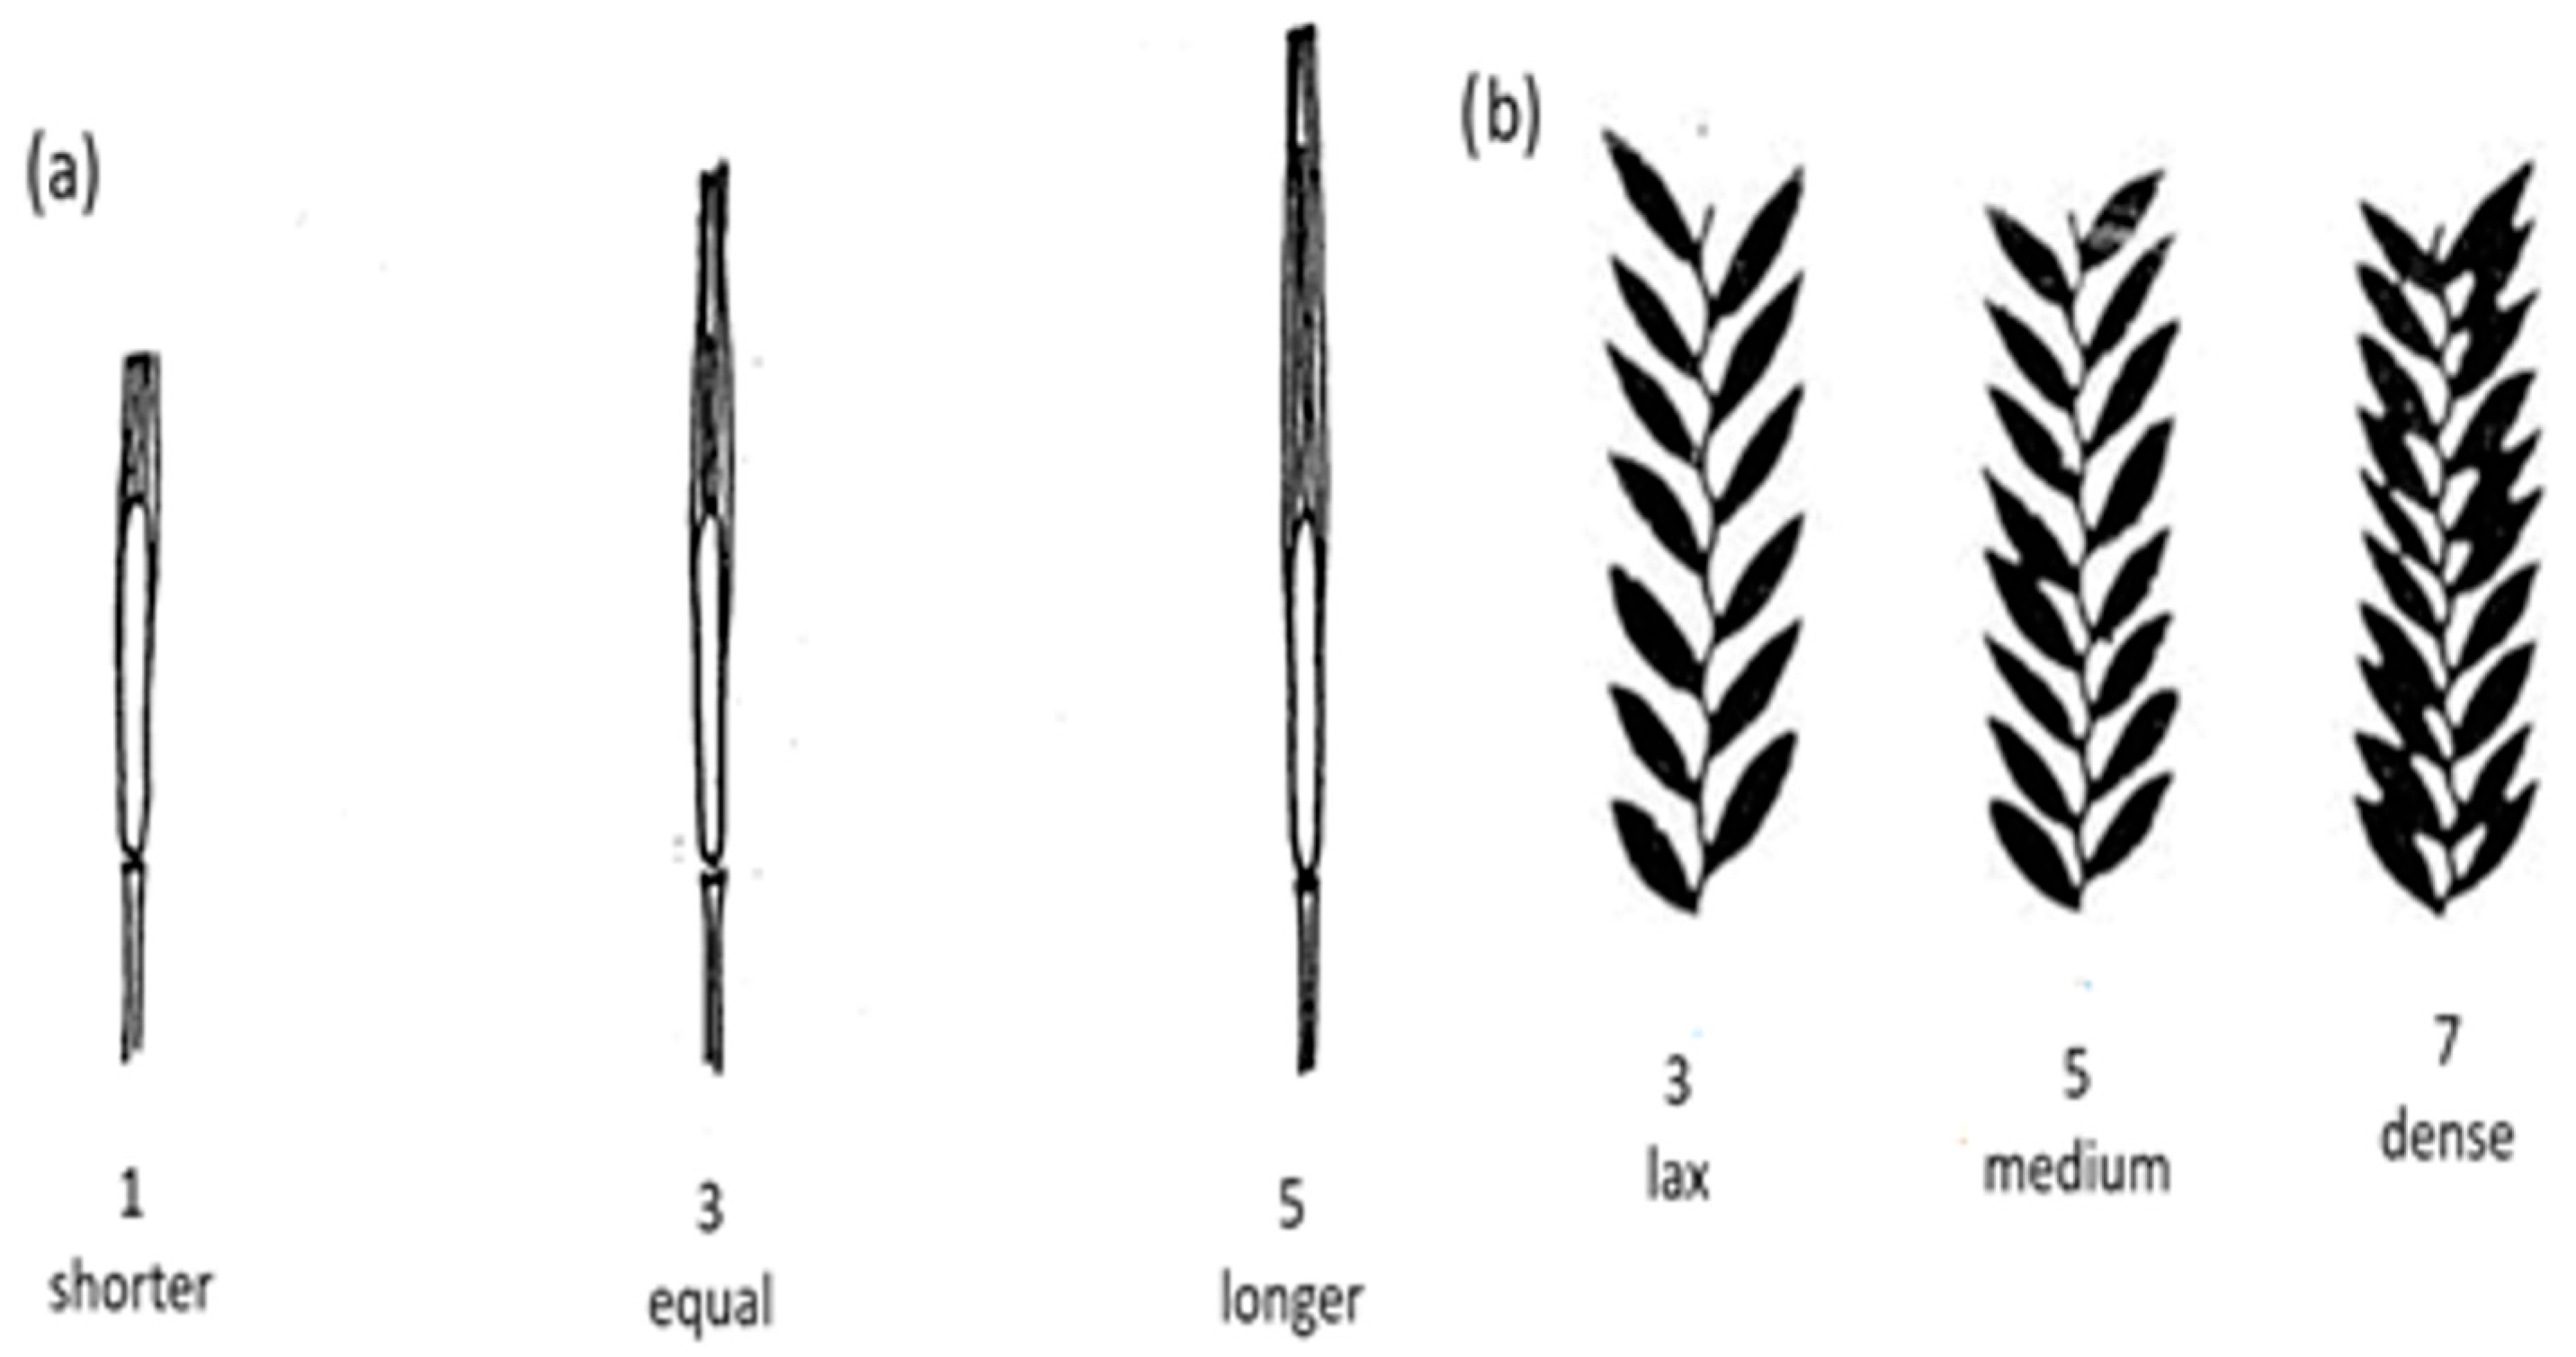
To interpret stress values, the minimal (adequate) number of dimensions was calculated using the Kruskal stress classification table, which delivers fit desired goodness. These parameters were measured and scored according to the UPOV (International Association for Conservation of New Plant Varieties) and ICARDA (International Center for Agricultural Research in the Dry Areas) phenotypic characterization criteria with some modifications [23,24]. Each sample was processed at the Plant Physiology Lab of the Department of Field Crops, Yuzüucu Yıl University, Turkey. The spike length (cm) was measured from the base of the spike at the place of the first spikelet on the rachis until the top of the final spikelet without the awn. The total number of spikelets was determined by counting all spikelets one by one from the base to the tip of the spike. The number of fertile spikelets was calculated by subtracting sterile spikelets from the total number of spikelets per spike. The ratio of awn to spike at the tip of the spike (Figure 2a), spike density (Figure 2b), glume hairiness on sterile spikelet, grain color, shape, size, and fullness were visually measured. All morphological parameters, their abbreviations, and measurement units are summarized in Table 1.
The grain was cut in half, and vitreousness was examined. The spikes were threshed individually to count the number of grains per spike, grain yield per spike, and thousand-grain weight (g). All samples were grouped based on the mentioned measured parameters. Plants were labeled based on the sampling location, the sample number within that location, and the variation observed among collected samples from the same population. For example, ‘Ahlat 2-10’ denotes the 10th plant sampled from the second population collected in the Ahlat region. When available, the local name is reported in brackets after the sample name, e.g., ‘Ahlat 2-10 (Black awn).’

2.2. Statistical Analysis

The scored and measured traits were analyzed using Multidimensional Scaling Analysis (MDS), a graphical technique used to visualize the proximity of objects in a low-dimensional space. In this method, each point represents a scored parameter or variable, and the distance between two points reflects their similarity or dissimilarity. Thus, closely positioned points indicate high similarity, whereas distant points indicate greater differences. MDS has been widely applied in agricultural research to assess trait-based variability and to classify genotypes according to phenotypic similarities [25,26]. In the present study, MDS was performed to investigate the relationships among the spike traits used for characterization and to classify these variables according to their similarities.
Two distinct goodness-of-fit criteria, the coefficient of determination (R2) and the stress coefficient, were used to evaluate the adequacy of the MDS model. To interpret stress values, the minimal (adequate) number of dimensions was determined according to the Kruskal stress classification table, which provides a guideline for model fit [26]. Statistical analyses were conducted using SPSS software (version 27.0) [27] and R statistical software (version 4.1.2) [28,29,30].

3. Results

Table 2 shows the minimal (adequate) number of dimensions, calculated by the Kruskal stress classification table.
The mean values of spike length (cm), number of spikelets, number of fertile spikelets per spike, number of seeds per spike, grain yield per spike (g), and thousand-grain weight (g) of 588 individual plants collected from the 127 wheat landrace samples are given in Table S1. Non-numerical traits, including the ratio of awn to spike at the tip of the spike, spike density, awn color, glume color, glume hairiness in a sterile spikelet, seed color, seed shape, seed size, vitreousness of the grain, and fullness of grain are presented in Table S2. Table 3 and Figure 3 present the descriptive statistics of the plant samples.
The ratio of awn to spike at the tip of the spike frequency of the landraces with an average of awn-less (0), shorter (1), equal (2), and longer (3) was 8.8, 85.7, 1.6, and 3.9, respectively. EAD frequency was 0 for very lax (1), 2.4 for lax (3), 33.0 for medium (5), 48.8 for dense (7), and 15.8 for very dense (9). As described in Table 3, the frequency of the genotypes with an average AWC of was 9.0 for awn-less (0), 15.8 for white (1), 17.3 for light brown (2), 1.9 for brown (3), 7.0 for brown-white (4), 10.2 for white-black (5), 16.7 for brown-black (6), 19.0 for white-purple (7), and 3.1 for purple-brown (8). The GLC frequency was 16.2 for white (1), 18.6 for red-brown (2), 0.2 for purple-black (3), 32.8 for white-purple (4), 7.7 for white-black (5), 7.7 for white-brown (6), 2.6 for red-brown (7), 2.7 for black (8), 3.3 for brown-black (9), 0.5 for brown (10), 6.8 for brown-purple (11), 0.2 for red-black (12), 0.3 for black-purple (13), 0.2 for red-purple (14), and 0.2 for white-red (15). The GLH frequency for smooth hairiness (0), low (3), and high (7) was 80.7, 19.0, and 0.3, respectively. The GRC frequency was 11.7 for white (1), 5.0 for red (2), and 83.3 for amber (3). GRSH frequencies were 17.0, 81.0, and 2.0 for rounded (3), ovoid (5), and elongated (7), respectively. The GRS frequency was 13.3 for small (3), 78.1 for medium (3), 8.3 for large (7), and 0.3 for extra-large (9). The GVI frequency was 31.3 for non-vitreous (3), 47.1 for partially vitreous (5), and 21.6 for vitreous (7). Finally, GRF frequencies were 9.2. 83.8, and 7.0 for plump (3), medium (5), and wrinkled (7), respectively.
The mean SPL of all of the genotypes studied was 8.91 ± 1.79 cm (Table 2). The assessed plant samples showed a large variation in spike length between 3.6 cm in wheat landrace sample Ahlat 6-7 and Muradiye 7-5 (Hevidik) to 15.1 cm in sample Ozalp 22-5 (Tir) (Supplementary Table S1). The NOS ranged from 6 [Mus 6-1 (Tir)] to 23 [Ozalp 11-9 (Black awn). Van 6-1 (Black awn)] with an average of 16.02 ± 3.03. The mean NFS of all of the genotypes studied was 14.30 ± 3.44. The assessed plant samples showed variation in parameters between 5 in wheat landrace samples Mus 10-2 (Geverik), Mus 16-1 (Hevidik), Mus 6-1 (Kirik), Mus 2-3 (Tir), and Mus 8-5 (Tir) to 23 in the sample Van 6-1 (Black awn). The value of NSS ranged from 8 seeds in the samples Van 10-3 (black awn) and Mus 10-3 (Kirik) to 64 seeds in Ozalp 15-3 (Black awn) and Ozalp 22-5 (Tir). with a mean value of 31.97 ± 10.26.
The Multidimensional Scaling Analysis (MDS) technique was performed to determine similar/dissimilar traits and wheat genotypes. The usefulness of the MDS technique for analyzing the relationships among wheat characteristics and detecting comparable and dissimilar varieties was determined using three separate goodness-of-fit criteria: R2 (variance accounted for), stress coefficient, and degeneracy indices [26,31]. R2, Kruskal’s stress coefficient, and degeneracy indices results (0.084, 95.24%, and 0.43, respectively) revealed that the MDS technique was a good choice in evaluating the interested relations. the principal fit indices obtained from the multidimensional scaling (MDS) analysis. The solution reached convergence after 100 iterations. producing a final objective function value of 0.420, which decomposes into a stress component of 0.084 and a penalty component of 2.079. To appraise the adequacy of the low-dimensional configuration, supplementary diagnostics are reported: normalized stress (0.0066), Kruskal’s Stress-I (0.081) and Stress-II (0.398), and Young’s S-Stress-I (0.0828) and S-Stress-II (0.212). According to Kruskal’s classification, Stress-I values below 0.10 and normalized stress below 0.05 indicate a good to excellent fit, confirming that the MDS configuration reliably represents the relationships among traits, despite slightly higher Stress-II values. Collectively, these metrics attest to a satisfactory approximation of the original dissimilarities, with relatively low stress values indicating that the reduced-dimensional representation faithfully preserves the underlying proximity structure [26,32,33].
According to the MDS results presented in Figure 4, the measured wheat spike traits were clustered into four distinct groups. The NOS (number of spikes per plant) and NFS (number of fertile spikelets) were placed in the same group, indicating a strong positive association between these two parameters. Similarly, other traits that appeared in the same cluster reflect mutual relationships or correlations. In contrast, TGW (thousand grain weight) and NSS (number of spikelets per spike) were positioned at distant locations in the plot, clearly separated from the remaining traits. This separation suggests that TGW and NSS are the most discriminative traits for differentiating among genotypes. Besides these, NOS and NFS also contribute to distinguishing genotypes, although many genotypes remain similar with respect to most of the other measured spike traits.
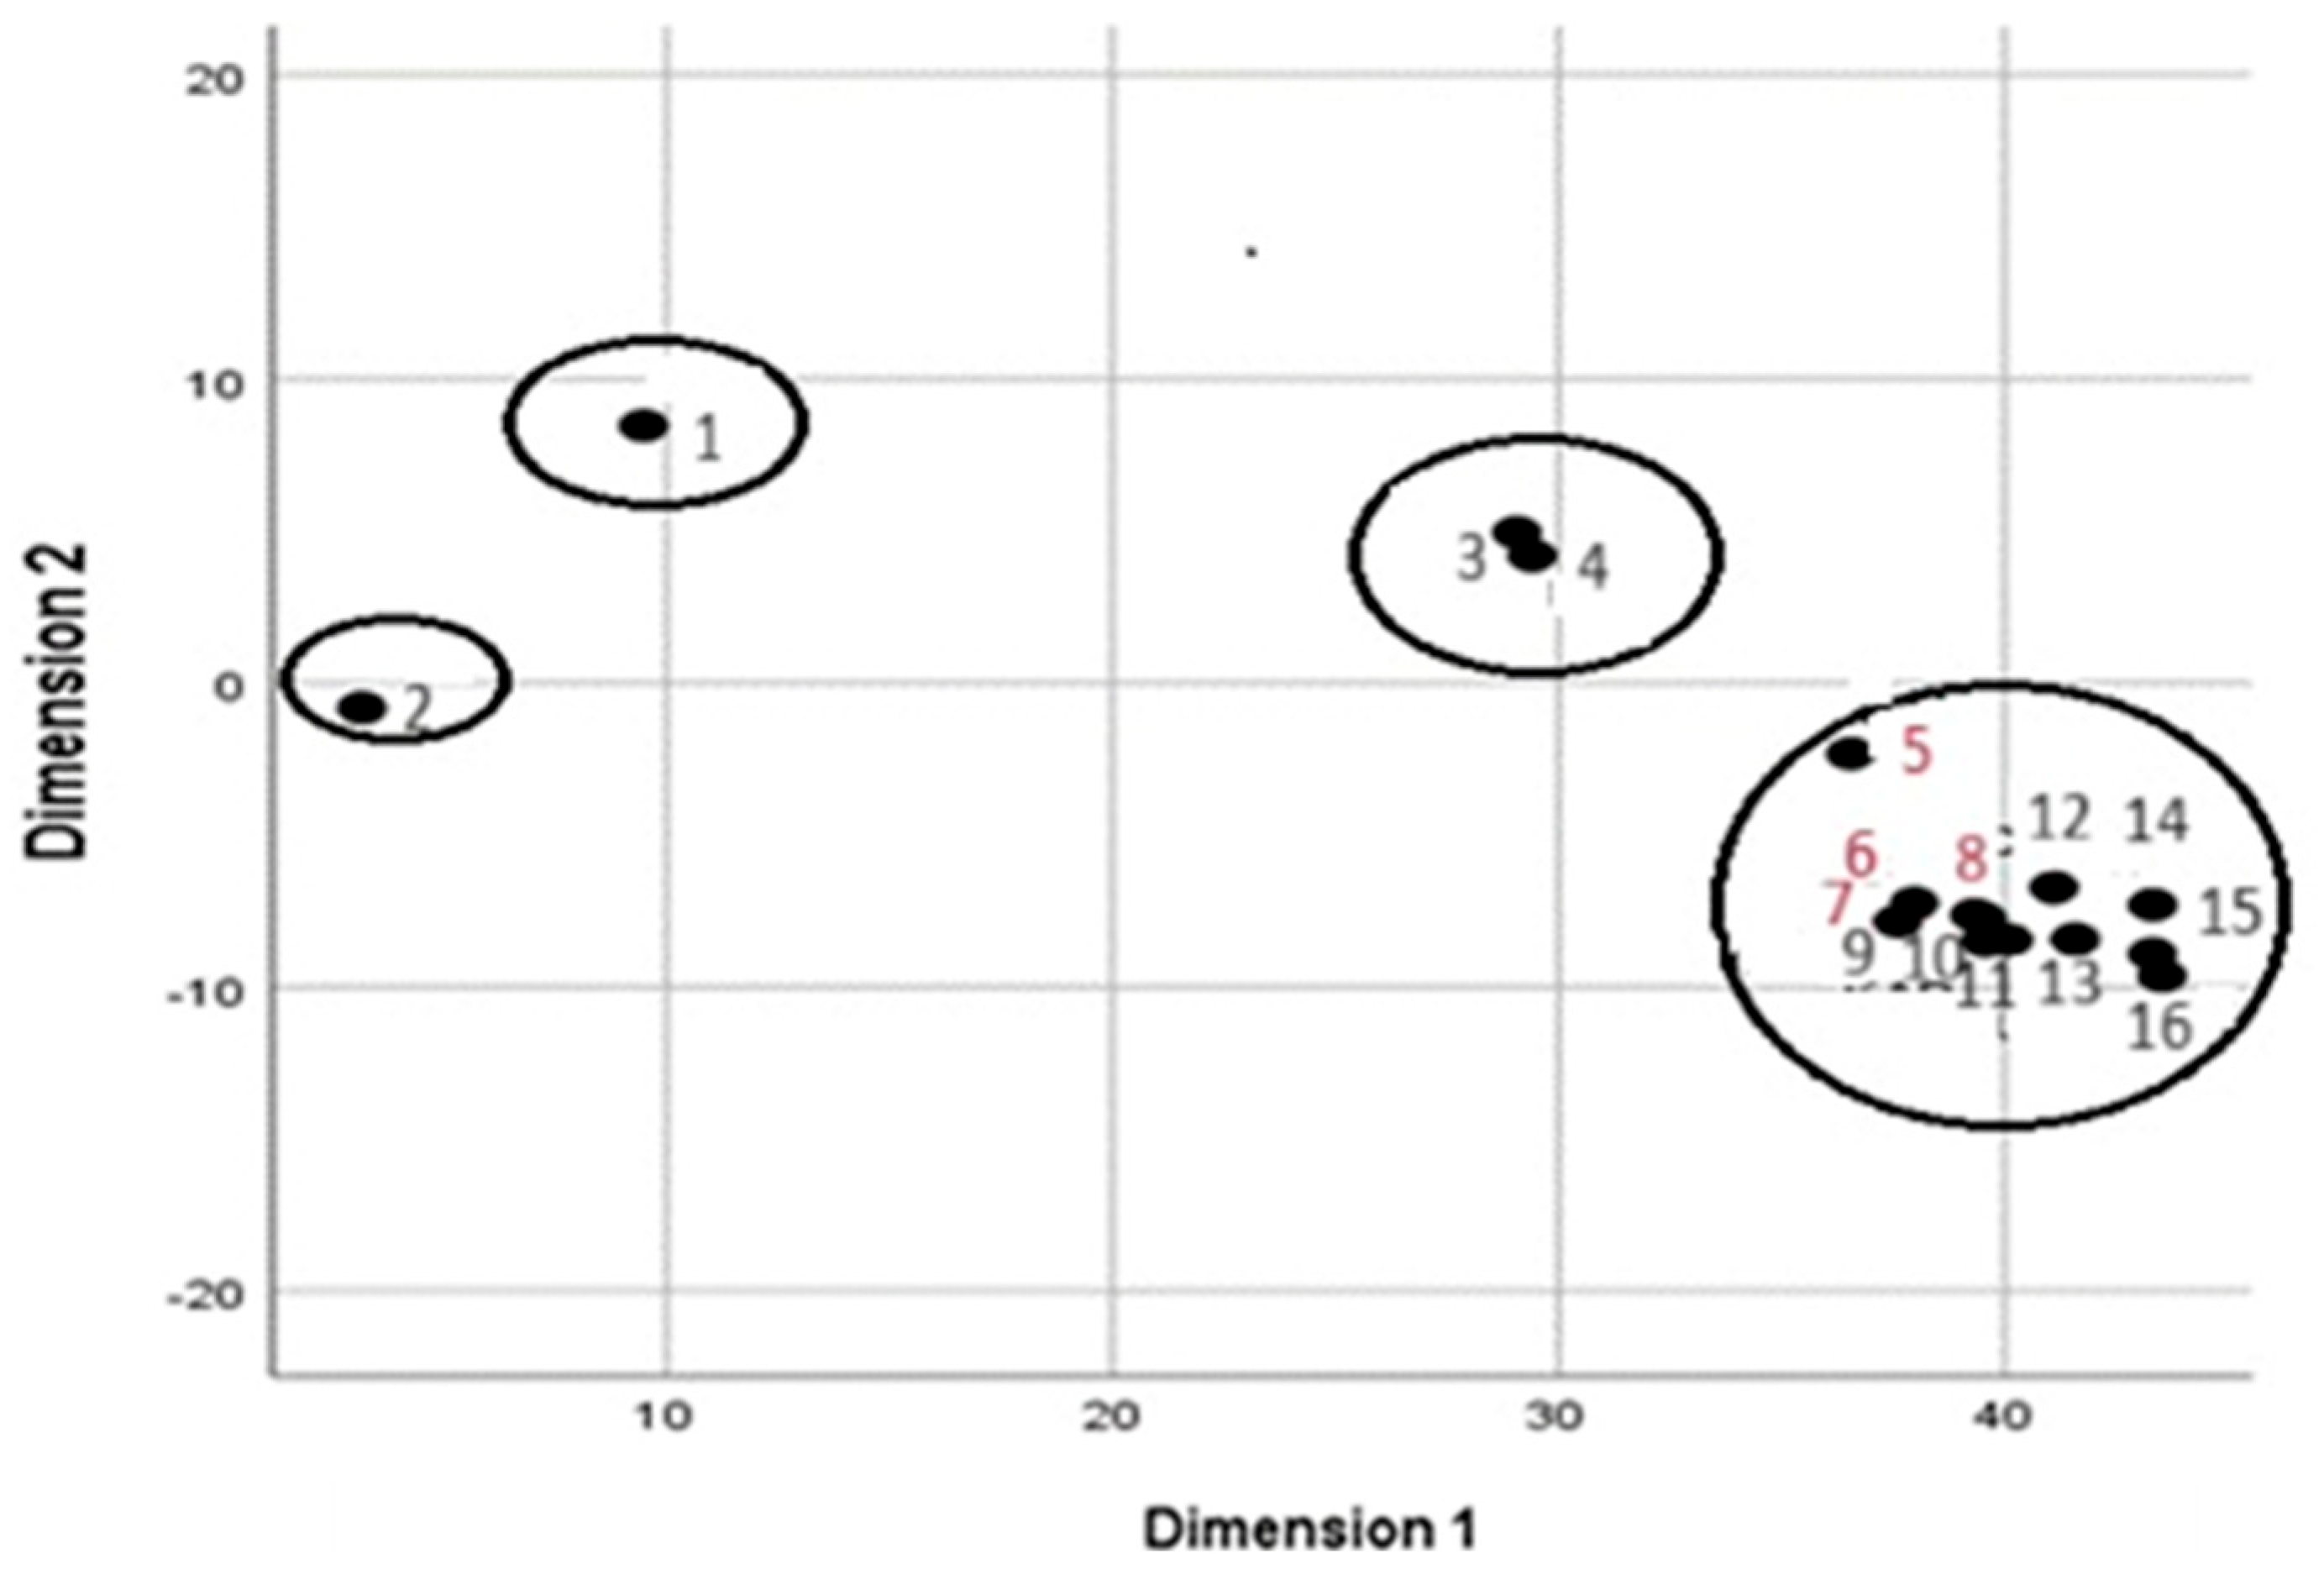
Figure 5 depicts which genotypes are similar and which are distinct when all the measured traits are considered together. As seen in Figure 4, genotype 57 is positioned fairly far away from the other genotypes, indicating that it is distinct from the others. Genotypes 310 and 316, as well as genotypes 579 and 231, were divided into distinct groups, whereas the remaining genotypes formed their own. As a result, genotypes 310 and 316, as well as genotypes 579 and 231, can be considered the most distinct genotypes in comparison to the other genotypes after genotype 57.
Genotypes 57, 310, and 316 are among the “black awn” group, which are locally known as Karakılçık wheat (Black awn) in the region. The majority of the genotypes gathered in the region belonged to the black awn group, which was more varied than other local genotype groups. The MDS analysis revealed that the 57, 310, and 316 genotypes varied in their characteristics compared to the other genotypes, even though they were in the same local group. Furthermore. genotypes 231 and 579 differed from the other genotypes, although they were identical. Two further local wheat groups were detected; genotype No. 231 was inside the Geverik local wheat group, while genotype No. 579 was discovered to be Tir.
Hevidik and Kirik’s local wheat groups revealed similarities, whereas all other groups were dissimilar from one another (Figure 6). The spikes of wheat in the Hevidik group were similar to the compactum wheat and had a dense spike structure, and the glume color was white and red. The Kirik wheat group had larger spikes than the Hevidik group and had a similar white and red glume color. Geverik, Black awn, Tir, and Toptopik local wheat groups differed from one another.

4. Discussion

The Van Lake Basin, where the study was conducted, is a confined basin located in Turkey’s Eastern Anatolia Region. The basin is formed by the streams that flow into Van Lake. So far, Mirza Gokgol completed the most extensive study on indigenous wheat in the basin in the 1930s, in comparison to other locations in Turkey [34]. Researchers and national and international organizations showed less interest in collecting missions and conducting academic studies on the local wheat of the Van Lake Basin. Gokgol reported that the basin is rich in landraces and has some unique varieties [35]. The Karakılçık wheat samples had a black awn and glume, which differed from those in other places. Gokgol also identified a local wheat variety with a long coleoptile, Tir (Triticum aestivum L. ssp vulgare Vill. v. leucospermum Körn), which only exists in the basin [21]. MDS analysis was used to determine which wheat landraces the gathered wheat genotypes belonged to, as well as the differences across local variations. MDS analysis supports the results stated above, and as a result of the MDS analysis, it was observed that the local wheat varieties grown in the basin were divided into different groups.
Throughout Anatolia, wheat landraces have traditionally been named according to their spike morphology. However, field investigations in this study revealed that most farmers in the region commonly refer to various cultivated local wheat forms as Tir wheat. This naming convention is linked to a traditional planting technique known as the Tir sowing method—a region-specific deep-furrow sowing practice that has been passed down through generations [36]. Wheat varieties suited for this method typically possess long coleoptiles, a trait associated with Tir and Karakılçık landraces. Consequently, farmers tend to classify all such adapted varieties under the general label of Tir wheat, regardless of their precise genetic identity.
Over time, on-farm practices, such as field mixing, harvesting and threshing processes, transportation, and storage, have contributed to increasing heterogeneity within landrace populations. The present study indicates that what is locally referred to as Tir wheat is not a single variety but a genetically and morphologically mixed population. This population comprises several distinct local forms, including Tir, Karakılçık (Black awn), Kirik, Hevidik, Geverik, and Toptopik. Interestingly, some of these names—Tir, Karakılçık, Kirik, and Hevidik—also appear in the early wheat collection records documented by Gökgöl (1939), highlighting a continuity between historical classifications and current folk taxonomy [34].
Our observations indicate that local wheat populations in the basin exhibit considerable variation in glume and awn color, traits widely used as taxonomic markers in wheat [23]. Glume pigmentation not only reflects morphological diversity but also correlates with environmental adaptation. For instance, recent studies have demonstrated that glumes exposed to intense solar radiation exhibit enhanced photoprotective capacities, including increased thermal dissipation and sustained photosynthetic efficiency under high light and temperature stress [37]. These results are consistent with previous findings showing that morphological variation in wheat landraces is strongly shaped by environmental conditions. Genotype × environment interactions have been shown to significantly influence grain and spike traits [36,37]. More recent work further confirmed that traits such as thousand-kernel weight, grain yield, and number of productive tillers exhibit significant genotype × environment effects under variable water and nitrogen conditions [38]. Additionally, genetic research has identified specific loci (e.g., Rg genes in hexaploid wheat) responsible for red and dark glume coloration, which are thought to contribute to stress resilience and phenological adjustment [39]. Van Province, situated at a high altitude with above-average solar irradiation, presents ideal conditions for selecting such pigmentation traits [23]. Consequently, the observed variation in glume and awn coloration among local landraces likely reflects adaptive responses to the region’s high solar energy regime. In addition to solar radiation, the Van Lake Basin sampling sites spanned elevations from 1183 to 2179 m a.s.l. (Supplementary Table S3). Elevation gradients are known to influence spike pigmentation and yield-related traits in Turkish wheat landraces [21], and recent surveys confirm that environmental variation across Turkish agro-ecologies strongly shapes landrace phenotypes [22]. Although our single-season dataset does not allow a formal test of isolation-by-distance, it is reasonable to assume that both altitude and geographic separation have partially contributed to the phenotypic divergence observed among accessions. This relationship between glume color and environmental adaptation had also been noted earlier by Börner et al. (2005), who highlighted its role in plant response to radiation and low-temperature conditions [40]. Recent molecular studies (e.g., MYB-based glume color regulation) confirm that glume pigmentation is not only a taxonomic marker but also associated with environmental adaptation, particularly in response to light intensity and temperature. Although their direct effects on phenology remain to be fully understood. some evidence suggests that colored glumes may contribute to improved stress response during early developmental stages [41].
The identification of the genotypes was based on the criteria set by UPOV and ICARDA. These criteria were subjected to MDS analysis to demonstrate correlations between traits and criteria that may stand out in the differentiation of genotypes. Results from MDS analysis reveal that TGW, NSS, NOS, and NFS are positioned differently from all other studied traits. The figures illustrate that TGW and NSS form one group, and NOS and NFS traits are similar to each other and form a group together. It is seen that other measurement and observation criteria are similar to each other. It has been confirmed in many studies that criteria, such as SPL, NFS, sterile spikelets per spike, NSS, and TGW, have a direct and positive relationship with yield. Both hereditary structure and the environment have an impact on the formation of these criteria, which are directly related to productivity. However, in some traits, the effect of heritability may be greater than the environment, while in others, the effect of the environment may be greater than the heritability. For example, many studies have reported that the effect of heritability on spike length is greater than the environment. However, it has been confirmed that the effect of the environment on the formation of TGW, NFS, sterile spikelets per spike, and NSS is greater than hereditary factors. Environmental factors are assumed to be responsible for the fact that these variables form different groups than other traits in the MSD analysis. Furthermore, previous studies on collecting samples from wide areas showed that different climate and soil conditions caused TGW, NSS, NOS, and NFS, which are more affected by the environment, to form different groups [42,43]. These findings suggest that such traits, due to their higher responsiveness to environmental variability, formed distinct clusters in MDS analysis. This observation is supported by Duma et al. (2024), who reported low to moderate heritability for TGW, NSS, NOS, and NFS under drought and low nitrogen stress in wheat, indicating the significant environmental influence on these traits [38]. Although this study provides valuable insights into the phenotypic diversity of local wheat landraces from the Van Lake Basin, certain limitations must be acknowledged. First, the sampling was restricted to 588 spikes from a single geographic region, which may not capture the full extent of variability present across Anatolia or neighboring regions. Second, the assessment focused primarily on spike and grain morphological traits through Multidimensional Scaling (MDS), without incorporating other important physiological, molecular, or agronomic parameters. Third, the study did not include multilocation or multiyear evaluations, thereby limiting the ability to fully assess genotype × environment interactions. Future research should therefore integrate broader sampling strategies, molecular marker analyses, and multi-environment trials to provide a more comprehensive understanding of the adaptive potential and breeding value of these landraces.

5. Conclusions

This study provides a comprehensive assessment of the phenotypic diversity of 588 local wheat genotypes collected from 127 locations in the Van Lake Basin. Multi-dimensional Scaling Analysis (MDS) revealed that while the majority of genotypes shared a high degree of similarity, several distinct individuals and groups were also identified. Traits such as thousand-grain weight (TGW) and number of seeds per spike (NSS) were among the most effective in highlighting these differences, though they were also strongly influenced by environmental conditions. In contrast, spike length (SPL) and number of fertile spikelets (NFS) appeared to be more stable across environments.
These findings indicate that Van Lake Basin landraces are not uniform populations but contain both broad phenotypic similarities and meaningful heterogeneity shaped by centuries of natural selection and traditional farming practices. Traditional names, such as Karakılçık (Black awn), Tir, Geverik, Kirik, Hevidik, and Toptopik, corresponded to recognizable clusters in the MDS plots, confirming local knowledge while also revealing previously undocumented variation. In particular, genotypes 57, 310, and 316 showed clear divergence despite being classified under the same local group, reflecting the complex structure of these landraces. This phenotypic diversity, reflecting long-term farmer selection and local environmental influence to high altitude, drought, and intense solar radiation, constitutes a valuable resource for wheat breeding and underscores the importance of conserving and characterizing this heritage for future food security under climate change.

Supplementary Materials

The following supporting information can be downloaded at: https://www.mdpi.com/article/10.3390/d17090663/s1, Table S1. Average values of quantitative spike and seed traits of local wheat genotypes; Table S2. Qualitative spike and seed traits of local wheat genotypes based on UPOV and ICARDA descriptors; Table S3. Geographic coordinates and elevation data of sampling sites in the Lake Van Basin and surrounding provinces.

Author Contributions

Conceptualization: M.U. and F.A.; methodology: S.J.-S.; software: M.M.; validation: B.Ö., E.O. and S.N.; formal analysis: M.M.; investigation: F.A.; resources: B.Ö., S.J.-S. and E.O.; data curation: M.U.; writing—original draft preparation: B.Ö. and S.J.-S.; writing—review and editing: B.F. and L.P.; visualization: B.F.; supervision: L.P.; project administration: F.A.; funding acquisition: F.A. All authors have read and agreed to the published version of the manuscript.

Funding

This research was funded by Van Yüzüncü Yıl University – Scientific Research Projects Coordination Unit (BAP), grant number Van YYU-SRPD-FBA-2019-8276.

Conflicts of Interest

The authors declare no conflicts of interest.

References

  1. FAO FAOSTAT Statistical Database. Available online: https://www.fao.org/faostat/en/#data/QCL/visualize (accessed on 7 May 2025).
  2. Shewry, P.R.; Hey, S.J. The Contribution of Wheat to Human Diet and Health. Food Energy Secur. 2015, 4, 178–202. [Google Scholar] [CrossRef]
  3. de Sousa, T.; Ribeiro, M.; Sabença, C.; Igrejas, G. The 10,000-Year Success Story of Wheat! Foods 2021, 10, 2124. [Google Scholar] [CrossRef] [PubMed]
  4. Harlan, J.R. Our Vanishing Genetic Resources. Science (1979) 1975, 188, 618–621. [Google Scholar] [CrossRef]
  5. Marone, D.; Russo, M.A.; Mores, A.; Ficco, D.B.M.; Laidò, G.; Mastrangelo, A.M.; Borrelli, G.M. Importance of Landraces in Cereal Breeding for Stress Tolerance. Plants 2021, 10, 1267. [Google Scholar] [CrossRef]
  6. Karagöz, A. Wheat landraces of Turkey. Emir. J. Food Agric. 2014, 26, 149–156. [Google Scholar] [CrossRef]
  7. Harlan, J.R. Collection of Crop Plants in Turkey, 19484. Agron. J. 1950, 42, 258–259. [Google Scholar] [CrossRef]
  8. Miedaner, T.; Garbelotto, M.M. Human-Mediated Migration of Plants, Their Pathogens and Parasites. J. Plant Pathol. 2024, 106, 301–325. [Google Scholar] [CrossRef]
  9. Bonjean, A.P.; Angus, W.J.; Sági, F. The World Wheat Book: A History of Wheat Breeding. Cereal Res. Commun. 2001, 29, 459. [Google Scholar] [CrossRef]
  10. Heun, M.; Schäfer-Pregl, R.; Klawan, D.; Castagna, R.; Accerbi, M.; Borghi, B.; Salamini, F. Site of Einkorn Wheat Domestication Identified by DNA Fingerprinting. Science (1979) 1997, 278, 1312–1314. [Google Scholar] [CrossRef]
  11. Özkan, H.; Willcox, G.; Graner, A.; Salamini, F.; Kilian, B. Geographic Distribution and Domestication of Wild Emmer Wheat (Triticum dicoccoides). Genet. Resour. Crop Evol. 2011, 58, 11–53. [Google Scholar] [CrossRef]
  12. Salamini, F.; Özkan, H.; Brandolini, A.; Schäfer-Pregl, R.; Martin, W. Genetics and Geography of Wild Cereal Domestication in the near East. Nat. Rev. Genet. 2002, 3, 429–441. [Google Scholar] [CrossRef]
  13. Tanno, K.; Willcox, G. How Fast Was Wild Wheat Domesticated? Science (1979) 2006, 311, 1886. [Google Scholar] [CrossRef]
  14. Willcox, G. A Companion to the Archaeology of the Ancient Near East; Potts, D.T., Ed.; Wiley: Hoboken, NJ, USA, 2012; Volume 1, ISBN 9781405189880. [Google Scholar]
  15. Solmaz, T.; Dönmez, E.O. Archaeobotanical Studies at the Urartian Site of Ayanis in Van Province, Eastern Turkey. Turk. J. Bot. 2013, 37, 282–296. [Google Scholar] [CrossRef]
  16. Dönmez, E.O.; Belli, O. Urartian Plant Cultivation at Yoncatepe (Van), Eastern Turkey. Econ. Bot. 2007, 61, 290–298. [Google Scholar] [CrossRef]
  17. Erdoğan, Z.; Selçuk, F.; Akgün, A. Wheat Self-Sufficiency in Turkey: Production and Climate Change in Focus. Yüzüncü Yıl Üniversitesi Tarım Bilimleri Dergisi 2022, 32, 654–670. [Google Scholar] [CrossRef]
  18. Lopes, M.S.; El-Basyoni, I.; Baenziger, P.S.; Singh, S.; Royo, C.; Ozbek, K.; Aktas, H.; Ozer, E.; Ozdemir, F.; Manickavelu, A.; et al. Exploiting Genetic Diversity from Landraces in Wheat Breeding for Adaptation to Climate Change. J. Exp. Bot. 2015, 66, 3477–3486. [Google Scholar] [CrossRef] [PubMed]
  19. Robbana, C.; Kehel, Z.; Ben Naceur, M.; Sansaloni, C.; Bassi, F.; Amri, A. Genome-Wide Genetic Diversity and Population Structure of Tunisian Durum Wheat Landraces Based on DArTseq Technology. Int. J. Mol. Sci. 2019, 20, 1352. [Google Scholar] [CrossRef] [PubMed]
  20. Bernis-Fonteneau, A.; Aakairi, M.; Saadani-Hassani, O.; Castangia, G.; Ait Babahmad, R.; Colangelo, P.; D’Ambrosio, U.; Jarvis, D.I. Farmers’ Variety Naming and Crop Varietal Diversity of Two Cereal and Three Legume Species in the Moroccan High Atlas, Using DATAR. Sustainability 2023, 15, 10411. [Google Scholar] [CrossRef]
  21. Karagöz, A.; Zencirci, N. Variation in Wheat (Triticum Spp.) Landraces from Different Altitudes of Three Regions of Turkey. Genet. Resour. Crop Evol. 2005, 52, 775–785. [Google Scholar] [CrossRef]
  22. Morgounov, A.; Keser, M.; Kan, M.; Küçükçongar, M.; Özdemir, F.; Gummadov, N.; Muminjanov, H.; Zuev, E.; Qualset, C.O. Wheat Landraces Currently Grown in Turkey: Distribution, Diversity, and Use. Crop Sci. 2016, 56, 3112–3124. [Google Scholar] [CrossRef]
  23. UPOV. International Union for the Protection of New Varieties of Plants Wheat UPOV Code(s): TRITI_AES Triticum aestivum L. Emend. Fiori et Paol. Guidelines for the Conduct of Tests for Distinctness, Uniformity and Stability; UPOV: Geneve, Switzerland, 2017. [Google Scholar]
  24. Niane, A.A.; Madarati, A.; Abbas, A.; Turner, M. Manual of Morphological Variety Description for Wheat and Barley with Examples from Syria; International Center for Agricultural Research in the Dry Areas (ICARDA): Beirut, Lebanon, 1999; ISBN 92-9127-089-M. [Google Scholar]
  25. Yiğit, S.; Mendeş, M. Usage of Multidimensional Scaling Technique for Evaluating Performances of Multivariate Normality Tests. Br. J. Appl. Sci. Technol. 2016, 16, 1–8. [Google Scholar] [CrossRef]
  26. Kruskal, J.; Wish, M. Multidimensional Scaling; SAGE Publications, Inc.: Thousand Oaks, CA, USA, 1978; ISBN 9780803909403. [Google Scholar]
  27. IBM Corp. IBM SPSS Statistics for Windows 2022, IBM Corp.: Armonk, NY, USA, 2022.
  28. R Core Team. R: A Language and Environment for Statistical Computing, R Core Team: Vienna, Austria, 2023.
  29. Zhou, H.; Riche, A.B.; Hawkesford, M.J.; Whalley, W.R.; Atkinson, B.S.; Sturrock, C.J.; Mooney, S.J. Determination of Wheat Spike and Spikelet Architecture and Grain Traits Using X-Ray Computed Tomography Imaging. Plant Methods 2021, 17, 26. [Google Scholar] [CrossRef]
  30. Vermeesch, P.; Lipp, A.G.; Hatzenbühler, D.; Caracciolo, L.; Chew, D. Multidimensional Scaling of Varietal Data in Sedimentary Provenance Analysis. J. Geophys. Res. Earth Surf. 2023, 128, e2022JF006992. [Google Scholar] [CrossRef]
  31. Başpınar, E. İki Yönlü Tablolarda Uyum Analizi Tekniğinin Kullanımı. Tarım Bilim. Derg. 2000, 6, 98–106. [Google Scholar] [CrossRef]
  32. Kruskal, J.B. Nonmetric Multidimensional Scaling: A Numerical Method. Psychometrika 1964, 29, 115–129. [Google Scholar] [CrossRef]
  33. Borg, I.; Groenen, P.J. Modern Multidimensional Scaling; Springer Series in Statistics; Springer: New York, NY, USA, 2005; ISBN 978-0-387-25150-9. [Google Scholar]
  34. Gökgöl, M. Turkish Wheats, Vol. II. Yeşilköy Seed Breeding Institute Publications No.14; Tan Press: Istanbul, Turkey, 1939; Volume 2. [Google Scholar]
  35. Gökgöl, M. Turkish Wheats, Vol. I. Yesilkoy Seed Breeding Institute Publications No. 7; Devlet Press: Instanbul, Turkey, 1935. [Google Scholar]
  36. Yılmaz, N.; Akyürek, A. The “Tir” Seeding Method and Its Application in the Van Region. Yuz. Yıl Univ. J. Agric. Sci. 2016, 1, 170–181. [Google Scholar]
  37. Kong, L.; Sun, M.; Xie, Y.; Wang, F.; Zhao, Z. Photochemical and Antioxidative Responses of the Glume and Flag Leaf to Seasonal Senescence in Wheat. Front. Plant Sci. 2015, 6, 358. [Google Scholar] [CrossRef]
  38. Duma, S.W.; Shimelis, H.; Tesfamariam, S.A.; Tsilo, T.J. Genetic Parameters and Trait Associations in Wheat Under Drought and Low Nitrogen Conditions. Nitrogen 2024, 5, 1196–1214. [Google Scholar] [CrossRef]
  39. Wang, J.; Luo, M.C.; Chen, Z.; You, F.M.; Wei, Y.; Zheng, Y.; Dvorak, J. Aegilops tauschii Single Nucleotide Polymorphisms Shed Light on the Origins of Wheat D-Genome Genetic Diversity and Pinpoint the Geographic Origin of Hexaploid Wheat. New Phytol. 2013, 198, 925–937. [Google Scholar] [CrossRef]
  40. Börner, A.; Schäfer, M.; Schmidt, A.; Grau, M.; Vorwald, J. Associations between Geographical Origin and Morphological Characters in Bread Wheat (Triticum aestivum L.). Plant Genet. Resour. 2005, 3, 360–372. [Google Scholar] [CrossRef]
  41. Mao, W.; Wang, X.; Chen, Y.; Wang, Y.; Ma, L.; Xie, X.; Wu, X.; Xu, J.; Zhang, Y.; Zhao, Y.; et al. Map-Based Cloning and Characterization Reveal That an R2R3 MYB Gene Confers Red Glume in Wheat. Crop J. 2024, 13, 887–899. [Google Scholar] [CrossRef]
  42. Kaya, Y.; Akcura, M. Effects of Genotype and Environment on Grain Yield and Quality Traits in Bread Wheat (T. aestivum L.). Food Sci. Technol. (Camp.) 2014, 34, 386–393. [Google Scholar] [CrossRef]
  43. Lullien-Pellerin, V. Both Genetic and Environmental Conditions Affect Wheat Grain Texture: Consequences for Grain Fractionation and Flour Properties. J. Cereal Sci. 2020, 92, 102917. [Google Scholar] [CrossRef]
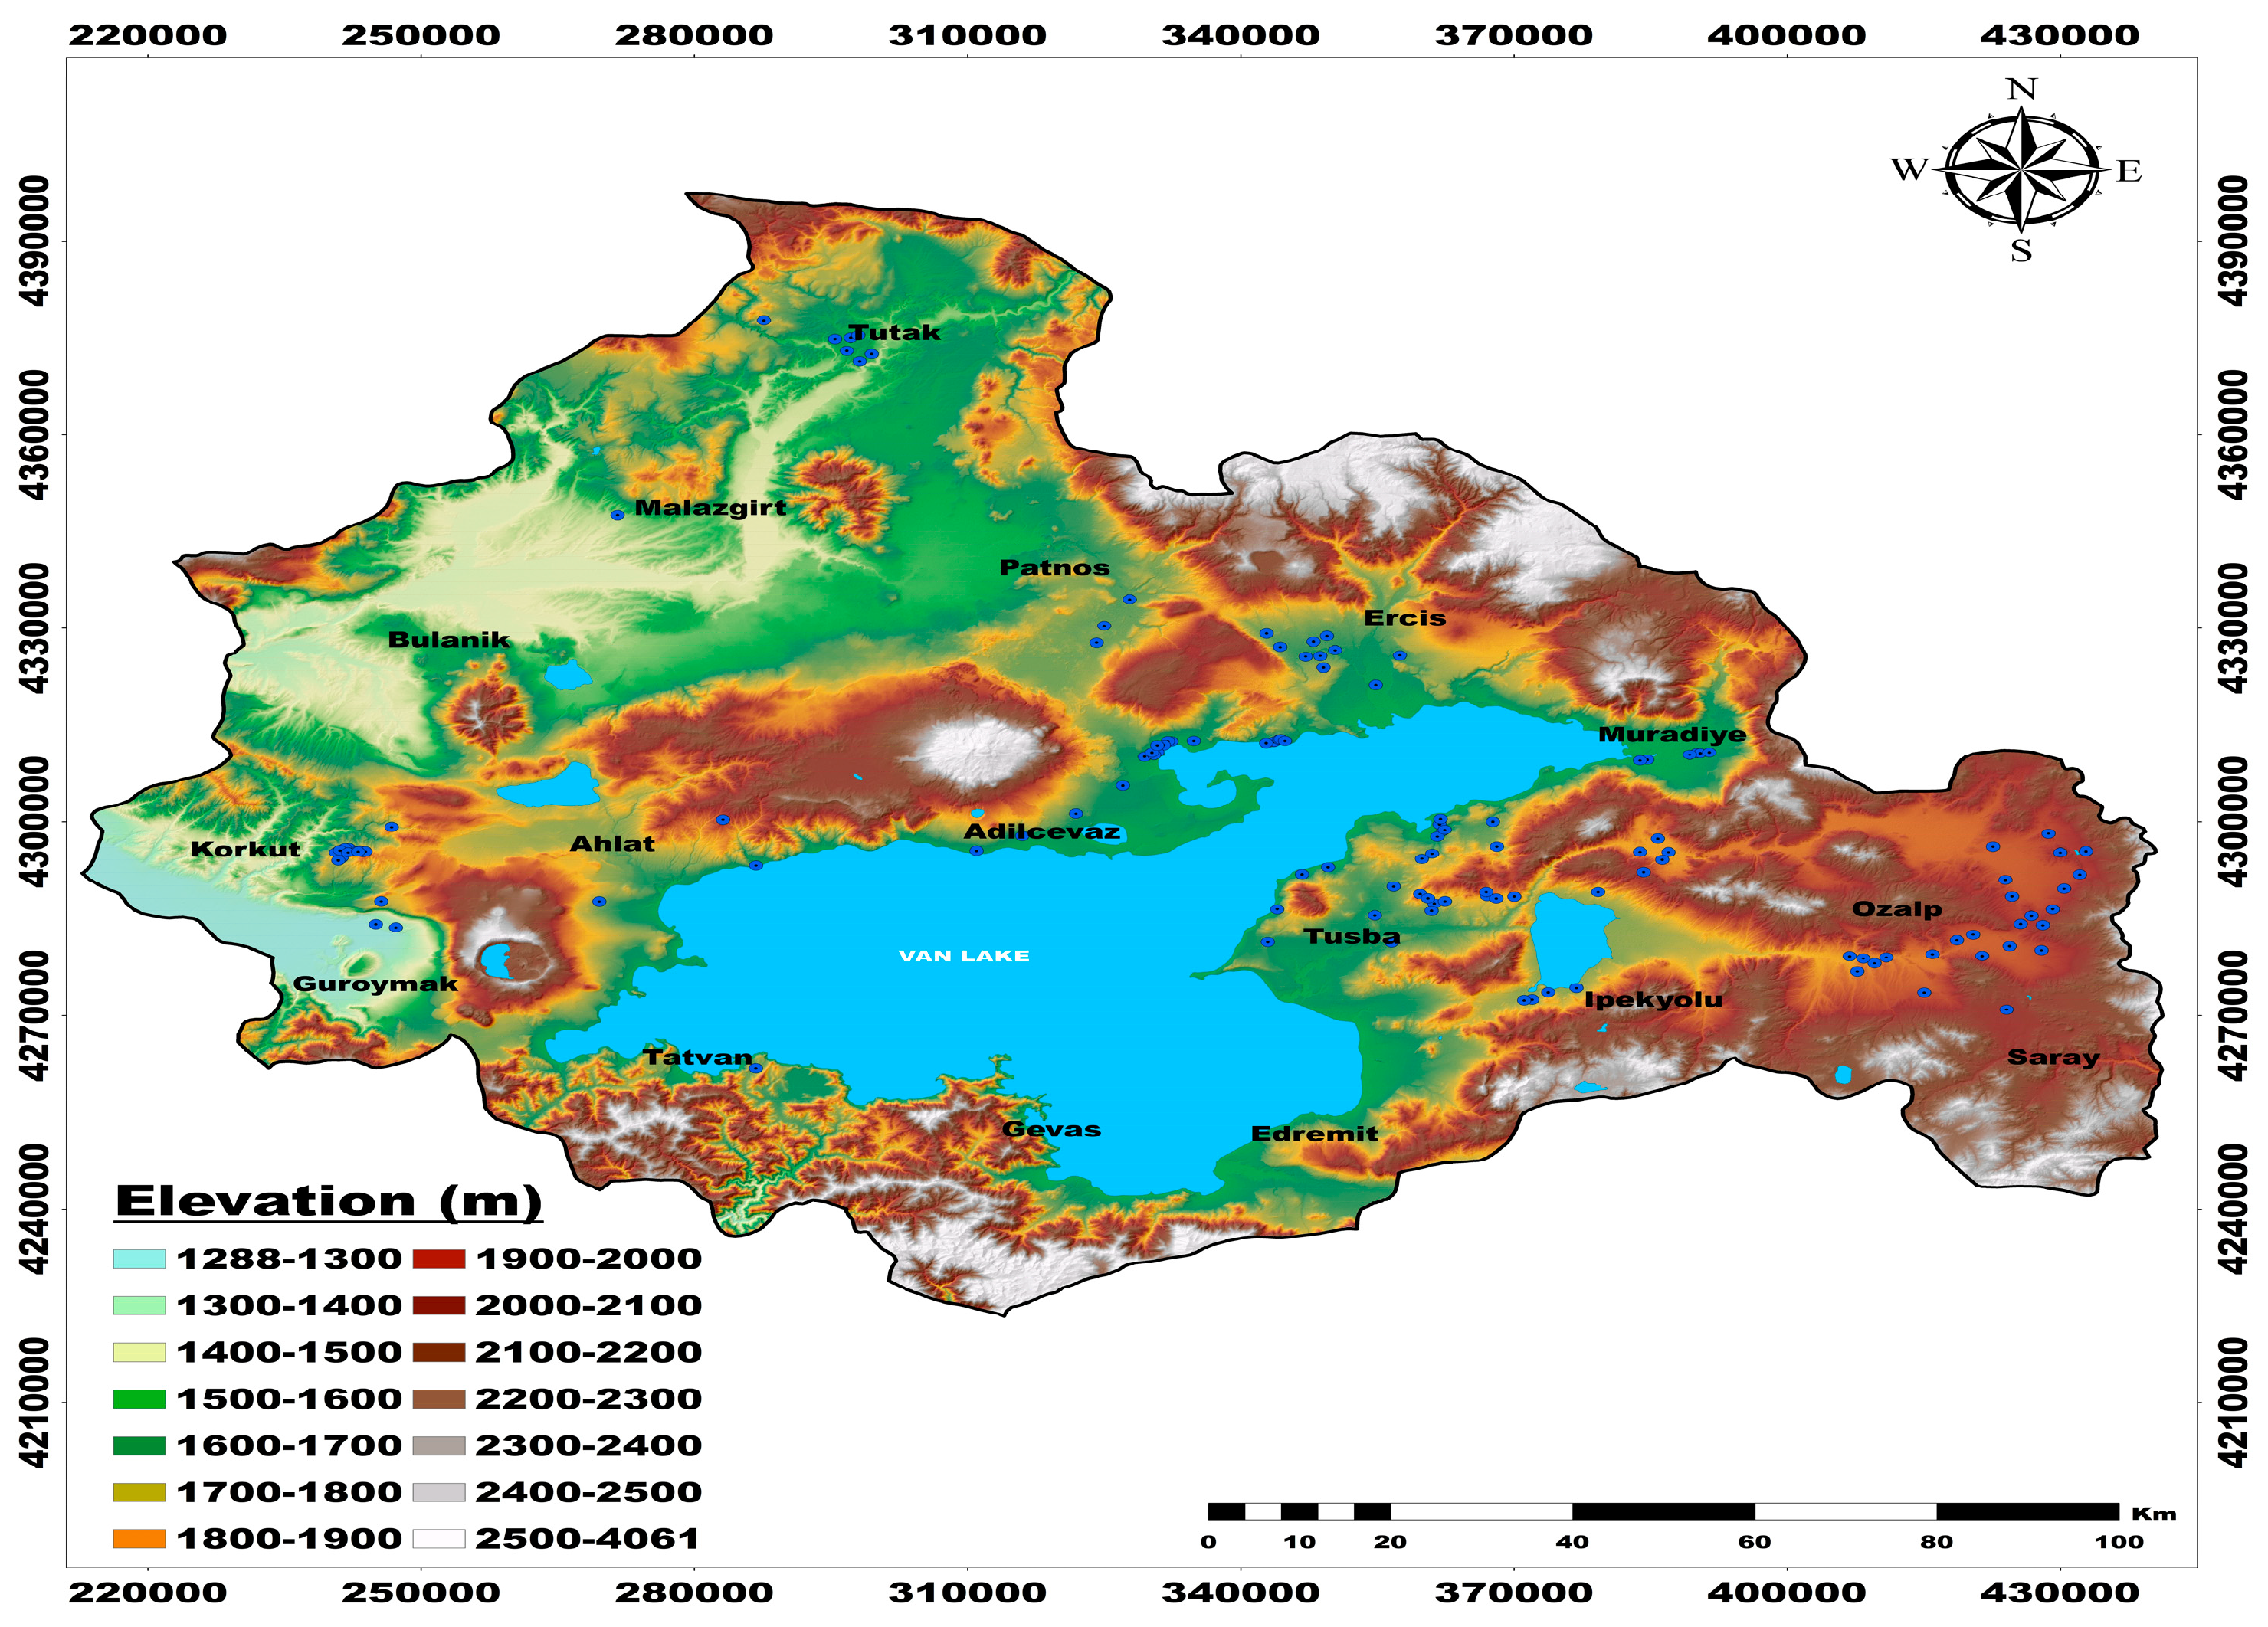
Figure 1. Elevation map of the Lake Van Basin showing that the genotype collection area is mostly between 1700 and 2100 m.
Diversity 17 00663 g001
Figure 2. Assessing the ratio of awn to spike at the tip (a) and spike density (b).
Diversity 17 00663 g002
Figure 3. Frequency distributions of selected spike and grain traits among 588 wheat landraces from the Van Lake Basin. (a) Awn color (AWC); (b) glume color (GLC); and (c) glume shoulder form (GRS). These graphical summaries complement Table 3 and provide a clearer visualization of major morphological differences.
Diversity 17 00663 g003
Figure 4. Multidimensional Scaling (MDS) plot showing the relationships among measured spike traits of 588 local wheat genotypes. Each number corresponds to a spike trait (e.g., 1 = NSS, 2 = TGW, etc.; see Table 1). Traits located closer together indicate stronger similarity, whereas those positioned further apart highlight greater differentiation.
Diversity 17 00663 g004
Figure 5. Multidimensional Scaling (MDS) plot of 588 local wheat genotypes based on all measured spike traits. Each number represents a genotype ID, and circles indicate clusters of genotypes with similar trait profiles. Dimension 1 and Dimension 2 account for the relative distances among genotypes, where closer positions denote higher similarity and distant points indicate stronger dissimilarity.
Diversity 17 00663 g005
Figure 6. Multidimensional Scaling (MDS) plot illustrating the similarities and differences among six distinct local wheat landraces. Each point corresponds to a landrace traditionally known in the region by the following local names: 1 = Geverik, 2 = Hevidik, 3 = Karakılçık, 4 = Kirik, 5 = Tir, and 6 = Toptopik. The relative distances on Dimension 1 and Dimension 2 axes indicate phenotypic similarities, with closer positions reflecting greater resemblance in spike traits, while more distant positions highlight stronger differentiation.
Diversity 17 00663 g006
Table 1. Definitions and descriptions of the evaluated traits.
CharacteristicsAbbreviationsClassification and scoring
Ratio of awn to spike at the tip of the spikeASR0: awn-less 1: shorter 2: equal 3: longer
Spike densityEAD 1: very lax 3: lax 5: medium 7: dense 9: very dense
Awn colorAWC0: awn-less 1: white 2: light brown 3: brown 4: brown-white 5: white-black 6: brown-black 7: white-purple 8: purple-brown
Glume colorGLC 1: white 2: red-brown 3: purple-black 4: white-purple 5: white-black 6: white-brown 7: red-brown 8: black 9: brown-black 10: brown 11: brown-purple 12: red-black 13: black-purple 14: red-purple 15: white-red
Glume hairiness in sterile spikeletGLH 0: smooth 3: low 7: high
Grain colorGRC 1: white 2: red 3: amber
Grain shapeGRSH 3: rounded 5: ovoid 7: elongated
Grain sizeGRS 3: small 5: medium 7: large 9: very large
Vitreousness of grainGVI 3: non-vitreous 5: partially vitreous 7: vitreous
Fullness of grain GRF 3: plump 5: medium 7: wrinkled
Spike length (cm)SPL
Number of spikeletsNOS
Number of fertile spikelets spike-1NFS
Number of seeds spike-1NSS
Grain yield spike-1 (g)GRY
Thousand-grain weight (g)TGW
Qualitative traits were scored according to UPOV and ICARDA guidelines on a 1–9 scale, where 1 = very low/absent and 9 = very high/intense. Traits include awn-to-spike ratio at the tip of the spike, ear density, awn color, glume color, glume hairiness in sterile spikelet, seed color, seed shape, seed size, vitreousness of grain, and fullness of grain.
Table 2. Descriptive statistics for wheat landrace samples’ quantitative traits.
ParameternMeanStd. Error of the MeanMinMaxSkewnessKurtosis
Spike length (SPL)5888.911.793.6015.10−0.330.39
Number of spikelets (NOS)58816.023.036.0023.00−0.27−0.34
Number of fertile spikelets per spike (NFS)58814.303.445.0023.00−0.16−0.30
Number of seeds per spike (NSS)58831.9710.268.0064.000.30−0.10
Grain yield per spike (GRY)5881.470.610.303.550.580.04
Thousand-grain weight (TGW)58845.298.5822.1468.08−0.15−0.54
Abbreviations are defined in Table 1. Quantitative traits are presented here with descriptive statistics.
Table 3. Frequency (%) of sensory characteristics by corresponding classification codes.
0123456789101112131415
Ratio of awn to spike at the tip (ASR)8.885.71.63.9
Spike density (EAD) 0.0 2.4 33.0 48.8 15.8
Awn color
(AWC)
9.015.817.31.97.010.216.719.03.1
Glume color (GLC) 16.218.60.232.87.77.72.62.73.30.56.80.20.30.20.2
Glume hairiness (GLH)81.3 18.2 0.5
Glume shape (GRC) 11.75.083.3
Glume shoulder shape (GRSH) 17.0 81.0 2.0
Glume shoulder form (GRS) 13.3 78.1 8.3 0.3
Glume beak shape (GVI) 31.3 47.1 21.6
Grain form (GRF) 9.2 83.8 7.0
Abbreviations correspond to trait definitions provided in Table 1. Numeric class codes represent trait-specific categories, which differ by trait (e.g., ASR: 0 = awn-less, 1 = shorter, 2 = equal, 3 = longer; AWC: 0 = awn-less, 1 = white, 2 = light brown, etc.). Quantitative traits (SPL, NOS, NFS, NSS, GRY, TGW) are reported separately in Table 2 as descriptive statistics, while Table 3 presents the frequency distribution of categorical traits.
Disclaimer/Publisher’s Note: The statements, opinions and data contained in all publications are solely those of the individual author(s) and contributor(s) and not of MDPI and/or the editor(s). MDPI and/or the editor(s) disclaim responsibility for any injury to people or property resulting from any ideas, methods, instructions or products referred to in the content.