Article

Spatial and Seasonal Variations in Invertebrate Communities in the Chai River Based on eDNA Biomonitoring

1
School of Agronomy and Life Sciences, Kunming University, Kunming 650214, China
2
Kunming Dianchi Lake Environmental Protection Collaborative Research Center, Kunming University, Kunming 650214, China
3
Great Lakes Institute for Environmental Research, University of Windsor, Windsor, ON N9B 3P4, Canada
*
Author to whom correspondence should be addressed.
These authors contributed equally to this work.
Diversity 2025, 17(9), 660; https://doi.org/10.3390/d17090660
Submission received: 23 July 2025 / Revised: 15 September 2025 / Accepted: 15 September 2025 / Published: 20 September 2025
(This article belongs to the Section Animal Diversity)

Abstract

As environmental indicators, invertebrate communities are closely related to changes in the water environment. Efficient and accurate monitoring of invertebrates is of great significance for providing references for water environment conservation. However, environmental DNA metabarcoding has rarely been used in invertebrate research at the Chai River in Kunming, Yunnan, China, and the current characteristics of invertebrate communities are unclear. Therefore, this study investigated the spatial and seasonal patterns of invertebrates and the environmental stressors of the Chai River. Based on eDNA metabarcoding, 873 ASVs of invertebrates belonging to Annelida, Arthropoda, Cnidaria, Gastrotricha, Mollusca, Nematoda, Platyhelminthes, Protozoa, and Rotifera were identified, with Arthropoda being the absolute dominant phylum. Distinct spatial and seasonal variations in the invertebrate communities (e.g., ASV number, dominant genera, relative abundances) were observed. Macrothrix and Acanthamoeba were the first and second most dominant genera, both in dry and wet periods. A spatial–seasonal heterogeneity of the relation between the invertebrate communities and environmental factors was observed in the Chai River. The water temperature (WT), chemical oxygen demand (COD), conductivity (C), and Chlorophyll-a (Chl-a) levels were deemed to be the crucial environmental factors influencing the distributions of invertebrate communities in the Chai River, which was consistent with the spatial and seasonal differences in pollution characteristics around the Chai River. This study provides insights into conserving the diversity of invertebrate communities and the management of the Chai River and similar agricultural rivers.

1. Introduction

Constituting a vital component of the Earth’s ecosystem, the freshwater ecosystem plays a crucial role in human production and daily life. However, with the rapid increase in global population and social development, the escalating issue of global water pollution has become increasingly severe, posing significant threats to aquatic biodiversity and ecosystem functionality and even jeopardizing the water security of residents and human health [1,2,3]. The life index of freshwater ecosystems has declined by about 84% since the 1970s, and the water ecosystem’s functionality is progressively deteriorating. The life index refers to “The Living Planet Index” from “The Living Planet Report”, which tracked almost 21,000 populations of more than 4000 vertebrate species in freshwater habitats and the trends in global wildlife abundance [4]. As an important indicator for measuring the ecological environment, biodiversity has been extensively employed to investigate and evaluate the impact of global climate change, water pollution, habitat destruction, alien biological invasion, and other environmental pressures on aquatic ecosystems resulting from anthropogenic activities [5,6,7]. For instance, indices such as biodiversity metrics (α, β, γ diversity indices, biological integrity index), community network analyses, shifts in dominant species and indicator species, etc., have been utilized to assess regional environmental quality and ecological status, thereby guiding assessments of water ecological health and informing restoration efforts [7,8,9].
Invertebrates constitute a critical component of aquatic biodiversity, encompassing groups such as zooplankton, rotifers, annelids, nematodes, arthropods, zoobenthos, and mollusks [10]. Serving as the primary source of secondary productivity in aquatic ecosystems, invertebrates play indispensable roles in energy flow, material cycling, and information transmission within aquatic ecosystems by providing essential food resources for higher-trophic-level organisms and regulating the abundance of lower-trophic-level organisms through the top-down effects [9,11]. Furthermore, invertebrates are very sensitive to environmental disturbance, and their abundances, morphological characteristics, and species composition may change in response to variations in the water environment. For example, eutrophication may lead to the miniaturization of zooplankton and proliferation of pollution-resistant species such as Macrothrix, Brachionus, and Polyarthra. Thereby the variations in invertebrates could provide references for the health assessment and protection of aquatic ecosystems [10,12,13,14]. For instance, macrobenthos, zooplankton, rotifers, and chironomids are widely recognized as key bioindicators of water ecological health assessments in Europe and China, providing a scientific basis for water resource management and ecological restoration [9,15,16].
The river is one of the most significant ecosystems, providing residents with freshwater, landscape enjoyment, environmental regulation, biodiversity preservation, etc. However, intensifying human activities are placing unprecedented pressure on water quality and biodiversity, especially in agricultural rivers [17,18]. The Chai River, located in Yunnan Province, China, is the second largest tributary of Dianchi Lake, which flows through mountains, villages, and towns and into Dianchi Lake from south to north. It serves numerous social functions for the residents, such as freshwater supply, water source for agricultural irrigation, entertainment, and others [19,20]. Both sides of the Chai River are agricultural land, and owing to continuous agricultural activities, pesticides, farm manure, and chemical fertilizers are applied to the farmland and then flow with the rainwater into the river, polluting the water. These agricultural runoff waters have caused a significant amount of non-point-source nitrogen and phosphorus pollution to Dianchi Lake [19,20,21]. Invertebrates are widely recognized as key bioindicators of the water ecological environment [9,16]. Systematic studies on the community structure of invertebrates and their environmental factors in the Chai River are lacking, although there were several investigations about zooplankton or zoobenthos diversity, where the abundance and diversity were both relatively low, with Limnodrilus, Chironomus, and Branchiura being dominant genera [20,22,23]. Relevant studies are urgently needed to analyze the distribution characteristics of invertebrate communities and provide valuable references for the assessment and management of the water ecological environment and biodiversity in the Chai River.
Traditionally, invertebrate diversity has been studied by morphological identification methods, which are highly dependent on experienced taxonomists and have many limitations such as being laborious, inefficient, and high-cost. Through high-throughput sequencing of environmental DNA (eDNA), eDNA metabarcoding can analyze the community structure of environmental organisms quickly and accurately according to the DNA sequence differences between species and can improve the efficiency of large-scale biomonitoring [6,8]. eDNA metabarcoding has been widely applied in the study of aquatic biodiversity, as well as invertebrate diversity, although technical challenges, such as the sampling method and primer biases, still exist [9,16,24]. eDNA metabarcoding has been applied in exploring phytoplankton community distribution and its influencing factors in the Chai River [21], but there is no relevant study on invertebrates. Therefore, this study employs an eDNA metabarcoding approach to investigate invertebrates in the Chai River for the first time, aiming to comprehend the spatial and seasonal differences in the characteristics of invertebrate communities and to unveil the environmental factors that drive these differences. This study can provide a data reference for managing water ecological restoration and biodiversity of the Chai River and similar agricultural rivers.

2. Materials and Methods

2.1. Study Area and Sampling

Located on the south bank of Dianchi Lake, the Chai River is the second largest tributary of Dianchi Lake in Kunming City, Yunnan Province, China. It originates from Liujie Town, Jinning District, and flows through the Chai River Reservoir, Duanqi Village, Guanyin Mountain, and Niulian Village into Dianchi Lake. Situated in a subtropical plateau monsoon climate zone, the Chai River’s climate is divided into dry (November–April) and wet periods (May–October). Natural farmland and greenhouses are all over the banks of the Chai River, chemical fertilizers and pesticides are constantly imported into the river, and the Chai River has acted as a typical agricultural non-point-source-polluted river [20]. In addition, the Chai River basin belongs to a typical phosphorus-rich mountain area with intensive phosphate mining, which has brought and will continue to bring additional phosphorus source pollution [25]. Therefore, the Chai River is selected as the study area. Based on our previous research on the distribution of phytoplankton in the Chai River, a total of 10 sampling sites were selected, and water samples were collected, including in the upstream (1–4), midstream (5–7), and downstream (8–10) sections, respectively [21]. Figure 1 shows the specific sampling locations. At each site, 2 L of surface water was collected using a vertical water sampler and placed in sterile bottles. The samples were transported to the laboratory in an incubator. Three biological replicates were taken at each site. A volume of 1 L of water sample was filtered through a 0.45 μm hydrophilic nylon membrane (MilliporeSigma, Burlington, MA, USA), using 1 L of ddH2O as control at the same time. The membranes were kept in a 5 mL sterile tube and stored in a −80 °C refrigerator until DNA extraction. The other liter of water sample was preserved for measuring environmental factors. And since, due to the scarcity of water, the fifth and eighth sampling sites stopped flowing in the dry period, a total of 54 samples were used in this study.

2.2. Environmental Factor Analysis of Water Samples

According to the “Water and Wastewater Monitoring and Analysis Method” (4th edition) (State Environmental Protection Administration, 2002 [26]), physicochemical parameters of the water samples were determined. Briefly, the water temperature (WT), pH, dissolved oxygen (DO), and conductivity (C) were measured using a YSI water quality analyzer in situ (YSI Incorporated, USA). The NH4+ concentration was measured through Knott’s spectrophotometry; the total nitrogen (TN) concentration was measured using digestion–ultraviolet spectrophotometry; the total phosphorus (TP) was measured by ammonium molybdate spectrophotometry; the chemical oxygen demand (COD) was measured by the potassium dichromate method; and the concentration of chlorophyll a (Chl-a) was measured by ethanol and spectrophotometry.

2.3. eDNA Extraction, PCR Amplification, and Sequencing

Using the DNeasy PowerWater Kit (QIAGEN, Duesseldorf, NW, Germany), eDNA from the filter membrane was extracted, and the purity and concentration were detected by Agarose gel electrophoresis and Qubit@2.0 Fluorometer (Thermo Scientific, Waltham, MA, USA) and then diluted to 10 ng/µL. During DNA extraction, the ddH2O filter membrane was extracted alongside the samples as an extraction blank. Using the diluted eDNA as a template, the mitochondrial cytochrome oxidase subunit 1 (COI) gene (Amplicon size ~ 313bp) targeting invertebrates was amplified, and the OneStep™ PCR Inhibitor Removal Kit (Zymo, Los Angeles, CA, USA) was used to remove PCR inhibitors. The primer sequences are mlCOIintF (5′-GGWACWGGWTGAACWGTWTAYCCYCC-3′) and dgHCO2198 (5′-TAAACTTCIGGRTGICCRAARAAYCA-3′) [27]. Unique 12 bp nucleotide fragments (barcode) were added to the 5′-ends of the forward primers (GenScript, Nanjing, China). The PCR reactions were performed for each sample and negative controls, and then the PCR products were purified using the Zymoclean Gel Recovery Kit (D4008, Los Angeles, CA, USA) and quantified using a Qubit@2.0 Fluorometer (Thermo Scientific, Waltham, MA, USA). The sequencing libraries were constructed using the Illumina TruSeq DNA PCR-free Sample Prep Kit (FC-121-3001/3003, San Diego, CA, USA) and paired-end sequenced (2 × 300) on an Illumina MiSeq platform (Illumina, San Diego, CA, USA) according to the manufacturer’s protocols.

2.4. Bioinformatics

The raw data were analyzed following the QIIME2 pipeline to trim low-quality sequences and PCR chimeras. The remaining high-quality reads were sorted into their respective samples based on the unique barcodes in the forward primers. Amplicon sequence variants (ASVs) were produced based on single-nucleotide differences in USEARCH 8, and the taxonomy of ASVs was carried out against the BOLD references COI database (http://www.boldsystems.org (accessed on 1st August 2024)). The resulting taxonomy table was filtered using the following thresholds: <85% for the class level, 85% for the order level, 90% for the family level, 95% for the genus level, and 98% for the species level [28].

2.5. Statistical Analysis

ASVs with more than 10 reads, present in at least two replicates, were retained as high-confidence taxa and used to generate the ASV table (Table S1). All bacteria, fungi, and Viridiplantae were eliminated from the ASV annotation tables to concentrate on invertebrates in this study. Based on the ASV table, the invertebrate communities were statistical analyzed by the “vegan” package in R software (3.5.3), and we used “ggplot2” and “Origin 2020b” to draw visualization mapping. Shannon–Wiener’s diversity index was used to calculate the ɑ-diversity of invertebrates in each sampling site. A permutational multivariate analysis of variance (PERMANOVA) with 999 permutations was used to evaluate the community differences among groups of period and position. Spearman’s correlation analysis, the Mantel test, and redundancy analysis (RDA) were used to reflect the relationship between the invertebrate community and environmental variables. The Benjamini and Hochberg FDR was used to correct the p values to control for false positives.

3. Results

3.1. Overview of Invertebrate Communities

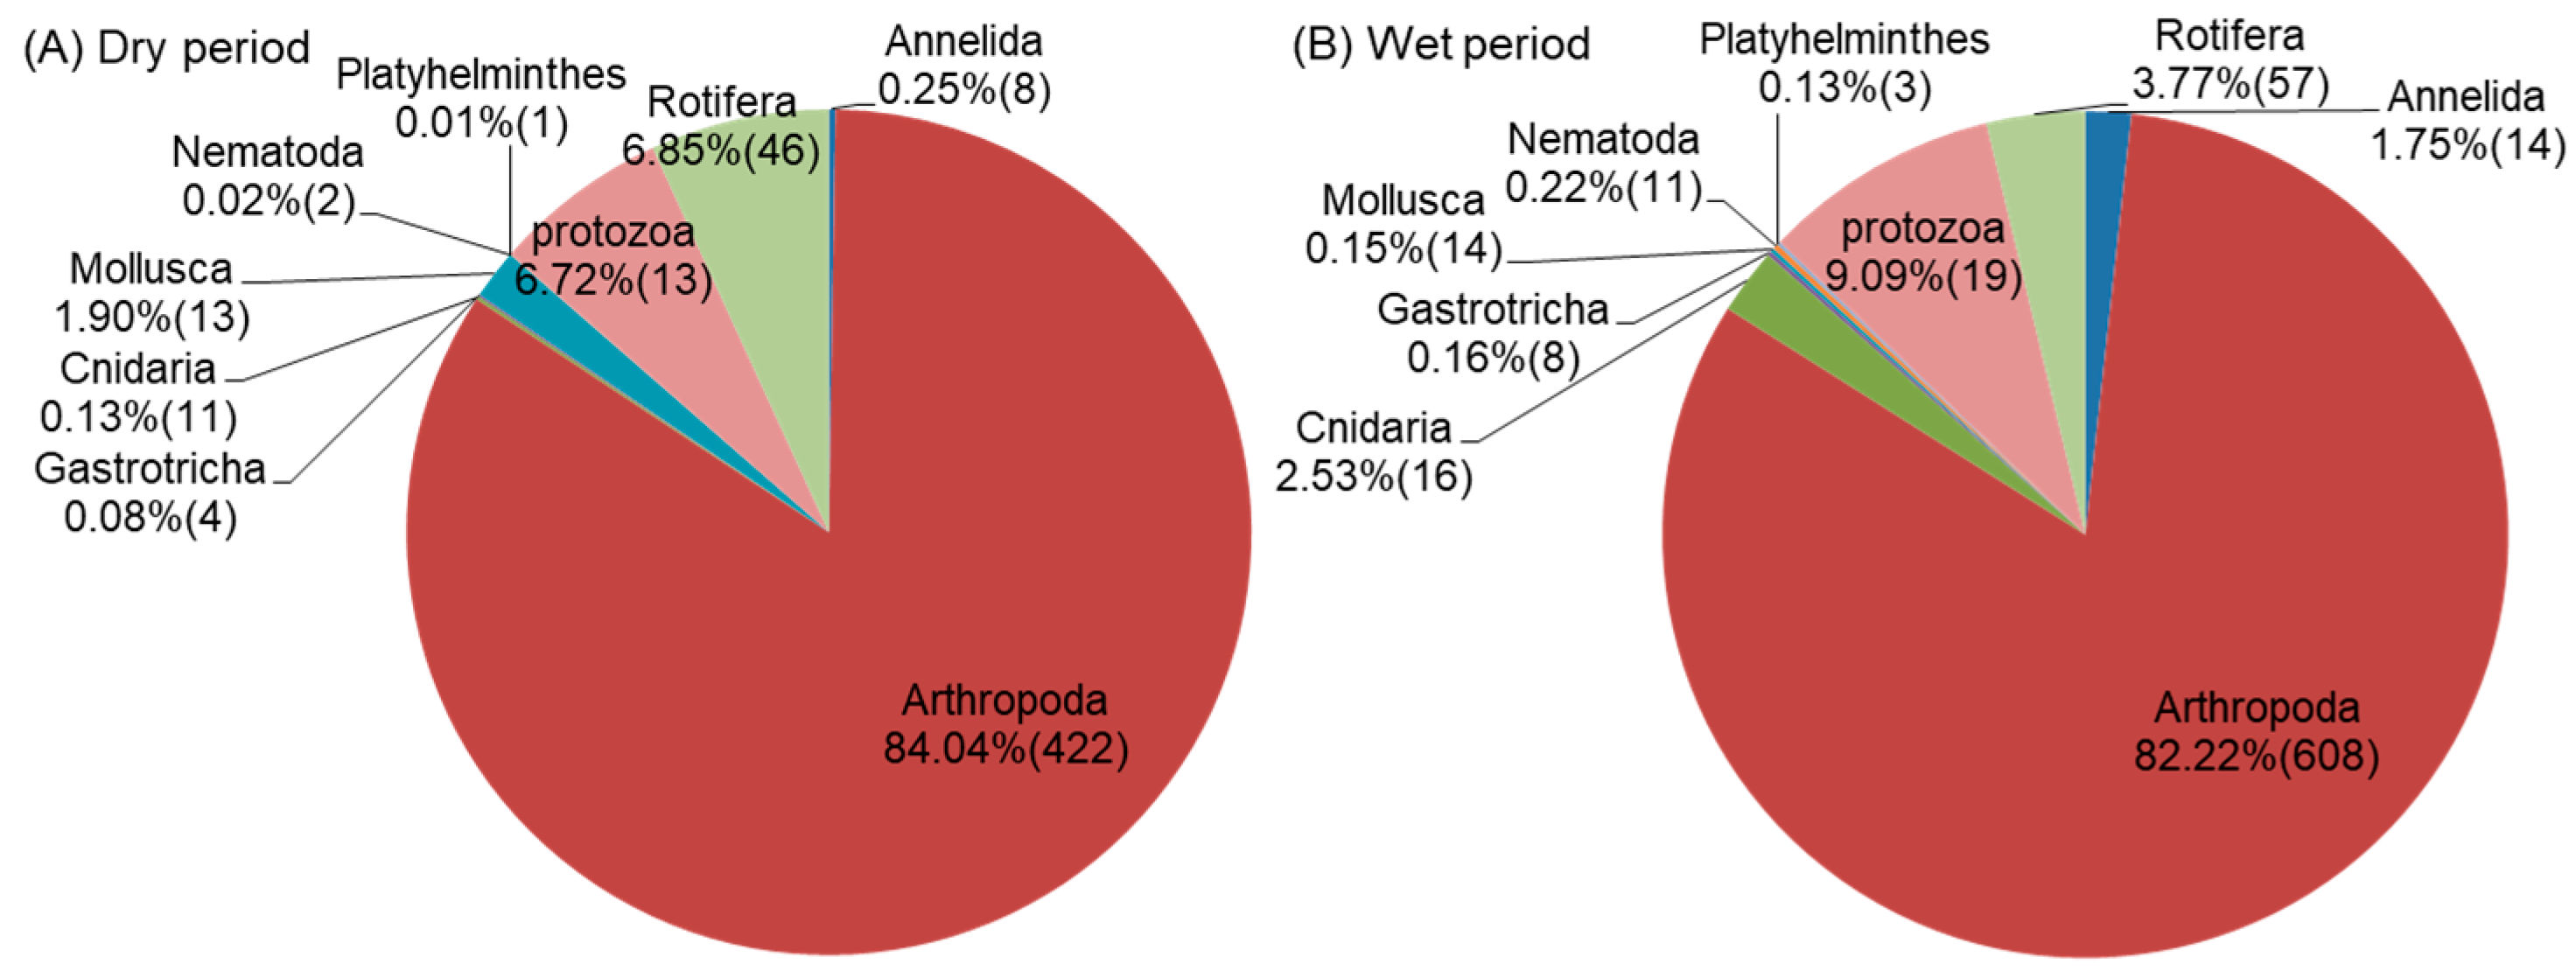
A total of 345,039 high-quality (>Q20) reads/2666 ASVs were obtained after quality control. The rarefaction curves were saturated (Figure S1), which indicated that the sequencing data covered sufficient taxonomic information in the eDNA samples. Based on the BOLD reference (COI) database, a total of 275,192 reads/873 ASVs were assigned to the invertebrate communities and reserved for further analysis in this study. A total of 520 invertebrate ASVs were identified in the dry period and 750 in the wet period; these ASVs belonged to Annelida, Arthropoda, Cnidaria, Gastrotricha, Mollusca, Nematoda, Platyhelminthes, Protozoa, and Rotifera, respectively. The number of ASVs and the relative abundances of each phylum differed in dry and wet periods. Interestingly, Arthropoda dominated (the highest relative abundance and the highest number of ASVs) both in the dry and wet periods, and the relative abundance was even more than 82% (Figure 2).

3.2. Spatial and Seasonal Distribution of Invertebrate Communities

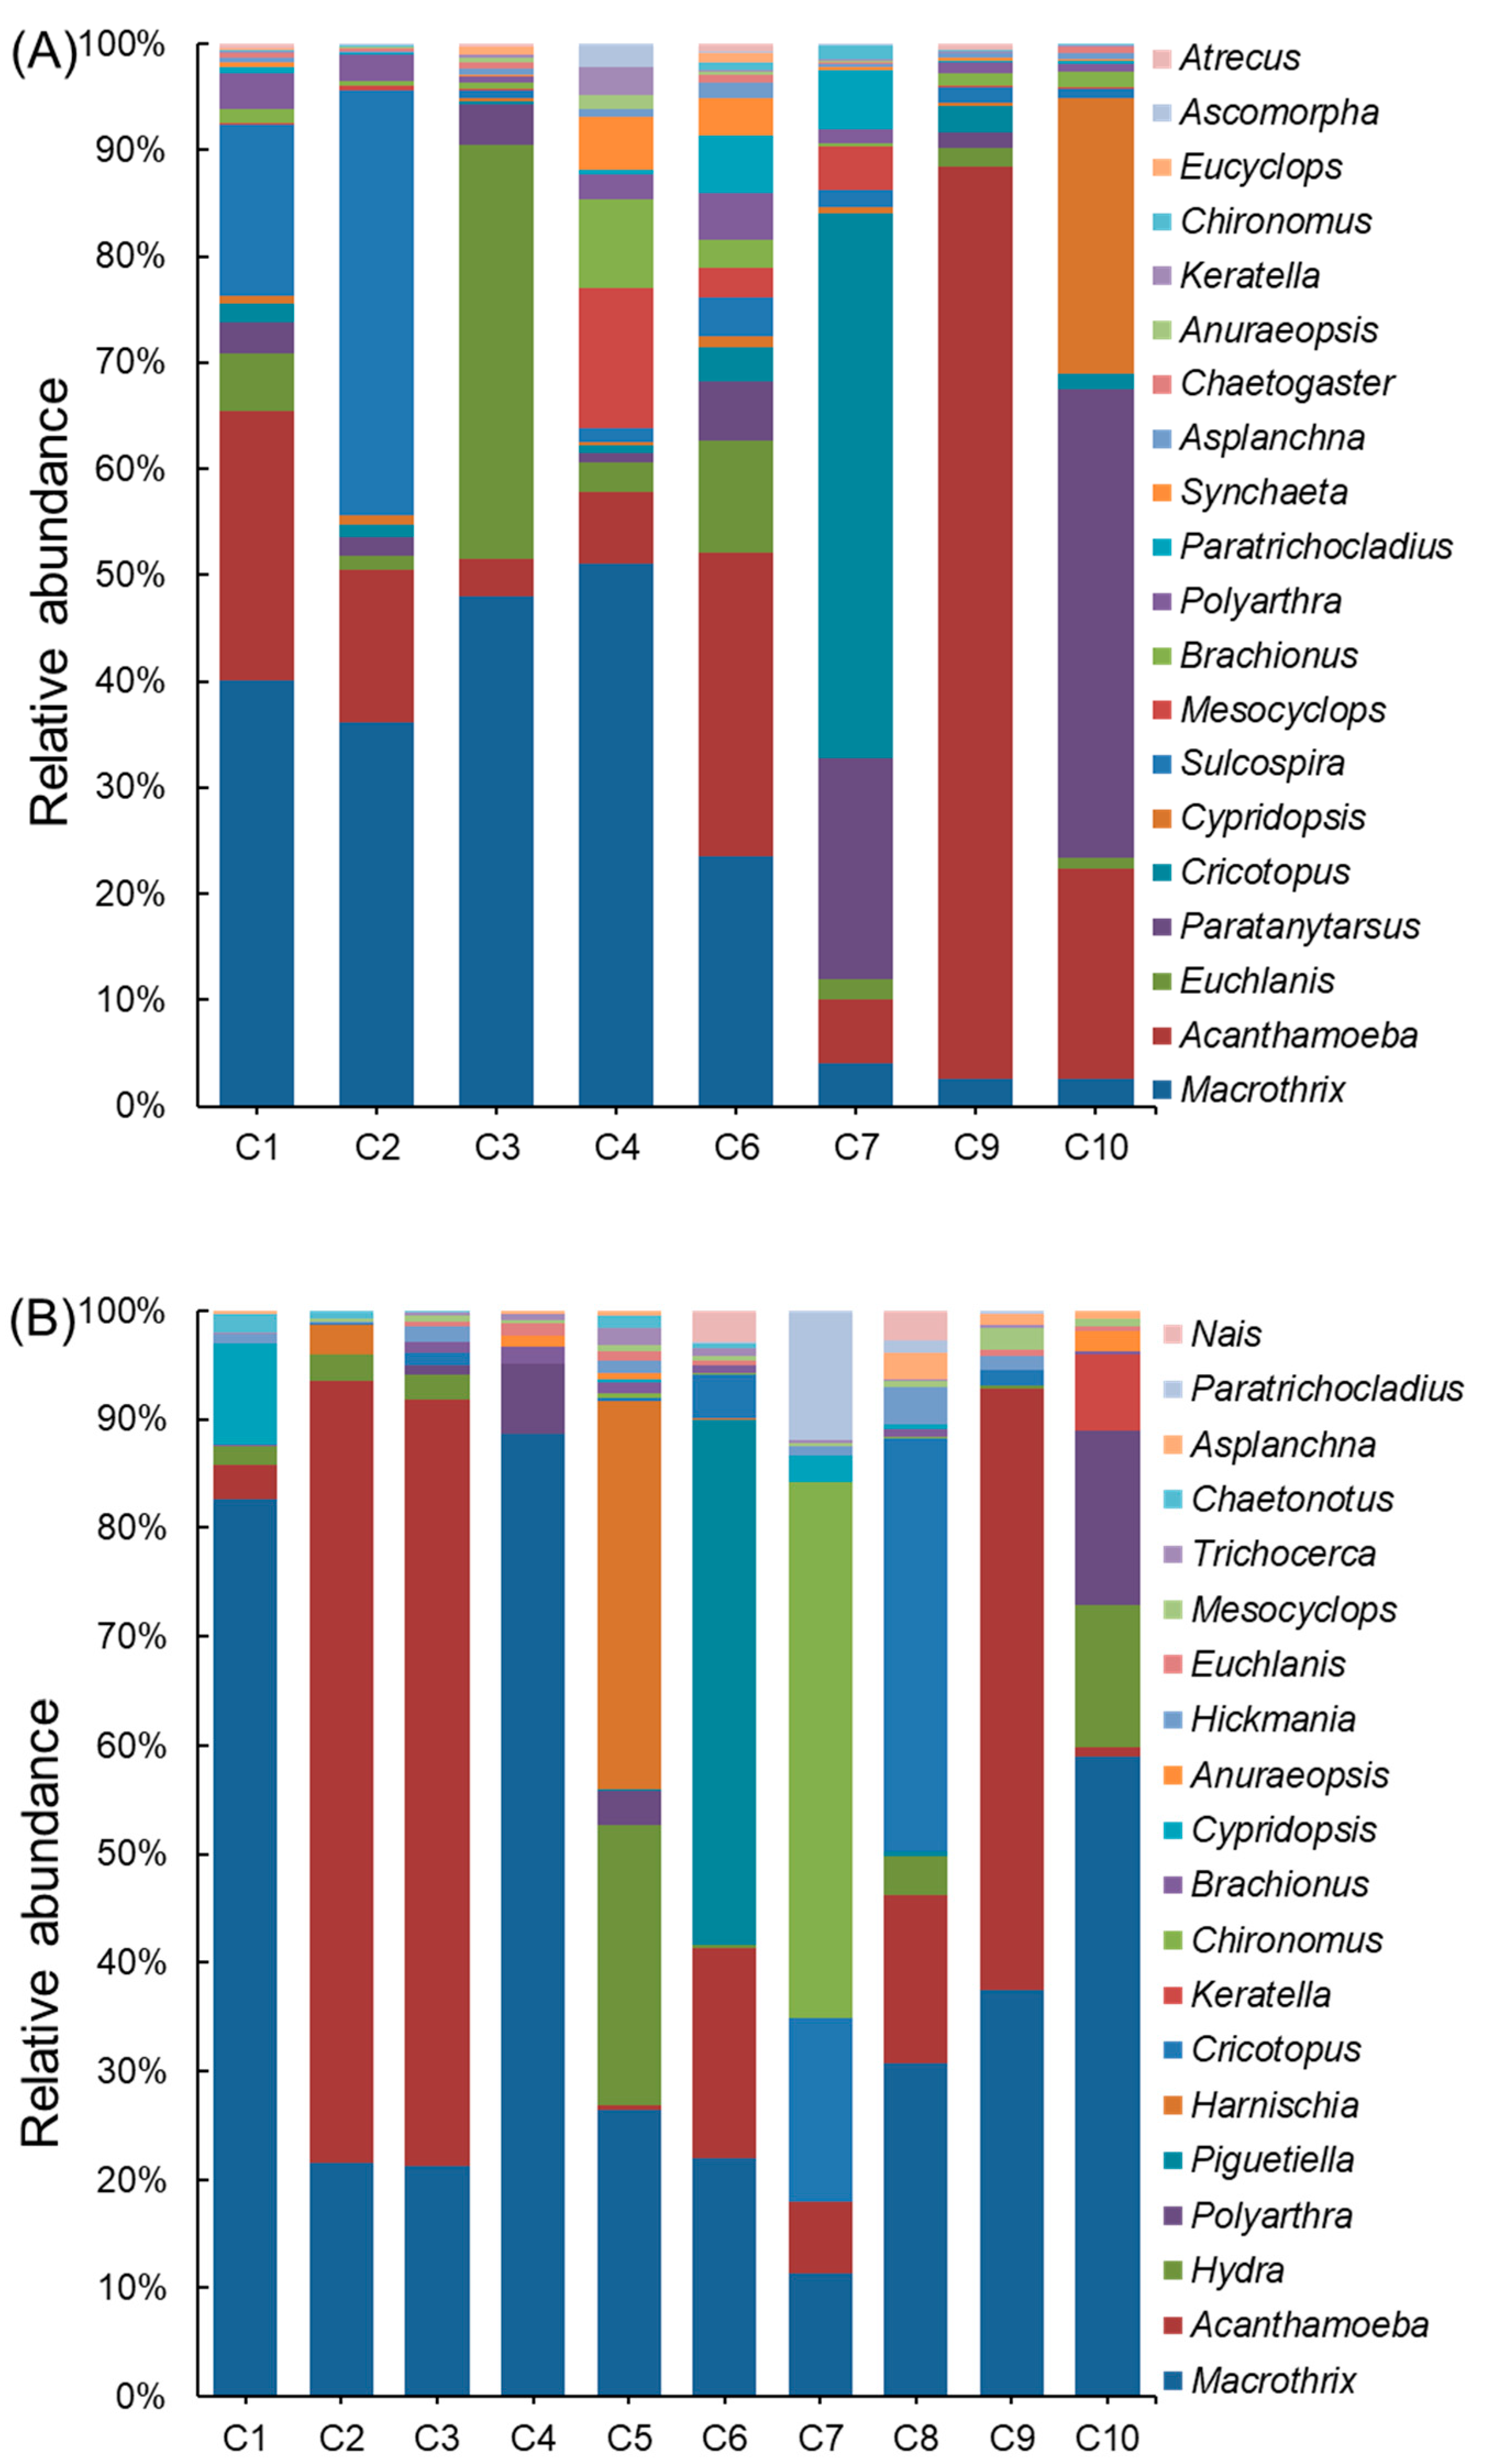
From 873 invertebrate ASVs, 200 ASVs could be annotated to 63 genera in the Chai River. A total of 47 genera were identified in the dry period and 55 genera in the wet period, and the relative abundance of each genus was different at each site. Figure 3 shows the spatial and seasonal variations in invertebrate communities in the Chai River, and Macrothrix, Acanthamoeba, Euchlanis, Cricotopus, Cypridopsis, Mesocyclops, Brachionus, Polyarthra, Paratrichocladius, Asplanchna, Anuraeopsis, Keratella, and Chironomus belong to the top 20 abundant genera both in the dry and wet periods. Macrothrix and Acanthamoeba were the first and second dominant genera both in the dry and wet periods. The relative abundance of Macrothrix was even reaching over 80% in C1 and C4 in the wet period, and the relative abundance of Acanthamoeba was even reaching over 70% in C2 and C3 in the wet period and C9 in the dry period.

3.3. Invertebrate Diversity Patterns

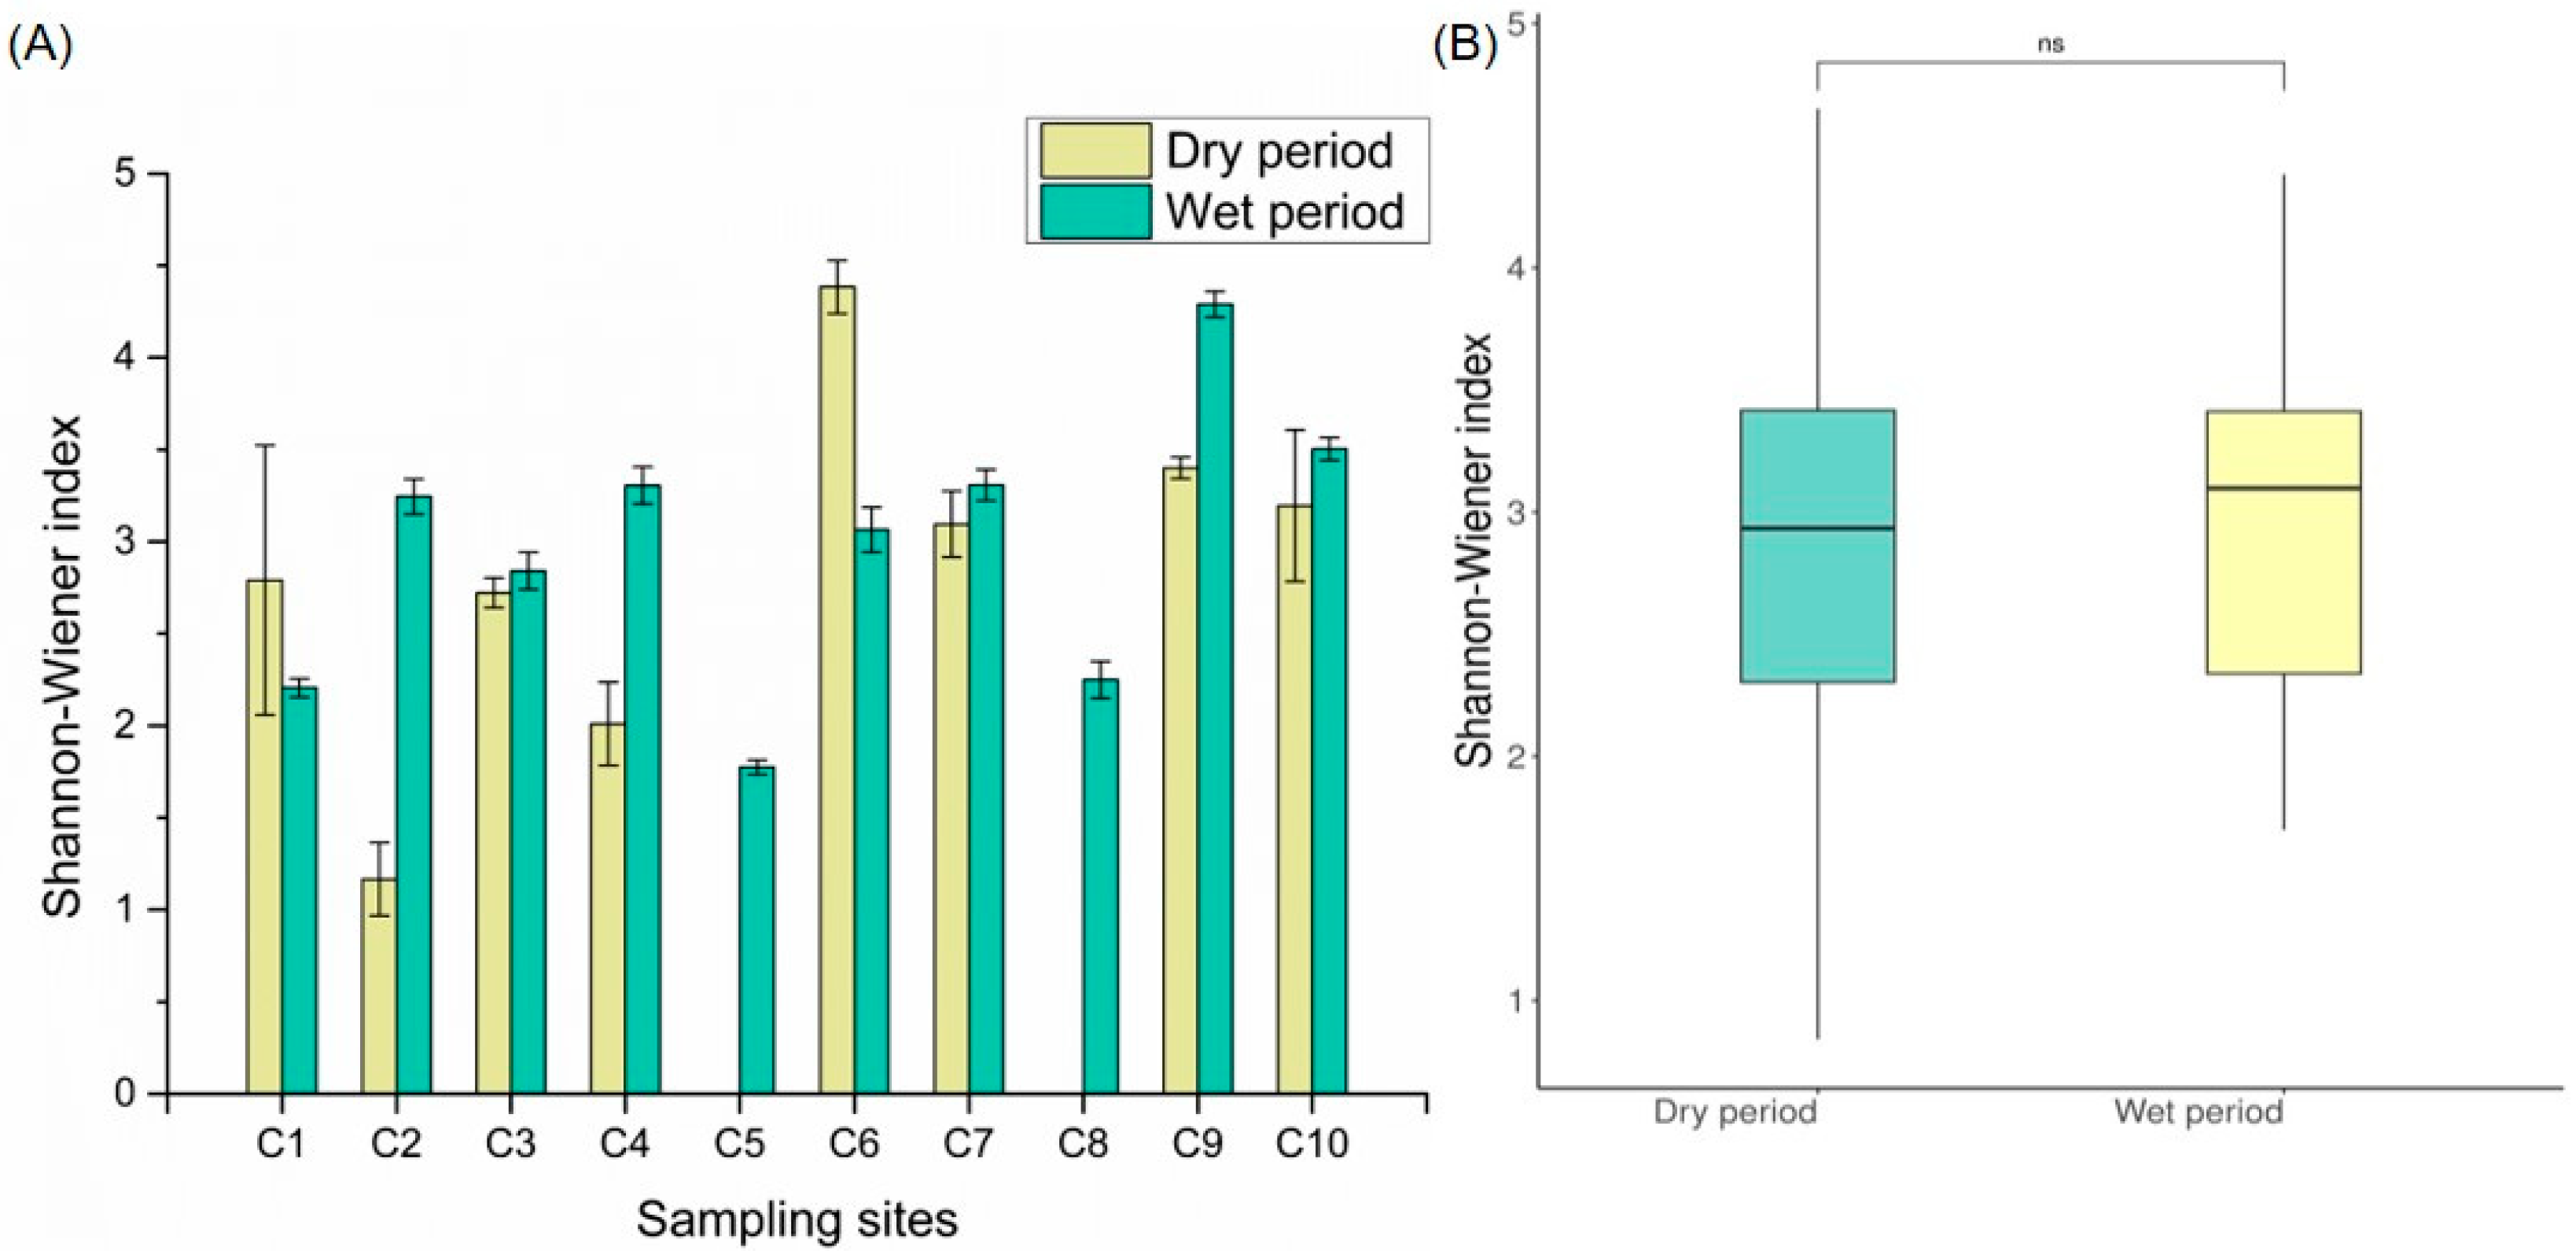
The Shannon–Wiener index reflects the alpha diversity of the community within the sample. Distinct spatial and seasonal distribution patterns of invertebrate diversity were exhibited in the Chai River (Figure 4, Table 1). The Shannon–Wiener indices were between 1.16 and 4.38, and there were no significant differences in the Shannon–Wiener index between dry and wet periods in the Chai River (Figure 4, Wilcoxon p < 0.05). A PERMANOVA test (Table 1, p < 0.001) was performed to find the differences in invertebrate communities. There were significant differences between the dry and wet periods and within the groups of upper, middle, and lower reaches, and the seasonal factor and location factor contributed significantly to these variances, with R2 being above 14%.

3.4. The Correlation Between the Community Composition of Invertebrate Communities and Environmental Factors

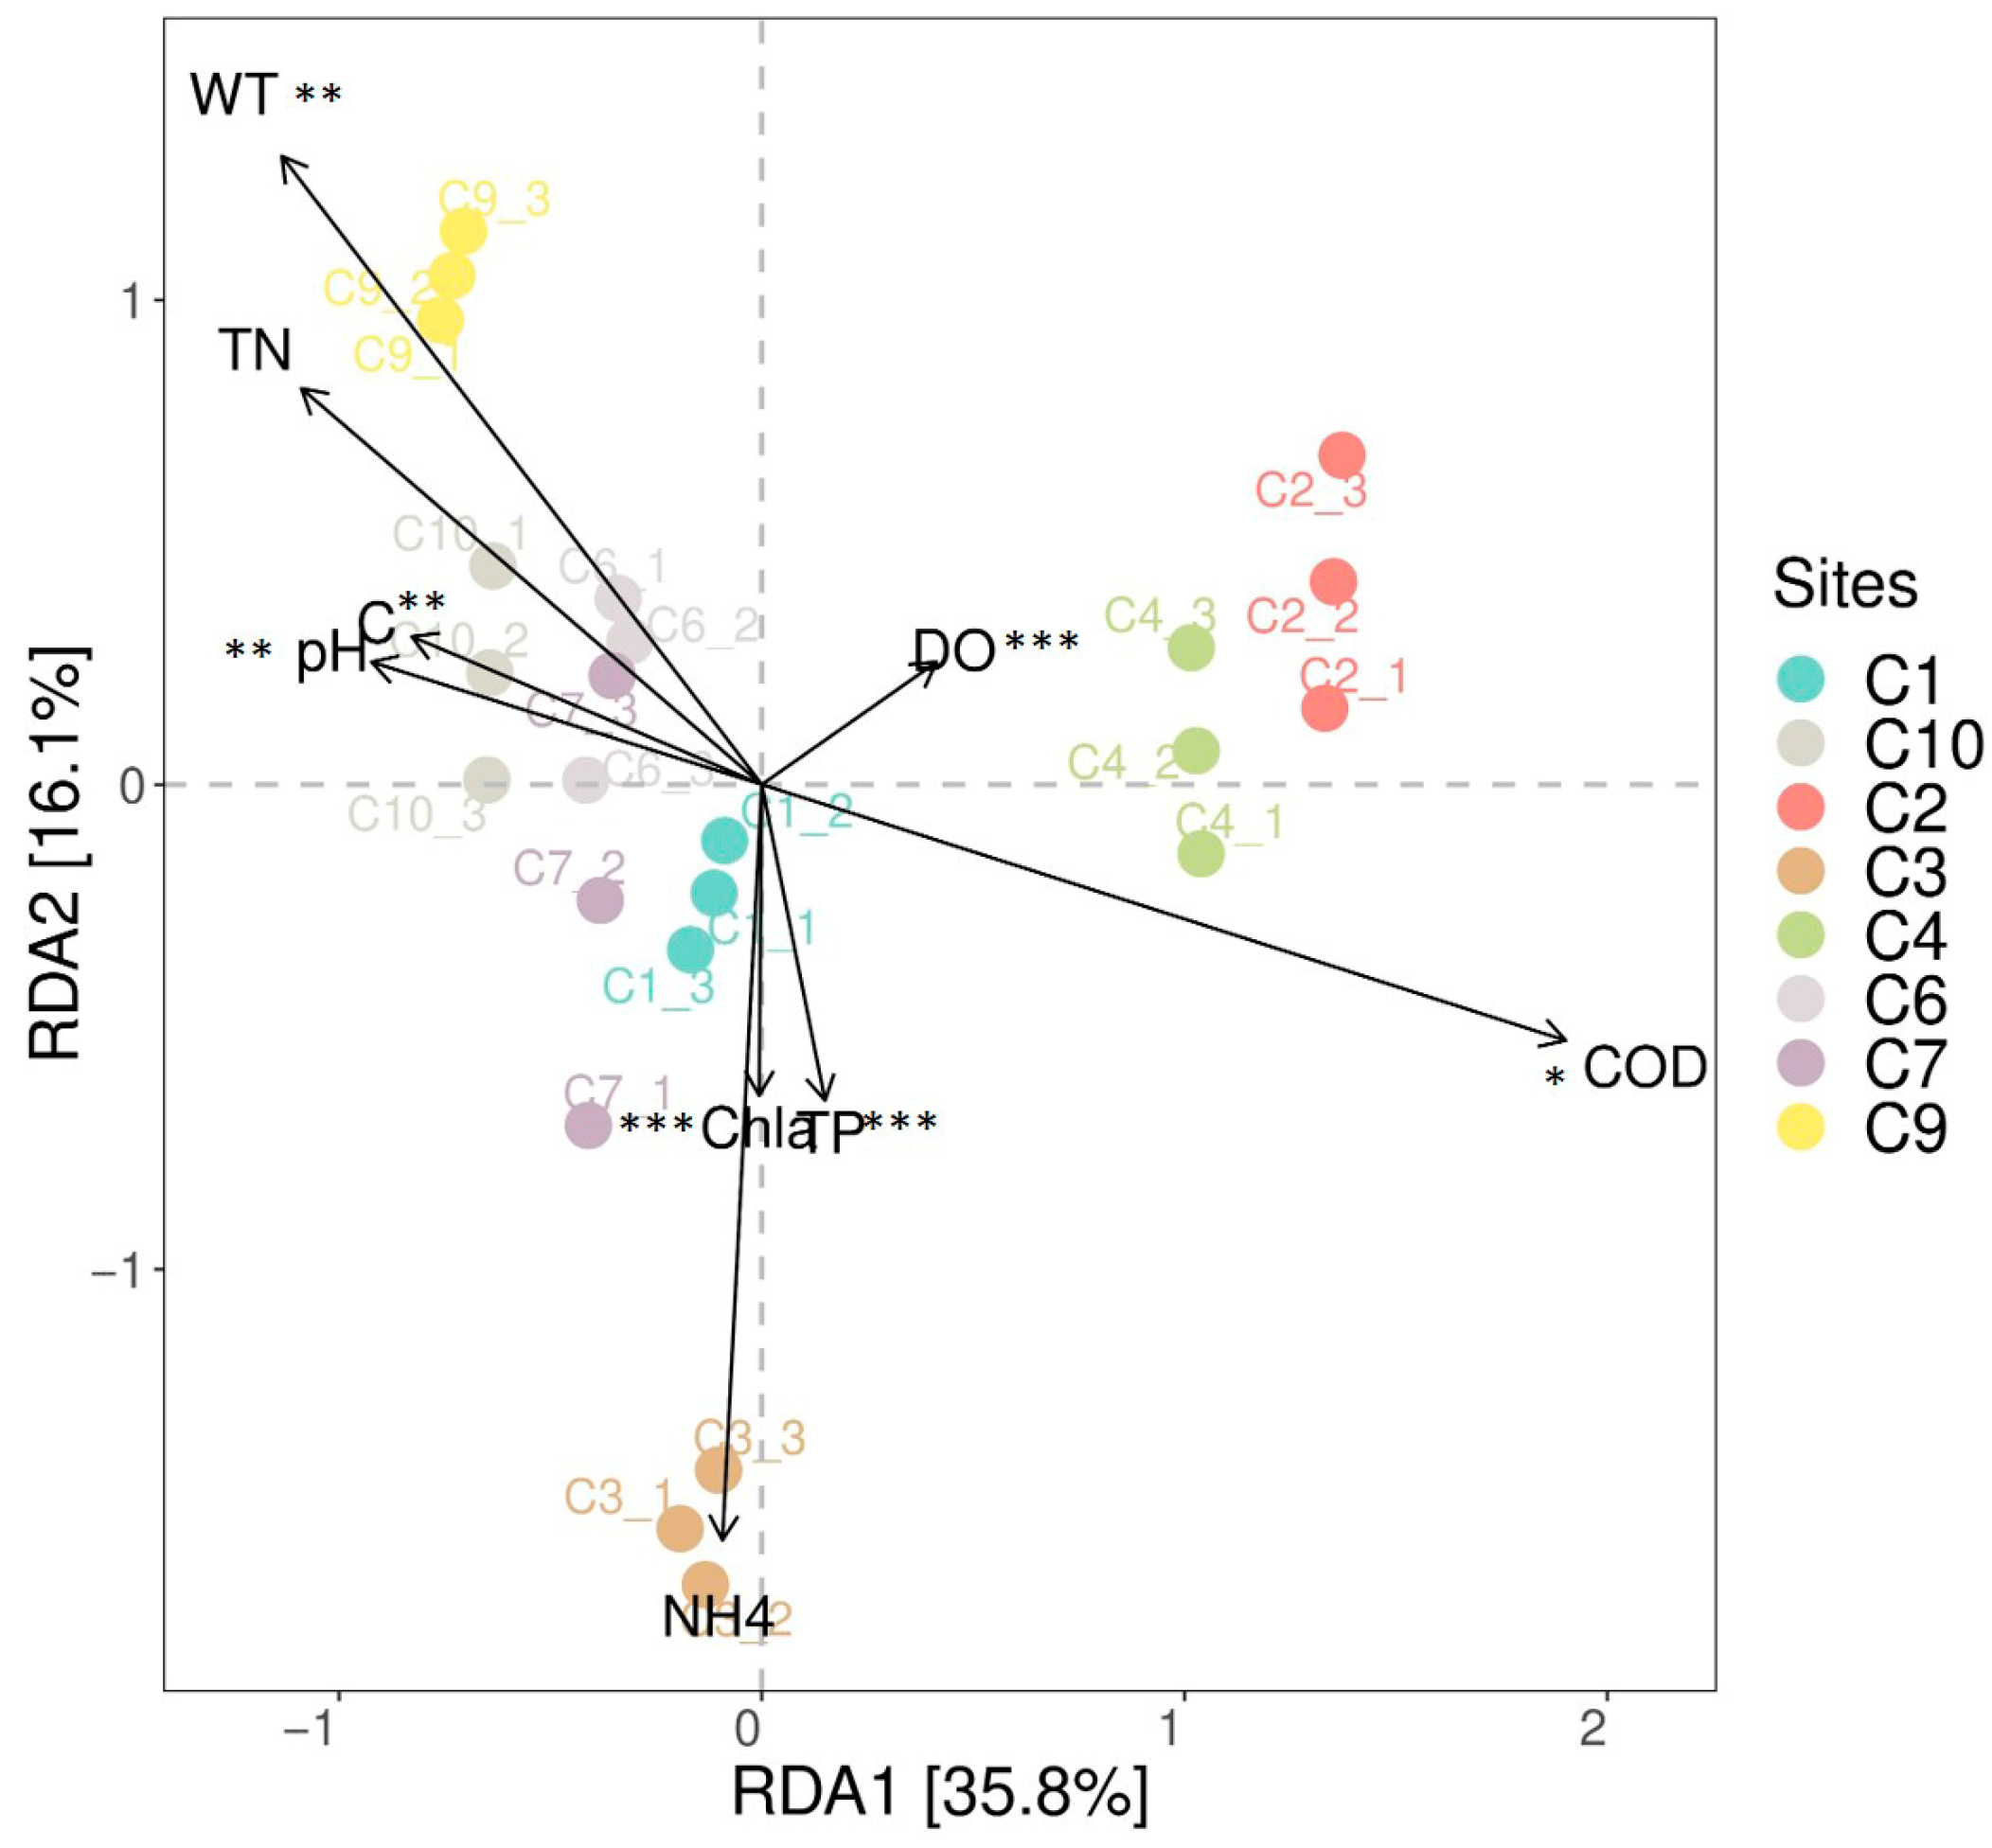
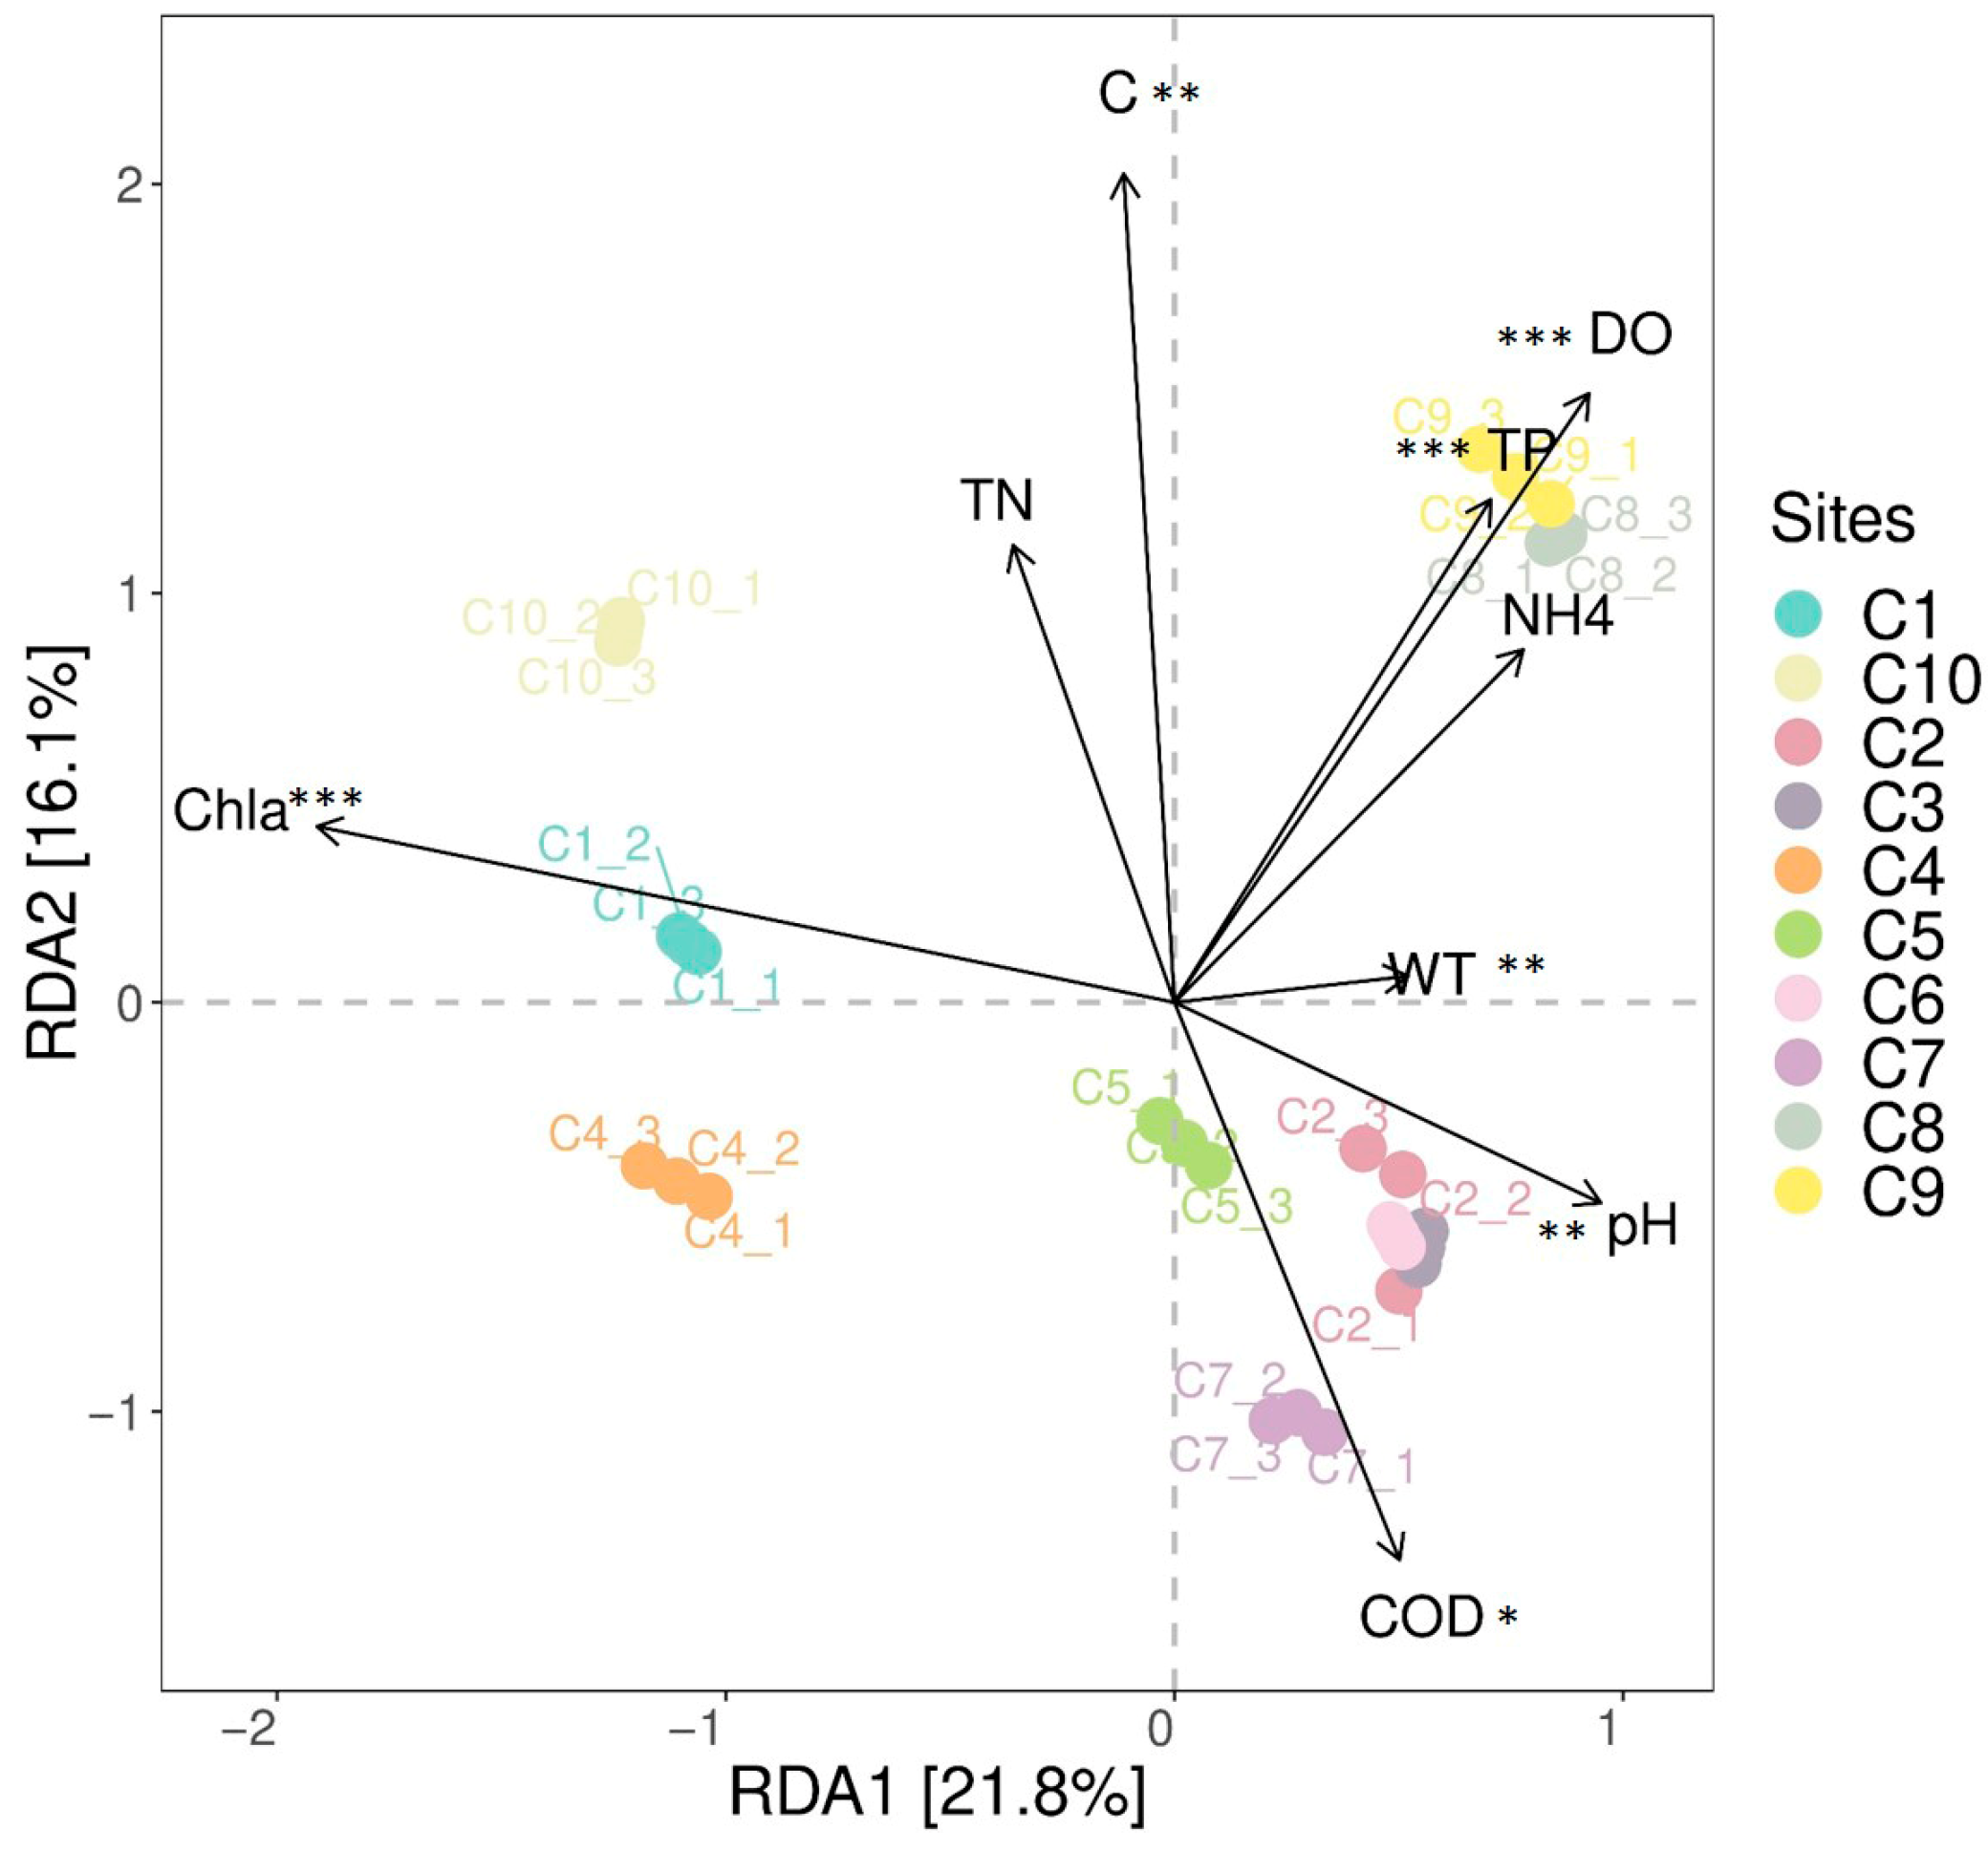
There were significant differences in WT, pH, COD, and Chl-a between the dry and wet periods (p < 0.5), and the average pH and COD values were higher in the wet period than in the dry period [21]. Correlation analysis was carried out to explore the relationships between environmental factors and invertebrate communities. The Mantel test results showed that pH, WT, DO, COD, TP, Chl-a, and C significantly affected the invertebrate communities (Table S2; Mantel’s r > 0.1469, 0.001 < p < 0.05). Redundancy analysis revealed there were significant differences in the relationships between invertebrate communities and environmental factors at different sampling sites and in different periods (Figure 5 and Figure 6). In the dry period, the effects of environmental factors on invertebrate communities were COD > WT > TN > pH > NH4+ > C > TP > Chl-a. Meanwhile, in the wet period, the effects of environmental factors on invertebrate communities were Chl-a > C > DO > TP > COD > pH > NH4+ > TN > WT.
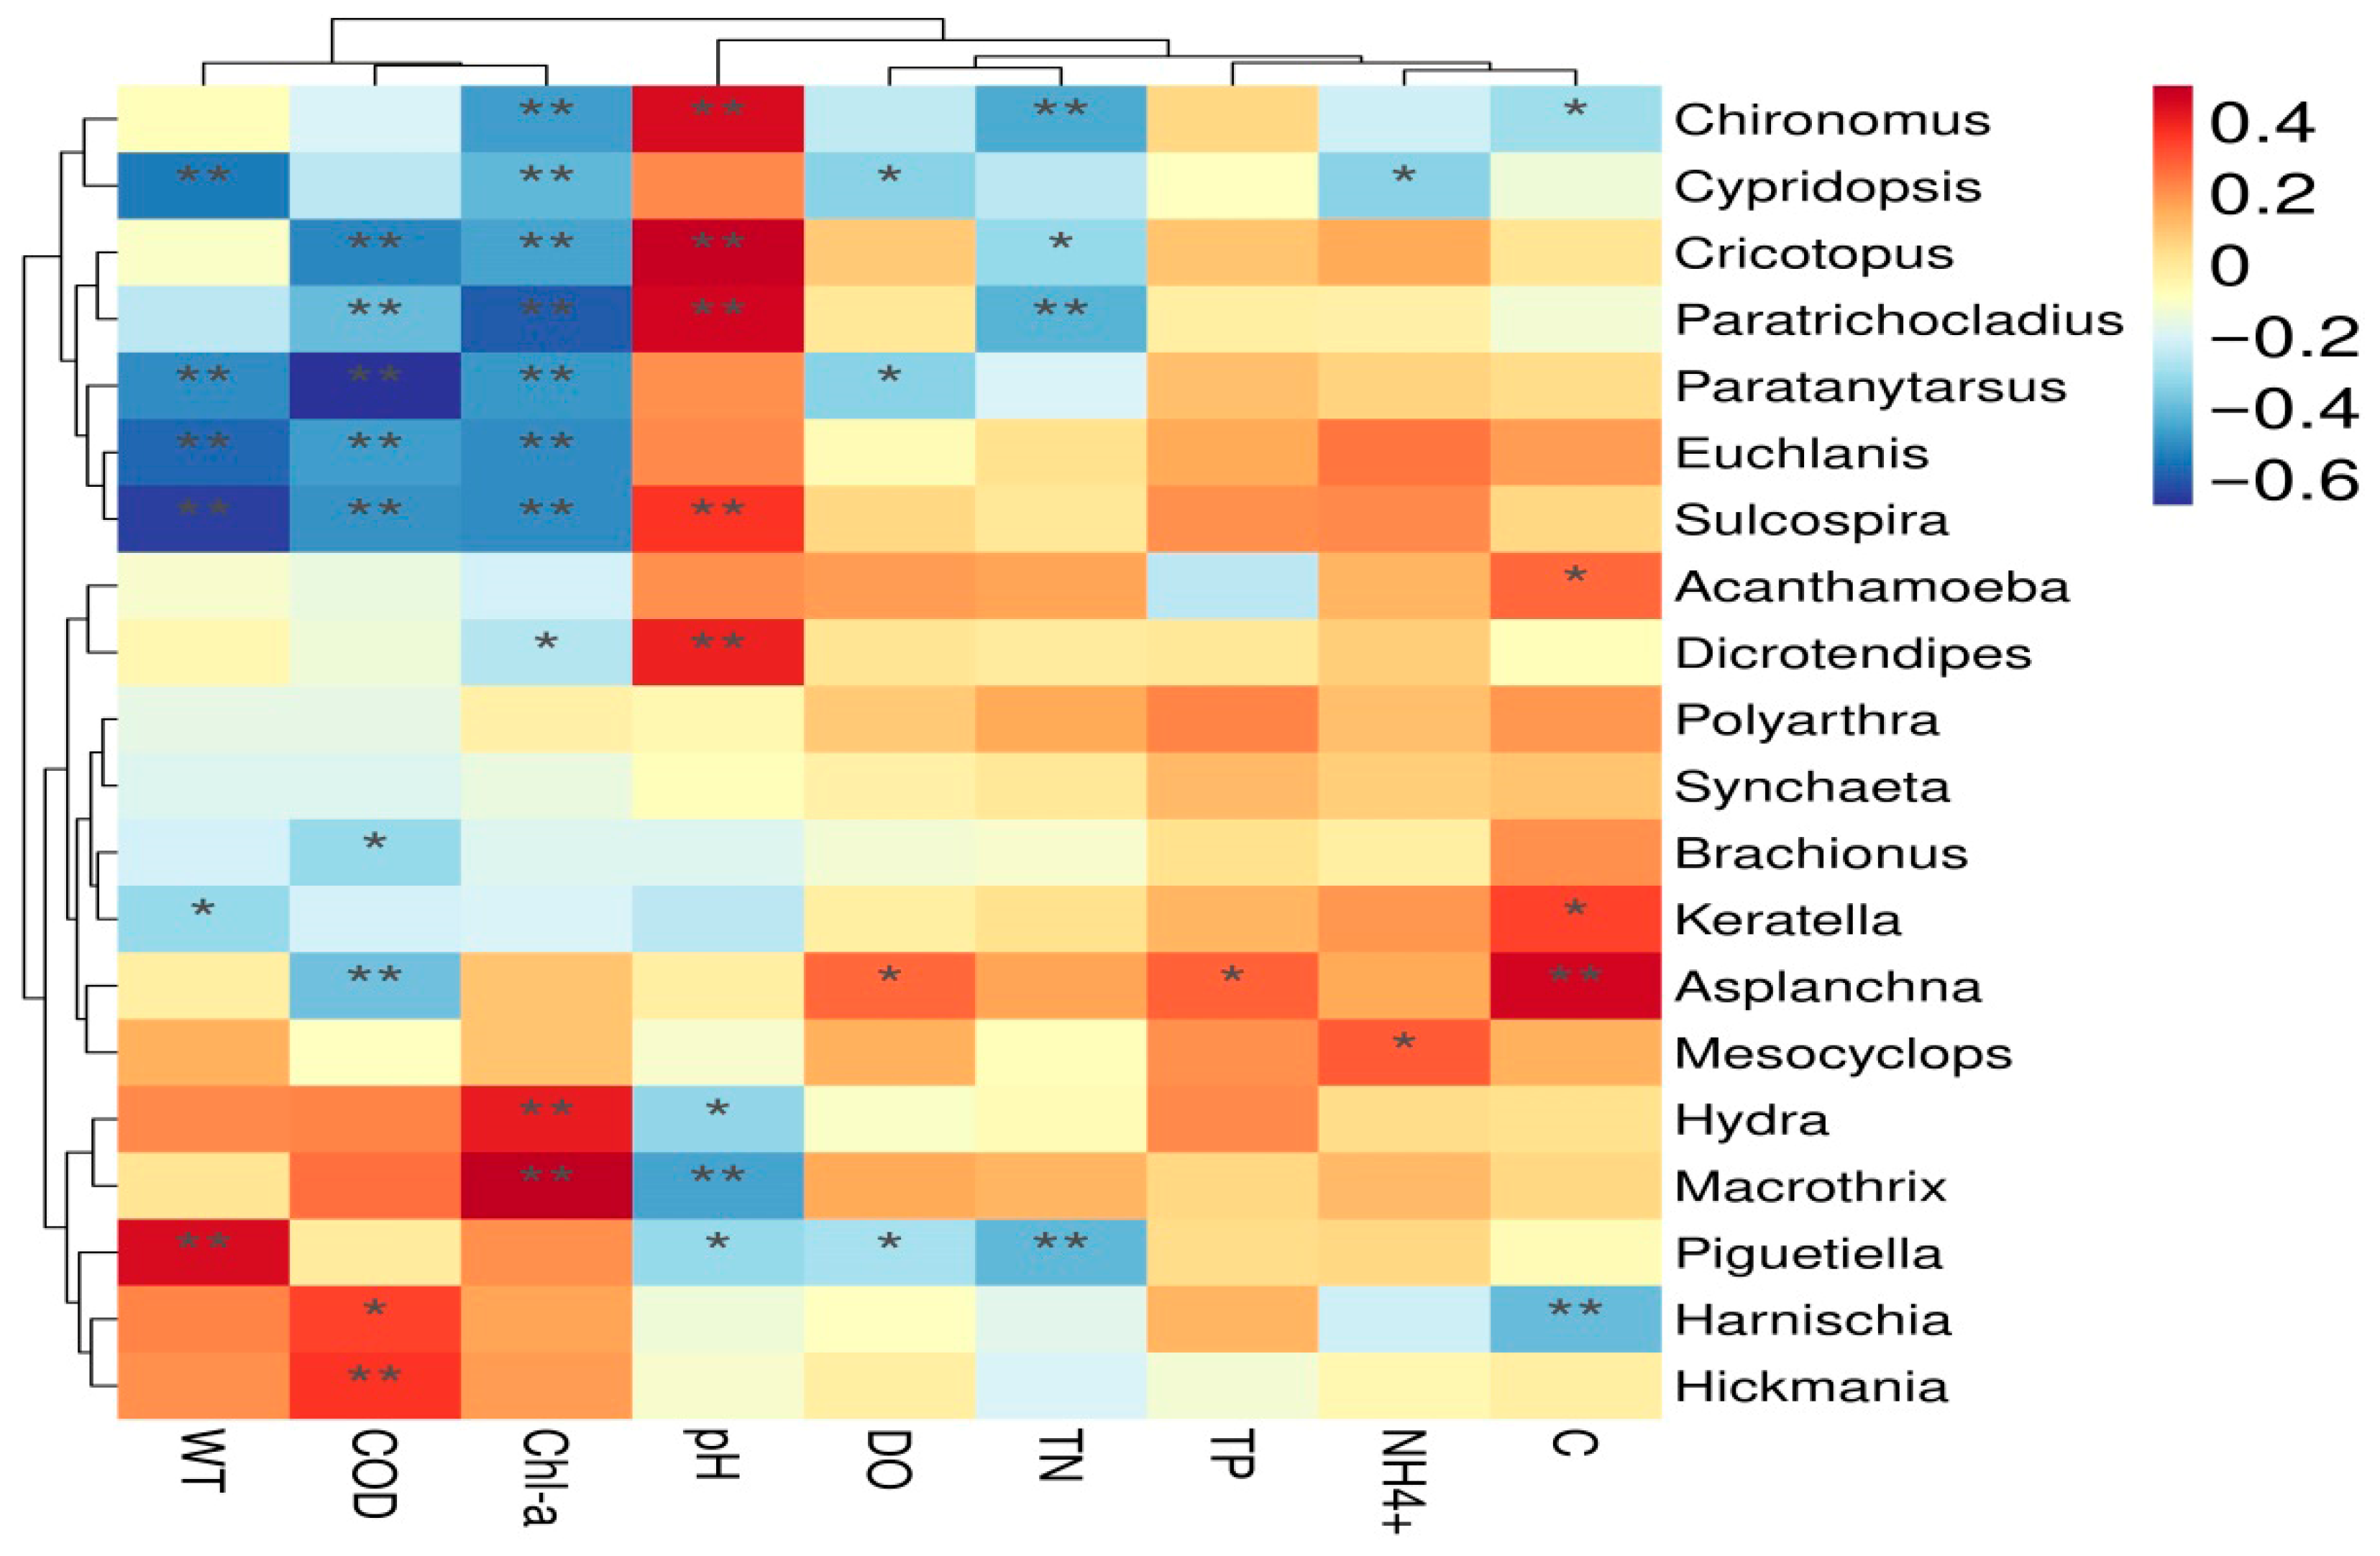
The effects of environmental factors on the relative abundances of genera were revealed by Spearman’s correlation analyses. Invertebrate abundances were correlated to the environmental factors, and the relative abundances of specific genera were significantly related to certain environmental factors (|r| > 0.5, p < 0.01; Figure 7, Table S3). For example, Macrothrix was positively correlated with Chl-a, whereas Euchlanis, Paratrichocladius, and Sulcospira were negatively correlated with Chl-a; Cypridopsis, Euchlanis, Paratanytarsus, and Sulcospira were negatively associated with WT, and Cricotopus and Paratanytarsus were negatively associated with COD (|r| > 0.5, p < 0.01; Figure 7, Table S3).

4. Discussion

4.1. eDNA Metabarcoding Disclosed the Distribution Patterns of Invertebrate Communities in the Chai River

Providing results with high consistency and fast speed compared to traditional morphological methods, eDNA metabarcoding has provided a valuable tool for the monitoring of aquatic biodiversity and discovery of rare, hidden, and invasive species in recent years [29,30]. It has been widely applied in invertebrate diversity research, and the results were highly consistent between eDNA metabarcoding and traditional morphological monitoring [10,16]. Based on eDNA metabarcoding, a total of 275,192 reads/873 ASVs were assigned to the invertebrate communities in the Chai River, belonging to Annelida, Arthropoda, Cnidaria, Gastrotricha, Mollusca, Nematoda, Platyhelminthes, Protozoa, and Rotifera, respectively. Distinct spatial and seasonal variations in the invertebrate communities (e.g., ASV number, dominant genera, relative abundances) were observed. A total of 520 invertebrate ASVs were identified in the dry period and 750 in the wet period, and the relative abundances were different in the dry and wet periods. Arthropoda dominated (the highest relative abundance and the highest number of ASVs) both in the dry and wet periods, followed by Protozoa and Rotifera. Arthropods undertake important functions such as decomposing and feeding on organic debris and humus, regulating algal biomass through feeding on phytoplankton, and serving as a food source for aquatic vertebrates in aquatic systems [31]. Macrothrix, Paratanytarsus, and Cricotopus dominated in the dry period, and Macrothrix also dominated in the wet period in the Chai River; these play important roles in feeding on organic debris and algae. Protozoa and Rotifera play a crucial role in maintaining the balance of ecosystems through the consumption of detrital matter, bacteria, fungi, microorganisms, and algae [8,32]. Arthropoda are usually the most dominant phylum in aquatic invertebrate communities [16,33,34], which was also found in our research results. The seasonal differences in the number of ASVs may be mainly related to a lack of data from the fifth and eighth sampling sites due to the scarcity of water in the dry period. In addition, the increase in temperature and high nutrient levels, accompanied by rainwater runoff, are conducive to the growth and reproduction of invertebrates, which may significantly enhance the ASV number in the wet period [35,36,37].
Metabarcoding of invertebrate communities in the Chai River in this study identified 63 genera, with 47 genera in the dry period and 55 genera in the wet period, and Macrothrix, Acanthamoeba, Euchlanis, Cricotopus, Cypridopsis, Mesocyclops, Brachionus, Polyarthra, Paratrichocladius, Asplanchna, Anuraeopsis, Keratella, and Chironomus have relatively high abundance levels in both periods. Macrothrix and Acanthamoeba were the first and second most dominant genera both in the dry and wet periods. Previous studies showed that the number of zoobenthos species was relatively low (15 genera), and the zoobenthic communities of the Chai River mainly belonged to Annelida and Arthropoda, with Limnodrilus, Chironomus, and Branchiura being dominant genera [22,23]. Many more invertebrate taxa were identified in this study compared to other studies. There might be multiple reasons for this: On the one hand, this might be because invertebrates include multiple taxonomic groups such as zooplankton, zoobenthos, and macroinvertebrates, and previous investigations often focused on only one of these groups. On the other hand, this might be related to the fewer sampling points and times in the previous studies. In addition, this also implied the superiority of environmental DNA metabarcoding in biodiversity monitoring and the improvement in biodiversity due to effective governance of the Chai River. Of course, some historically detected species were not detected in this study. This may be related to the differences in sampling time and location and the current shortcomings in metabarcoding monitoring (such as the difficulty in detecting certain taxa due to the preference of metabarcoding primers, the degradability of eDNA, and the incomplete species resource data in the barcode database) [8,10,28,38]. Certainly, there may be some limitations to the work. For example, the surface water was collected in this experiment at only two sampling frequencies, which may not be sufficient for a thorough study of invertebrates, especially in benthic species. All the above improvements will ensure the accuracy of our research, and simultaneous environmental RNA monitoring may also provide a useful tool [28,39]. In order to confirm the trend of biodiversity over time and reliably attribute this change to ecological restoration measures, long-term repeated monitoring should be conducted in the same season and location and by using the same primers as in this study.
Invertebrates are very sensitive to changes in environmental factors, and some rotifers, arthropods, and chironomids have an indicative role for the nutritional status of water bodies [15,32,40,41]. For example, Anuraeopsis and Calanus often appear in oligotrophic water bodies, Keratella and Mesocyclops are thought to be distributed in medium-polluted eutrophic water bodies, and Macrothrix, Brachionus, Polyarthra, Trichocerca, and some Chironomidae and Copepods prefer to inhabit eutrophic water bodies [42,43,44]. Cricotopus are recognized as an important type of pollution indicator species, and the increase in the abundance of Cricotopus indicates the intensified pollution of water bodies [41,45]. Although the historical pollution indicator species in the Chai River, such as Limnodrilus, Chironomus, and Branchiura [22], were not dominant genera in our research, Macrothrix was the most dominant genus both in the dry and wet periods, and the abundance of Polyarthra and Cricotopus remained relatively high. These findings implied that the water ecological environment of the Chai River has improved to a certain extent as water pollution treatment measures such as the “flower ban and vegetable reduction” and the “four withdrawals and three returns” [46] have been implemented, but the pollution of the Chai River was still serious, as shown by the population explosion and continuous agricultural activities, and it is much more serious in the wet period due to the large amount of agricultural non-point pollution sources, accompanied by high precipitation [20].

4.2. Invertebrate Diversity Patterns in the Chai River Were Shaped by Environmental Factors

Environmental factors play a critical role in regulating the growth and reproduction of invertebrates. Nutrients, for instance, influence zooplankton communities by altering species composition, dominant taxa, and abundance—both indirectly through stimulating phytoplankton growth and directly via osmotic and ion regulation mechanisms [47,48,49,50]. Similarly, the temperature and nutrient availability directly affect the growth and reproduction of arthropods and chironomids or indirectly influence them through trophic interactions such as phytoplankton dynamics [17,41,45,51]. Spatial and seasonal variations in invertebrate diversity within the Chai River, as reflected by the Shannon index and PERMANOVA results, are likely driven by differences in surrounding environmental conditions and seasonal fluctuations. Unlike simple longitudinal zonation (upper, middle, lower reaches), the biodiversity distribution in agricultural rivers like the Chai is closely tied to local environmental factors, which are strongly mediated by human activities [18,21]. The river is subject to substantial anthropogenic pressure, including rural domestic sewage, pesticide and fertilizer runoff, and agricultural waste [20,21]. Furthermore, situated in a phosphorus-rich mining area, the Chai River receives additional phosphorus inputs through surface runoff—especially during wet periods—exacerbating its nutrient pollution [25]. Numerous studies have established significant correlations between environmental variables (e.g., COD, C, DO, TP) and the relative abundance of specific invertebrate genera [47,52,53,54,55], reinforcing the observed diversity gradients along spatiotemporal scales.
Total nitrogen and total phosphorus levels are some of the important indexes to measure the degree of nutrient pollution in a water body. According to the China Surface Water Environmental Quality Standard (GB3838-2002 [56]), total nitrogen (TN) levels of 1.5 mg/L indicate class Ⅳ water quality, while total phosphorus (TP) levels between 0.2 mg/L and 0.3 mg/L also correspond to Class Ⅳ water quality. COD is an important indicator to measure the relative content of organic matter in water: Class Ⅲ water ≤ 20 mg/L, class Ⅳ water ≤ 30 mg/L. Generally, higher values indicate poorer water quality. As an agricultural river, intensifying human activities are placing unprecedented pressures on the Chai River. Previous studies have shown that the lowest TN value was 0.52 mg/L, with a maximum of 27.2 mg/L, while TP values ranged between 0.116 and 0.616 mg/L, and the COD value was up to 25 mg/L. If classified by TN levels, the water would be deemed sub-class V quality, whereas by COD, it is class Ⅳ water. The continuously high levels of TP, TN, and COD in the Chai River constantly influenced aquatic biological communities and diversity [19,21,23]. This study revealed spatiotemporal heterogeneity in the relationship between invertebrate communities and environmental factors, with significant variations in the influence of factors such as COD, WT, C, and Chl-a across sites and periods (Figure 5 and Figure 6). These shifts in environmental conditions alter the abundance of key invertebrate taxa, ultimately reshaping the community structure. COD is a key indicator of organic pollution, and variations in COD can significantly affect the zooplankton community, such as the abundance of Macrothrix, Keratella, and Brachionus, or indirectly affect invertebrates by influencing other biological groups through food web interactions [37,52,55]. The temperature also regulates invertebrate growth directly and indirectly via trophic cascades [17,50]. Conductivity, reflecting ion concentrations, influences zoobenthos through osmotic balance and energy metabolism and often reduces diversity among sensitive species when elevated [54,57]. Chlorophyll-a, representing phytoplankton biomass, serves as a food source for zooplankton and is shaped by nutrient inputs (e.g., TN, TP), thereby indirectly affecting invertebrate assemblages [44,54,58].
In this study, COD and WT were the primary stressors during the dry season, whereas Chl-a and conductivity dominated during the wet season (Figure 5 and Figure 6). Notably, Macrothrix showed a positive correlation with Chl-a, while Euchlanis, Paratrichocladius, and Sulcospira were negatively correlated. Similarly, Cricotopus and Paratanytarsus were negatively associated with COD (|r| > 0.5, p < 0.01; Figure 7, Table S3). High Chl-a concentrations indicate abundant algal food resources, which promote herbivorous zooplankton such as through Macrothrix population growth. High COD levels are often accompanied by reduced dissolved oxygen, deteriorating the benthic habitat and leading to a decline in the Arthropod abundance such as Cricotopus [54,57]. These responses are closely related to their respective ecological roles and physiological tolerances, thereby affecting community structures. These findings align with the spatial and seasonal pollution patterns in the Chai River [20], highlighting the complex interplay between human-altered environmental conditions and aquatic biodiversity.

5. Conclusions

Based on eDNA metabarcoding, this study revealed a diverse invertebrate community in the Chai River, comprising 873 ASVs from nine phyla, Annelida, Arthropoda, Cnidaria, Gastrotricha, Mollusca, Nematoda, Platyhelminthes, Protozoa, and Rotifera, with Arthropoda representing the overwhelmingly dominant group. The composition of these communities exhibited clear spatial and seasonal dynamics, reflected in variations in ASV richness, dominant genera, and their relative abundances. Notably, 47 genera were detected during the dry period and 55 during the wet period, with Macrothrix and Acanthamoeba being consistently identified as the first and second most dominant genera across both periods. Spatial–seasonal heterogeneity of the relation between the invertebrate communities and environmental factors was observed in the Chai River. WT, COD, C, and Chl-a were deemed to be the crucial environmental factors influencing the distributions of the invertebrate communities in the Chai River. This study emphasized that although the water quality may have been improved, the water ecological environment of the Chai River is still in a severe situation, and management and conservation should be sustained, especially by controlling COD and C levels.

Supplementary Materials

The following supporting information can be downloaded at https://www.mdpi.com/article/10.3390/d17090660/s1, Figure S1: Rarefaction curves of COI metabarcoding. Table S1: ASVs table. Table S2: Correlation analysis between invertebrate community structures and environmental factors. Table S3: Spearman’s correlation analysis between relative abundances of specific genera and environmental factors.

Author Contributions

Developing methods: L.S. and J.X. Conducting research: X.C., S.X. and Z.Z. Data analysis: Y.L. and J.X. Data interpretation: X.C., S.X., Y.L. and J.X. Preparation of figures and tables: Y.L. and J.X. Writing: Y.L. and Z.Z. All authors have read and agreed to the published version of the manuscript.

Funding

This work was supported by the Basic Research Program-Youth Program of Science and Technology Department in Yunnan province (No. 202201AU070026), Joint Project of Local Universities in Yunnan Province (202301BA070001-005), Kunming University Talent Program (No.YJL23015) and “Ten Thousand Plan” Youth Top-Notch Talents Special Project, the International Joint Innovation Team for Yunnan Plateau Lakes and Laurentian Great Lakes, and Yunnan Collaborative Innovation Centre for Plateau Lake Ecology and Environmental Health. Scientific Research Fund Project of Yunnan Provincial Education Department (2025Y1092).

Institutional Review Board Statement

The manuscript presents research on animals that do not require ethical approval for the study.

Data Availability Statement

Raw sequencing data were deposited in the NCBI Bioproject database (accession number: PRJNA1267849).

Conflicts of Interest

The authors declare no conflicts of interest.

References

  1. Cardinale, B.J.; Duffy, J.E.; Gonzalez, A.; Hooper, D.U.; Perrings, C.; Venail, P.; Narwani, A.; Mace, G.M.; Tilman, D.; Wardle, D.A.; et al. Biodiversity loss and its impact on humanity. Nature 2012, 486, 59–67. [Google Scholar] [CrossRef]
  2. Liu, W.; Zhan, J.Y.; Zhao, F.; Yan, H.M.; Zhang, F.; Wei, X.Q. Impacts of urbanization-induced land-use changes on ecosystem services: A case study of the Pearl River Delta Metropolitan Region, China. Ecol. Indic. 2019, 98, 228–238. [Google Scholar] [CrossRef]
  3. Vörösmarty, C.J.; McIntyre, P.B.; Gessner, M.O.; Dudgeon, D.; Prusevich, A.; Green, P.; Glidden, S.; Bunn, S.E.; Sullivan, C.A.; Liermann, C.R.; et al. Global threats to human water security and river biodiversity. Nature 2010, 467, 555–561. [Google Scholar] [CrossRef]
  4. WWF. Living Planet Report 2020—Bending the Curve of Biodiversity Loss; Almond, R.E.A., Grooten, M., Petersen, T., Eds.; WWF: Gland, Switzerland, 2020. [Google Scholar]
  5. Mace, G.M.; Norris, K.; Fitter, A.H. Biodiversity and ecosystem services: A multilayered relationship. Trends Ecol. Evol. 2012, 27, 19–26. [Google Scholar] [CrossRef]
  6. Li, F.; Qin, S.; Wang, Z.; Zhang, Y.; Yang, Z. Environmental DNA metabarcoding reveals the impact of different land use on multitrophic biodiversity in riverine systems. Sci. Total Environ. 2023, 855, 158958. [Google Scholar] [CrossRef]
  7. Miloslavich, P.; Bax, N.J.; Simmons, S.E.; Klein, E.; Appeltans, W.; Aburto-Oropeza, O.; Garcia, M.A.; Batten, S.D.; Benedetti-Cecchi, L.; Checkley, D.M.; et al. Essential ocean variables for global sustained observations of biodiversity and ecosystem changes. Glob. Change Biol. 2018, 24, 2416–2433. [Google Scholar] [CrossRef]
  8. Foulquier, A.; Datry, T.; Corti, R.; von Schiller, D.; Tockner, K.; Stubbington, R.; Gessner, M.O.; Boyer, F.; Ohlmann, M.; Thuiller, W.; et al. Unravelling large-scale patterns and drivers of biodiversity in dry rivers. Nat. Commun. 2024, 15, 7233. [Google Scholar] [CrossRef]
  9. Macher, T.-H.; Beermann, A.J.; Arle, J.; Foerster, J.; Greyer, M.; Mora, D.; Koschorreck, J.; Rolauffs, P.; Rother, A.; Schüler, S.; et al. Fit for purpose? Evaluating benthic invertebrate DNA metabarcoding for ecological status class assessment in streams under the Water Framework Directive. Water Res. 2025, 272, 122987. [Google Scholar] [CrossRef] [PubMed]
  10. Tang, S.; Wang, Q.; Liu, L.; Yang, Y. Biodiversity of aquatic invertebrates based on environmental DNA metabarcoding technology: A case study of Lake Haizhu in Guangzhou. J. Lake Sci. 2023, 35, 1443–1456. [Google Scholar] [CrossRef]
  11. Collier, K.J.; Probert, P.K.; Jeffries, M. Conservation of aquatic invertebrates: Concerns, challenges and conundrums. Aquat. Conserv. Mar. Freshw. Ecosyst. 2016, 26, 817–837. [Google Scholar] [CrossRef]
  12. Hodkinson, I.D.; Jackson, J.K. Terrestrial and Aquatic Invertebrates as Bioindicators for Environmental Monitoring, with Particular Reference to Mountain Ecosystems. Environ. Manag. 2005, 35, 649–666. [Google Scholar] [CrossRef]
  13. Morrissey, C.A.; Mineau, P.; Devries, J.H.; Sanchez-Bayo, F.; Liess, M.; Cavallaro, M.C.; Liber, K. Neonicotinoid contamination of global surface waters and associated risk to aquatic invertebrates: A review. Environ. Int. 2015, 74, 291–303. [Google Scholar] [CrossRef]
  14. Hou, L.; Xiong, W.; Chen, M.; Xu, J.; Johnson, A.C.; Zhan, A.; Jin, X. Pesticide Pollution Reduces the Functional Diversity of Macroinvertebrates in Urban Aquatic Ecosystems. Environ. Sci. Technol. 2025, 59, 8568–8577. [Google Scholar] [CrossRef]
  15. Wang, H.; García Molinos, J.; Heino, J.; Zhang, H.; Zhang, P.; Xu, J. Eutrophication causes invertebrate biodiversity loss and decreases cross-taxon congruence across anthropogenically-disturbed lakes. Environ. Int. 2021, 153, 106494. [Google Scholar] [CrossRef] [PubMed]
  16. Ji, F.; Han, D.; Yan, L.; Yan, S.; Zha, J.; Shen, J. Assessment of benthic invertebrate diversity and river ecological status along an urbanized gradient using environmental DNA metabarcoding and a traditional survey method. Sci. Total Environ. 2022, 806, 150587. [Google Scholar] [CrossRef] [PubMed]
  17. Wang, Y. A Study on Spatiotemporal Pattern of Species and Functional Diversity of Macroinvertebrates in the Mainstream of Yangtze River. Master’s Thesis, Nanjing Agricultural University, Nanjing, China, 2022. [Google Scholar] [CrossRef]
  18. Frau, D.; Gutierrez, M.F.; Regaldo, L.; Saigo, M.; Licursi, M. Plankton community responses in Pampean lowland streams linked to intensive agricultural pollution. Ecol. Indic. 2021, 120, 106934. [Google Scholar] [CrossRef]
  19. Li, X.; Yang, S.; Zhang, Y.; Zhao, S.; Gao, L.; Xu, T. Planktonic algae diversity and its water quality monitoring in Chai River, Baoxiang River and Panlong River, three inflow river of Dianchi Lake. J. Yunnan Univ. (Nat. Sci.) 2014, 36, 950–958. [Google Scholar] [CrossRef]
  20. Zhang, X. The impacts of characteristic pollution sources on the water quality and plankton communities of Inflowing Rivers in Dianchi Lake Basin. Master’s Thesis, Shanghai Jiao Tong University, Shanghai, China, 2016. [Google Scholar] [CrossRef]
  21. Lv, J.; Lin, Y.; Zhao, Z.; Zhou, X. eDNA metabarcoding revealed the seasonal and spatial variation of phytoplankton functional groups in the Chai river and their relationship with environmental factors. J. Freshw. Ecol. 2023, 38, 2176374. [Google Scholar] [CrossRef]
  22. Gao, Z.; Cao, X.; Fan, H.; Jiang, D.; Huang, Y. Influence of Hydromorphological Factors on Macrozoobenthic Communities in Streams of Lake Dianchi Basin in the Wet Season. Ecol. Environ. Sci. 2015, 24, 1209–1215. [Google Scholar] [CrossRef]
  23. Wen, H.; Cai, J.; Su, Y.; Sun, J.; Huang, Y.; Zhang, Y. Identification of water pollution factors and their spatial distribution with aquatic bioindicators in streams of Lake Dianchi watershed. Acta Entiae Circumstantiae 2011, 31, 69–80. [Google Scholar] [CrossRef]
  24. Mauro, M.; Longo, F.; Lo Valvo, M.; Vizzini, A.; Di Grigoli, A.; Radovic, S.; Arizza, V.; Vecchioni, L.; La Paglia, L.; Queiroz, V.; et al. The Use of Environmental DNA as Preliminary Description of Invertebrate Diversity in Three Sicilian Lakes. Animals 2025, 15, 355. [Google Scholar] [CrossRef]
  25. Kong, Y.; He, S.; Hu, B.; Yu, X.; Zhou, S.; He, Y. The settlement and transfer rule of phosphorus in stormwater runoff from phosphorus rich area in Dianchi watershed. Acta Sci. Circumstantiae 2012, 32, 2160–2166. [Google Scholar] [CrossRef]
  26. The State Environmental Protection Administration; The Water and Wastewater Monitoring Analysis Method Editorial Board. Water and Wastewater Monitoring Analysis Method, 4th ed.; China Environmental Science Press: Beijing, China, 2002; pp. 88–114. [Google Scholar]
  27. Leray, M.; Yang, J.Y.; Meyer, C.P.; Mills, S.C.; Agudelo, N.; Ranwez, V.; Boehm, J.T.; Machida, R.J. A new versatile primer set targeting a short fragment of the mitochondrial COI region for metabarcoding metazoan diversity: Application for characterizing coral reef fish gut contents. Front. Zool. 2013, 10, 14. [Google Scholar] [CrossRef]
  28. Macher, T.-H.; Arle, J.; Beermann, A.J.; Frank, L.; Hupało, K.; Koschorreck, J.; Schütz, R.; Leese, F. Is it worth the extra mile? Comparing environmental DNA and RNA metabarcoding for vertebrate and invertebrate biodiversity surveys in a lowland stream. PeerJ 2024, 12, e18016. [Google Scholar] [CrossRef]
  29. Hou, T.; Lu, S.; Shao, J.; Dong, X.; Yang, Z.; Yang, Y.; Yao, D.; Lin, Y. Assessment of planktonic community diversity and stability in lakes and reservoirs based on eDNA metabarcoding—A case study of Minghu National Wetland Park, China. Environ. Res. 2025, 271, 121025. [Google Scholar] [CrossRef]
  30. Zhang, Z.; Bao, Y.; Fang, X.; Ruan, Y.; Rong, Y.; Yang, G. A circumpolar study of surface zooplankton biodiversity of the Southern Ocean based on eDNA metabarcoding. Environ. Res. 2024, 255, 119183. [Google Scholar] [CrossRef] [PubMed]
  31. Aunins, A.A.; Mueller, S.J.; Fike, J.A.; Cornman, R.S. Assessing arthropod diversity metrics derived from stream environmental DNA: Spatiotemporal variation and paired comparisons with manual sampling. PeerJ 2023, 11, e15163. [Google Scholar] [CrossRef] [PubMed]
  32. Smaoune, G.; Bouchelouche, D.; Taleb, A.; Arab, A. Evaluation of the trophic status in three reservoirs in Algeria (north west) using physicochemical analysis and rotifers structure. Environ. Sci. Pollut. Res. 2020, 28, 46627–46642. [Google Scholar] [CrossRef]
  33. Chang, C.; Ren, M.; Wang, H.; Ye, S.; Tang, X.; He, D.; Hu, E.; Li, M.; Pan, B. Riverine network size determined major driving factors of the composition and diversity of aquatic invertebrate communities in a multi-tributary mountain river basin. Water Res. 2025, 276, 123257. [Google Scholar] [CrossRef] [PubMed]
  34. Li, Z.; Jiang, X.; Wang, J.; Liu, Z.; Zhang, J.; Xiong, X.; Xie, Z. Species diversity and maintenance mechanisms of macroinvertebrates in the water source area of the middle route of the South-to-North Water Diversion Project. J. Lake Sci. 2023, 35, 2059–2070. [Google Scholar]
  35. Perry, W.B.; Seymour, M.; Orsini, L.; Jâms, I.B.; Milner, N.; Edwards, F.; Harvey, R.; de Bruyn, M.; Bista, I.; Walsh, K.; et al. An integrated spatio-temporal view of riverine biodiversity using environmental DNA metabarcoding. Nat. Commun. 2024, 15, 4372. [Google Scholar] [CrossRef]
  36. Noskov, Y.A.; Manasypov, R.M.; Ermolaeva, N.I.; Antonets, D.V.; Shirokova, L.S.; Pokrovsky, O.S. Environmental factors controlling seasonal and spatial variability of zooplankton in thermokarst lakes along a permafrost gradient of Western Siberia. Sci. Total Environ. 2024, 922, 171284. [Google Scholar] [CrossRef]
  37. Zhao, L.; Zhang, X.; Xu, M.; Mao, Y.; Huang, Y. DNA metabarcoding of zooplankton communities: Species diversity and seasonal variation revealed by 18S rRNA and COI. PeerJ 2021, 9, e11057. [Google Scholar] [CrossRef] [PubMed]
  38. Pinol, J.; Mir, G.; Gomez-Polo, P.; Agusti, N. Universal and blocking primer mismatches limit the use of high-throughput DNA sequencing for the quantitative metabarcoding of arthropods. Mol. Ecol. Resour. 2015, 15, 819–830. [Google Scholar] [CrossRef] [PubMed]
  39. Zhang, Y.; Qiu, Y.; Liu, K.; Zhong, W.; Yang, J.; Altermatt, F.; Zhang, X. Evaluating eDNA and eRNA metabarcoding for aquatic biodiversity assessment: From bacteria to vertebrates. Environ. Sci. Ecotechnol. 2024, 21, 100441. [Google Scholar] [CrossRef] [PubMed]
  40. Xiong, W.; Ni, P.; Chen, Y.; Gao, Y.; Shan, B.; Zhan, A. Zooplankton community structure along a pollution gradient at fine geographical scales in river ecosystems: The importance of species sorting over dispersal. Mol. Ecol. 2017, 26, 4351–4360. [Google Scholar] [CrossRef]
  41. Hirabayashi, K.; Yoshizawa, K.; Yoshida, N.; Kazama, F. Progress of eutrophication and change of chironomid fauna in Lake Yamanakako, Japan. Limnology 2004, 5, 47–53. [Google Scholar] [CrossRef]
  42. Wang, T.; Peng, M.; Li, L.; He, Q.; Wu, Z.; Xi, Y.; Tan, F.; Gao, L.; Chai, Y. Community structure characteristics of zooplankton and comprehensive evaluation of water quality in Xiaowan Reservoir area of Lancang River. Freshw. Fish. 2022, 52, 9–17. [Google Scholar] [CrossRef]
  43. García-Chicote, J.; Armengol, X.; Rojo, C. Zooplankton species as indicators of trophic state in reservoirs from Mediterranean river basins. Inland Waters 2019, 9, 113–123. [Google Scholar] [CrossRef]
  44. Yang, J.; Chen, D.; Huang, L.; Li, Y.; Dong, J.; Huang, C.; Wang, C.; Liu, Y.; Du, J.; Pan, M. Patterns and the determinants of zooplankton community stability in different regions of Lake Dianchi, Yunnan Province, China. J. Lake Sci. 2023, 35, 1752–1766. [Google Scholar] [CrossRef]
  45. Zhou, D.; Zhang, W.; Zhu, L.; Qi, X.; Wang, L.; Zhang, R. Community structure of Chironomid larvae and their indicative significance for water quality in streams of Xianju National Park, China. Chin. J. Appl. Ecol. 2018, 29, 3857–3866. [Google Scholar] [CrossRef]
  46. Liu, R.; Zhu, L.; Lei, K. Analysis of the Comprehensive Management Effects of the Yunnan Lake Inflow Rivers during the 11th Five-Year Plan Period. Environ. Pollut. Prev. 2012, 34, 95–100. [Google Scholar] [CrossRef]
  47. Zhang, T.-X.; Li, M.-R.; Liu, C.; Wang, S.-P.; Yan, Z.-G. A review of the toxic effects of ammonia on invertebrates in aquatic environments. Environ. Pollut. 2023, 336, 122374. [Google Scholar] [CrossRef] [PubMed]
  48. Jurczak, T.; Wojtal-Frankiewicz, A.; Frankiewicz, P.; Kaczkowski, Z.; Oleksińska, Z.; Bednarek, A.; Zalewski, M. Comprehensive approach to restoring urban recreational reservoirs. Part 2—Use of zooplankton as indicators for the ecological quality assessment. Sci. Total Environ. 2019, 653, 1623–1640. [Google Scholar] [CrossRef] [PubMed]
  49. Ersoy, Z.; Abril, M.; Cañedo-Argüelles, M.; Espinosa, C.; Vendrell-Puigmitja, L.; Proia, L. Experimental assessment of salinization effects on freshwater zooplankton communities and their trophic interactions under eutrophic conditions. Environ. Pollut. 2022, 313, 120127. [Google Scholar] [CrossRef]
  50. Ger, K.A.; Urrutia-Cordero, P.; Frost, P.C.; Hansson, L.-A.; Sarnelle, O.; Wilson, A.E.; Lürling, M. The interaction between cyanobacteria and zooplankton in a more eutrophic world. Harmful Algae 2016, 54, 128–144. [Google Scholar] [CrossRef]
  51. Yang, Y.; Ci, F.; Xu, A.; Zhang, X.; Ding, N.; Wan, N.; Lv, Y.; Song, Z. Seasonal Dynamics of Eukaryotic Microbial Communities in the Water-Receiving Reservoir of the Long-Distance Water Diversion Project, China. Microorganisms 2024, 12, 1873. [Google Scholar] [CrossRef]
  52. Sharma, J.; Behera, P.K. Abundance & distribution of aquatic benthic macro-invertebrate families of river Ganga and correlation with environmental parameters. Environ. Monit. Assess. 2022, 194, 546. [Google Scholar] [CrossRef]
  53. Galic, N.; Hawkins, T.; Forbes, V.E. Adverse impacts of hypoxia on aquatic invertebrates: A meta-analysis. Sci. Total Environ. 2019, 652, 736–743. [Google Scholar] [CrossRef] [PubMed]
  54. Chen, Z. Relationship between Community Structure of Four Aquatic Organisms and Environmental Factors in Xishui National Nature Reserve, Guizhou Province. Master’s Thesis, Guizhou Normal University, Guiyang, China, 2024. [Google Scholar] [CrossRef]
  55. Cen, F.; Xu, S.; Yin, G.; Dong, M. Metabarcoding of zooplankton communities of Dianchi Lake based on the mitochondrial cytochrome oxidase subunit 1 gene. Front. Microbiol. 2024, 14, 1291632. [Google Scholar] [CrossRef]
  56. GB 3838-2002; Environmental Quality Standards for Surface Water. The State Environmental Protection Administration, & The State Administration of Quality Supervision Inspection and Quarantine; China Environmental Science Press: Beijing, China, 2002.
  57. Zhang, Y.; Ding, S.; Zhao, Q.; Gao, X.; Zhao, R.; Meng, W. Exploring the feasibility of establishing conductivity criteria for macroinvertebrate based on the field investigations 2015. Asian J. Ecotoxicol. 2015, 10, 204–214. (In Chinese) [Google Scholar] [CrossRef]
  58. Qiu, X.; Liu, X.; Lu, Q.; Chen, J.; Liang, T.; Wang, W.; Ouyang, S.; Zhou, C.; Wu, X. Seasonal and spatial variability of zooplankton diversity in the Poyang Lake Basin using DNA metabarcoding. Ecol. Evol. 2022, 12, e8972. [Google Scholar] [CrossRef] [PubMed]
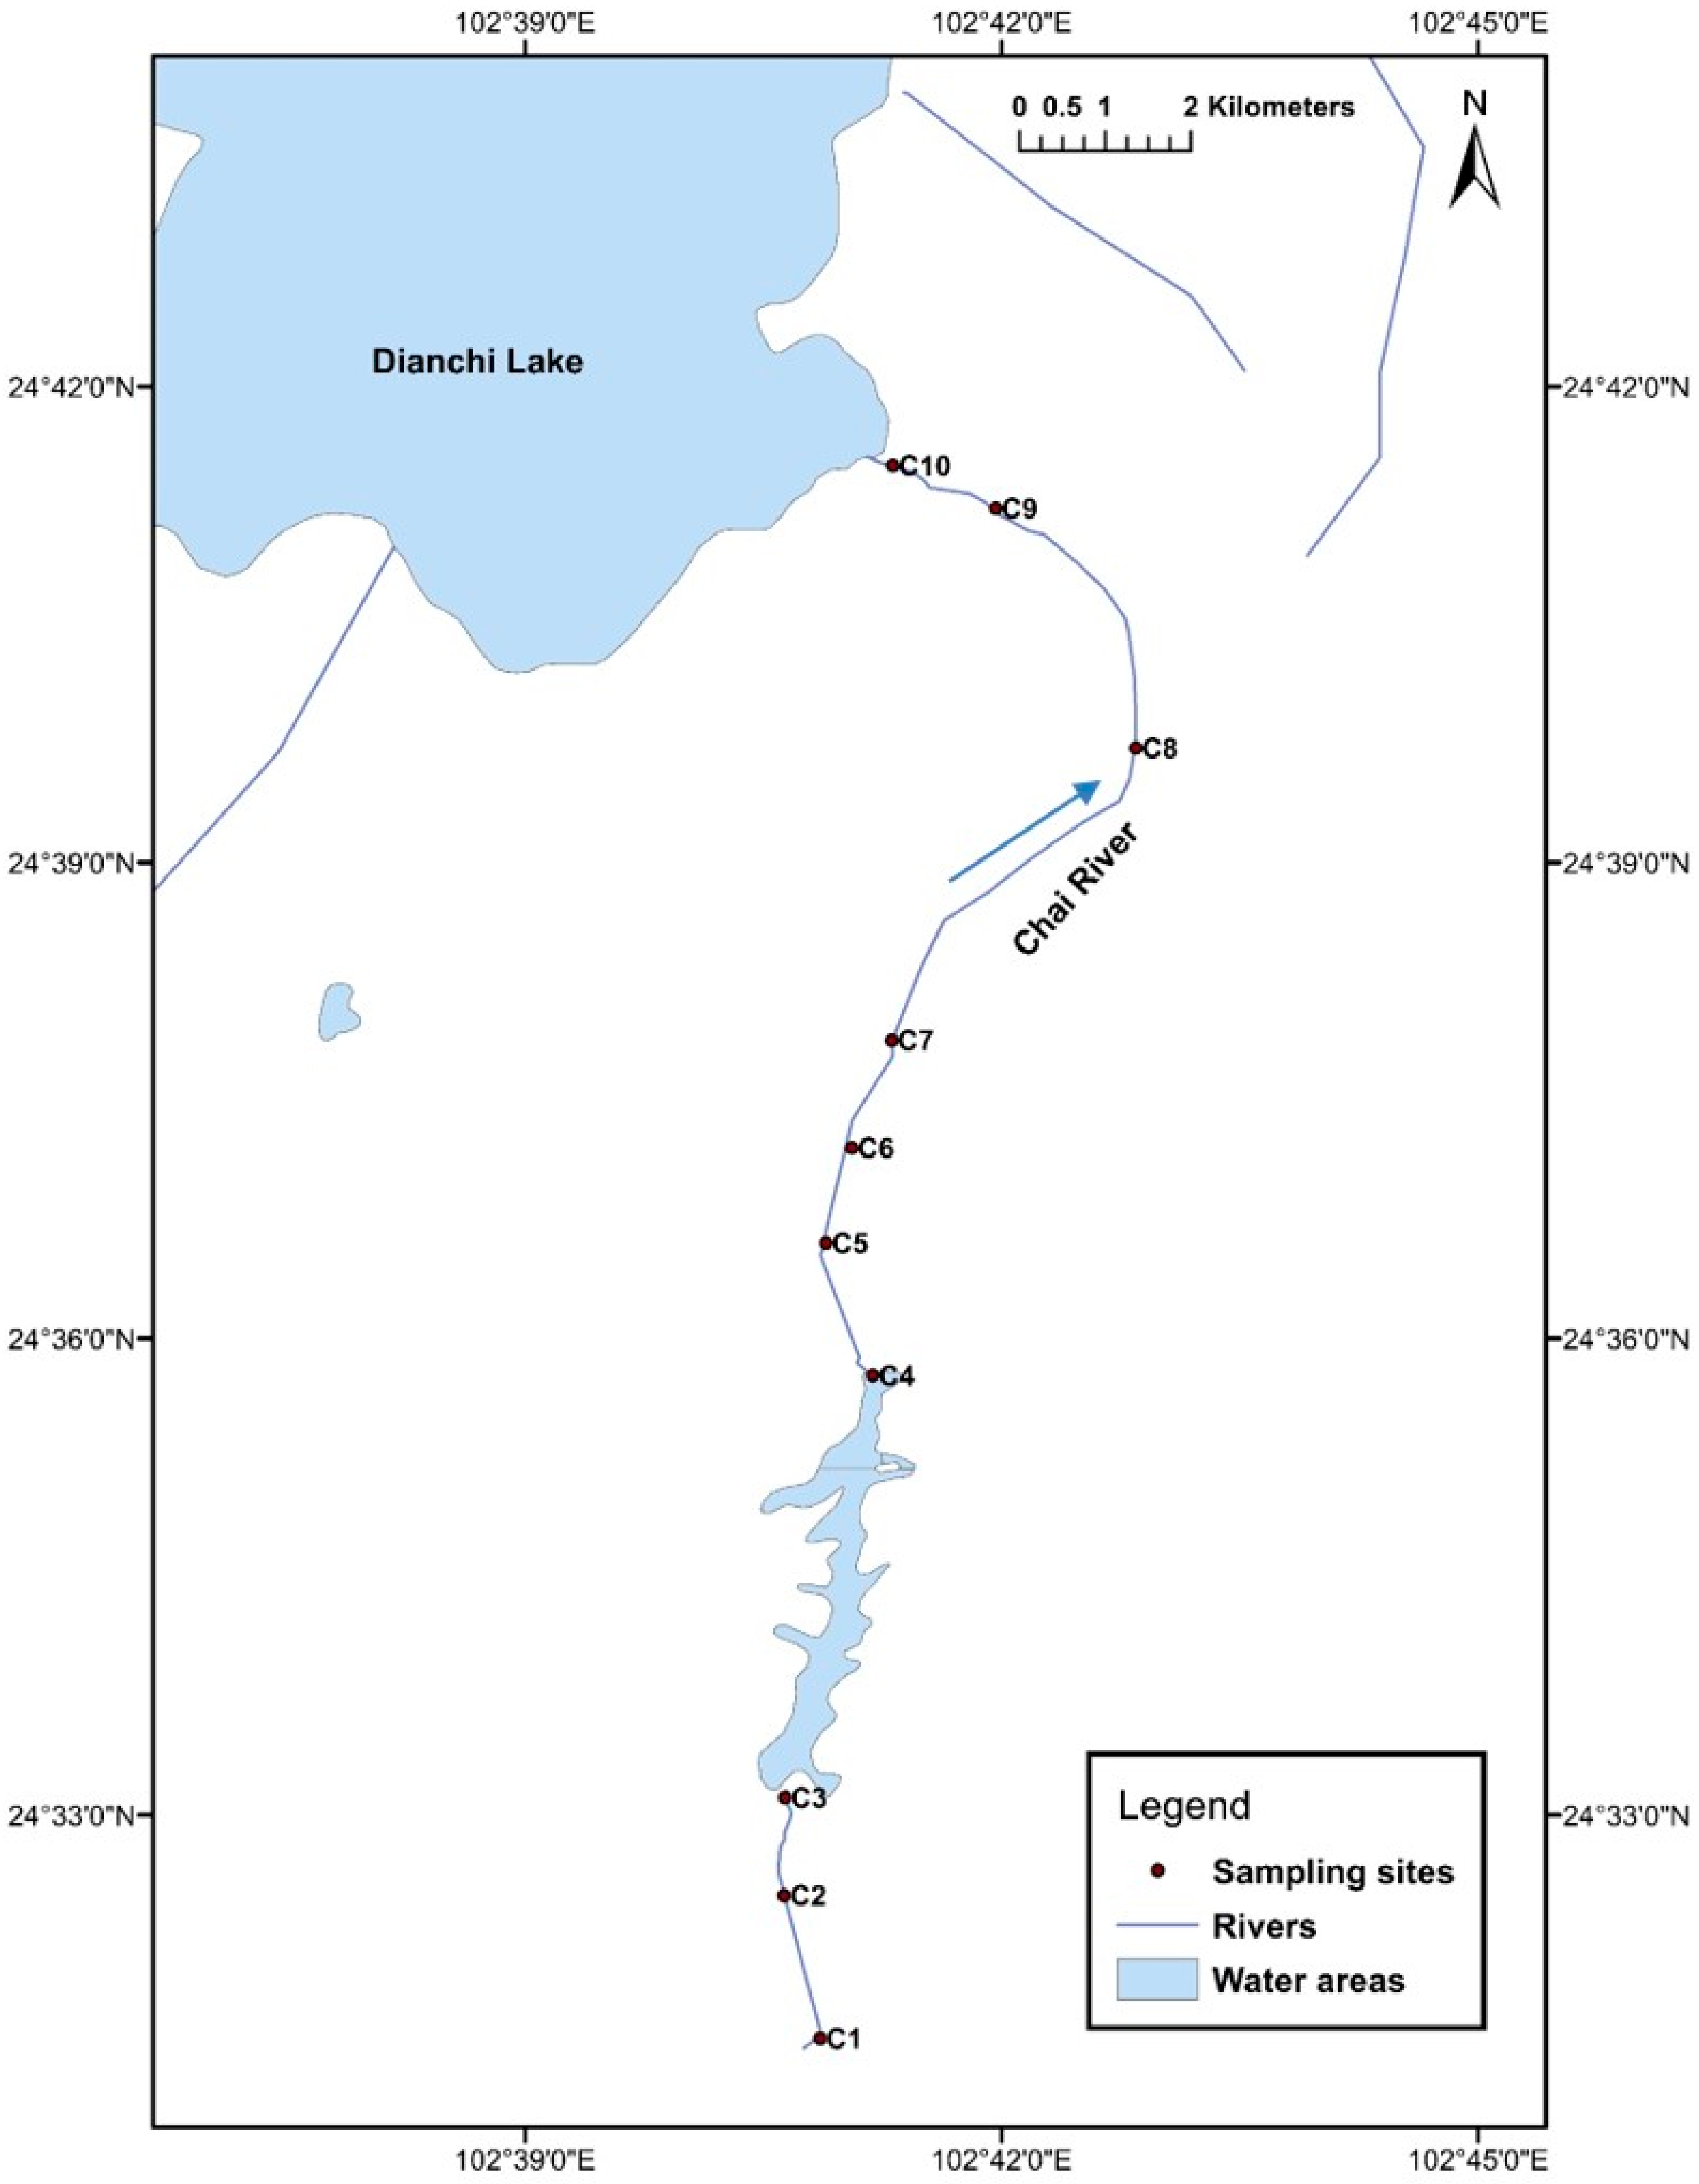
Figure 1. Map of sampling location distribution.
Diversity 17 00660 g001
Figure 2. Community composition of invertebrates in the Chai River at the phylum level. (A) Dry period; (B) wet period. The percentage indicates the relative abundance of reads. The number of ASVs in each phylum is labeled in parentheses.
Diversity 17 00660 g002
Figure 3. Spatial and seasonal distribution of the invertebrate communities in the Chai River in the dry period (A) and wet period (B) using the relative abundances of the top 20 abundant genera.
Diversity 17 00660 g003
Figure 4. Alpha diversity in the Chai River. (A) The Shannon-Wiener index; (B) α−diversity difference between Dry and Wet periods. ns means non-significant, p > 0.05.
Diversity 17 00660 g004
Figure 5. RDA ordination plot illustrating the relationships between invertebrate communities and environmental factors in the Chai River in the dry period. (Significant terms are marked as follows: * 0.01 < p < 0.05; ** p < 0.01. and *** p <0.001)).
Diversity 17 00660 g005
Figure 6. RDA ordination plot illustrating the relationships between invertebrate communities and environmental factors in the Chai River in the wet period. ( Significant terms are marked as follows: * 0.01 < p < 0.05; ** p < 0.01. and *** p <0.001)).
Diversity 17 00660 g006
Figure 7. Correlation cluster analysis between environmental factors and the relative abundances of invertebrate genera (top 20). Significant terms are marked as follows: * 0.01 < p < 0.05; ** p < 0.01.
Diversity 17 00660 g007
Table 1. The spatial and seasonal variations in invertebrate communities were evaluated using PERMANOVA tests with 999 permutations. (Significant terms: ** 0.001 < p ≤ 0.01; *** p ≤0.001).
GroupsSumsOfSqsMeanSqsF.ModelR2p ValueSignificance
Wet period_vs._Dry period3.0664943.0664948.7277250.1437190.001***
(Dry period) up_vs._middle0.957460.957463.9244410.1969660.002**
(Dry period) up_vs._down1.3807411.3807414.7744320.2008220.001***
(Dry period) middle_vs._down0.8358960.8358963.3492110.2048550.01**
(Wet period) up_vs._middle1.3514981.3514984.4075220.2159750.001***
(Wet period) up_vs._down1.557371.557375.6407740.2606550.001***
(Wet period) middle_vs._down1.4447991.4447994.4241170.2166120.001***
Disclaimer/Publisher’s Note: The statements, opinions and data contained in all publications are solely those of the individual author(s) and contributor(s) and not of MDPI and/or the editor(s). MDPI and/or the editor(s) disclaim responsibility for any injury to people or property resulting from any ideas, methods, instructions or products referred to in the content.