Article

Tachinid Flies (Diptera), Caterpillar Hosts (Lepidoptera) and Their Food Plants, Reared in Área de Conservación Guanacaste (ACG), Northwestern Costa Rica: Documenting Community Structure with the Aid of DNA Barcodes

1
Integrative Insect Ecology Research Unit, Department of Biology, Faculty of Science, Chulalongkorn University, Bangkok 10330, Thailand
2
School of Biological Sciences, King Henry Building, University of Portsmouth, King Henry Street, Portsmouth PO1 2DY, UK
3
Canadian National Collection of Insects, Ottawa, ON K1A 0C6, Canada
4
Agricultural Research Service, U.S. Department of Agriculture, Smithsonian Institution, NHB-168, Washington, DC 20560, USA
5
Centre for Biodiversity Genomics, Guelph, ON N1G 2W1, Canada
6
Department of Integrative Biology, University of Guelph, Guelph, ON N1G 2W1, Canada
7
Guanacaste Dry Forest Conservation Fund, Área de Conservación Guanacaste, Apartado 169-5000, Costa Rica
8
The Hymenoptera Institute, 1100 Pepperhill Circle, Lexington, KY 40502, USA
9
Department of Biology, University of Pennsylvania, Philadelphia, PA 19104, USA
10
Department of Entomology, University Illinois Urbana-Champaign, Urbana, IL 61801, USA
*
Author to whom correspondence should be addressed.
Deceased.
Diversity 2025, 17(9), 658; https://doi.org/10.3390/d17090658
Submission received: 16 August 2025 / Revised: 30 August 2025 / Accepted: 5 September 2025 / Published: 20 September 2025
(This article belongs to the Special Issue DNA Barcodes for Evolution and Biodiversity—2nd Edition)

Abstract

We describe the trophic relationships of tachinid parasitoid flies that attack exophagous, leaf-eating Lepidoptera caterpillars in Área de Conservación Guanacaste (ACG), northwestern Costa Rica over approximately forty years beginning in 1984. The dataset contains more than 34,000 individual tachinid rearings from individual wild-caught caterpillars. Identification of parasitoids and caterpillars up until 2004 was based entirely on morphology. From 2004 onwards most reared specimens were DNA-barcoded and some retroactive barcoding was also carried out with varying degrees of success. Generally, for older specimens, generating good quality-barcodes requires more expensive protocols. Barcoding of reared specimens led to the recognition that many morpho-species were made up of multiple species of flies but those reared from an individual caterpillar were 99.95% a single species. Consequently, estimates of diet breadth of caterpillars and tachinids changed considerably after 2003. The data analysed here were pruned to include only rearings with complete host and food plant data and excluded potentially duplicated rearings and ones whose identification could not be confidently assigned. The cleaned dataset includes 13,735 independent rearings. Chao1 estimates of numbers of tachinid, caterpillar and food plant species suggest that species sampling is 86, 70 and 91 percent complete, respectively. However, this was not the case for bi- and tritrophic interactions which increased linearly with effort. We show that while the tachinids of ACG are more host-specialised than was expected prior to the combined efforts of rearing and barcoding, they have broader host ranges and higher host Shannon diversity indices than either Braconidae or Ichneumonidae. This may be attributable to the effects of the induced host-derived sac enclosing the larvae and their posterior spiracles.

1. Introduction

It is well known that the tropics are home to an enormous species richness of insects and this includes the Tachinidae, a large parasitoid family [1]. One of the best studied countries in this regard is Costa Rica, where large research programmes have been established in several places, particularly Área de Conservación Guanacaste (ACG) in the northwestern portion of the country [2,3,4,5,6] and La Selva, a smaller protected area of rain in the northeast [7,8,9].
Tachinids comprise exclusively koinobiont parasitoids of other arthropods, predominantly of insects. They are also one of the most species-rich families in the Diptera with more than 10,000 described species [10] in over 1000 genera, 76% of these being from the Neotropics [11]. Many species are difficult to identify morphologically [12]. The great majority of tachinid species are parasitoids of exophagous, leaf-eating (not-leaf- or stem-mining) caterpillars especially when it comes to members of the two largest tachinid subfamilies, Exoristinae (Figure 1A) and Tachininae (Figure 1D), although exophagous leaf-eaters are also hosts of quite a few species of Dexiinae (Figure 1B,C) many species of the latter are parasitoids of Coleoptera larvae. It is worth noting that the systematic placements of some genera have not been stable [13] and here we follow the recent multi-gene molecular phylogeny [14] and checklist of world Tachinidae [11].
Tachinid taxonomy is challenging and identification of specimens based only on morphology, especially when it comes to highly species-rich tropical faunas, often fails to distinguish separate but morphologically very similar groups of cryptic species, often with different hosts, e.g., [15,16]. To date, more than 850,000 caterpillars have been reared. The ACG caterpillar-rearing programme which started in 1978 [17] has resulted in the discovery of numerous new species and genera, both in the Tachinidae (e.g., [18,19,20,21,22]) and also among their Lepidoptera hosts, e.g., [23] although only a small proportion of these host species have been formally described and named (e.g., [24,25,26,27,28,29,30]). Along with specimens of their host Lepidoptera species, the parasitoids that emerged started being barcoded in 2003 [17,31,32], and barcoding was also attempted on some specimens collected prior to this, although the identification success rate declined markedly with the age of the specimens.

1.1. Tachinid Biology

Most tachinids glue their eggs directly on or into the host. However, indirect parasitism is also exhibited by some species. A few genera are larviparous or ovolarviparous and deposit their first instar, which is usually a planidium-type (i.e., small, resilient and highly mobile), close to a host which the larva then locates [33,34]. This strategy occurs in the tribes Tachinini and Polideiini (e.g., Archytas) [35,36], and in some members of the Blondeliini (e.g., Lixophaga). However, the oviposition strategies of many of the ACG blondeliines are unknown. Members of the exoristine tribe Goniini (e.g., Belvosia) [22] deposit tiny, “microtype” plano-convex eggs on foliage (micro-ovolarvipary) and these only commence development if they are consumed by a potential host in response to proteolytic digestive enzymes of the latter [14,37]. Once hatched, the 1st instar goniine larva quickly bores into the body cavity to develop but then waits until the caterpillar is near pupation to continue to consume it and pupate inside the pupal remains.
It has often been noted that tachinids are rather generalist parasitoids [14,38,39,40,41,42,43] differing from parasitic wasps in generally having broader host ranges [44]. Belshaw’s analysis based on European rearing data indicated that two biological features were associated with a higher degree of generalism (polyphagy) [39]. One was the location of the young larva within the host and the presence of a respiratory funnel, the other was a lack of developmental synchrony with the host. Both of these might provide a better ability to avoid host immune defences. However, as Belshaw [39] noted, his sample size was quite small. Many parasitic wasps use highly effective viruses to help subdue host immune defences, and the complexity of these viral interactions might foster increased specificity [45,46]. It is still premature to fully assess the impact of parasitoid viruses on wasp host ranges, but some preliminary studies suggest that in at least some groups relevant viral functional genes have diversified into gene families that are under differential selection in different hosts [47,48] and thus might limit success in alternate potential hosts. Detailed comparative studies of the interactions between parasitoid viruses and venoms in host organisms promise to provide additional insights into why the wasps appear to be so host-specific [45,46,49]. In comparison, the respiratory funnel and location of the parasitoid larva within the host might both provide a more general (rather than necessarily more effective) defensive strategy.
In some cases sight is important, e.g., Stireman found for one species (Exorista mella) that vision, and more specifically host motion, played an important part in host location and attack together with volatiles released from damaged host plants, though far less so than from host volatiles [50]. That vision is important was also shown for E. japonica by Yamawaki & Kainoh [51] which was later shown to employ a combination of visual and olfactory cues to locate plants infected with its hosts [52]. Other species detect hosts via chemicals in their frass; for example, Architas marmoratus larviposits near its host in response to a protein present in its frass [53].

1.2. Barcoding and Host Specialisation

Molecular data (principally DNA barcodes) have revealed cryptic host-specificity within the presumed polyphagous members of previously recognised “good” species [54]. This is true for tachinid flies [15,16], just as with several groups of insect parasitoid wasps, notably among the Ichneumonoidea and other parasitic wasps, e.g., [55,56,57,58], and their host caterpillars, e.g., [22,59,60,61,62,63]. However, there are exceptions, and in some cases DNA barcodes or other DNA markers have indicated that some morphologically diverse generalists all seem to belong to a single species. For example, Lee et al. [64] concluded based on 65,825 single nucleotide polymorphism (SNP) loci that, apart from a few morphologically clearly defined species, the Palaearctic tachinid genus Gymnosoma also probably includes one geographically widespread species that is highly variable morphologically.

2. Materials and Methods

2.1. Study Area

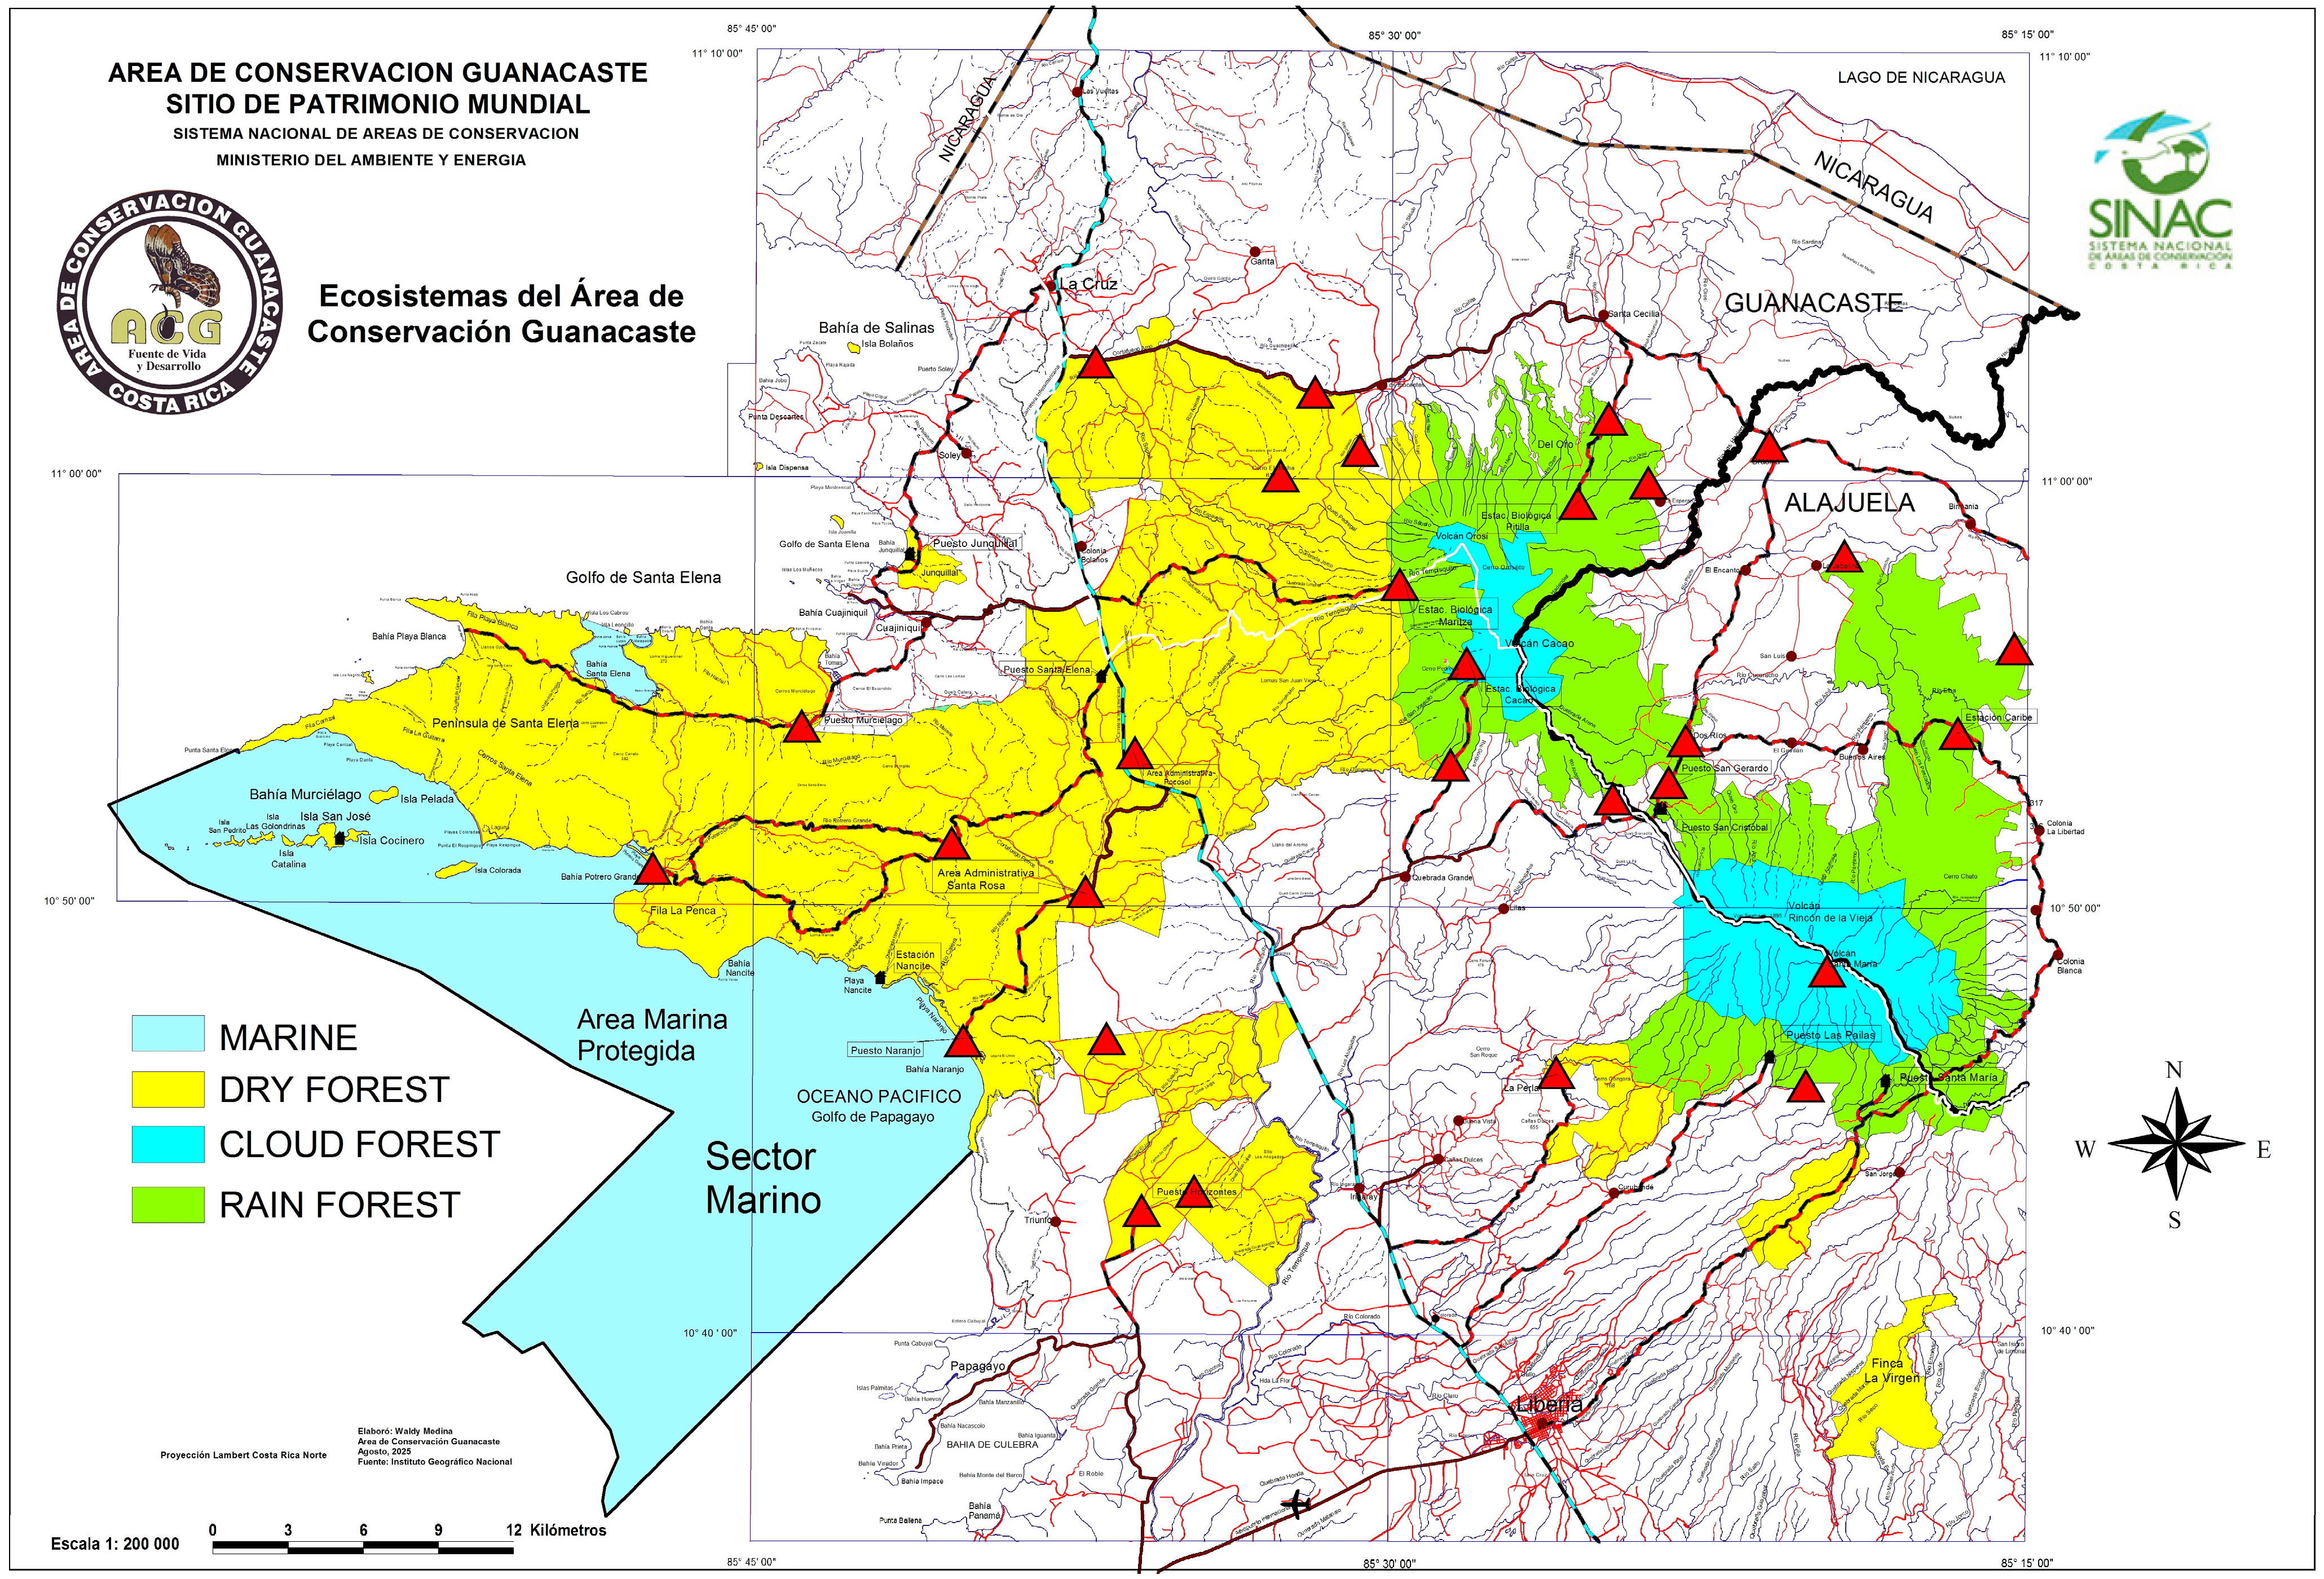
Área de Conservación Guanacaste (ACG) is a UNESCO-designated Natural World Heritage Site comprising 120,000 terrestrial hectares and 43,000 marine hectares. It is predominantly seasonal, tropical dry forest interdigitated with restoring tropical rain forest and cloud forest [4,5,31] (Figure 2). Its history and ecology were described in detail by [65]. A large caterpillar rearing programme has been conducted in ACG since 1978 [6] with the aims of understanding their diversity and trophic interactions with parasitoids, hyperparasitoids, and food plants. As of the 31 December 2023 some 852,000 wild-caught caterpillars have been reared since the project’s beginning. Insect decline and climate change are also contributing to changes in the insect fauna and vegetation of ACG [66] as well as of La Selva [67] through differences in rainfall patterns and increasing average temperatures [68]. The area occupied by cloud forest is decreasing, drying and warming [69].

2.2. The ACG Inventory

Caterpillar rearing and identification and food plant identification are described and illustrated in detail at the University of Pennsylvania/Janzen website [65] and by Quicke [6]. Briefly, caterpillars were collected by members of a team of up to 30 experienced parataxonomists [17,70,71] who subsequently reared them, re-provisioning them as necessary, until an adult insect[s] eclosed. The number of parataxonomists increased gradually and somewhat erratically up until 2005 and then stabilised. Caterpillar collection was carried out year-round and both day and night. Collecting was from the foliage of vegetation mostly along trails between ground level and approximately 2 m height. All caterpillars located were collected and reared, although in the case of gregarious host species the number was limited to approximately 20 from a single plant. The parataxonomists documented all stages, preparing and curating specimens for future investigation by professional taxonomists.

2.3. Tachinid Identification

Prior to 2004 the segregation and identification of tachinid species segregation was based solely on morphology, and subsequent barcoding showed that those identifications were heavily marred by taxonomic errors, with many of the “species” being aggregates of two or more cryptic species. Therefore, in light of the molecular data, many earlier identifications have been excluded from the analysis. Parasitoid specimen vouchers for which identifications are considered as reliable are given a “DHJPAR” prefix code. From 2004 onwards, the species of parasitoids were recognised through an integration of traditional morphotaxonomy, DNA barcoding, biology and ecology. Thus, when barcoding suggested that a previously recognised entity might comprise two or more separate species, the specimens were re-examined, and sometimes distinguishing morphological characteristics were recognised, or it might become apparent that the MOTUs had distinct biologies. Some cases are known where two species cannot be differentiated with either DNA or morphology, but ecological evidence and host associations provide strong evidence that the flies are not conspecific, e.g., Hyphantrophaga morphophaga and H. danausophaga [21].

2.4. DNA Barcoding

Barcoding was carried out by the Centre for Biodiversity Genomics (CBG, University of Guelph, Guelph, ON, Canada). The barcoding methodologies have evolved over the duration of the molecular study, although for most samples the barcode region was amplified through PCR using a cocktail of Folmer primers [72] and LepF1 and LepR1 [23] and sequenced on the Sequel platform (Pacific Biosciences, Menlo Park, CA, USA). Sequences from older samples were generated using these cocktails with two internal primers (MLepF1 and MLepR1) that generated shorter, overlapping fragments. DNA was extracted from single fly legs using a standard glass fibre protocol [73]. In the case of cryptic species complexes, barcode BINs (barcode index numbers; [74]) were taken as molecular operational taxonomic units (MOTU) [75,76], i.e., a first preliminary surrogate for species, and final decisions are based on integrative methods, relying on a combination of morphological and molecular data, often supplemented with ecological and biological considerations.

2.5. Data Analysis

Data analyses were performed using the R environment for statistical computing [77]. In addition to functions available in base R, we used the packages bipartite [78], pals [79], and scatterplot3d [80]. Food web statistics calculated were connectance, rescaled connectance, linkage density, and generality [78,81,82,83]. Total numbers of species of braconids and ichneumonids in the study area were estimated using Chao1 [84]. Tachinid species richness (TSR) of hosts is presented both as numbers of tachinid associations with a given host and, since the full TSR cannot be ascertained with certainty, also as the Shannon–Wiener diversity statistic [40]. To evaluate the degree to which the tachinids of ACG might be declining [66], we present the total number of tachinids from the two most abundant subfamilies reared between 1989 and 2003. For this comparison, we orient the graph around the year 2005, when the total number of searching parataxonomists stabilised. To evaluate the host specialisation for ACG Tachinidae, we visualised as an example the species of the tachinid genus Belvosia and their hosts using the bipartite package [78] including all records, and to aid in visualisation, also excluding singleton and doubleton host records from the analysis. To assess the degree of community partitioning across forest ecosystems we used nonmetric multidimensional scaling (NMDS) in the vegan package [85] in R on Belvosia records. Some analyses additionally incorporated data on ACG host diet breadth from Quicke et al. [86] available from https://doi.org/10.5683/SP3/NX043G (accessed on 14 August 2025) and in the online Supplementary Materials of that paper.

2.6. Raw and Cleaned Data

The fully cleaned data for Tachinidae that were analysed, including rearings from which no parasitoid barcode was obtained, is provided as a .csv files in Table S1. During the cleaning process, all records of morphospecies (and in a few cases MOTUs) of either a parasitoid or a host caterpillar, which were subsequently found to comprise more than one probable species, based on integrative taxonomy, were excluded. Thus, most data postdate 2003.
Depending on the aim of the analysis, we sometimes included or excluded tachinid-caterpillar associations which had only been detected on a single occasion. Arguments against including unique records [87,88,89] are based almost entirely on experience with far less diverse host–parasitoid communities where the parasitoids concerned have been reared on many occasions. However, in the present study, out of 19,751 unique tachinid-host associations, almost a third (5358) of these were single records, and although some might represent rare events, it is likely that the great majority represent normal associations.

3. Results

3.1. Overview of the ACG Tachinidae Rearing Data

The rearing data relevant to Tachinidae are summarised at the subfamily level in Table 1. To date, the project has accumulated more than 883,000 caterpillar rearings that yielded either an adult moth, butterfly, parasitoid or hyperparasitoid, with a total parasitism rate of 10.5%. Three families of parasitoids accounted for 94% of parasitisation events: Tachinidae (38%), Braconidae (35.5%) and Ichneumonidae (19.7%). More than 34,000 of these rearings produced tachinid flies. However, in some cases more than one, up to about twenty, conspecific caterpillars were collected from the same individual food plant on a given day, and more than one of these might have been parasitised by the same individual tachinid female. The dataset does not allow us to tell whether rearings from the same plant species on a given date were from the same plant or not. Therefore, to ensure that we are analysing independent records, we consider as separate events only rearings of a particular tachinid-caterpillar species-plant species that were collected on different dates.
From 1978 up until 2003, identifications of Lepidoptera and parasitoids were based exclusively on morphology by various taxonomic experts. From 2003 onwards most newly reared specimens were barcoded [17]. An intensive effort was also made to retroactively barcode earlier material, although success rate declined rapidly with age. Barcoding revealed many examples of cryptic diversity among both parasitoids and hosts. At least 50% of the species that were originally recognised by expert traditional taxonomists have now been demonstrated to be complexes of morphologically similar but genetically and biologically distinct species.

3.2. Changes in Abundance and Species Composition over Time

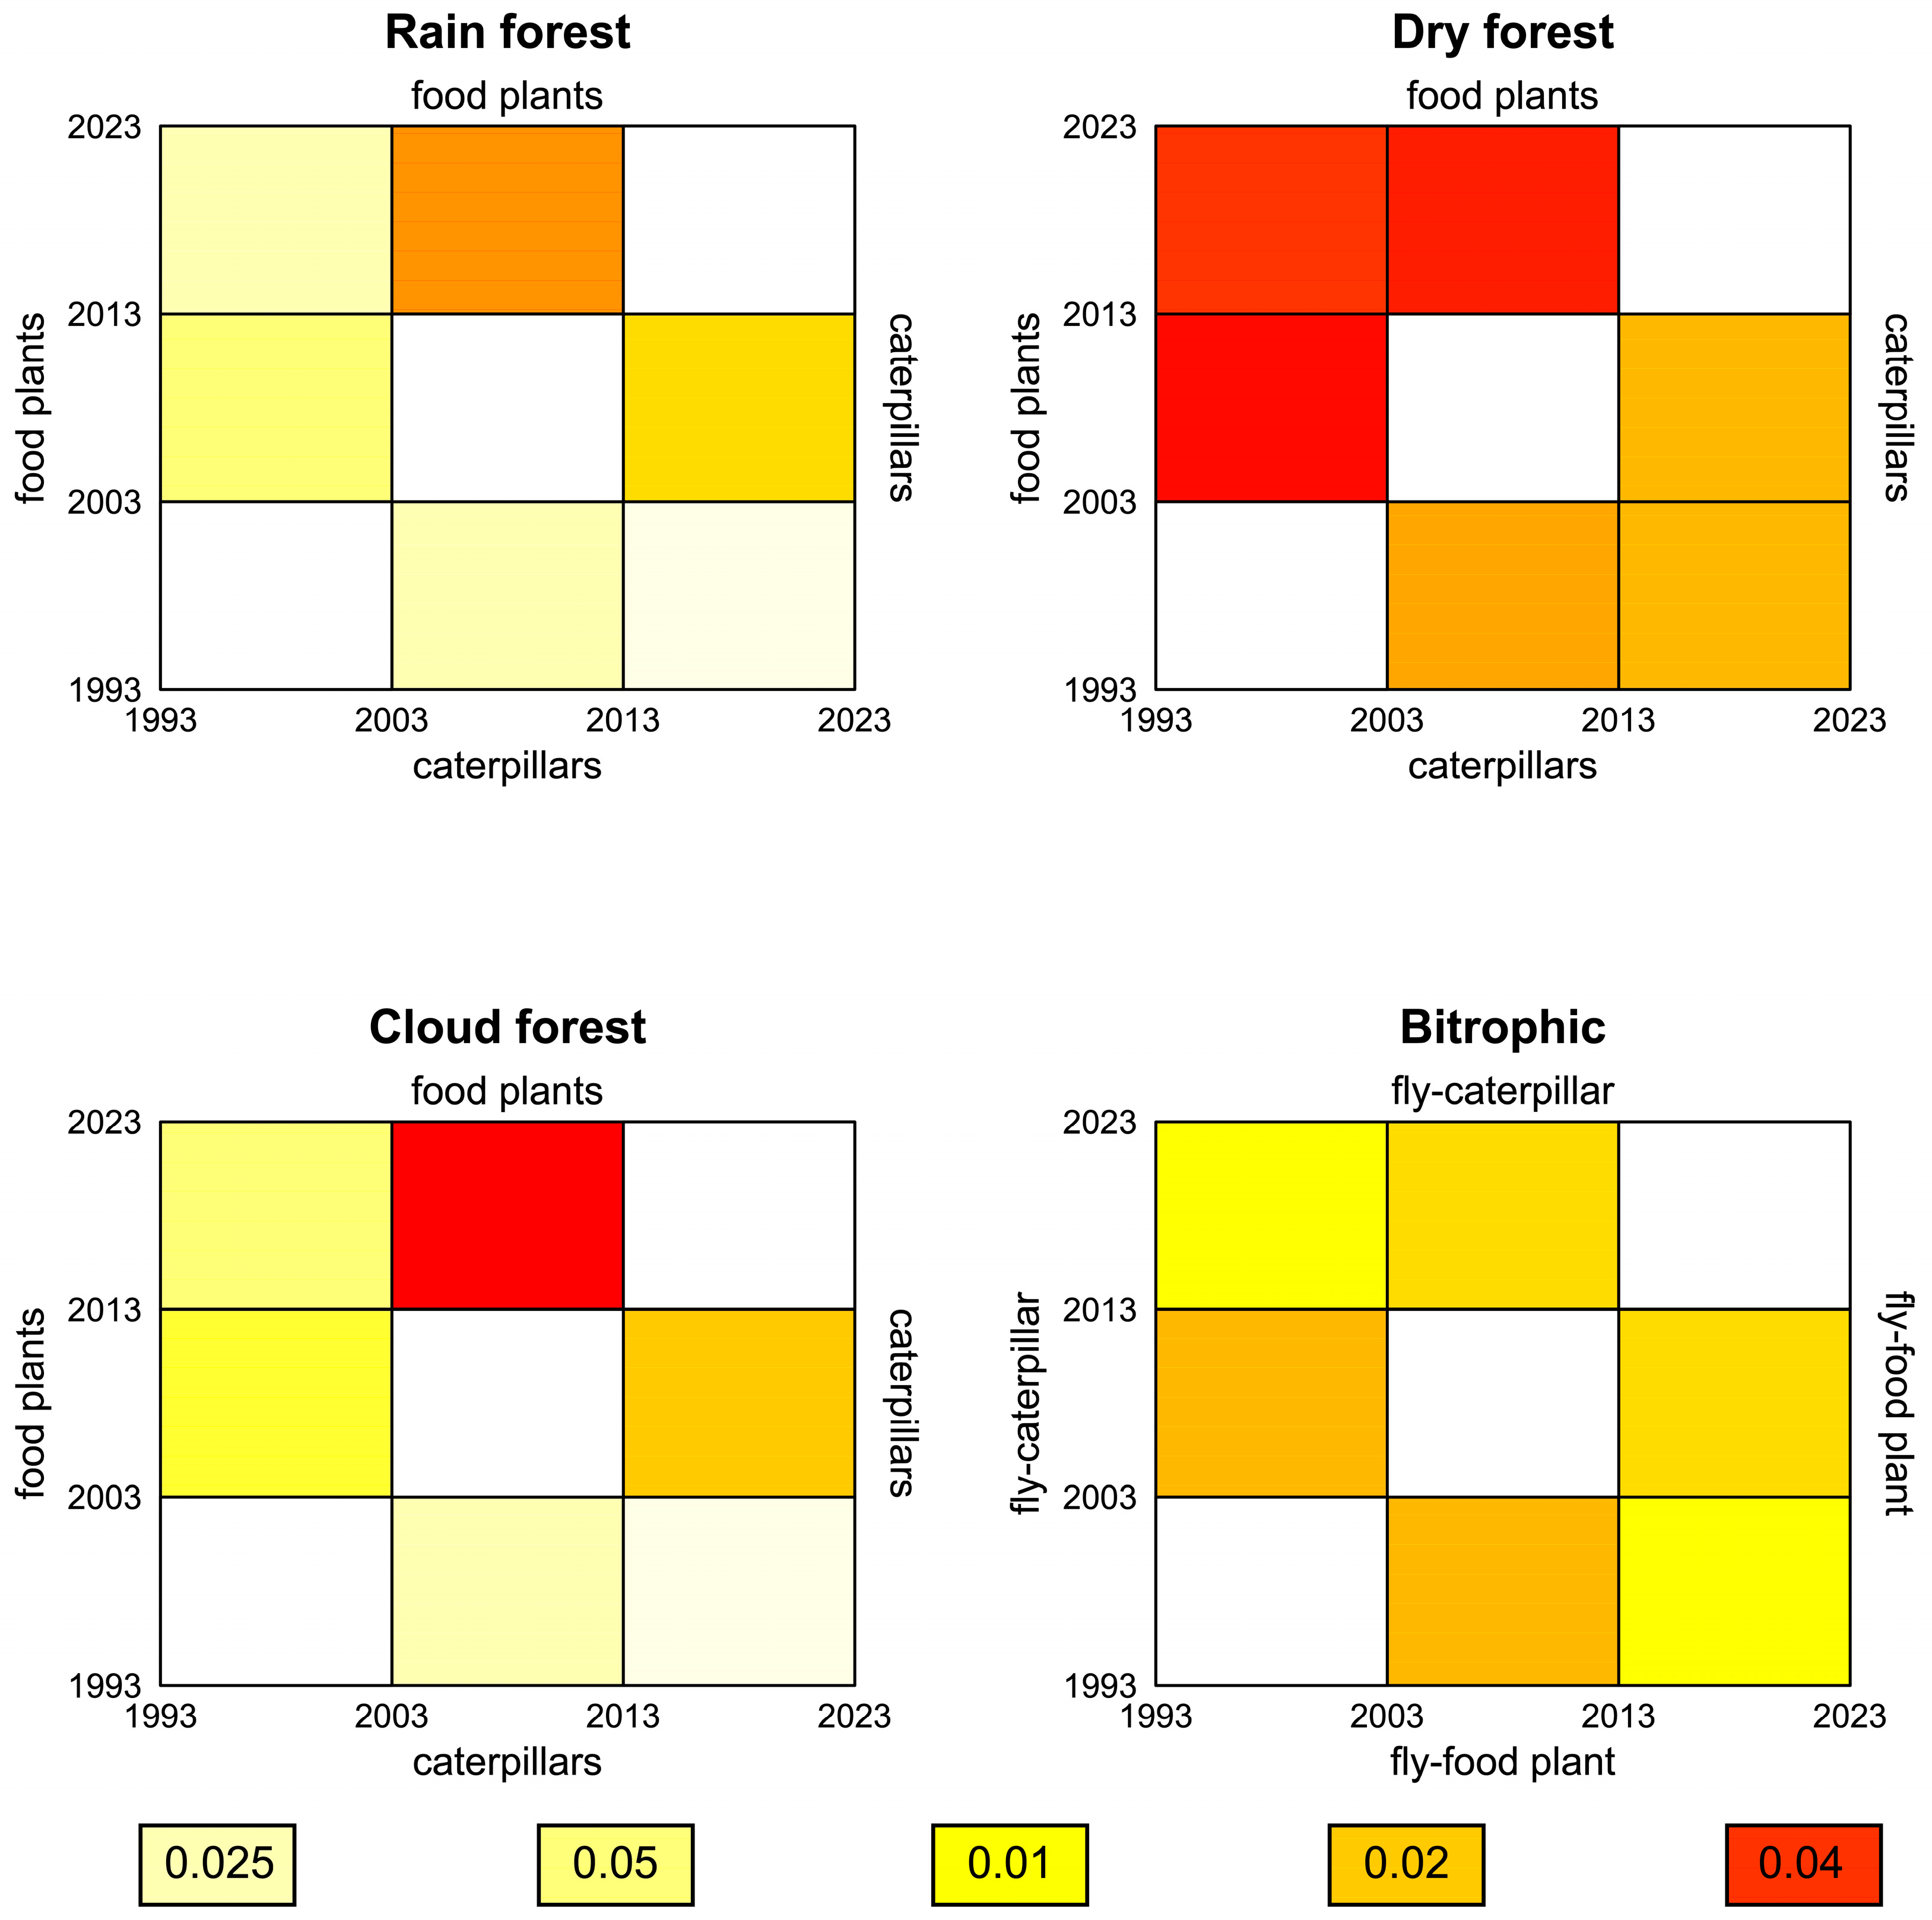
Whilst some of the ACG natural ecosystems have existed since historic times, substantial parts of ACG are also undergoing natural succession (i.e., benign protected restoration) [90], and therefore, as expected, the species composition of plants available for the parataxonomists to search has changed during the course of this study. Figure 3 shows that the food plants from dry forest were broadly similar between decades, but there was very little similarity between decades for the other habitats. The same applies to caterpillar species reared, though they were less similar than the plants. It is noteworthy that from year to year in dry forest, there are enormous and decades-long changes in caterpillar density on traditional plant species, in part due to climate change and in part due to restoration succession.
For each of the two most common subfamilies, the number of parasitoids emerging has declined since the number of collecting parataxonomists stabilised in 2005 (indicated by the vertical black line in each plot) (Figure 4).

3.3. Relationships Between Rearing Effort/Successes and Species Growth by Taxon

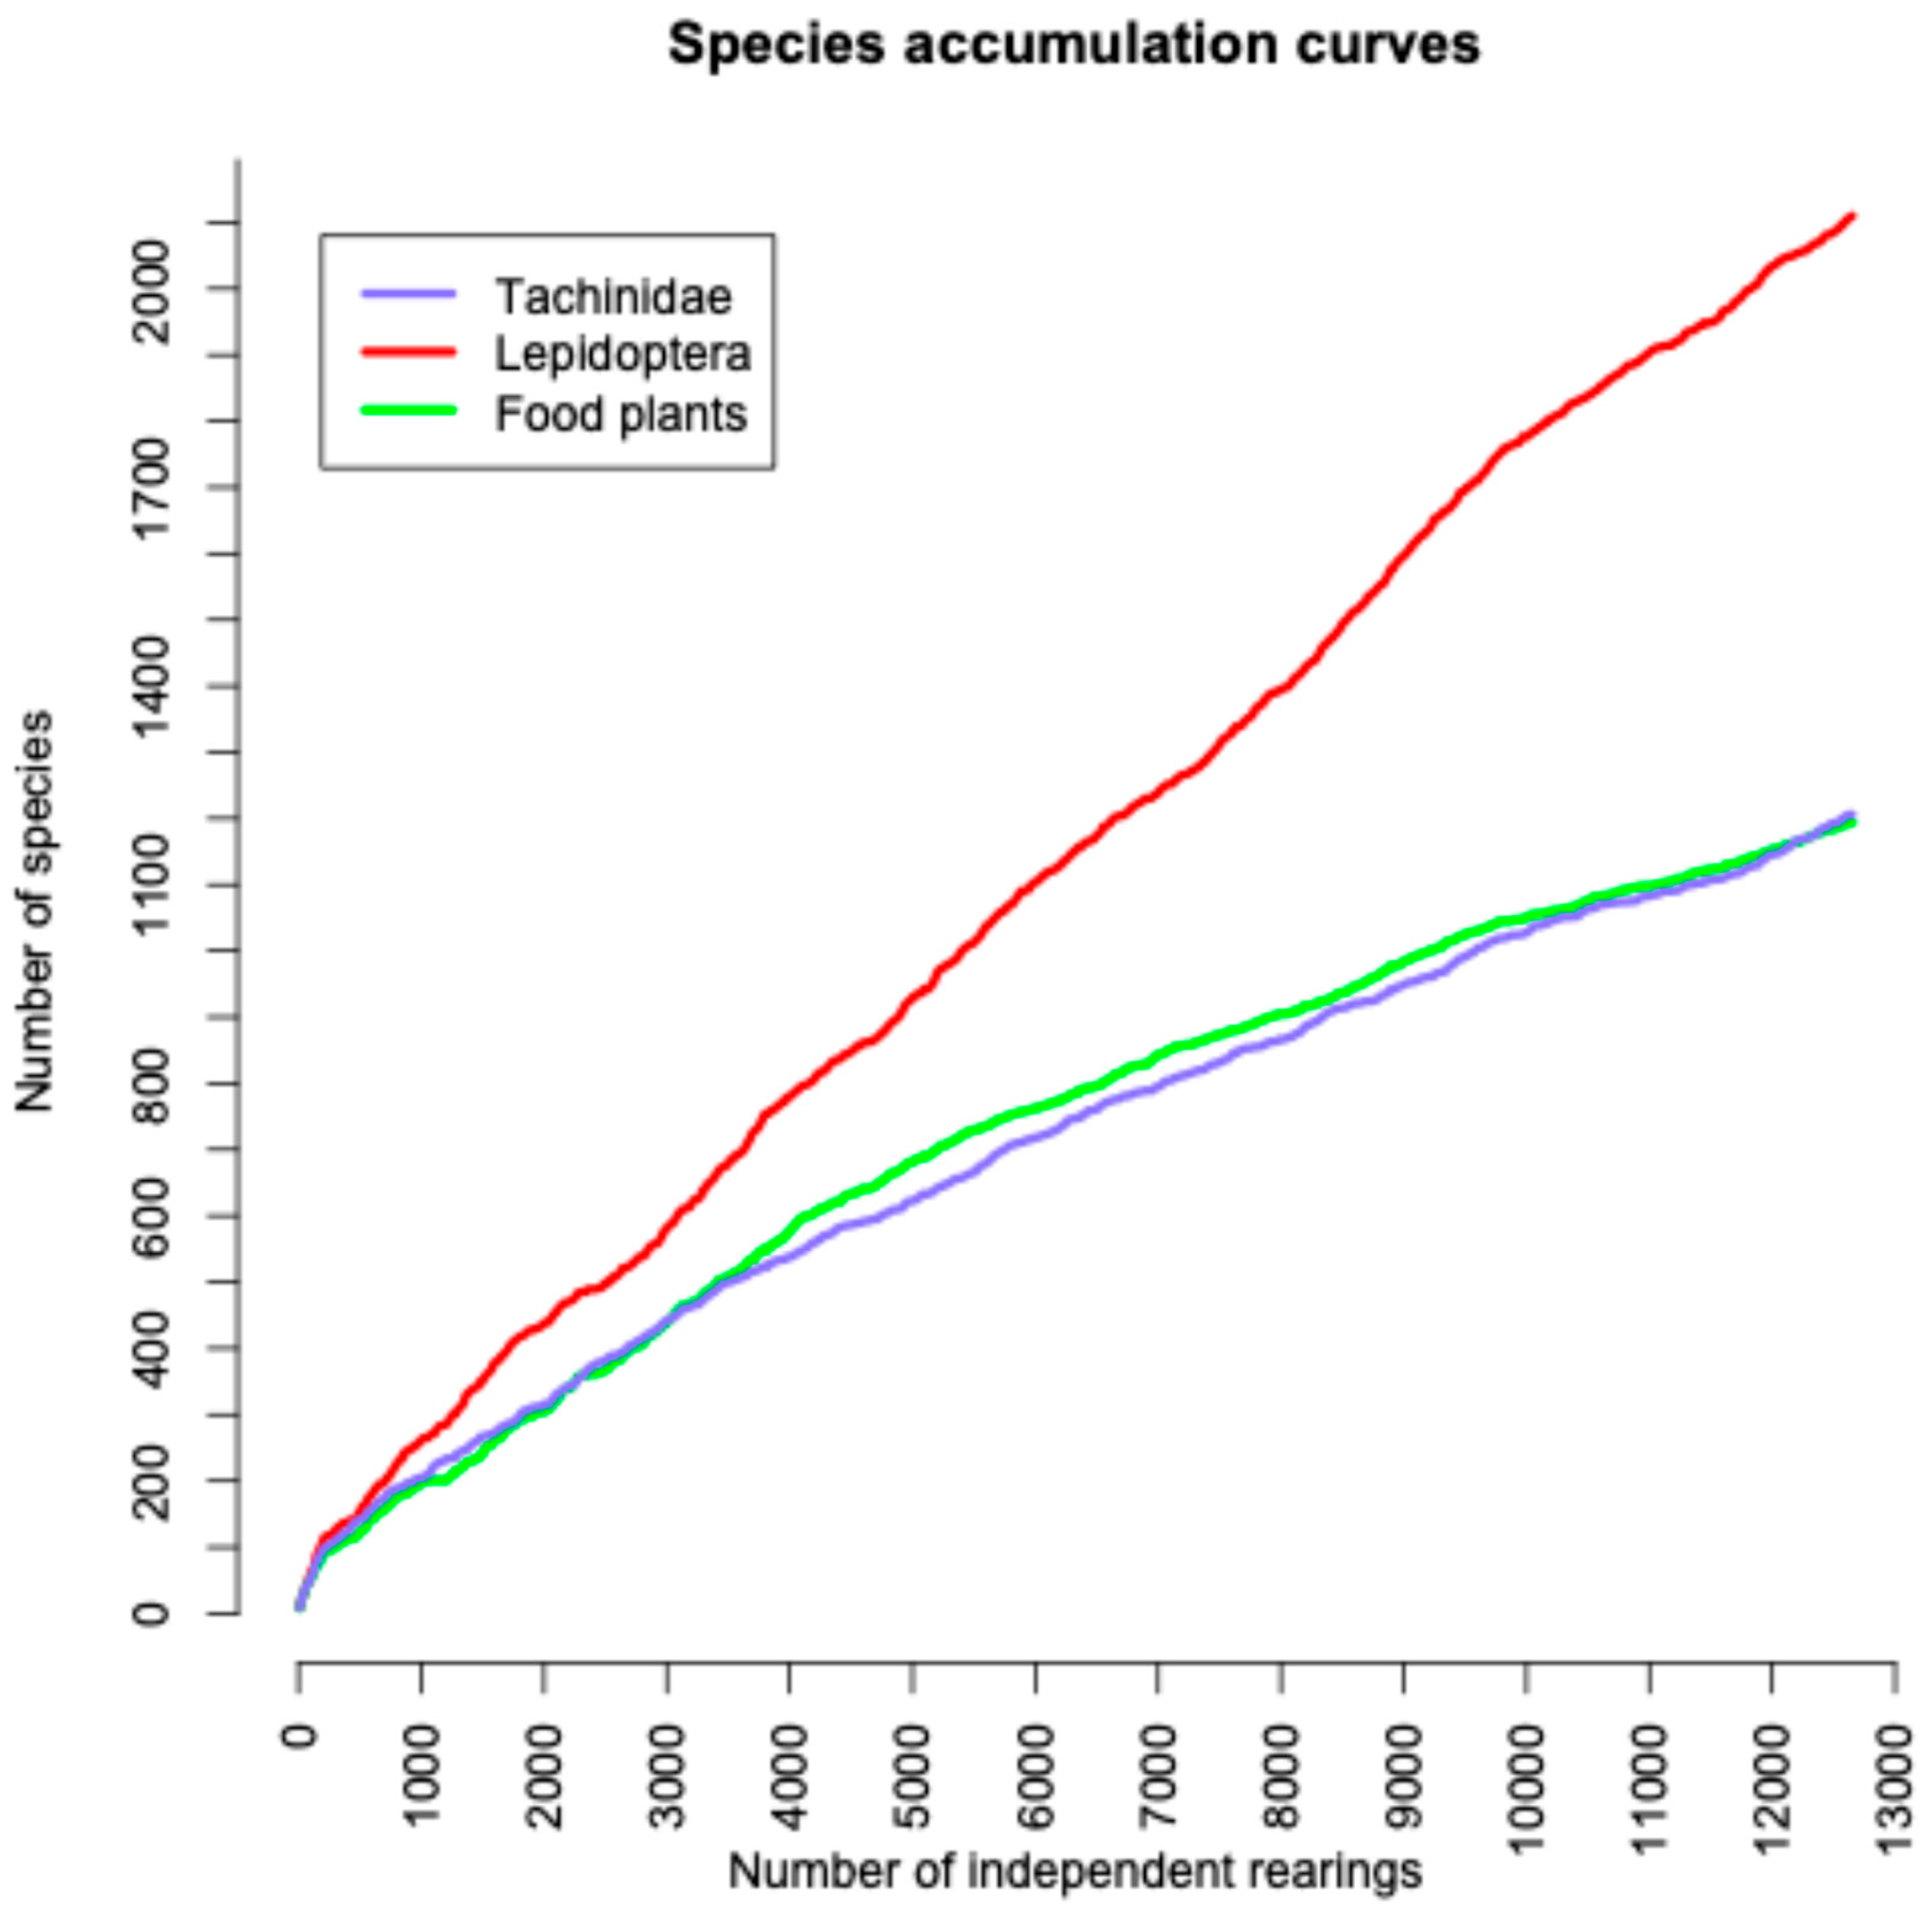
Species accumulation curves for tachinids, caterpillars and their food plants are shown in Figure 5. Probably due partly to the more time-dispersed early samples (a result of difficulties in obtaining accurate species identifications without adequate barcoding) the curves all appear to be levelling over the first 4000 rearings (late 2003). However, since that time all the lines are approximately straight.

3.4. Subfamily Representation by Primary Ecosystem

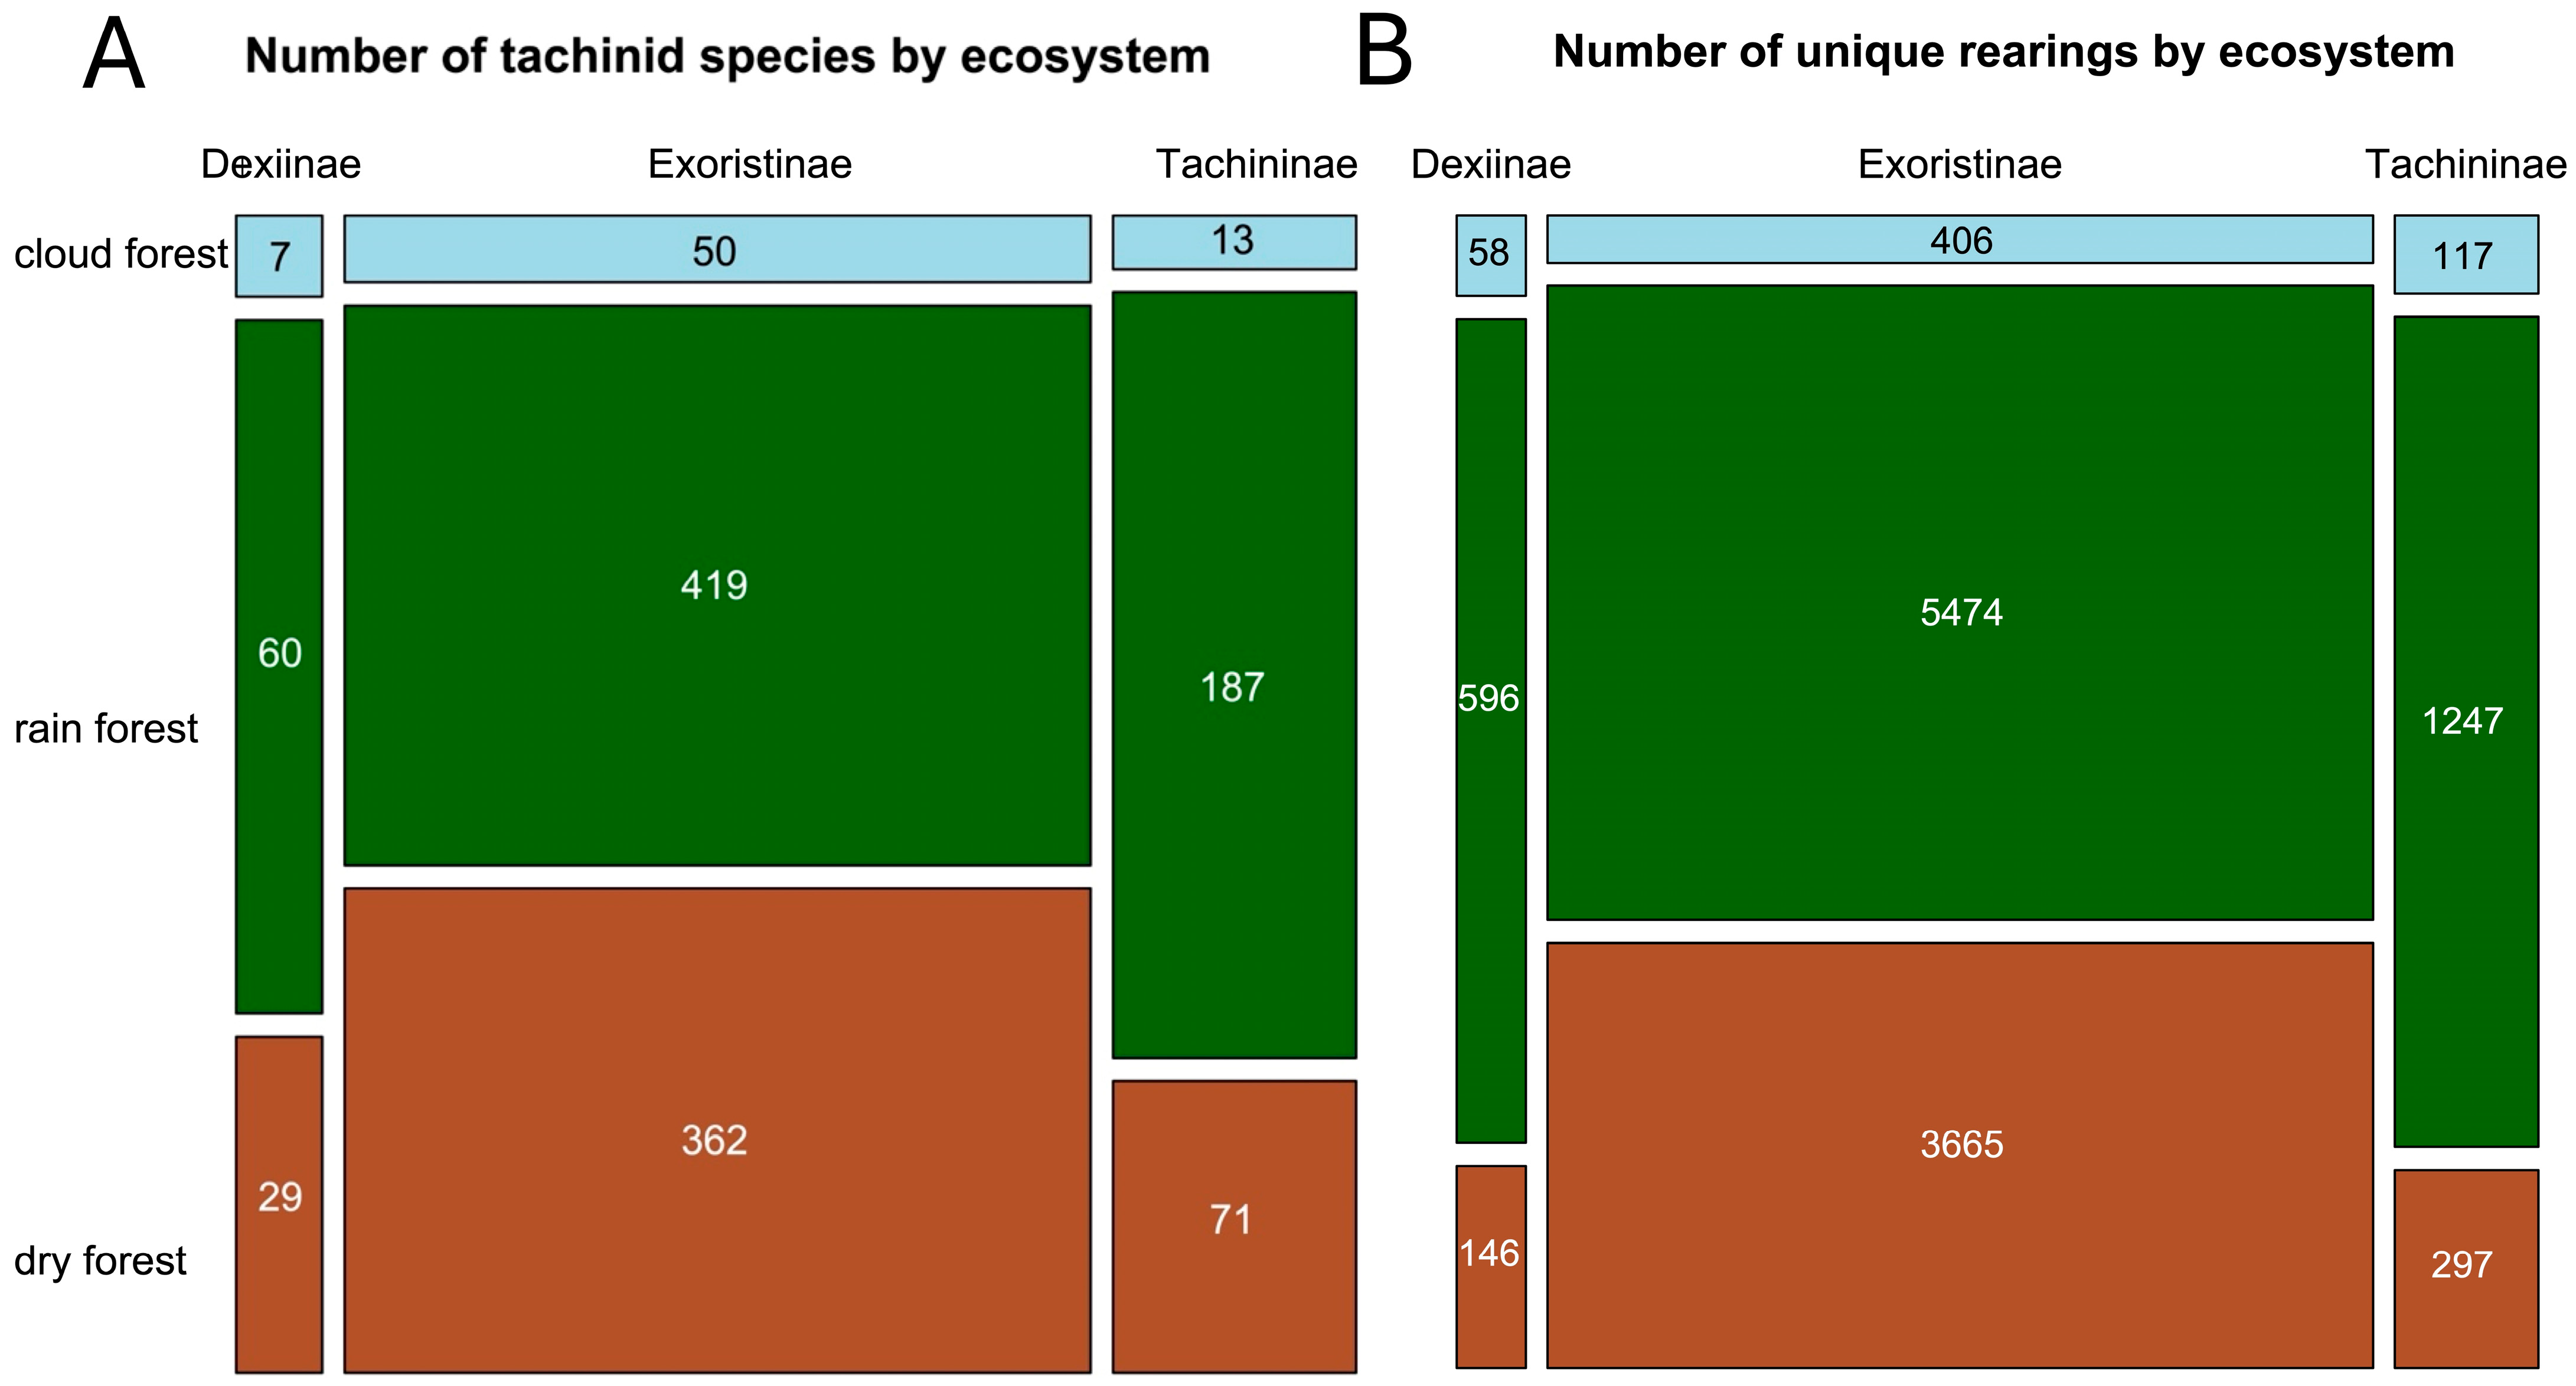
Figure 6A shows the relative numbers of species of the three tachinid subfamilies from each of the three ecosystems, and Figure 6B shows the relative numbers of independent rearings by ecosystem. The widths of the rectangles indicate the relative numbers of species in each subfamily. Overall, the relative numbers of rearings of each subfamily in each habitat mirrored the numbers of species found there. Both Dexiinae and Tachininae were relatively better represented in cloud and rain forests compared to Exoristinae, which show a preference for dry forest habitat.

3.5. Species Overlap Between Primary Ecosystems

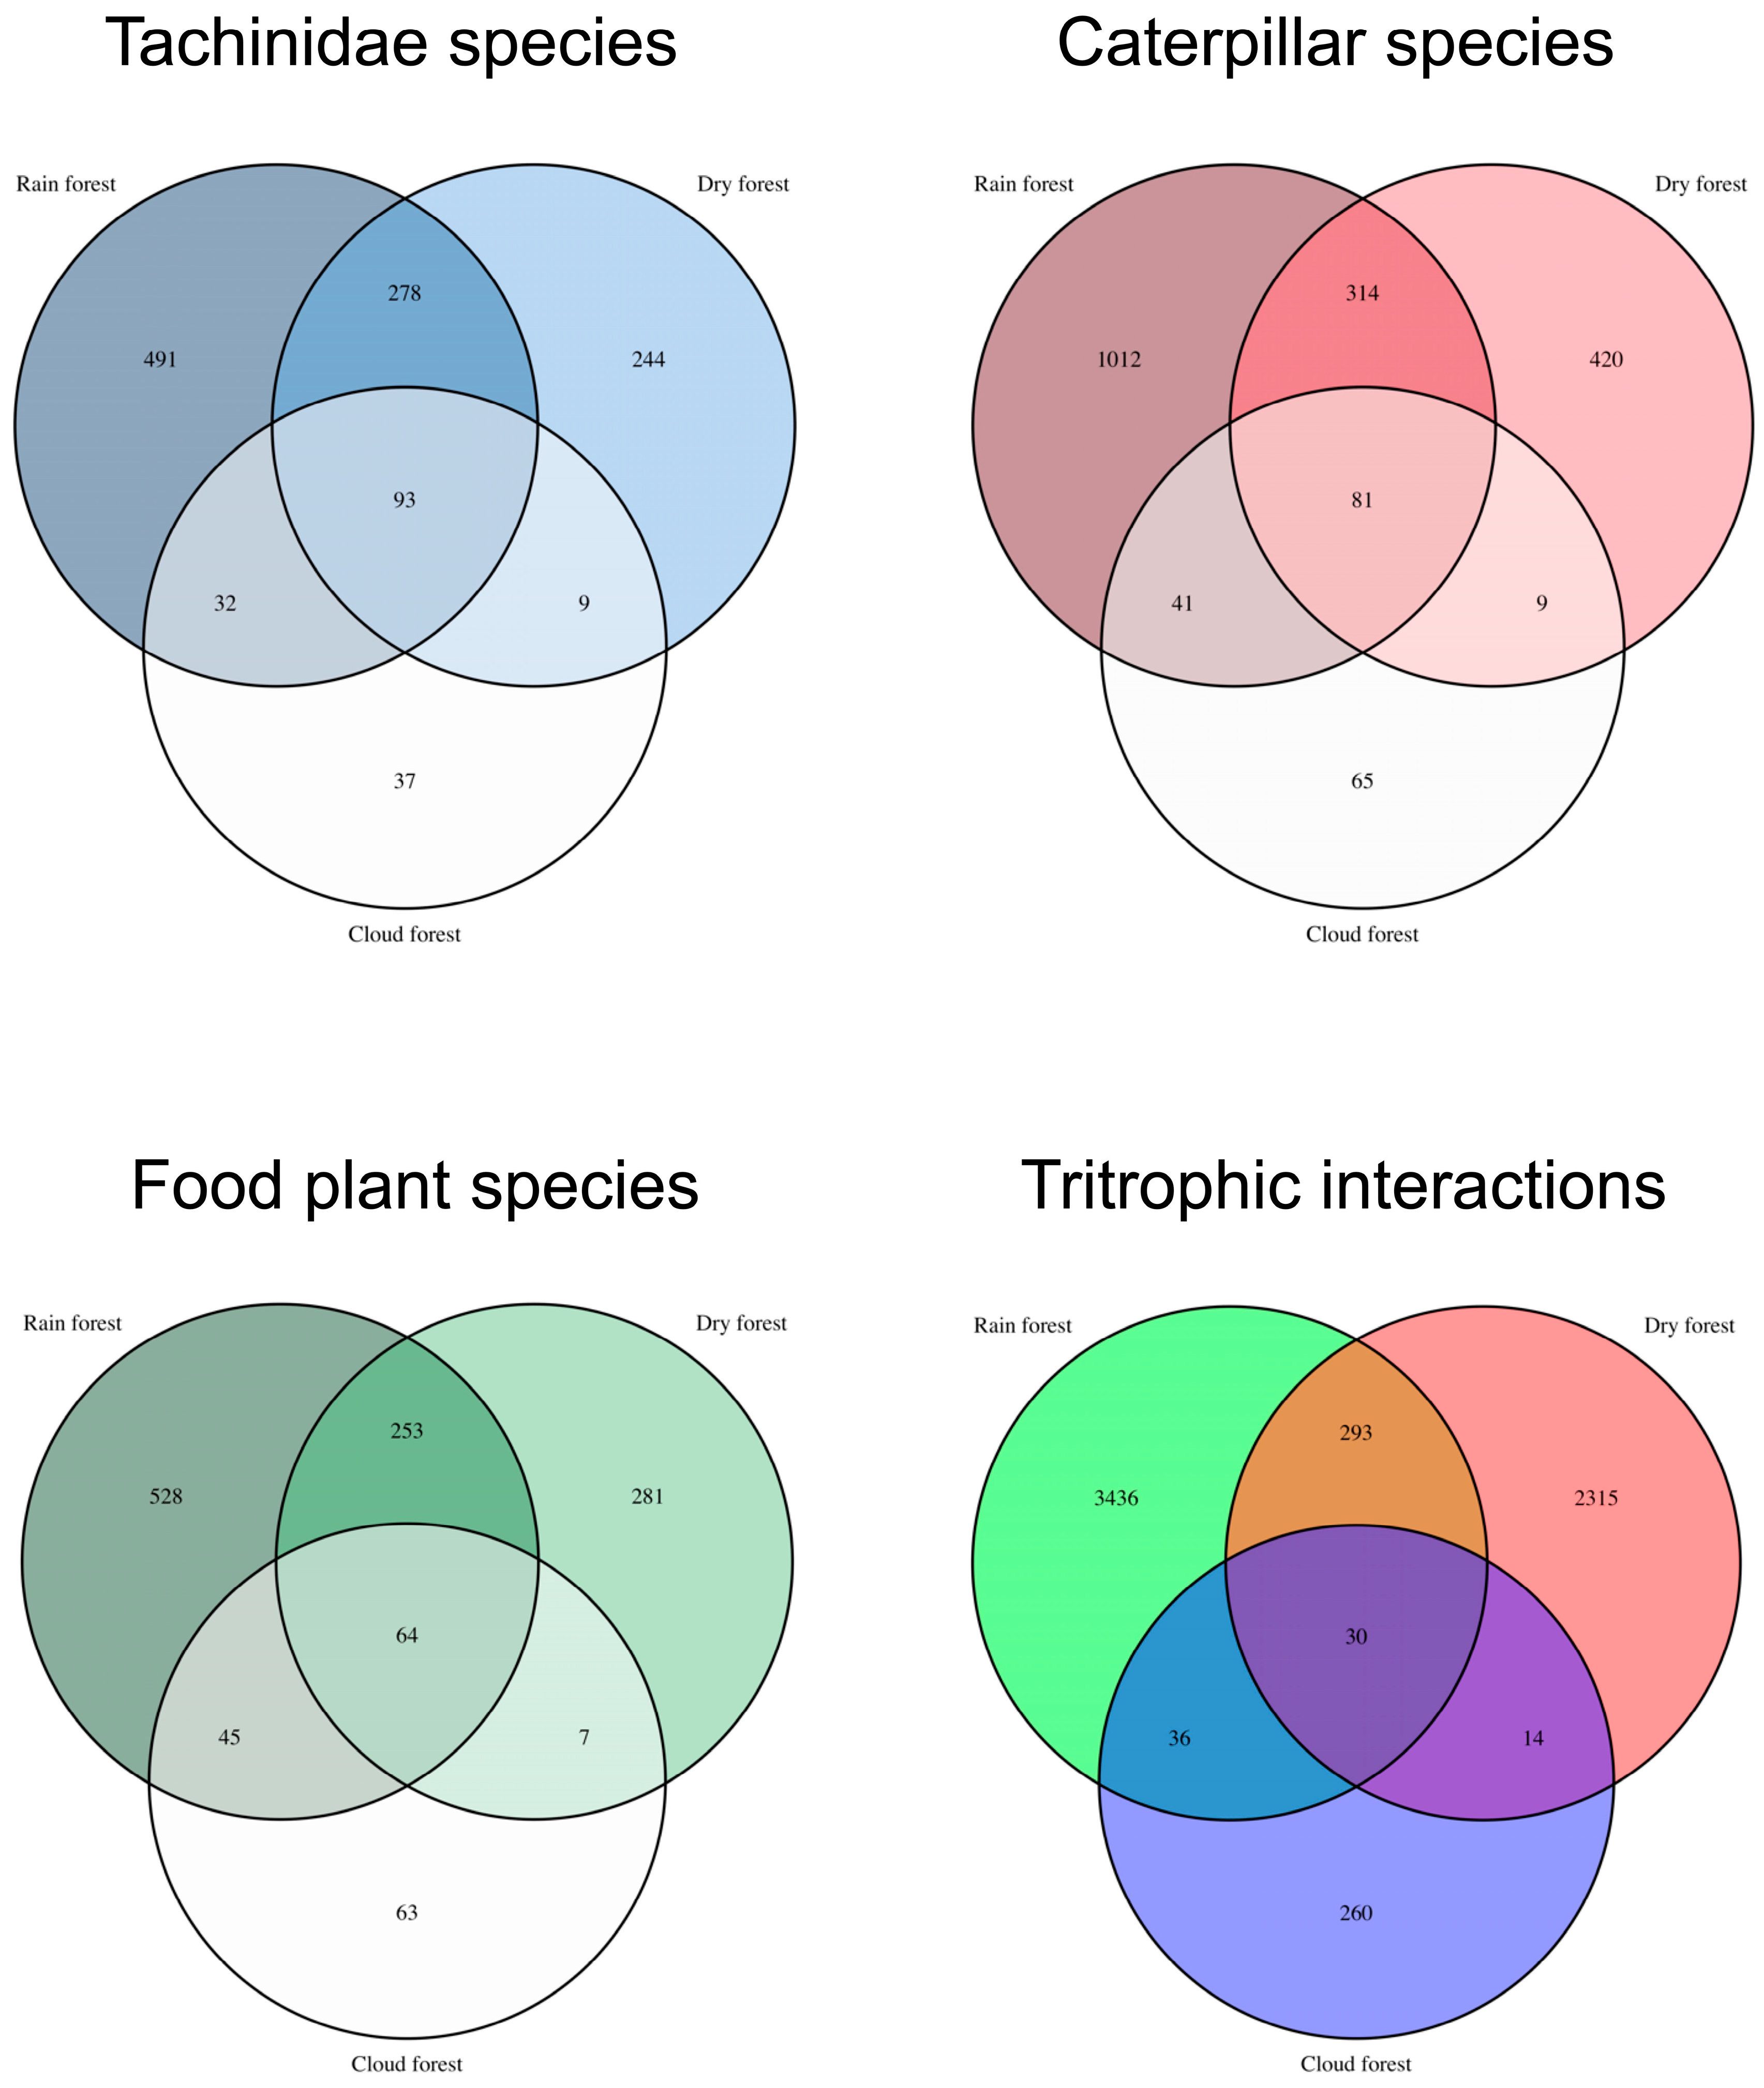
Species overlap for tachinids, caterpillars and food plants between habitats is fairly low (Figure 7). As explained by Quicke et al. [86] the three ecosystems do intergrade, and there are similar plants along some of the trails in each ecosystem that are associated with recently disturbed habitats (ruderal species). For food plants, 5.1% of the species were found in all three habitats; approximately the same (4.1%) was found for caterpillars, and slightly more for tachinids (7.8%). Of the total tritrophic interactions, fewer than 0.5% were common to all three habitats.

3.6. Chao Estimation of Likely Total Numbers of Species

We applied the non-parametric Chao1 estimator to the number of independent rearings data to predict the actual numbers of species and interactions that are likely to occur in ACG (Table 2).
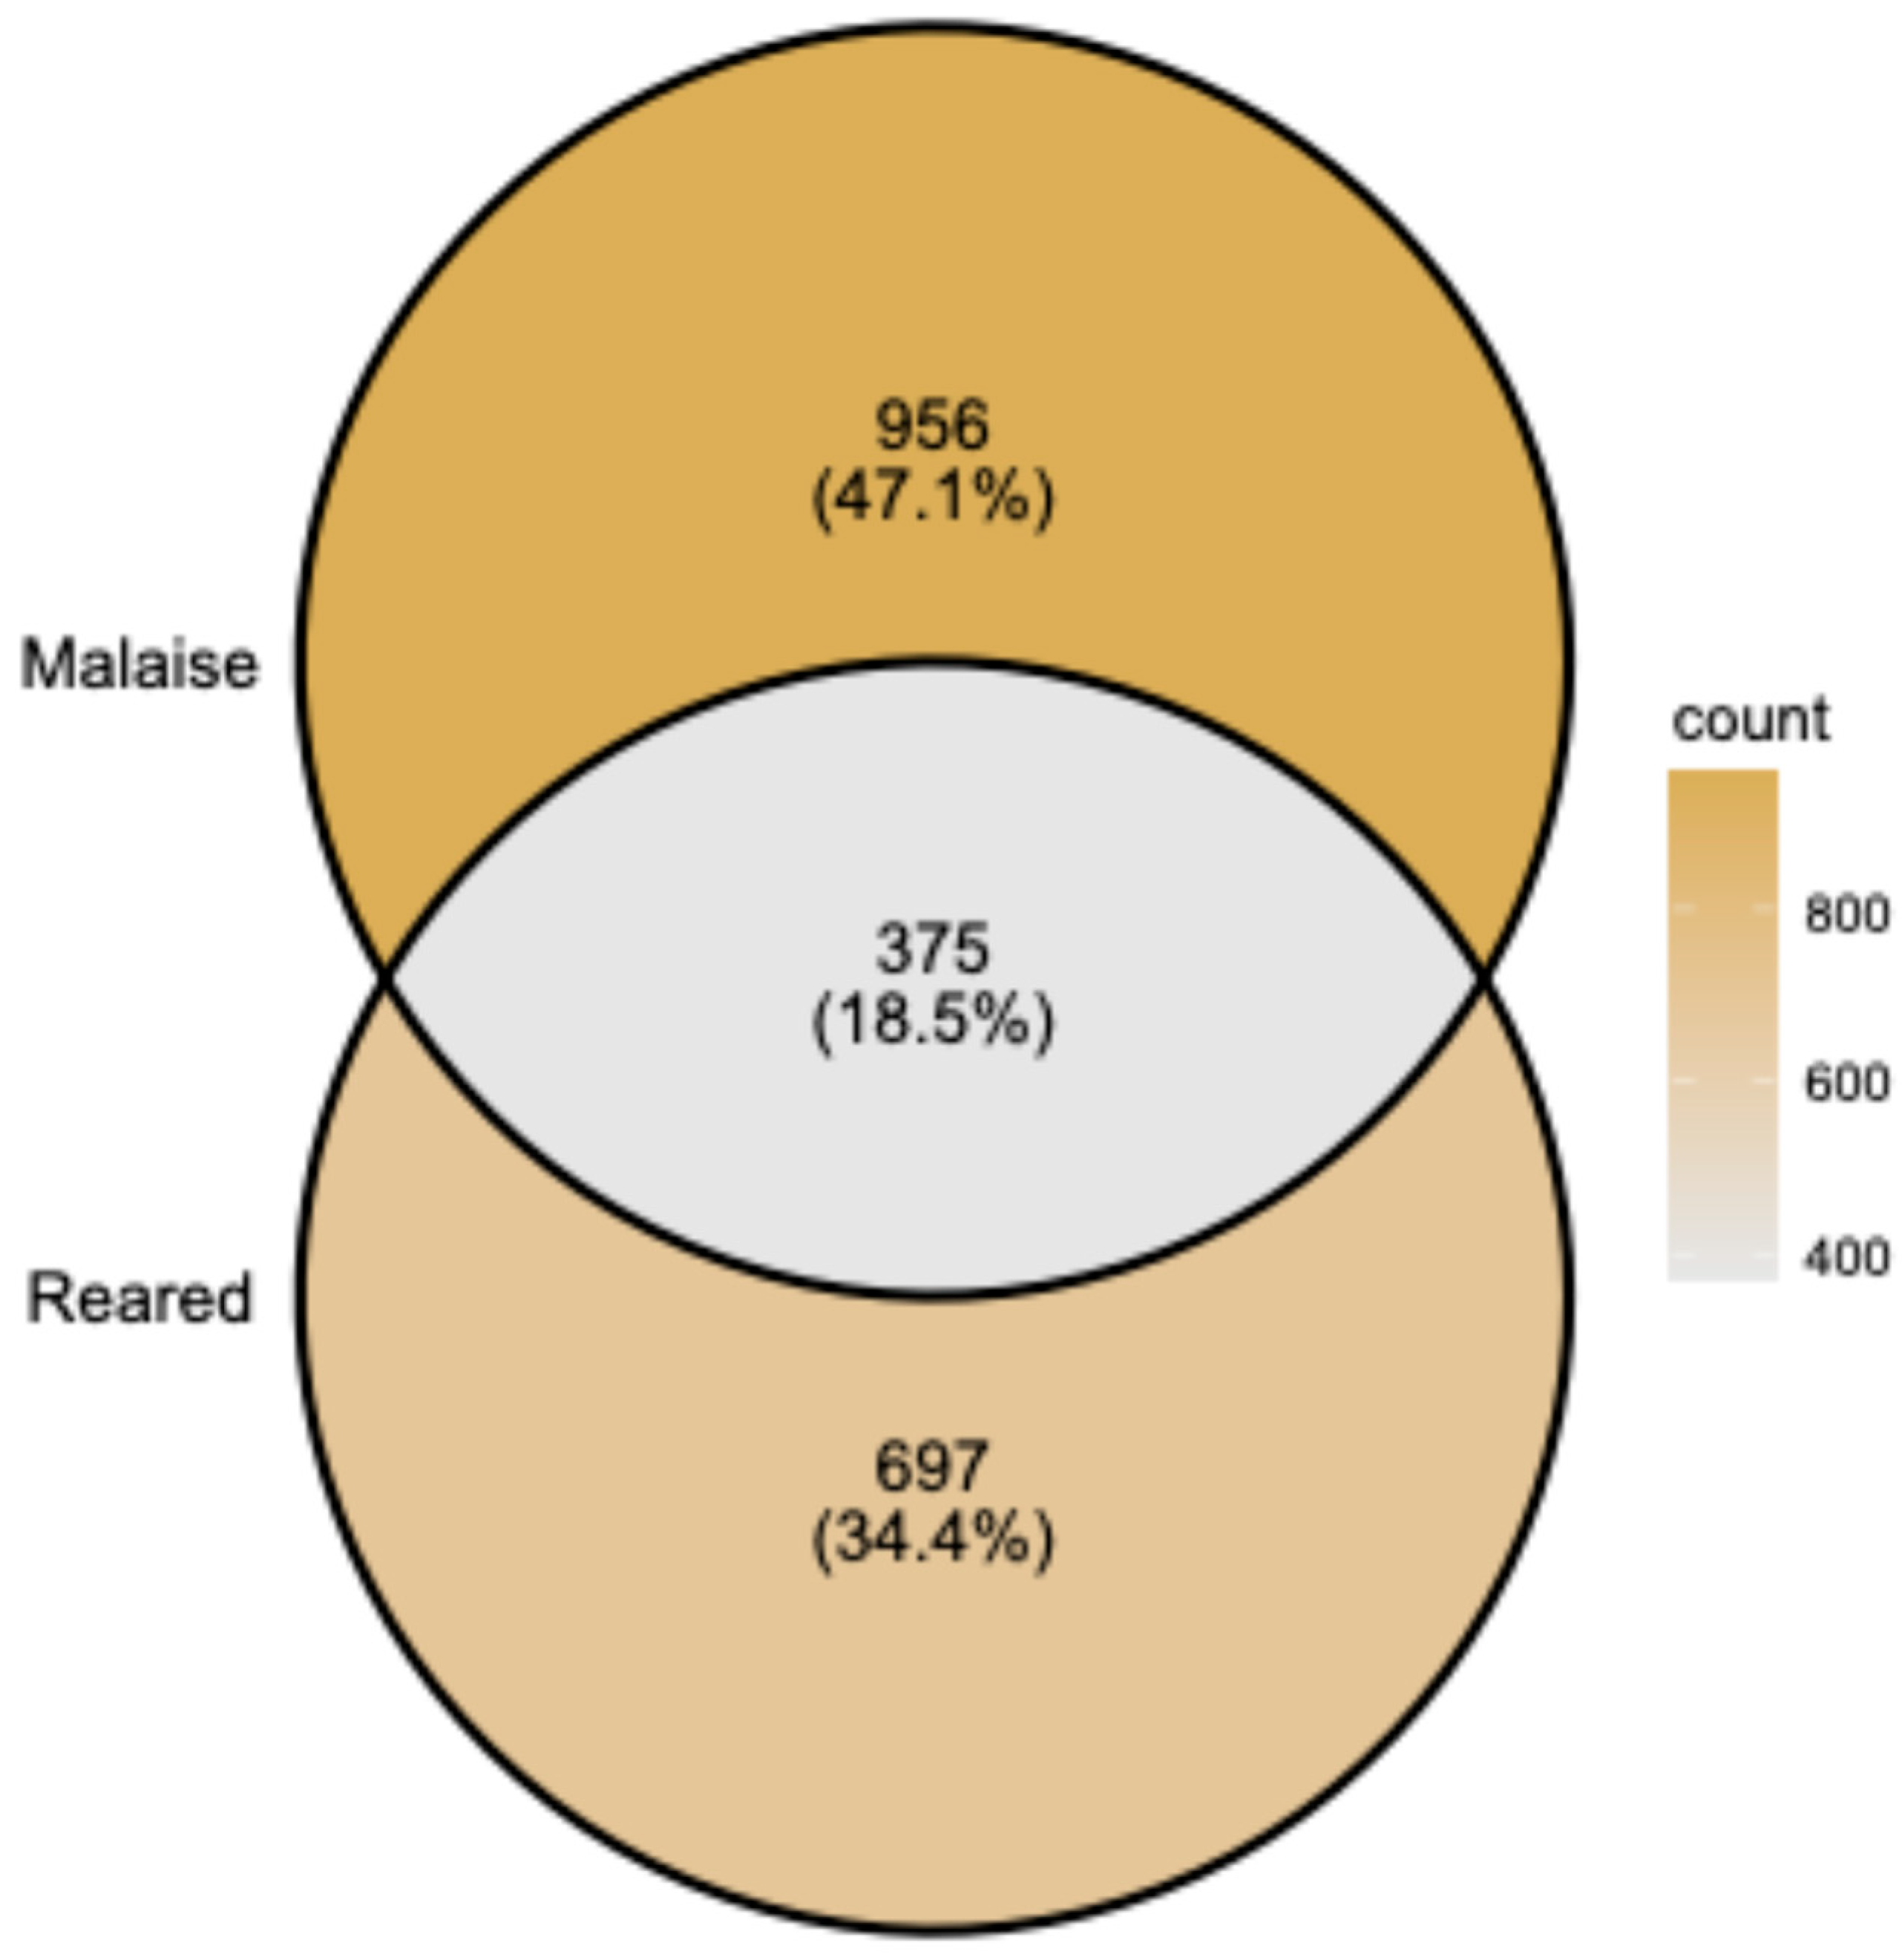
Despite this result, we have seen that a small percentage of the reared tachinids and the Malaise trapped tachinids overlap. This suggests that many more species await discovery. As a measure of this untrapped biodiversity, compare the number of tachinid BINS evident in the barcoding of ACG reared material to tachinid BINS Malaise trapped in the ACG (Figure 8). Both rearing and Malaise trapping have uncovered hundreds of species of tachinid, and only 12% of these species have been recorded using each collection method. However, it should be noted that a substantial proportion of the Malaise-trapped tachinids, perhaps about 40%, do not parasitise caterpillars and so would not have been reared. Allowing for this would still suggest that would still indicate an overlap of only around 25%.
Figure 9 shows a non-metric multi-dimensional scaling (NMDS) plot of the Belvosia species, with respect to various habitats and combinations thereof. Belvosia, species lay microtype eggs, but these are not randomly scattered and placed a short distance away from where the female fly has located a suitable host. It shows that the species living in the dry and cloud forests (and in all three principal forest types) were a subset of the diversity that lives in the rain forest and that there was no significant difference in the beta diversity between forest types.

3.7. Bi- and Tritrophic Interactions

The numbers of observed bi- and tritrophic interactions for each tachinid subfamily are summarised in Table 3, and the accumulation of interactions over time (rearing effort) is shown in Figure 10. Up until the end of 2023, a total of over 8300 tritrophic interactions have been suggested, but the virtually straight-line interaction accumulation curves suggest that this is only a small part of the total that occur. Applying Chao1 to the interactions suggests that the inventory of host associations is very far from complete. The overall observed number of tritrophic interactions was a little over 8000 (Table 3), but Chao1 gives an estimate of 49,454, i.e., 5.94 times larger, and for fly–caterpillar bitrophic interactions the multiplier is 5.88. Tachinid–plant bitrophic interactions are only a little more complete (multiplier = 4.34).

3.8. Food Web Metrics

We first calculated connectance (C), rescaled connectance (RC), link density (LD) and generality for the whole data set, and then separately for each ecosystem (Table 4).
We also calculated these indices separately for each five-year time period and ecosystem, and the results are provided in Table S2. Overall, both generality and linkage density were highest in the rain forest and lowest in the cloud forest. However, it should be noted that the reliability of the values might be reduced because of the incompleteness of the samples, with many species represented by only a few individuals (singletons and doubletons) [36].

3.9. Species Abundance Distribution

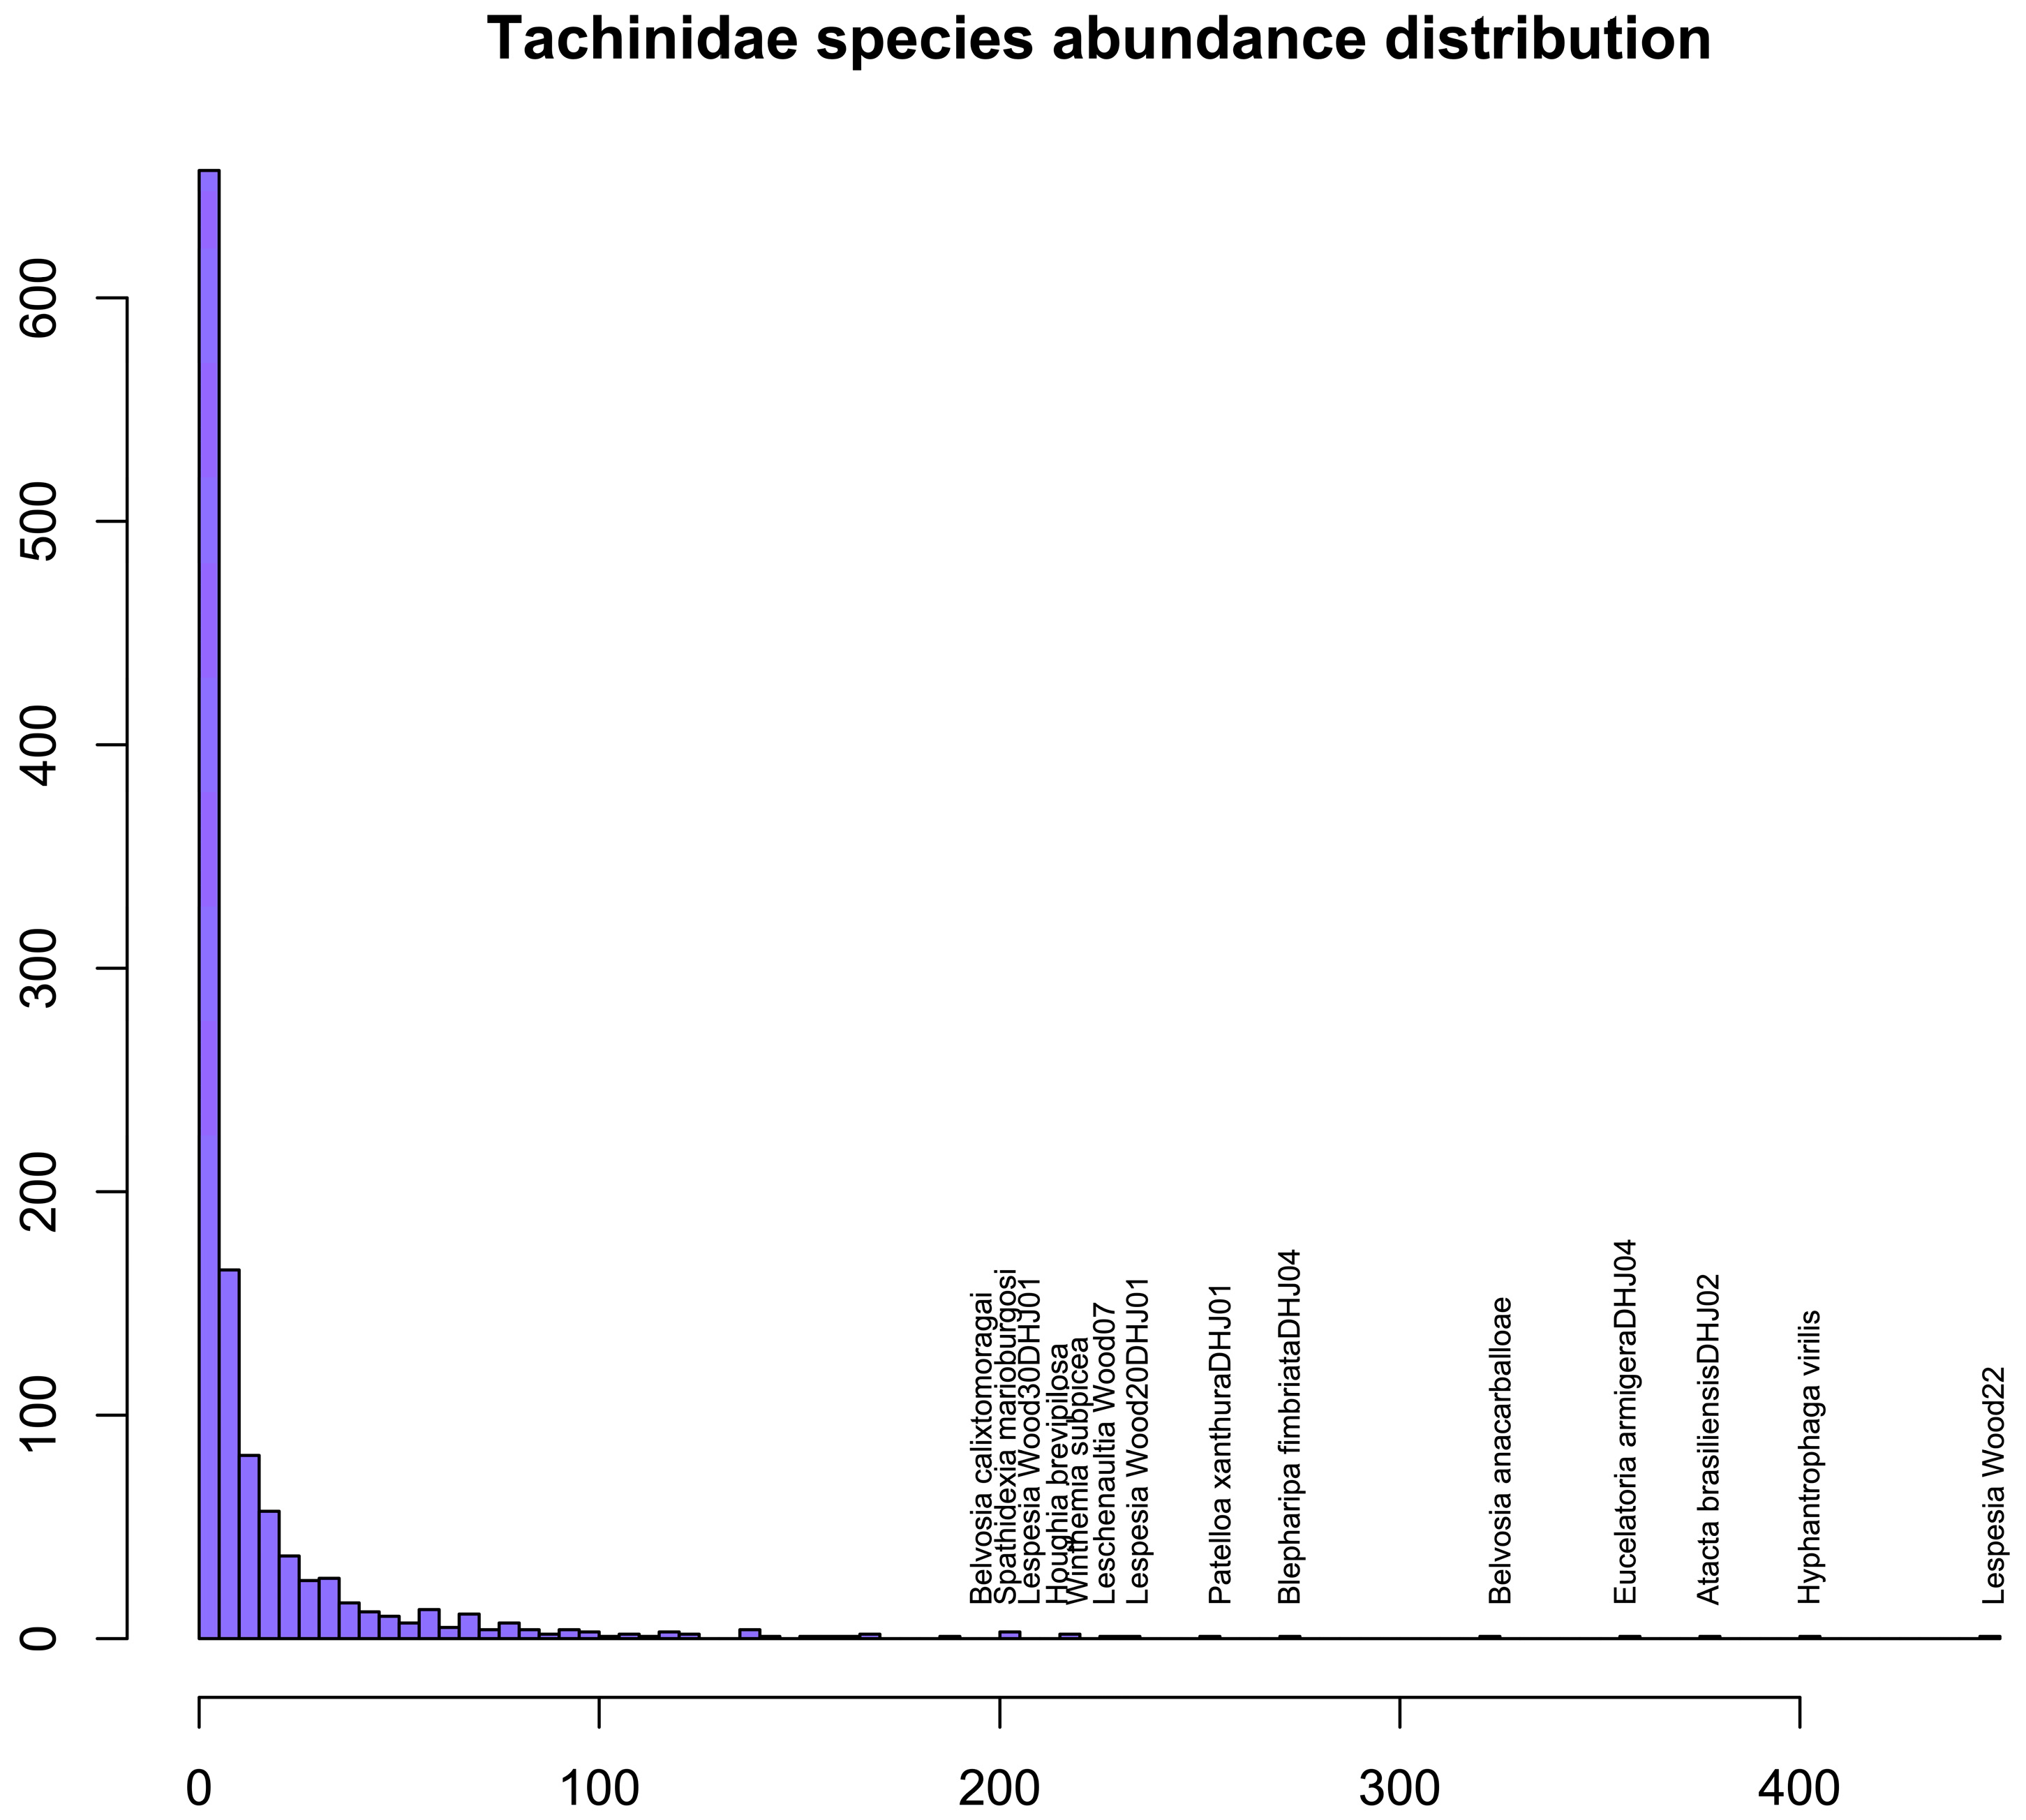
The tachinid species abundance distribution is strongly right-skewed, with 14 species having been reared on more than 200 independent occasions (Figure 11). Eight of these, from seven genera (Atacta, Blepharipa, Belvosia (×2), Houghia, Hyphantrophaga, Leschenaultia and Patelloa), belong to the tribe Goniini, members of which lay microtype eggs, but none belong to the Tachinini, which are also indirect parasitoids but lay macrotype eggs (see Section 3.12).

3.10. Host Ranges

3.10.1. Utilisation of Host Families

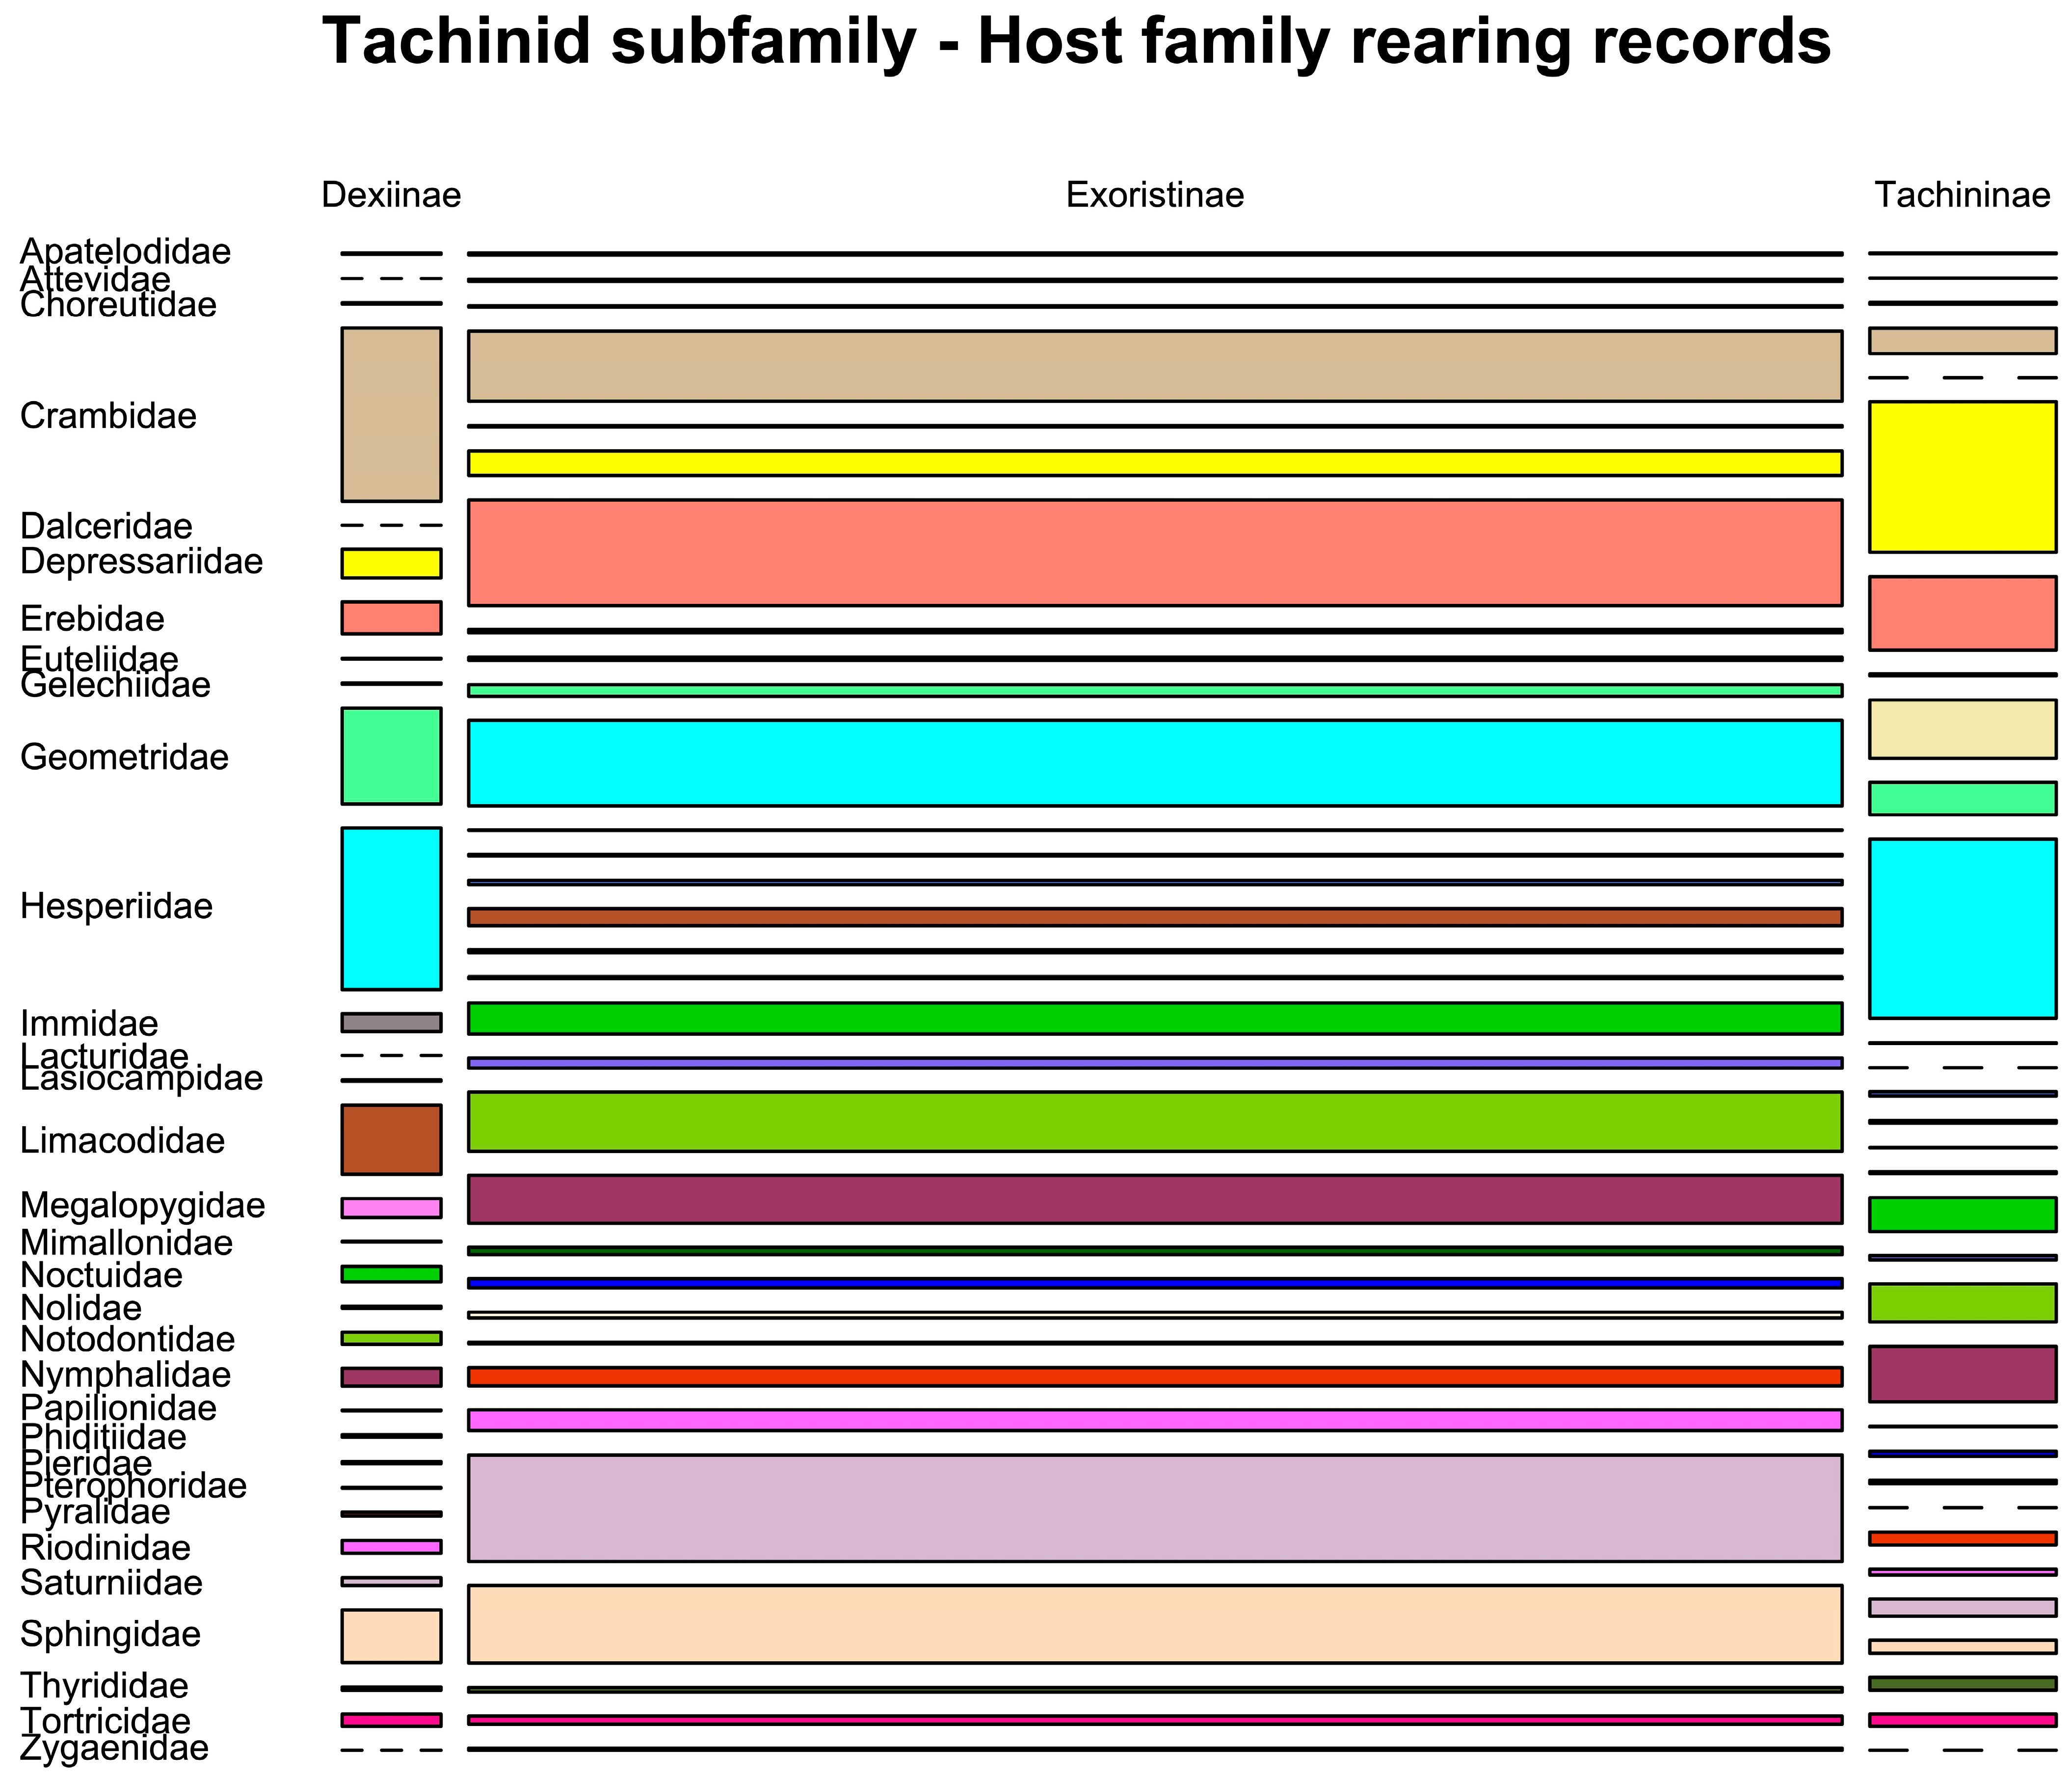
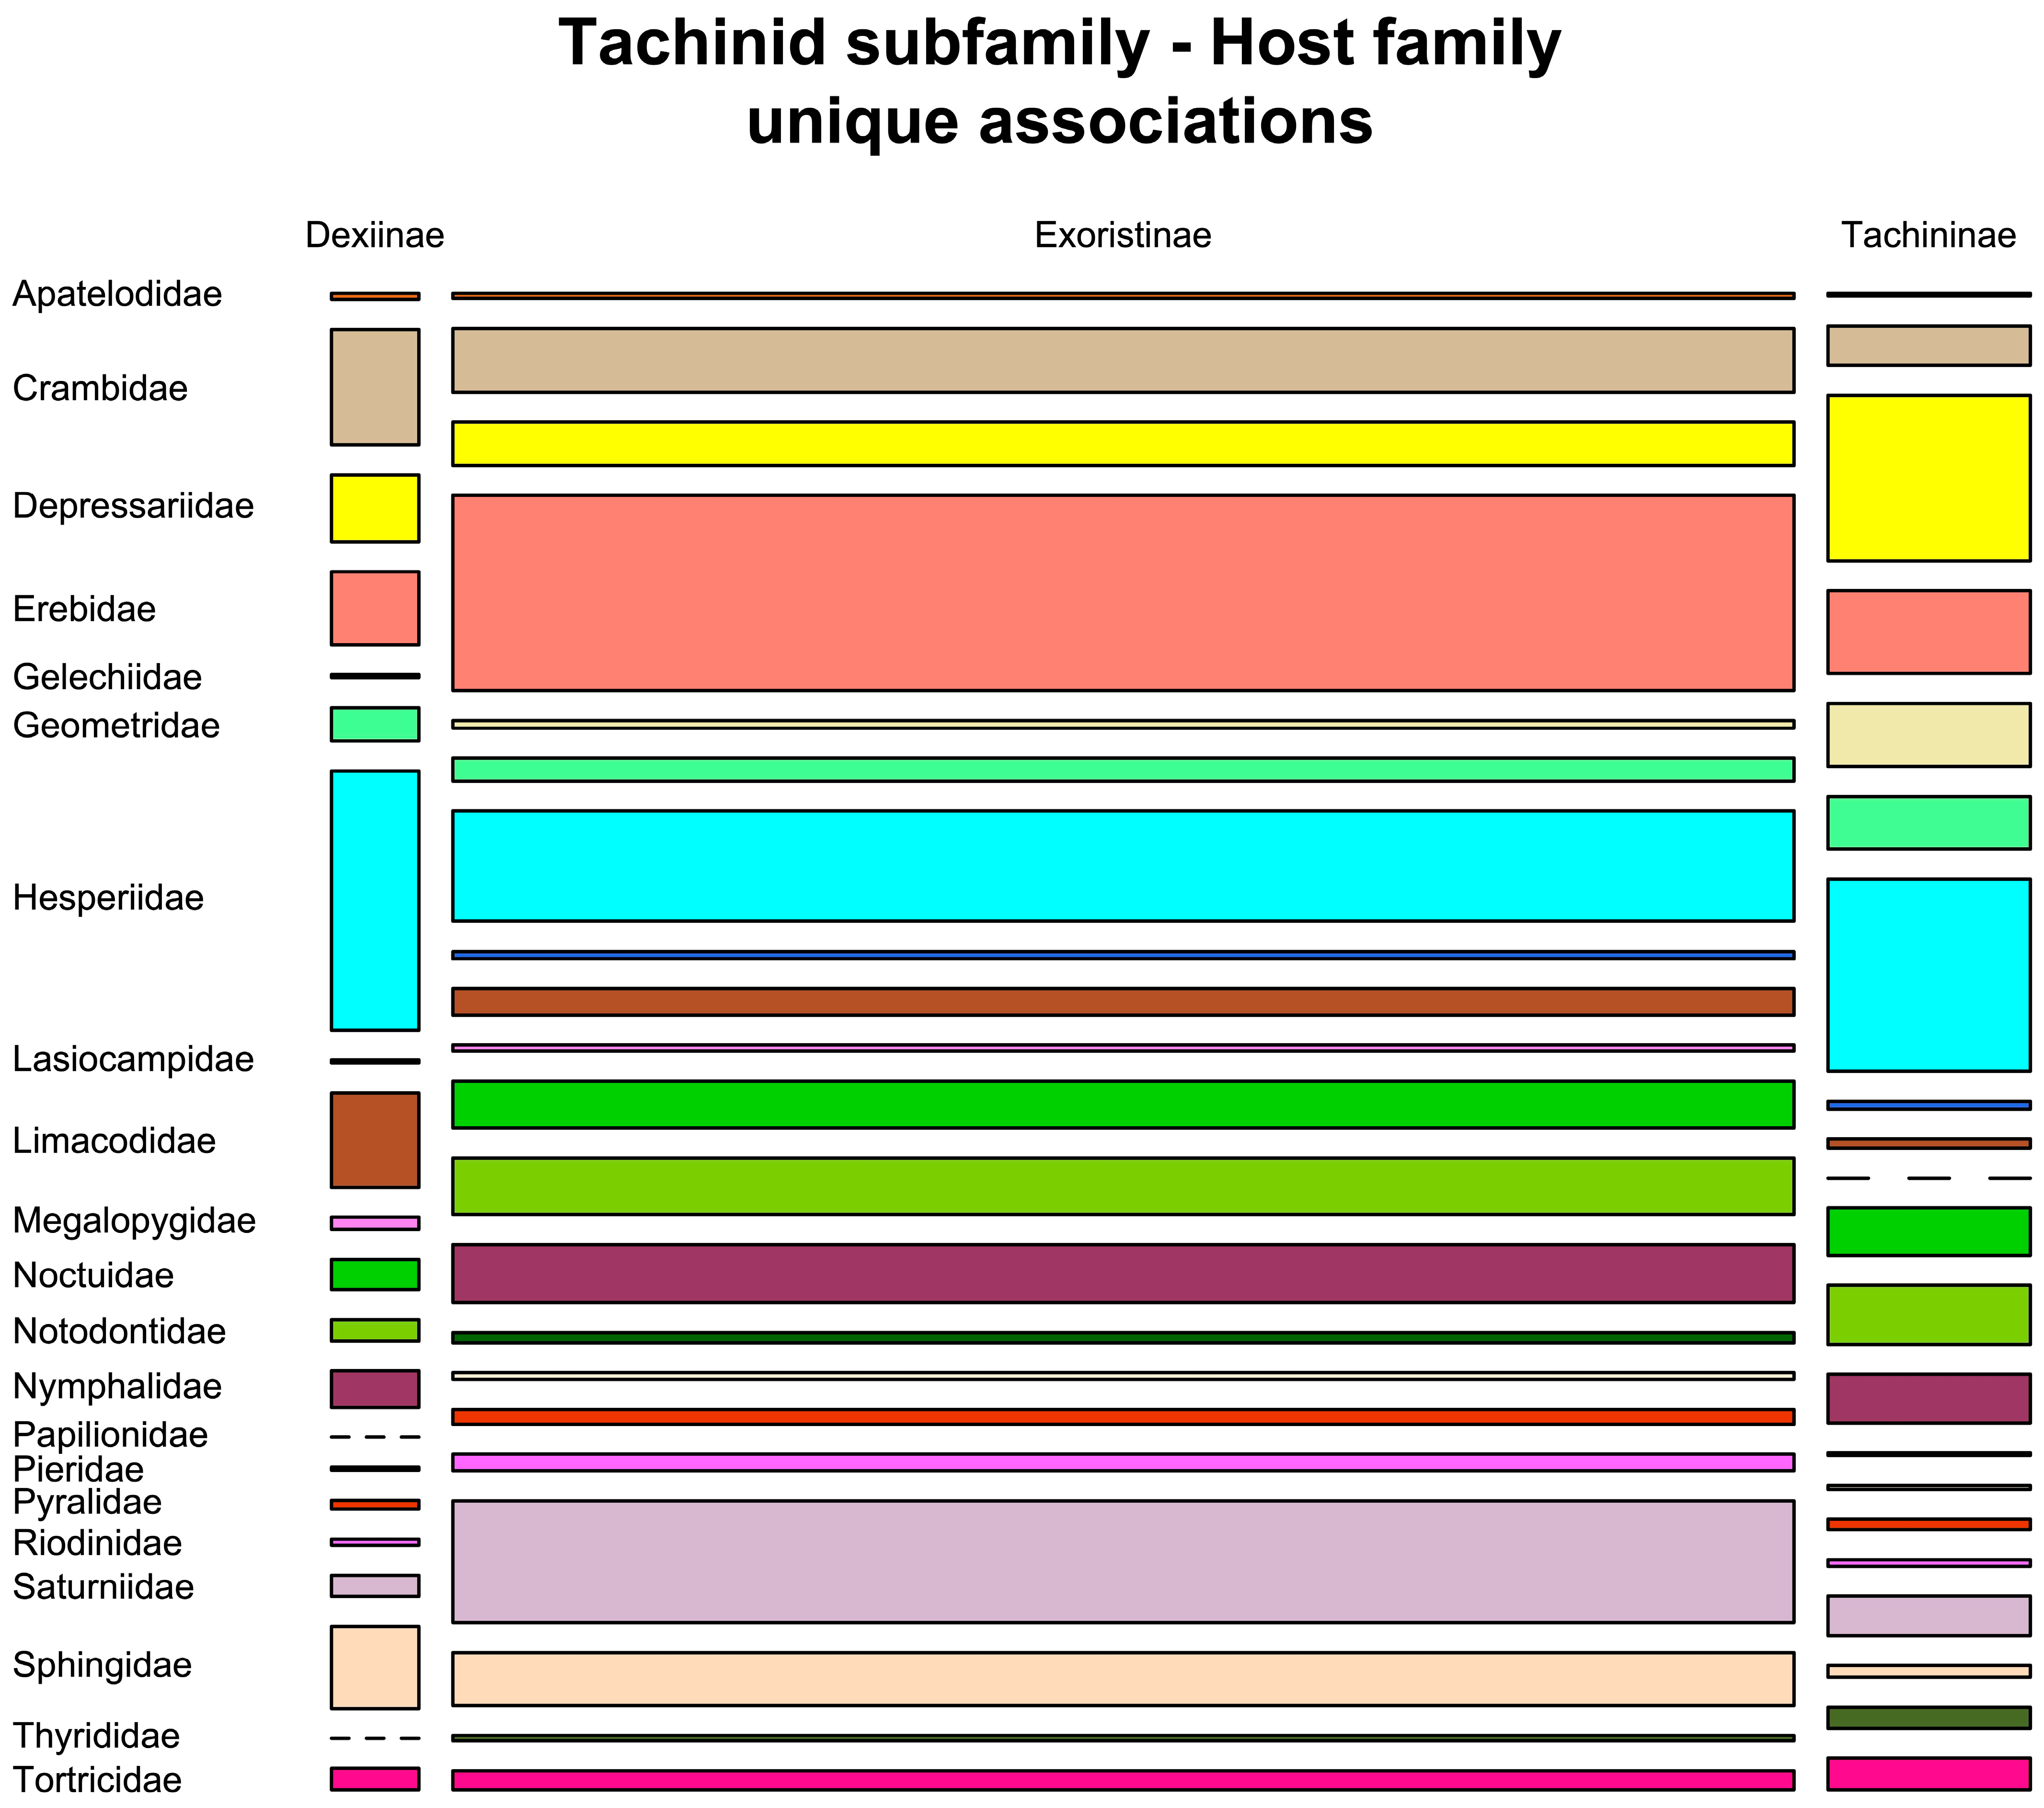
Although broadly similar, there are a few noticeably different host preferences between tachinid subfamilies (Figure 12). Tachininae were reared far more often from Gelechiidae than were Exoristinae, and there were no records of gelechiids as hosts of dexiines. In contrast, the majority of rearings from Limacodidae were dexiines whereas saturniid and sphingid parasitism was dominated by exoristines. The latter generally have relatively large bodies and so require larger-bodied hosts. The number of bitrophic associations of the three tachinid tribes with caterpillar families closely resembles the number of rearing events (Figure 13).

3.10.2. Utilisation of Host Species—Generalists Versus Specialists

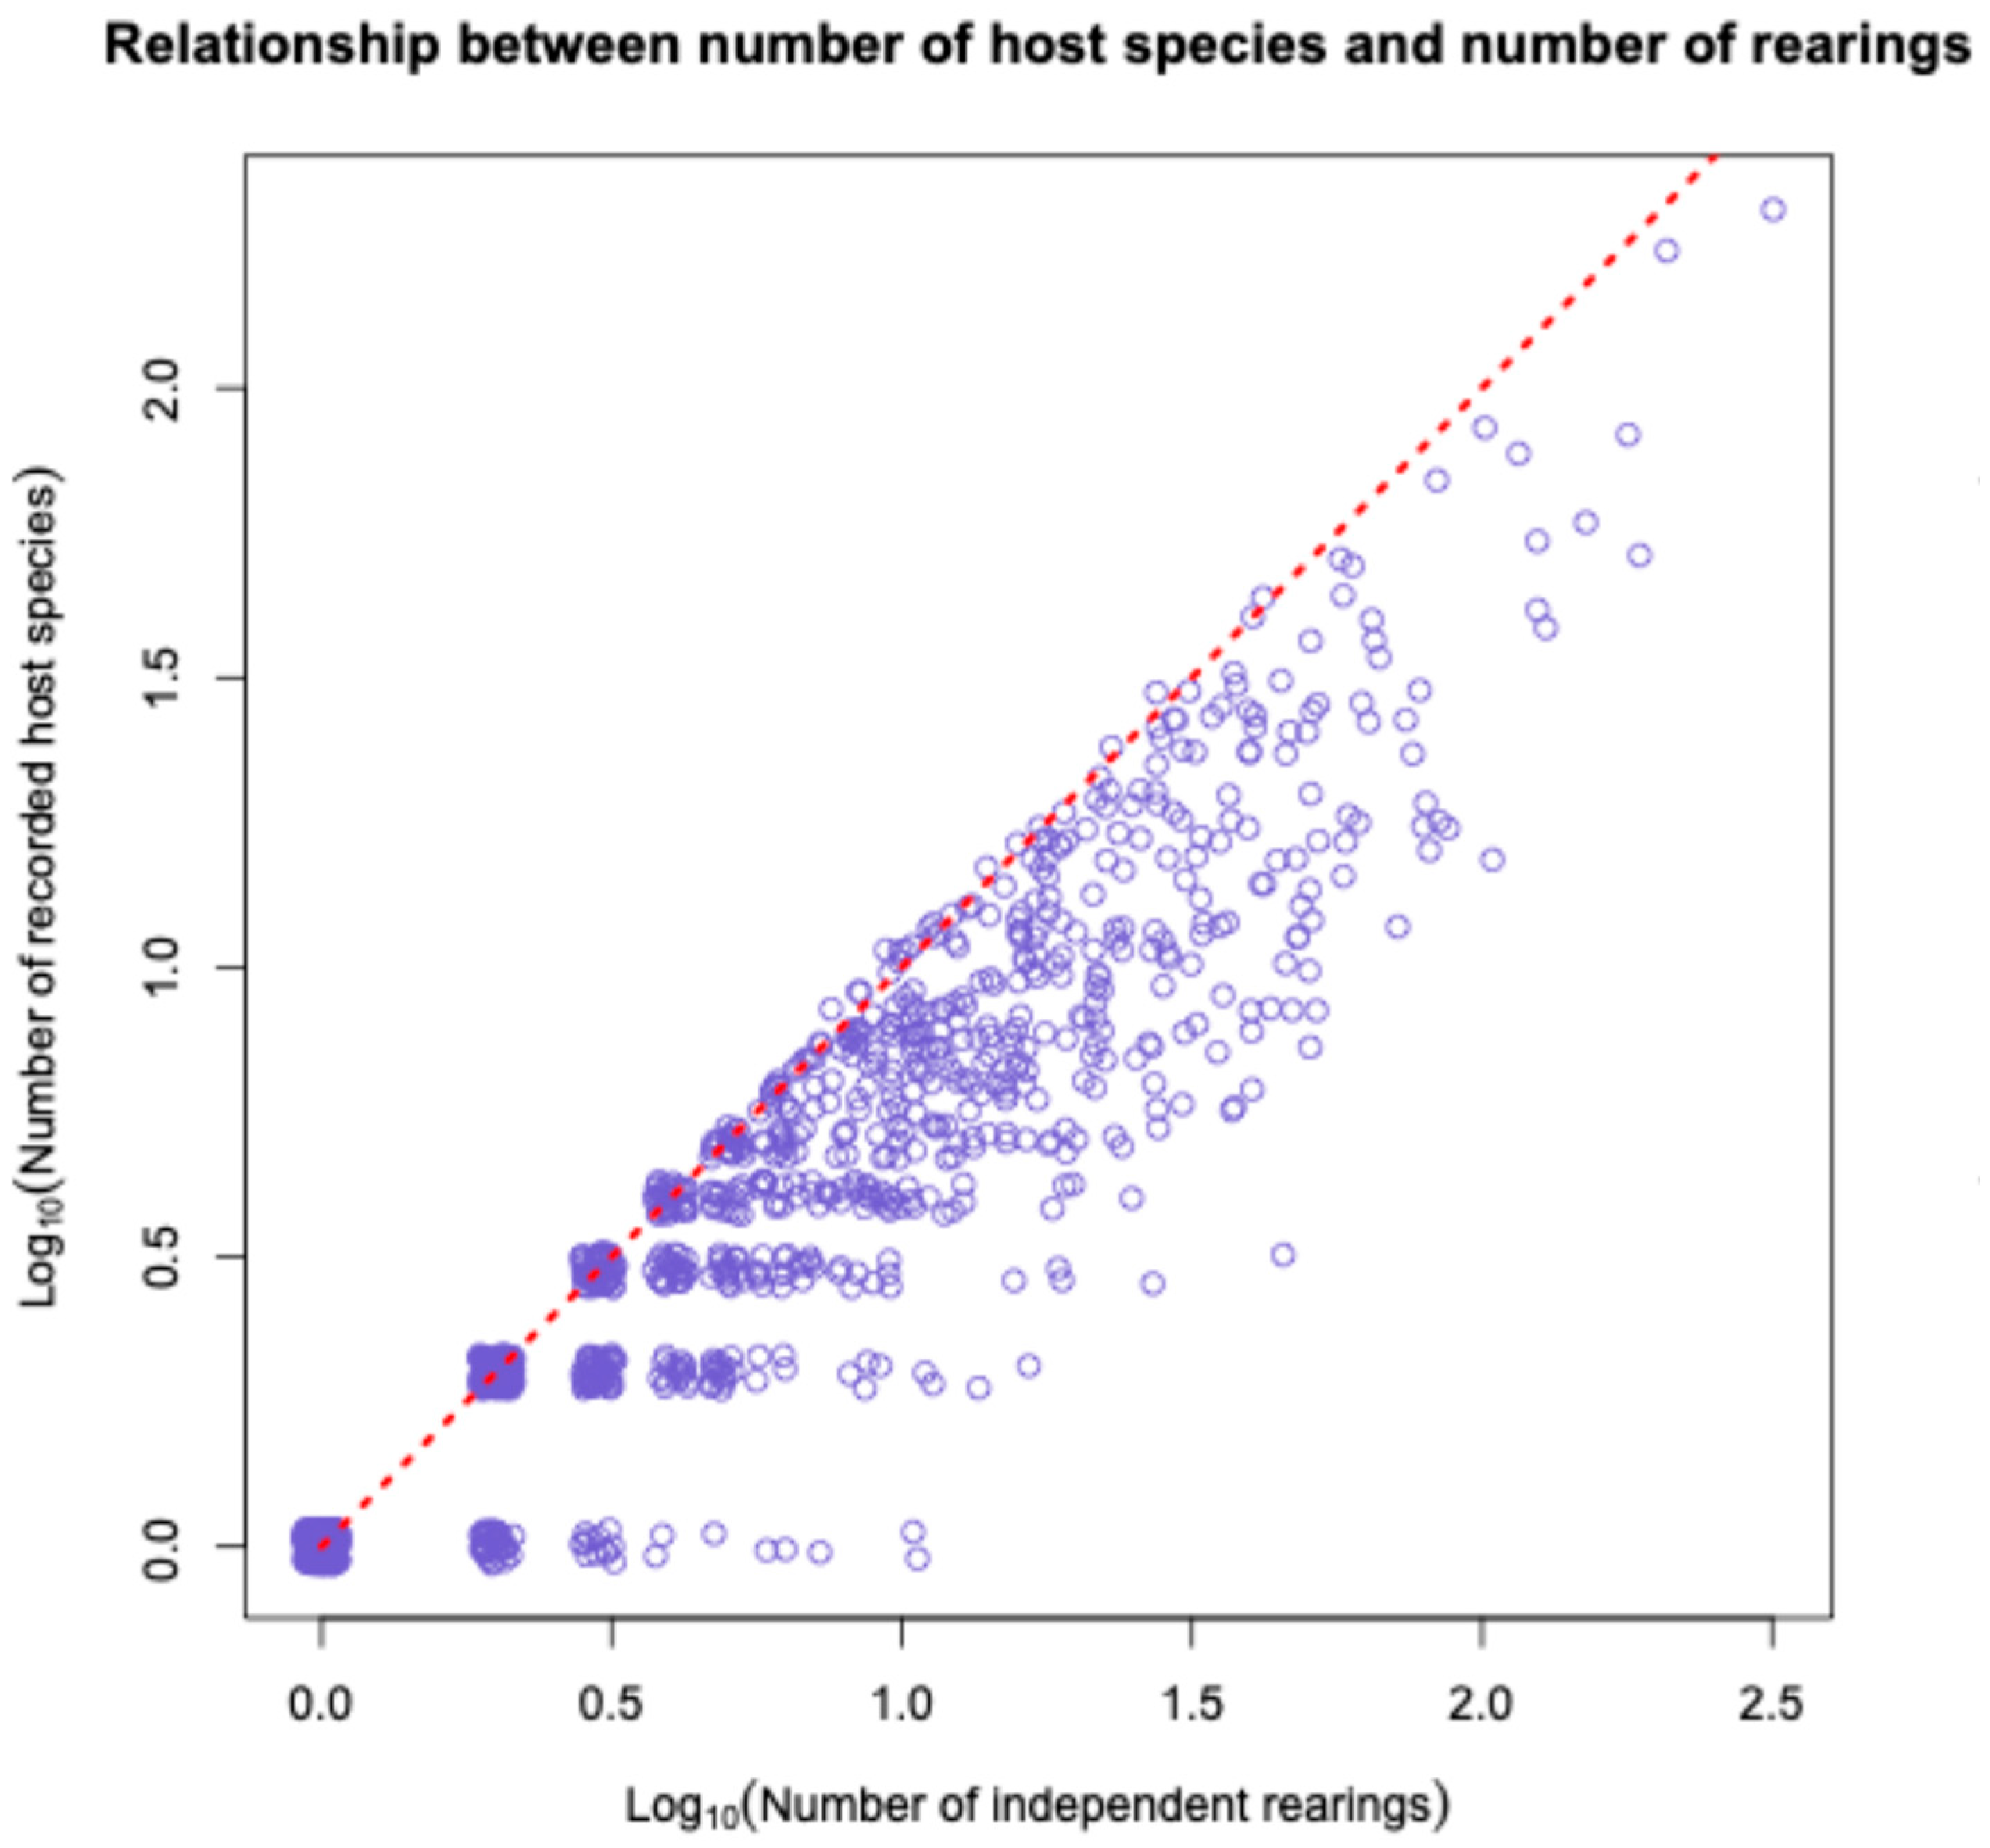
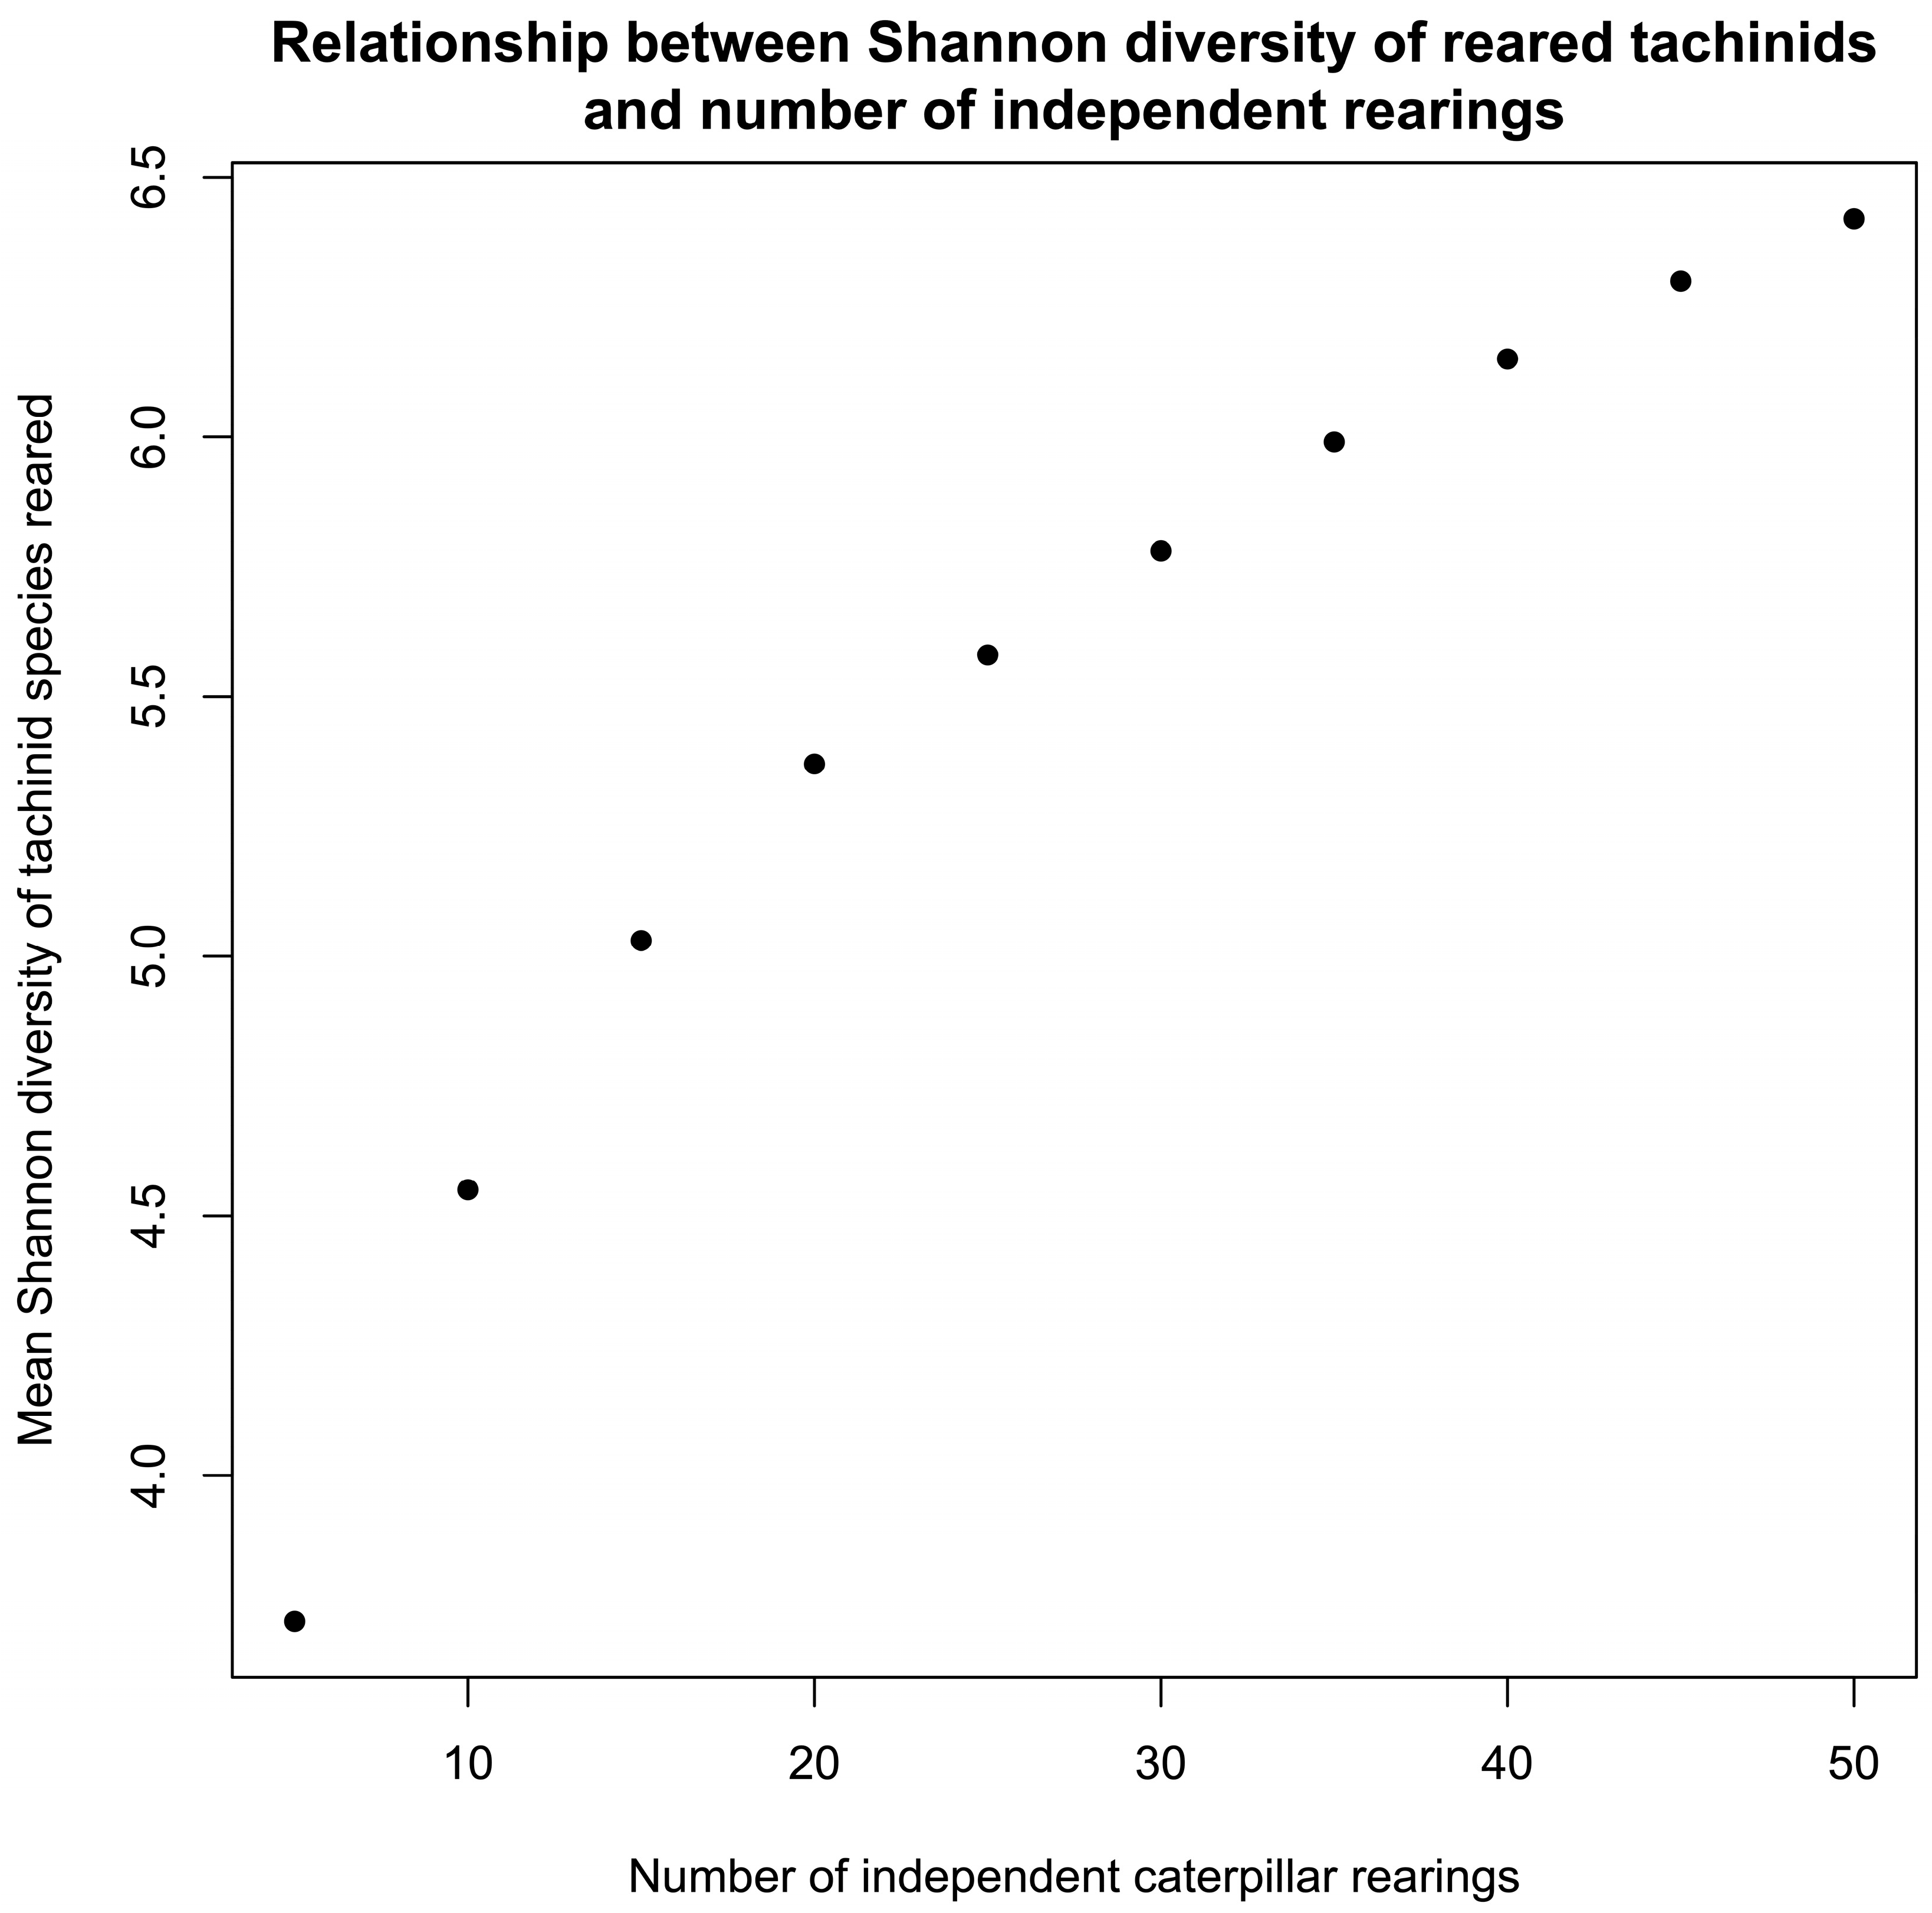
The number of host species recorded for each tachinid species was strongly correlated with the number of rearings of the tachinid species (Figure 14). The linearity of the number of host associations with the number of rearings (see Figure 10) shows that it is practically impossible to know the full range of interactions either for the tachinid parasitoid species or for most given host species. Therefore, we investigated the relationship between number of rearings of a host caterpillar species and the Shannon diversity of the tachinid parasitoids recovered [41] (Figure 15). Although the curve is progressively shallowing it has not plateaued even for host species that have been reared 50 separate times.
We ranked the tachinid species by the ratio of host species to number of independent rearings and then segregated them into three approximately equal-sized categories, i.e., the third most generalist, an intermediate third, and the third most specialist (Table 5). The ratios for each subfamily were highly significantly different (χ2 = 26.24, d.f. = 4, p ≪ 0.001). Tachininae had the highest proportion of species in the most generalist category, whereas Exoristinae had the lowest.

3.11. Relationship Between Host Range and Range of Host Food Plants

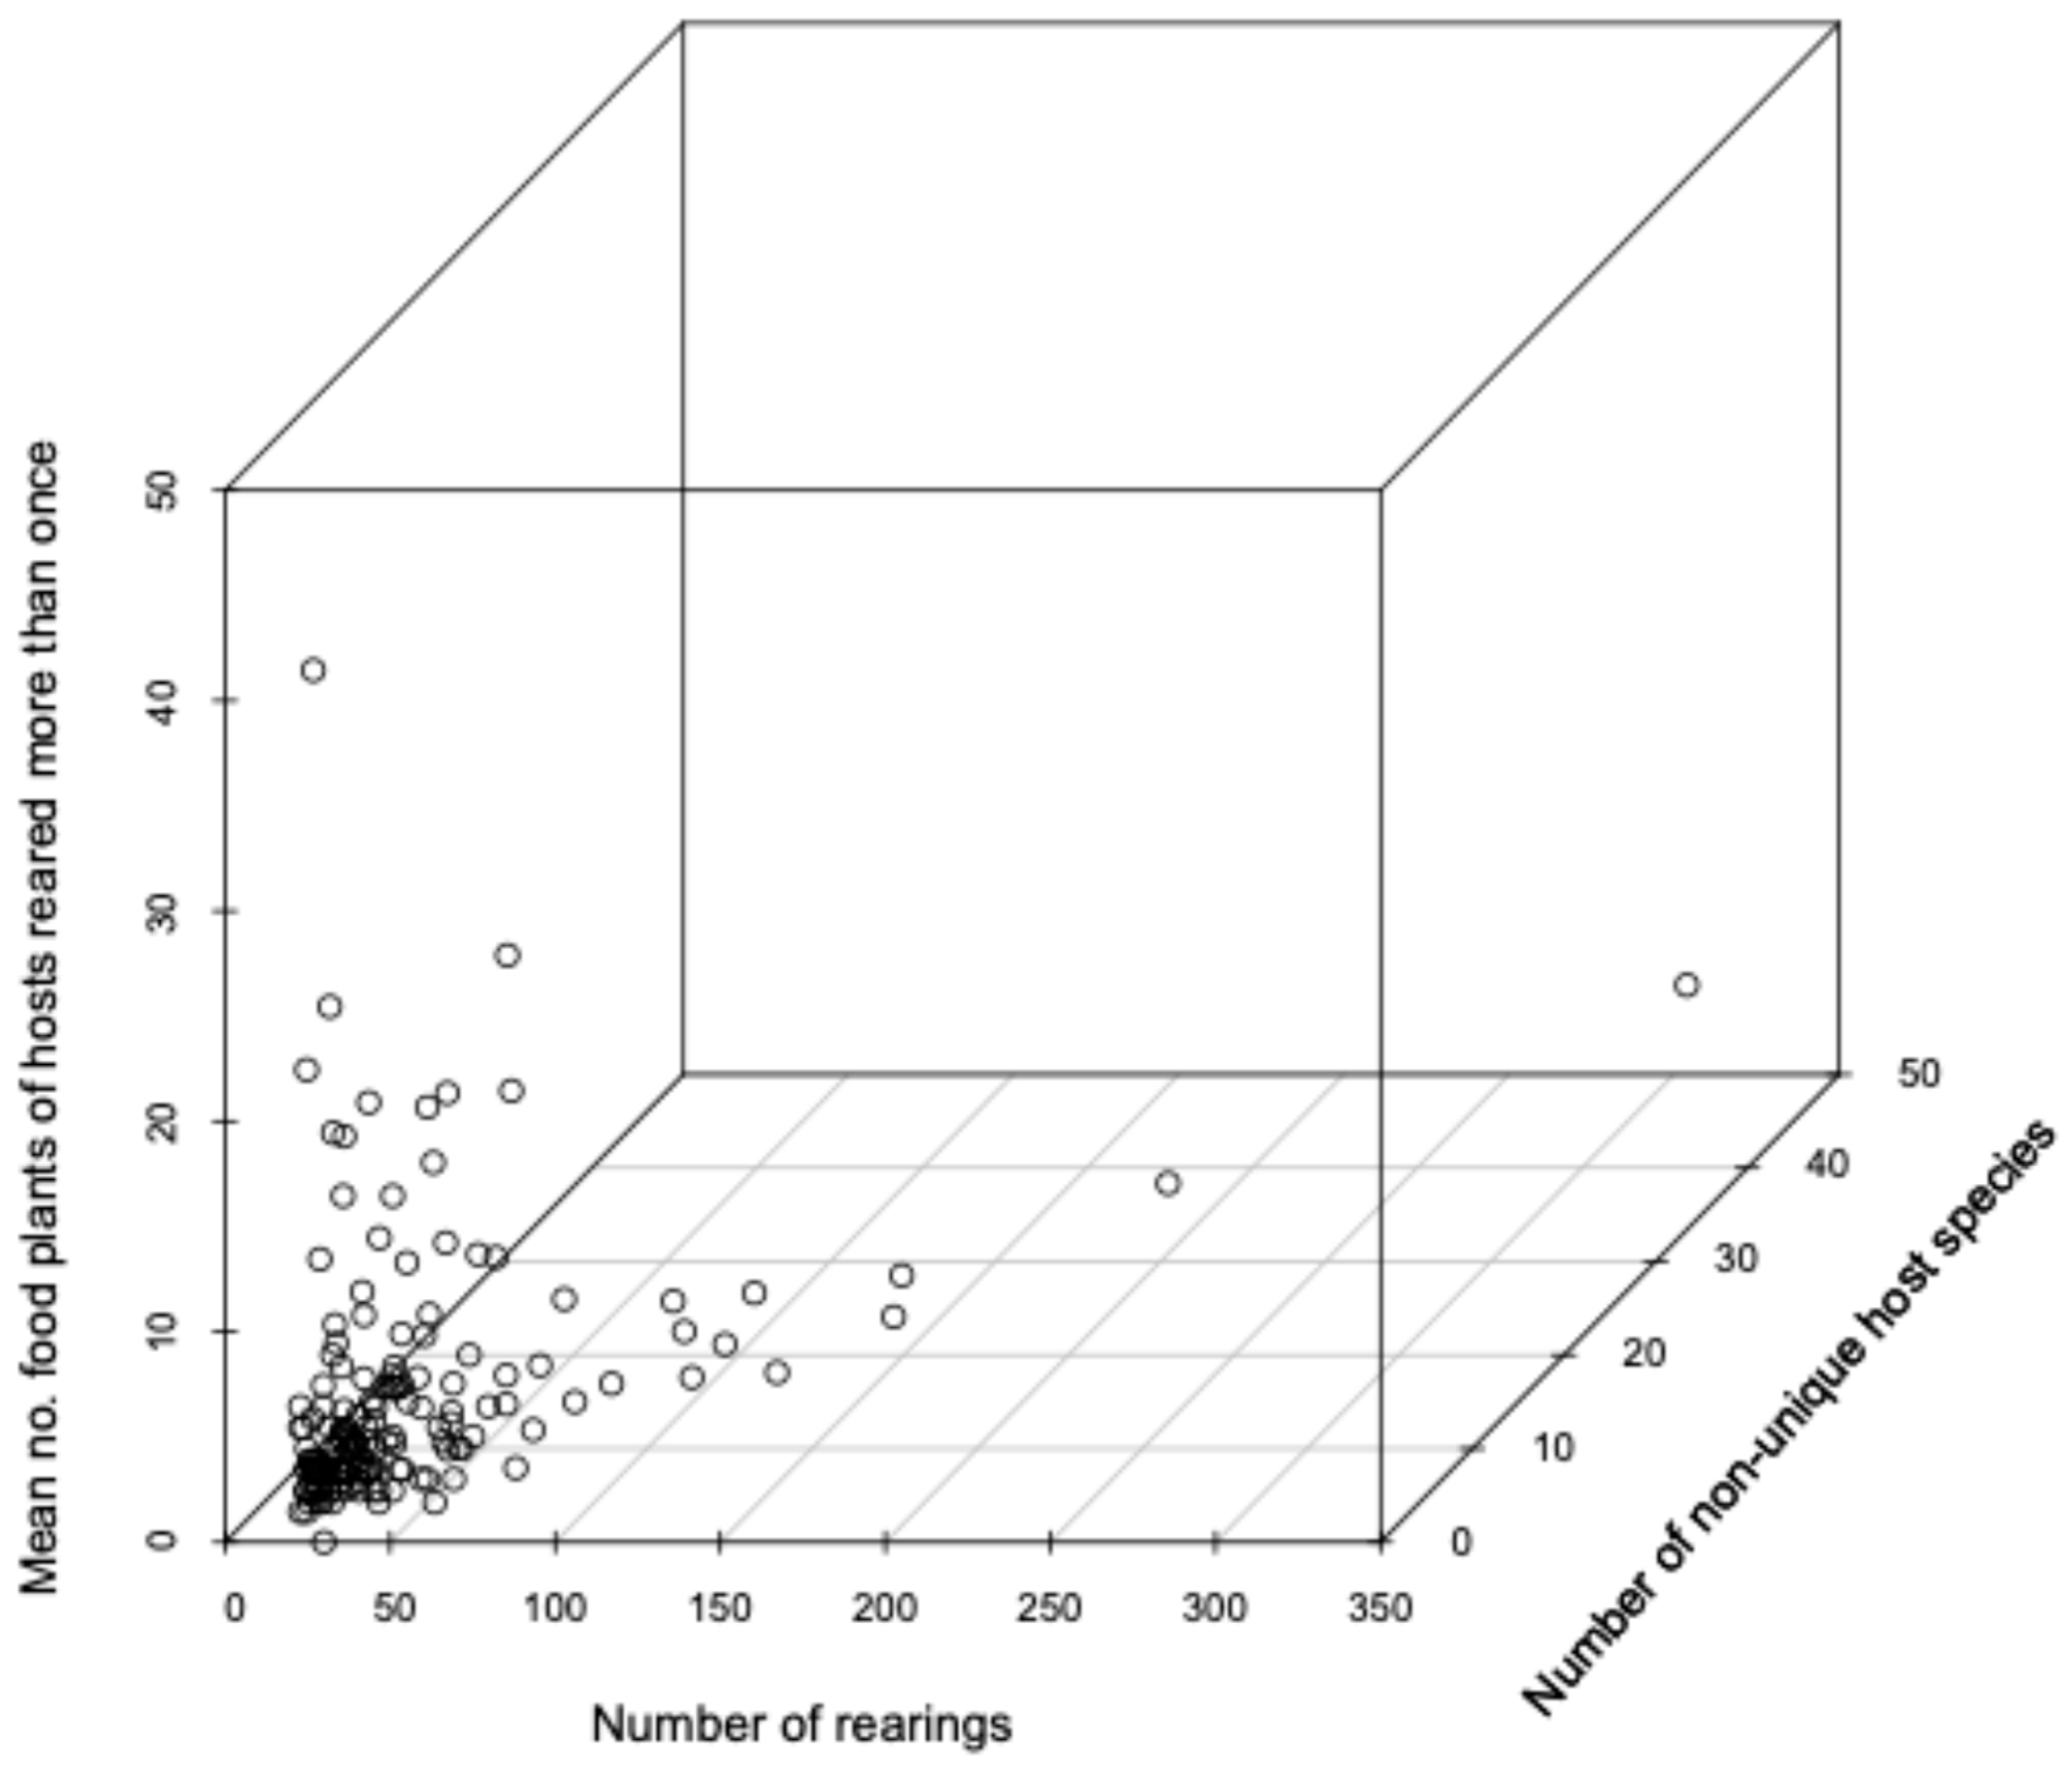
We investigated whether the number of host species recorded for each tachinid species was correlated with the food plant range of the former. We restricted analyses to only those tachinid species that had been reared on at least 20 independent occasions. Since number of host species recorded is strongly positively correlated with the number of independent rearing events (Figure 16) we included the number of rearings as a co-variate in the linear model, and we applied a square root transformation to normalise errors for the analyses because the relationship between mean food plant range of host caterpillar species and the number of host species for each tachinid species is strongly right-skewed.
We analysed the relationships between variables separately for the food plant records in the tachinid dataset, and also all food plant records of the hosts caterpillar species in the entire ACG data set [86]. Analyses were also performed with host associations that had only been detected once excluded. In no case was there a statistically significant interaction term. When only the data involving the rearing of a tachinid were analysed, a significant relationship between the food plant range of hosts and the host range of the tachinids was detected (Table 6). However, the effect size was very small, and the relationship was negative, i.e., tachinid species with the largest host ranges tended to attack caterpillars on a more restricted range of food plants. When data for unique tachinid–host interactions (i.e., that tachinid species was reared from that host species only once) were excluded, no significant correlation with host caterpillar diet breadth was found. Further, when caterpillar diet breadth was based on all rearing of that species in the ACG dataset [86], no significant associations were found.

3.12. Oviposition Strategy

Other studies have reported differences in host ranges between tachinids that oviposit directly onto or into a host and those that oviposit indirectly, either by glueing microtype eggs to foliage that are consumed by a host or by laying eggs on the substrate which then hatch rapidly, leaving the newly hatched larva to locate and parasitise the host. We therefore examined whether this was the case in the ACG dataset. Because of the large proportion of host associations recorded only once, we restricted the analyses to tachinid species that had been reared on at least 20 separate occasions. The Blondeliini (represented in ACG by the genera Anoxynops, Borgmeiermyia, Calodexia, Calolydella, Chaetostigmoptera, Erythromelana, Eucelatoria, Lixophaga, Myiopharus, Oxynops, Sphaerina, Thelairodoria, Thelairodoriopsis, Trigonospila, and Vibrissina) includes both direct- (e.g., Eucelatoria and Vibrissina which have a sternite 7 piercer used to penetrate the host cuticle and insert their eggs internally in the host) and indirect-ovipositing species (e.g., Calodexia, which has microtype eggs), but for many of the ACG cases, the oviposition strategy is unknown, and therefore, they were excluded from the analyses.
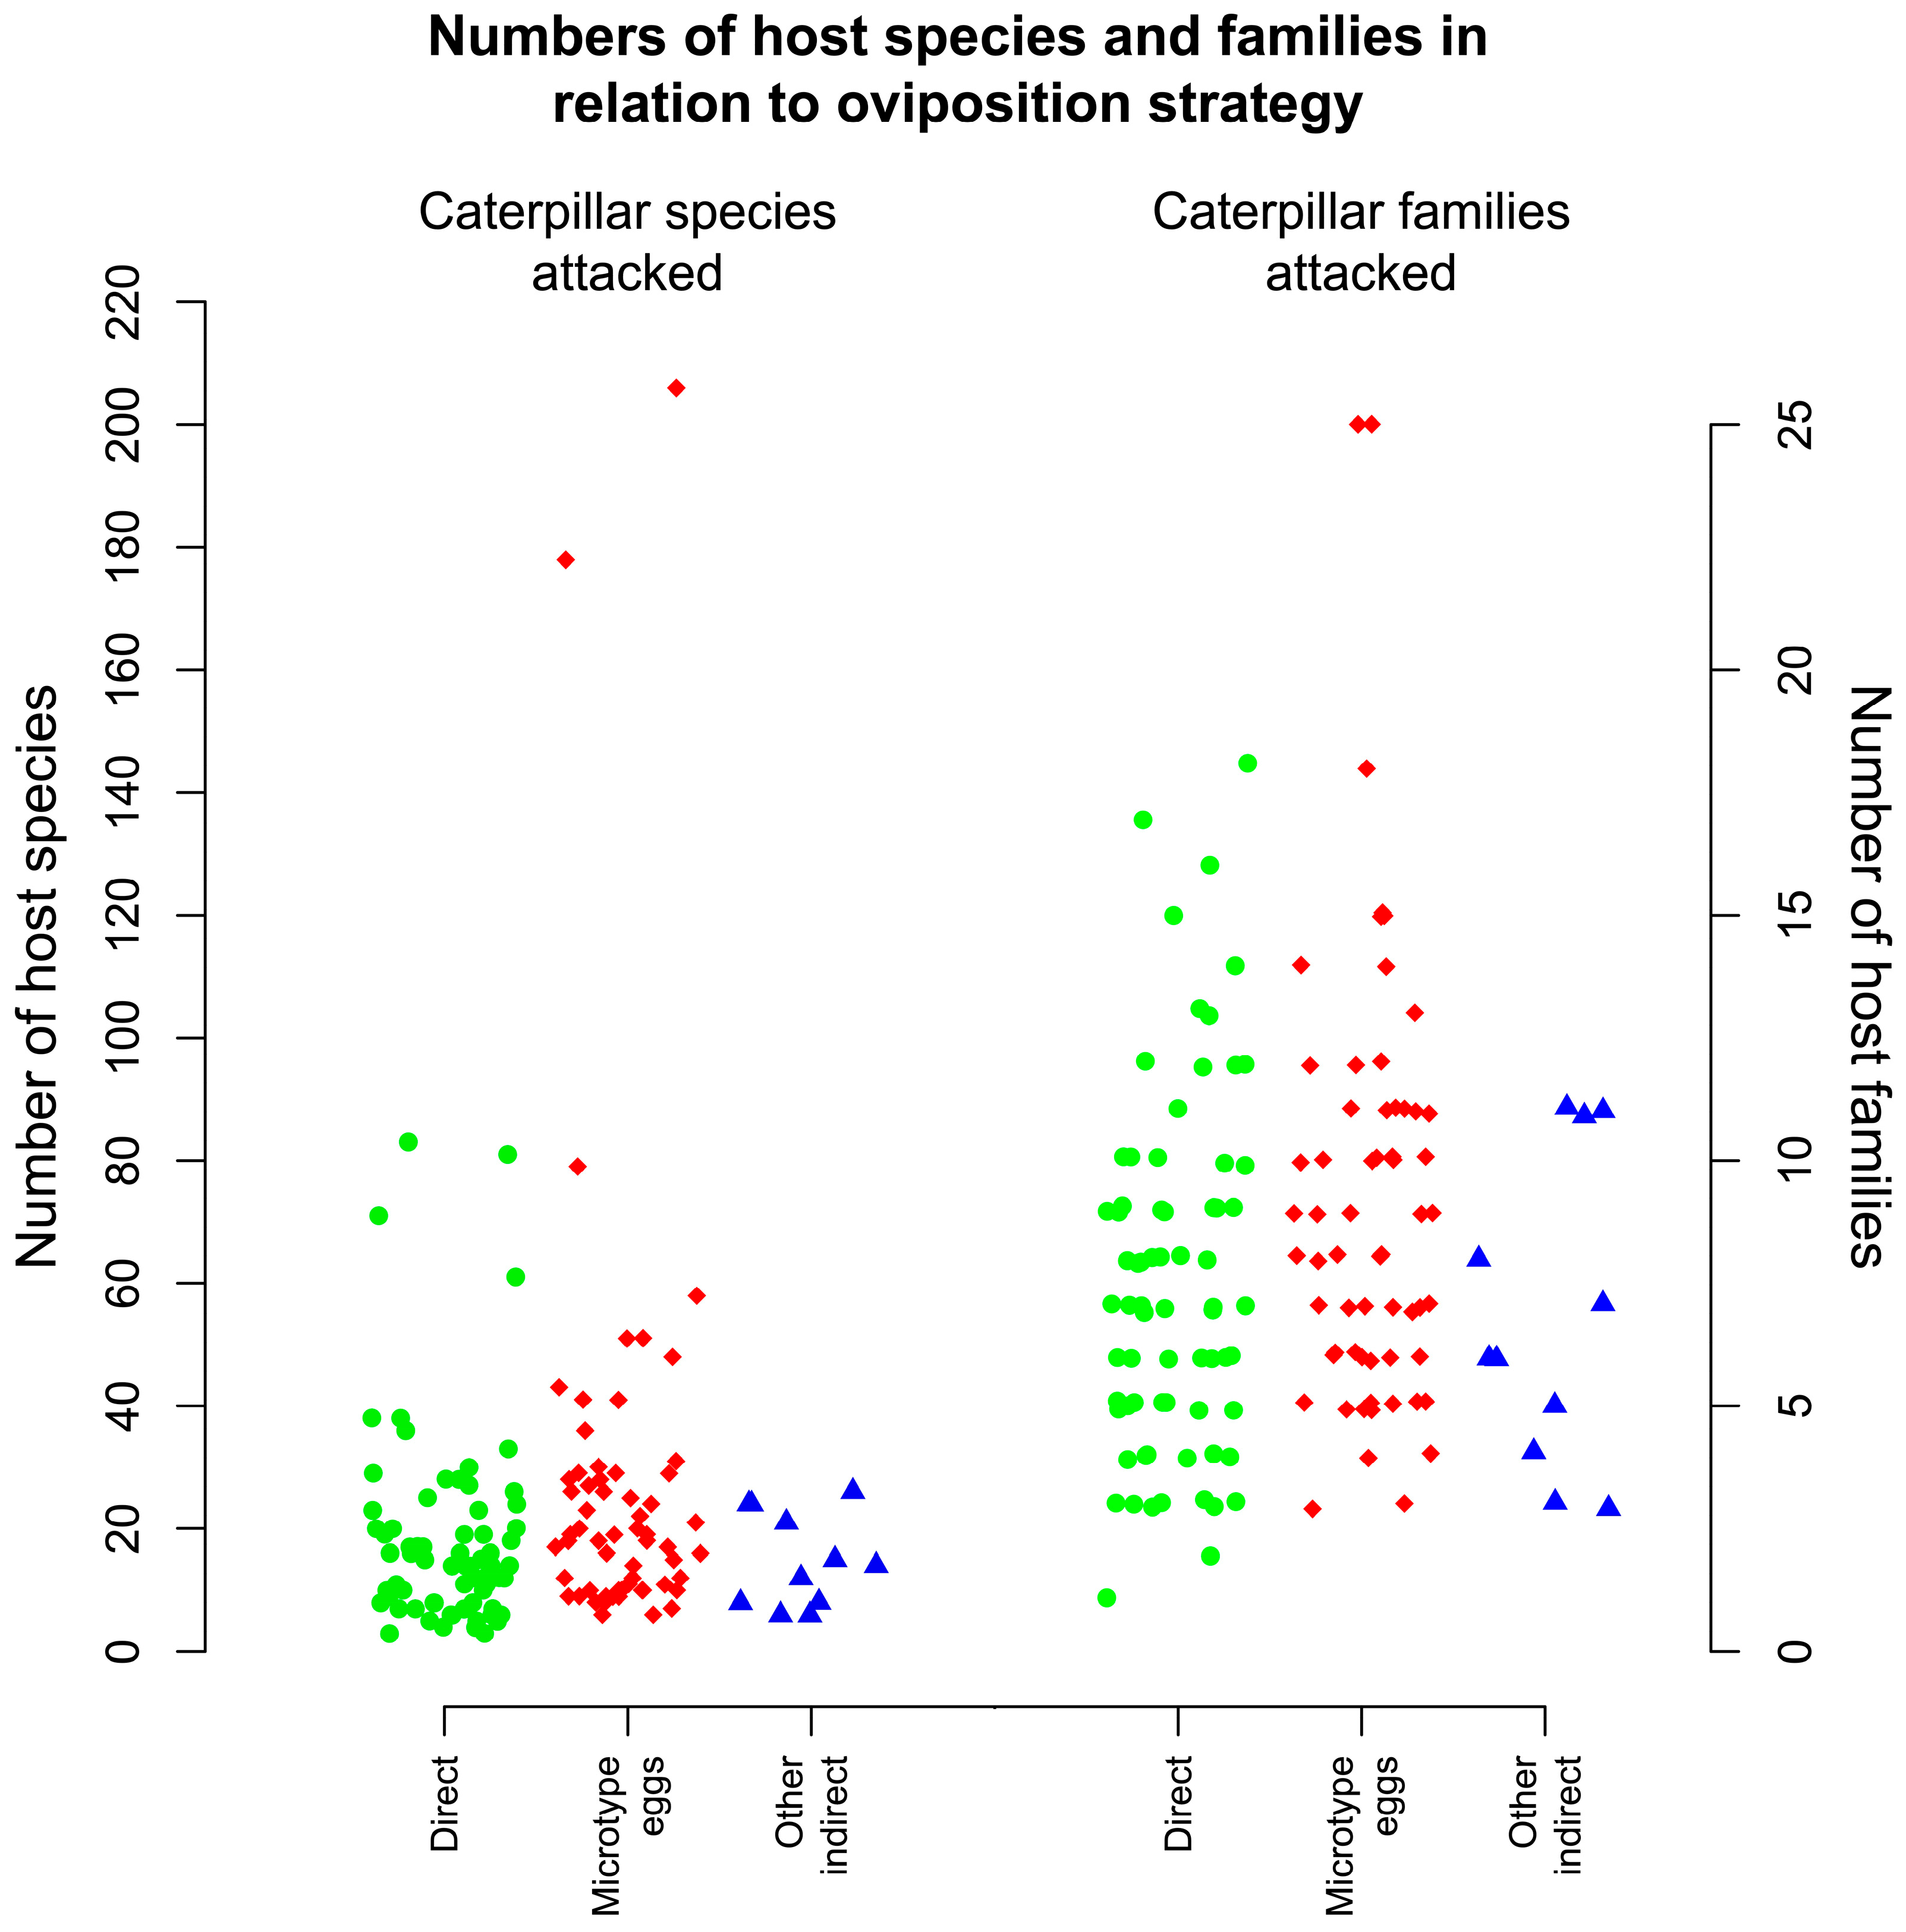
Figure 17 shows the numbers of host species and host families for the non-Blondeliini tachinids employing each of the oviposition types, i.e., direct, microtype eggs and other indirect strategies. Analysis of variance suggested a trend (F(2,139) = 2.523, p = 0.084) and pairwise comparisons using t-tests revealed that, while there were no significant differences between direct and indirect groups (t = 1.2, d.f. = 27.4, p = 0.24) or between direct and microtype strategies (t = 1.87, d.f. = 83.9, p = 0.65), there is significant difference between indirect and microtype strategies (t = 2.55, d.f. = 66.6, p = 0.013); applying Bonferroni correction for multiple tests, the last of these was still significant (p = 0.039). On average, species with microtype eggs had larger host ranges (27.4 vs. 14.9). An ANCOVA of the same data but including the number of rearings as an additional explanatory variable showed strong effects of number of rearings (p ≪ 0.001) laying microtype eggs (p ≪ 0.001), and included a significant negative interaction term of laying microtype eggs and rearing (p ≪ 0.001).
Visual inspection of Figure 17 indicates that the number of host families attacked is markedly less skewed than the number of host species. An ANCOVA including number of rearings as a covariate also showed that microtype egg layers attacked caterpillars belonging to a larger number of host families (p < 0.005) and also included a significant negative interaction term of laying microtype eggs and rearing (p < 0.001).

3.13. Comparison of Tachinidae and Ichneumonoidea Hosts

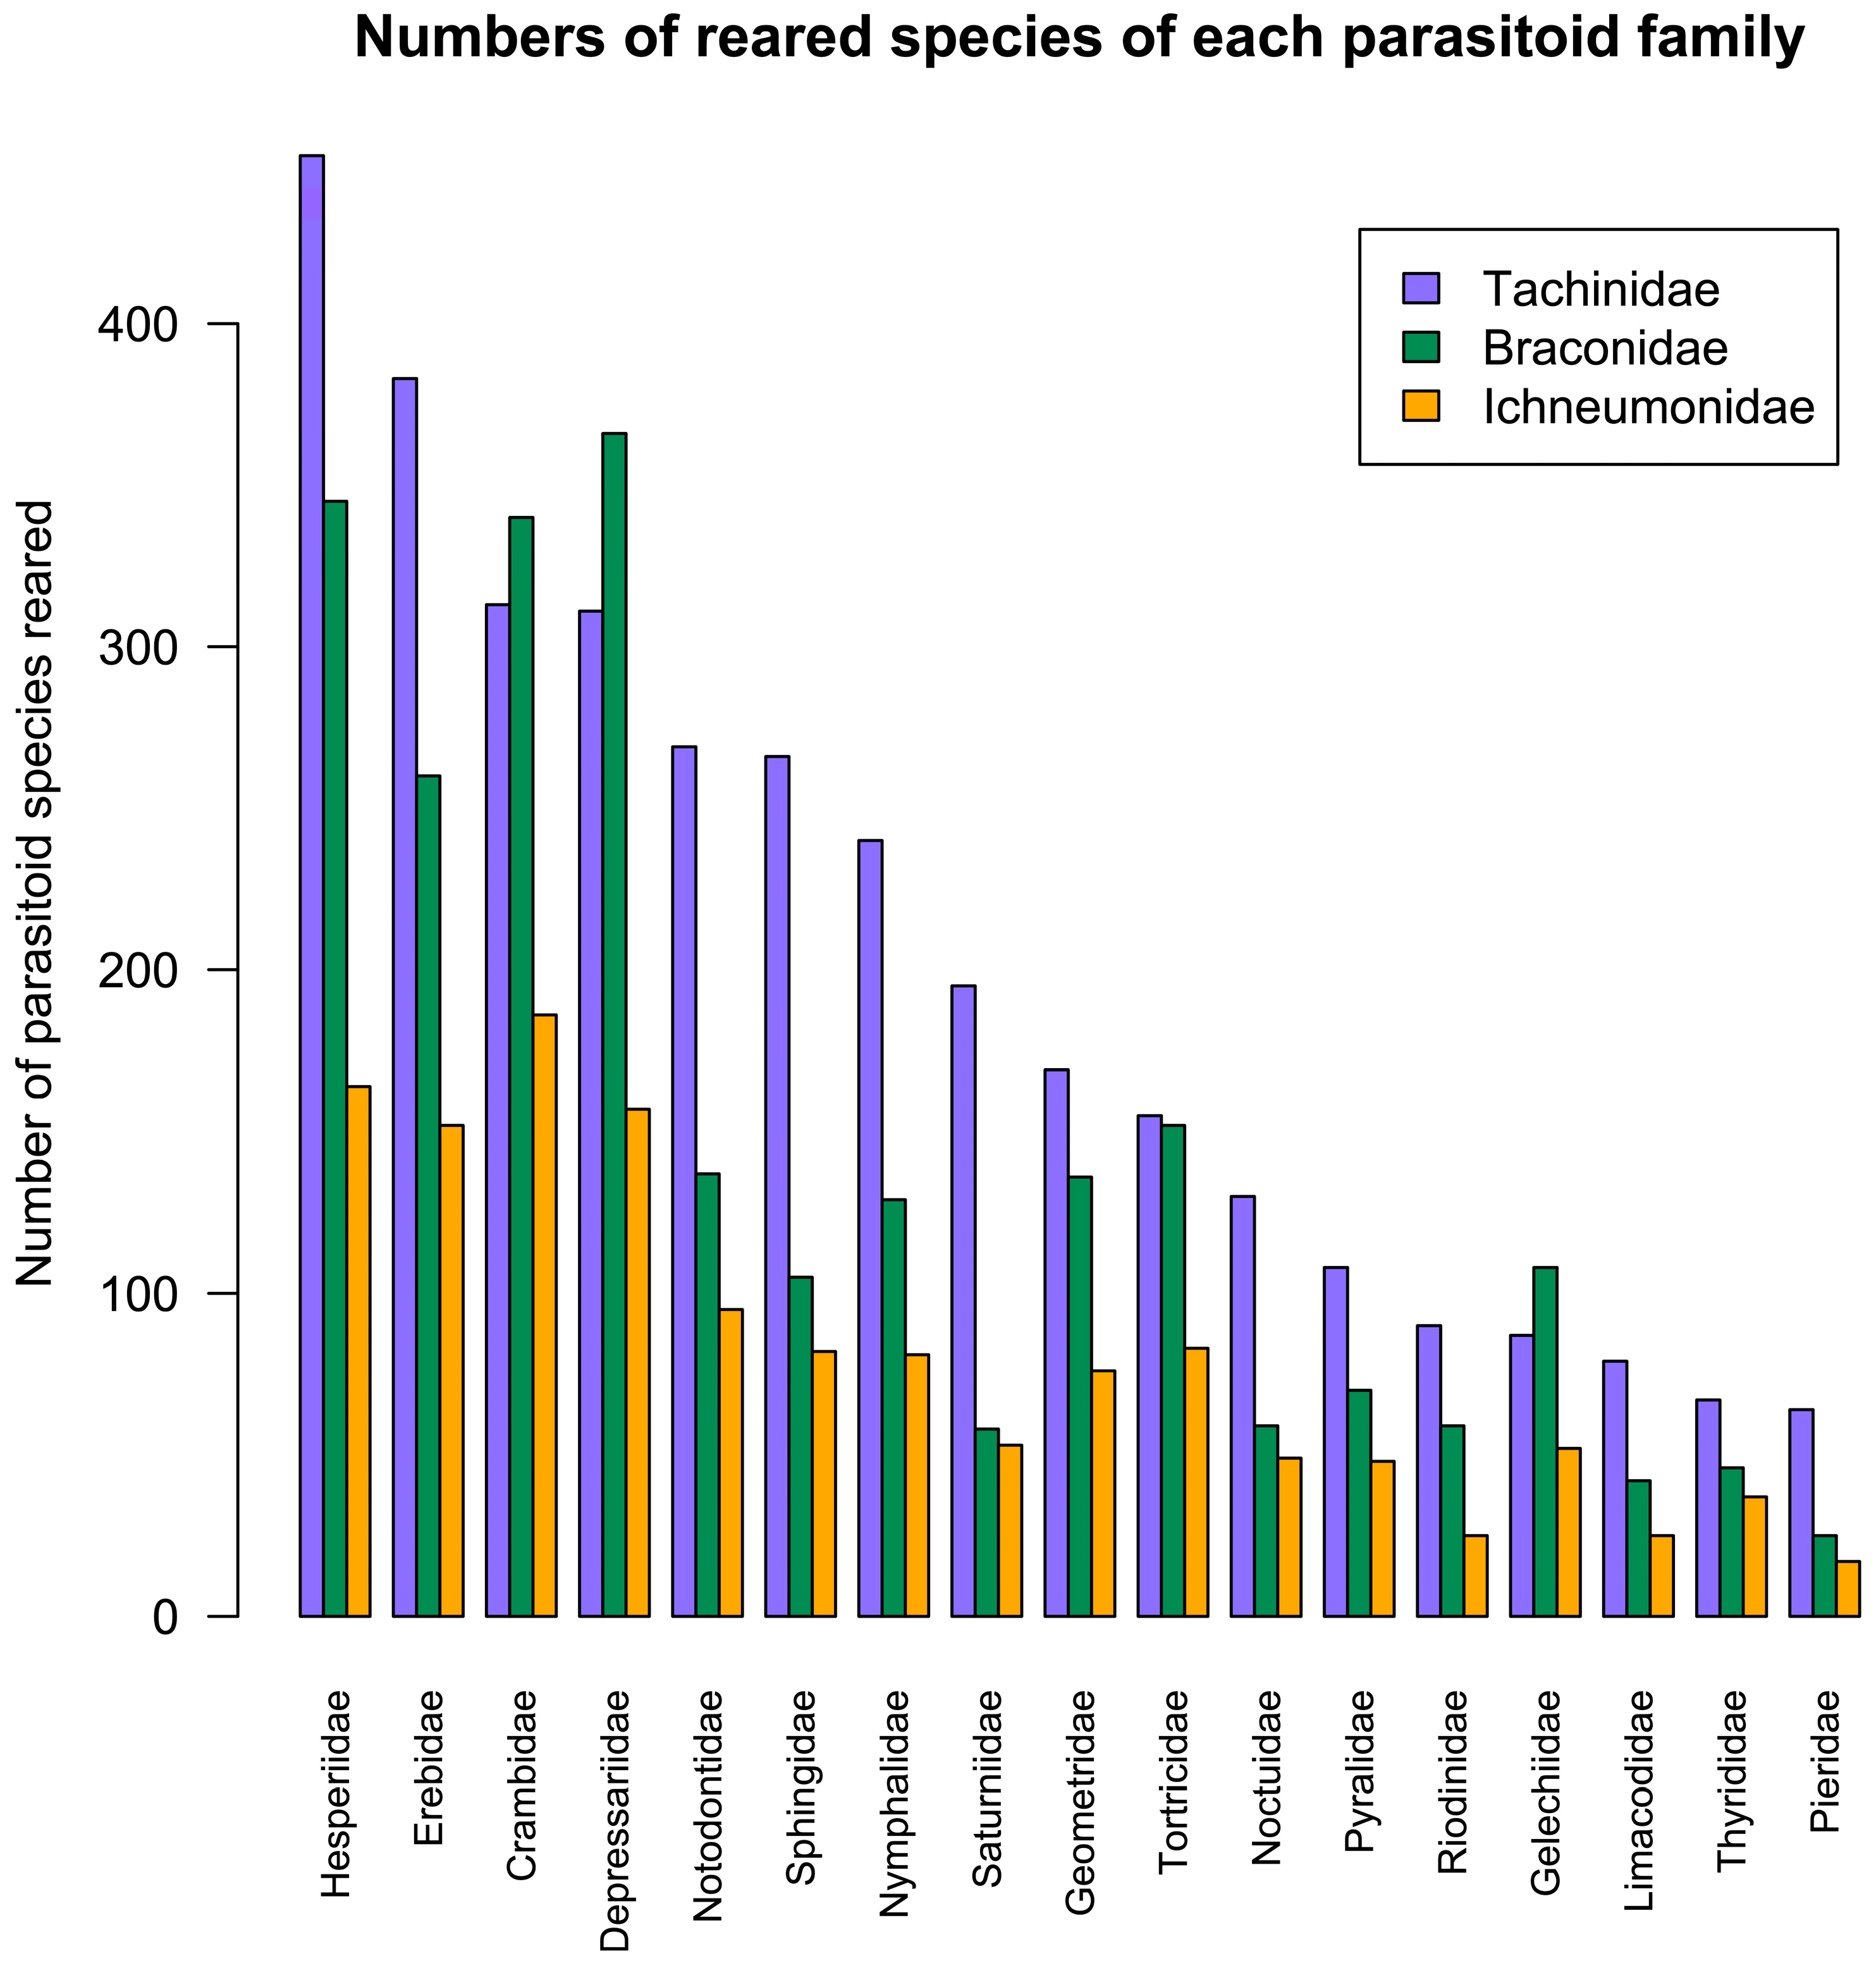
We compared host utilisation in Tachinidae with that of the other two major ACG caterpillar parasitoid families, Braconidae and Ichneumonidae (both Ichneumonoidea) [6]. Figure 18 shows the numbers of species of each parasitoid family reared from the 17 host families which are each associated with at least 60 different species of Tachinidae, and Figure 19 shows the relative numbers of species ranked in order of increasing tachinid representation.

3.14. Ichneumonoidea Host Range and Diversity

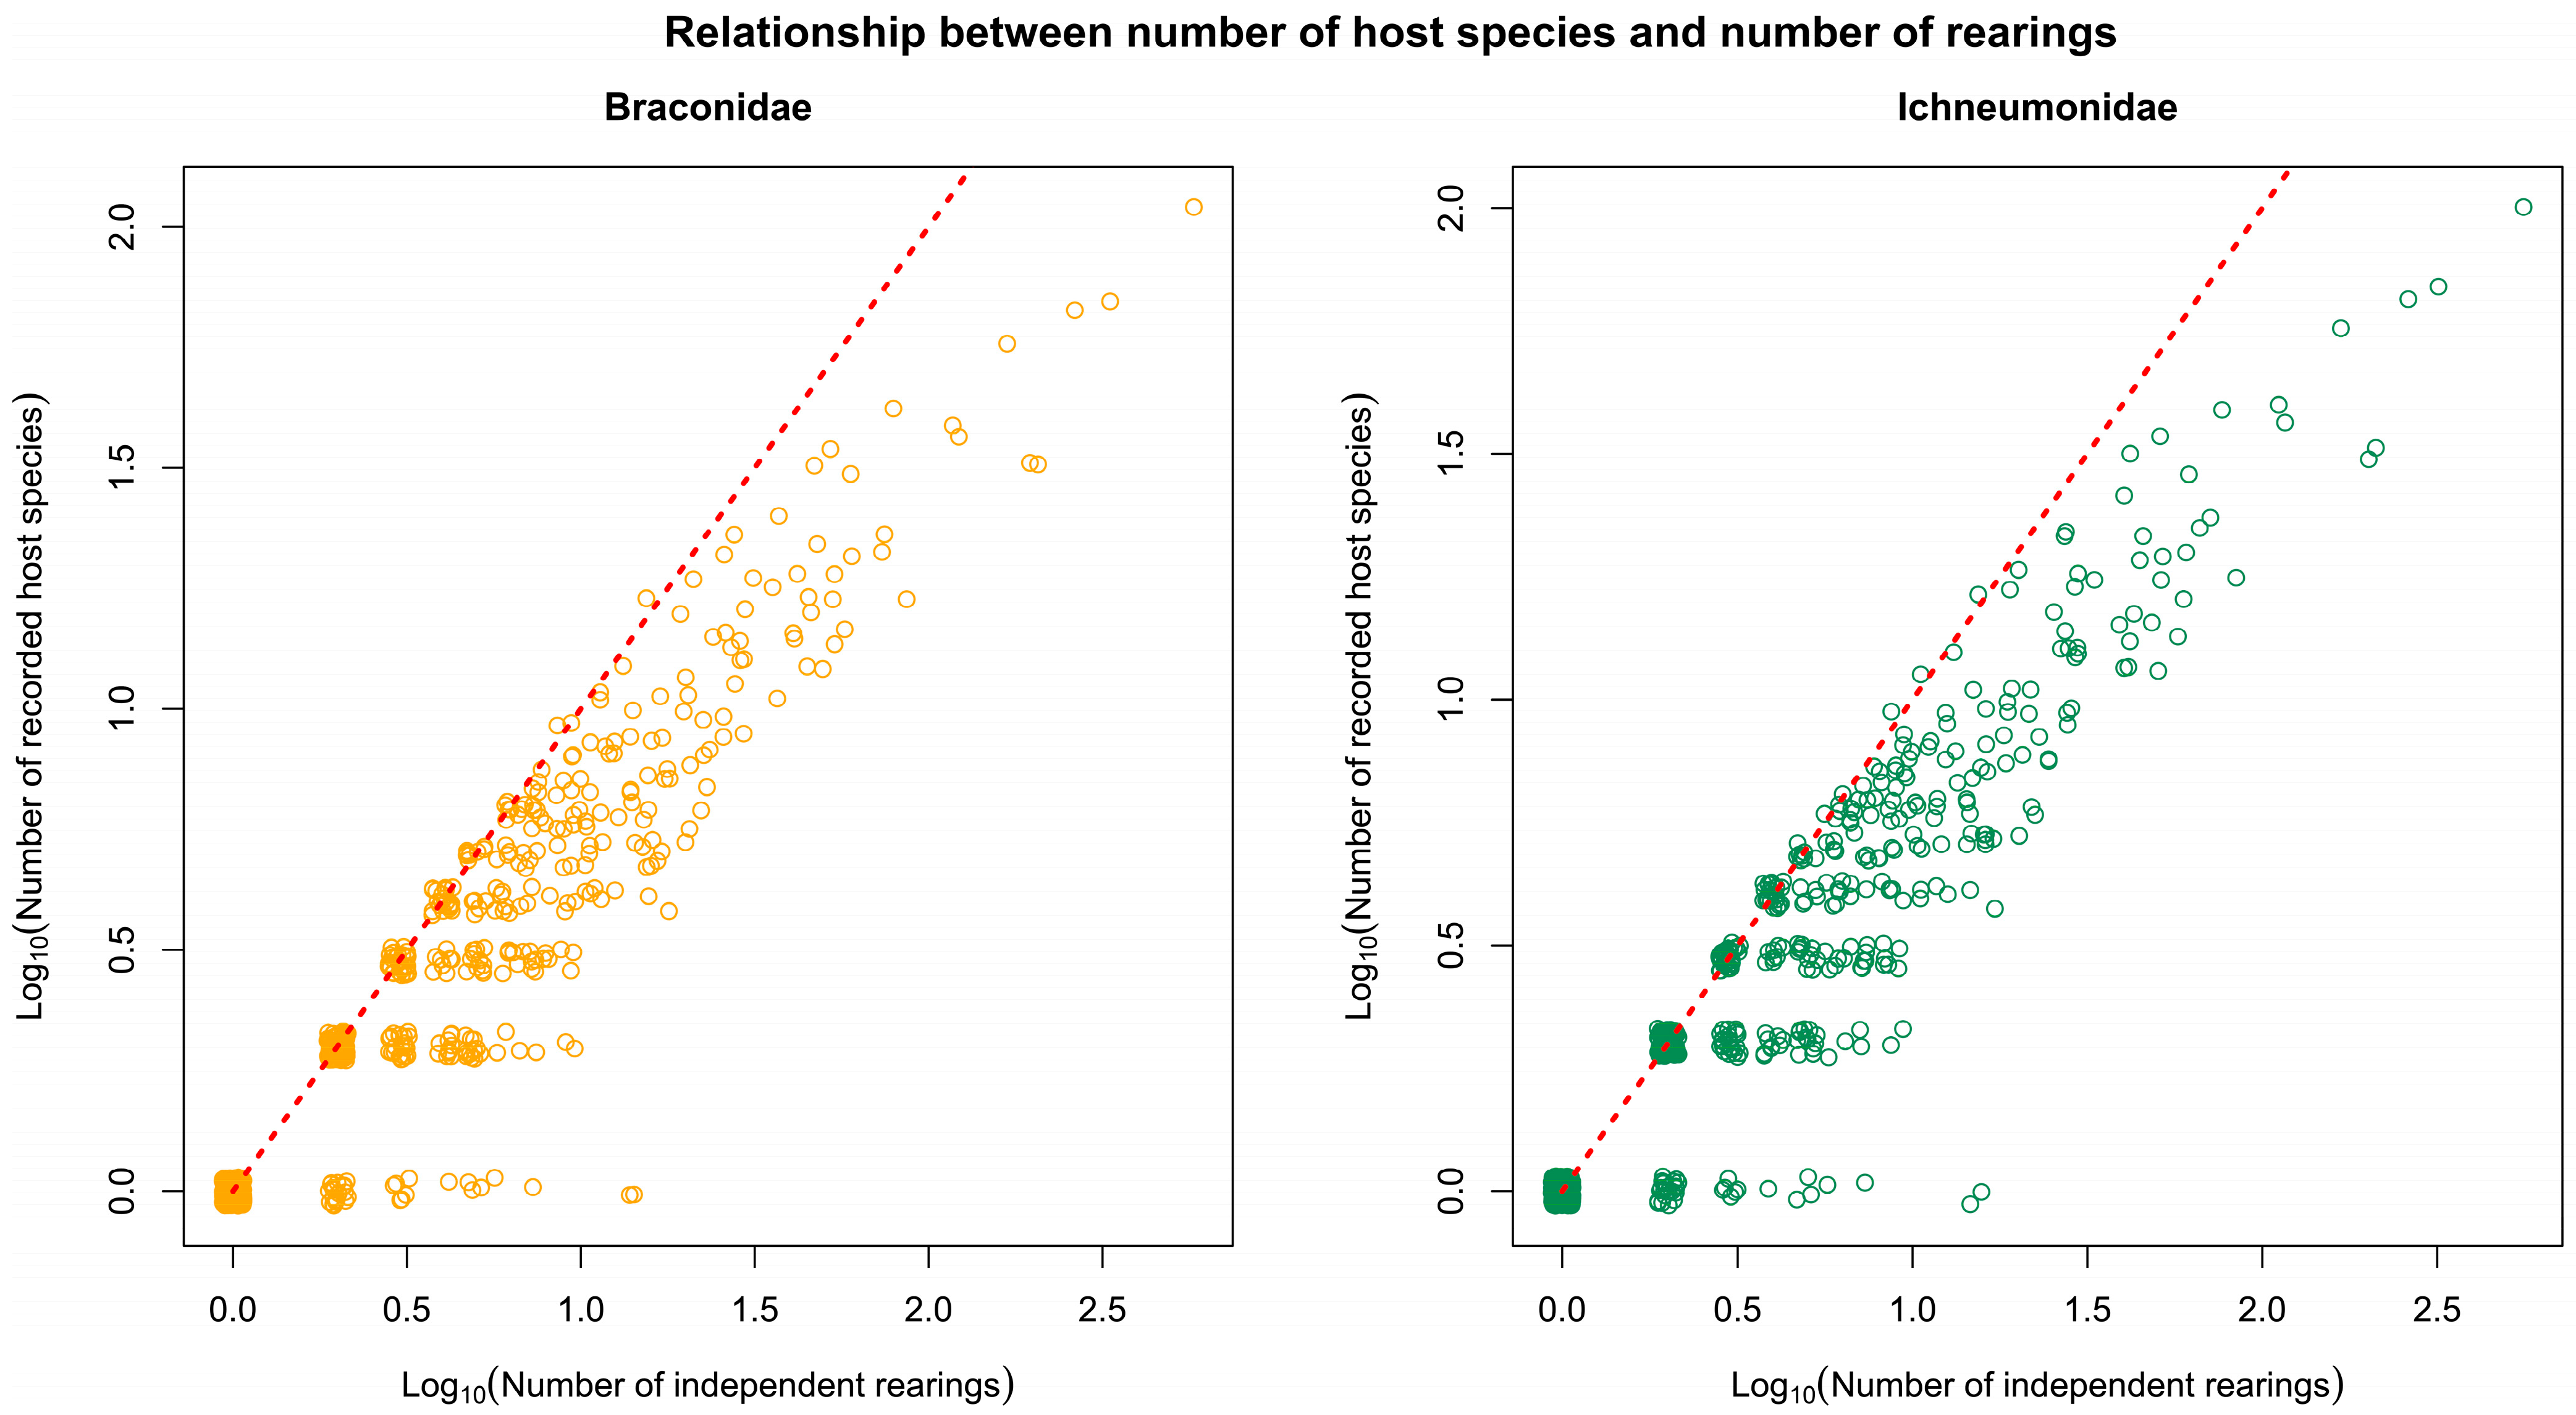
Figure 13 shows the number of host species for each tachinid species versus the number of independent rearings, and note that for many species, the numbers are very similar. We therefore carried out similar analyses for the Braconidae and Ichneumonidae (Figure 20). Comparing these with the Tachinidae (Figure 14) the overall pattern and ranges of values are similar, but for larger numbers of rearings, the points deviate more away from the 1-to-1 relationship indicated by the broken red line.
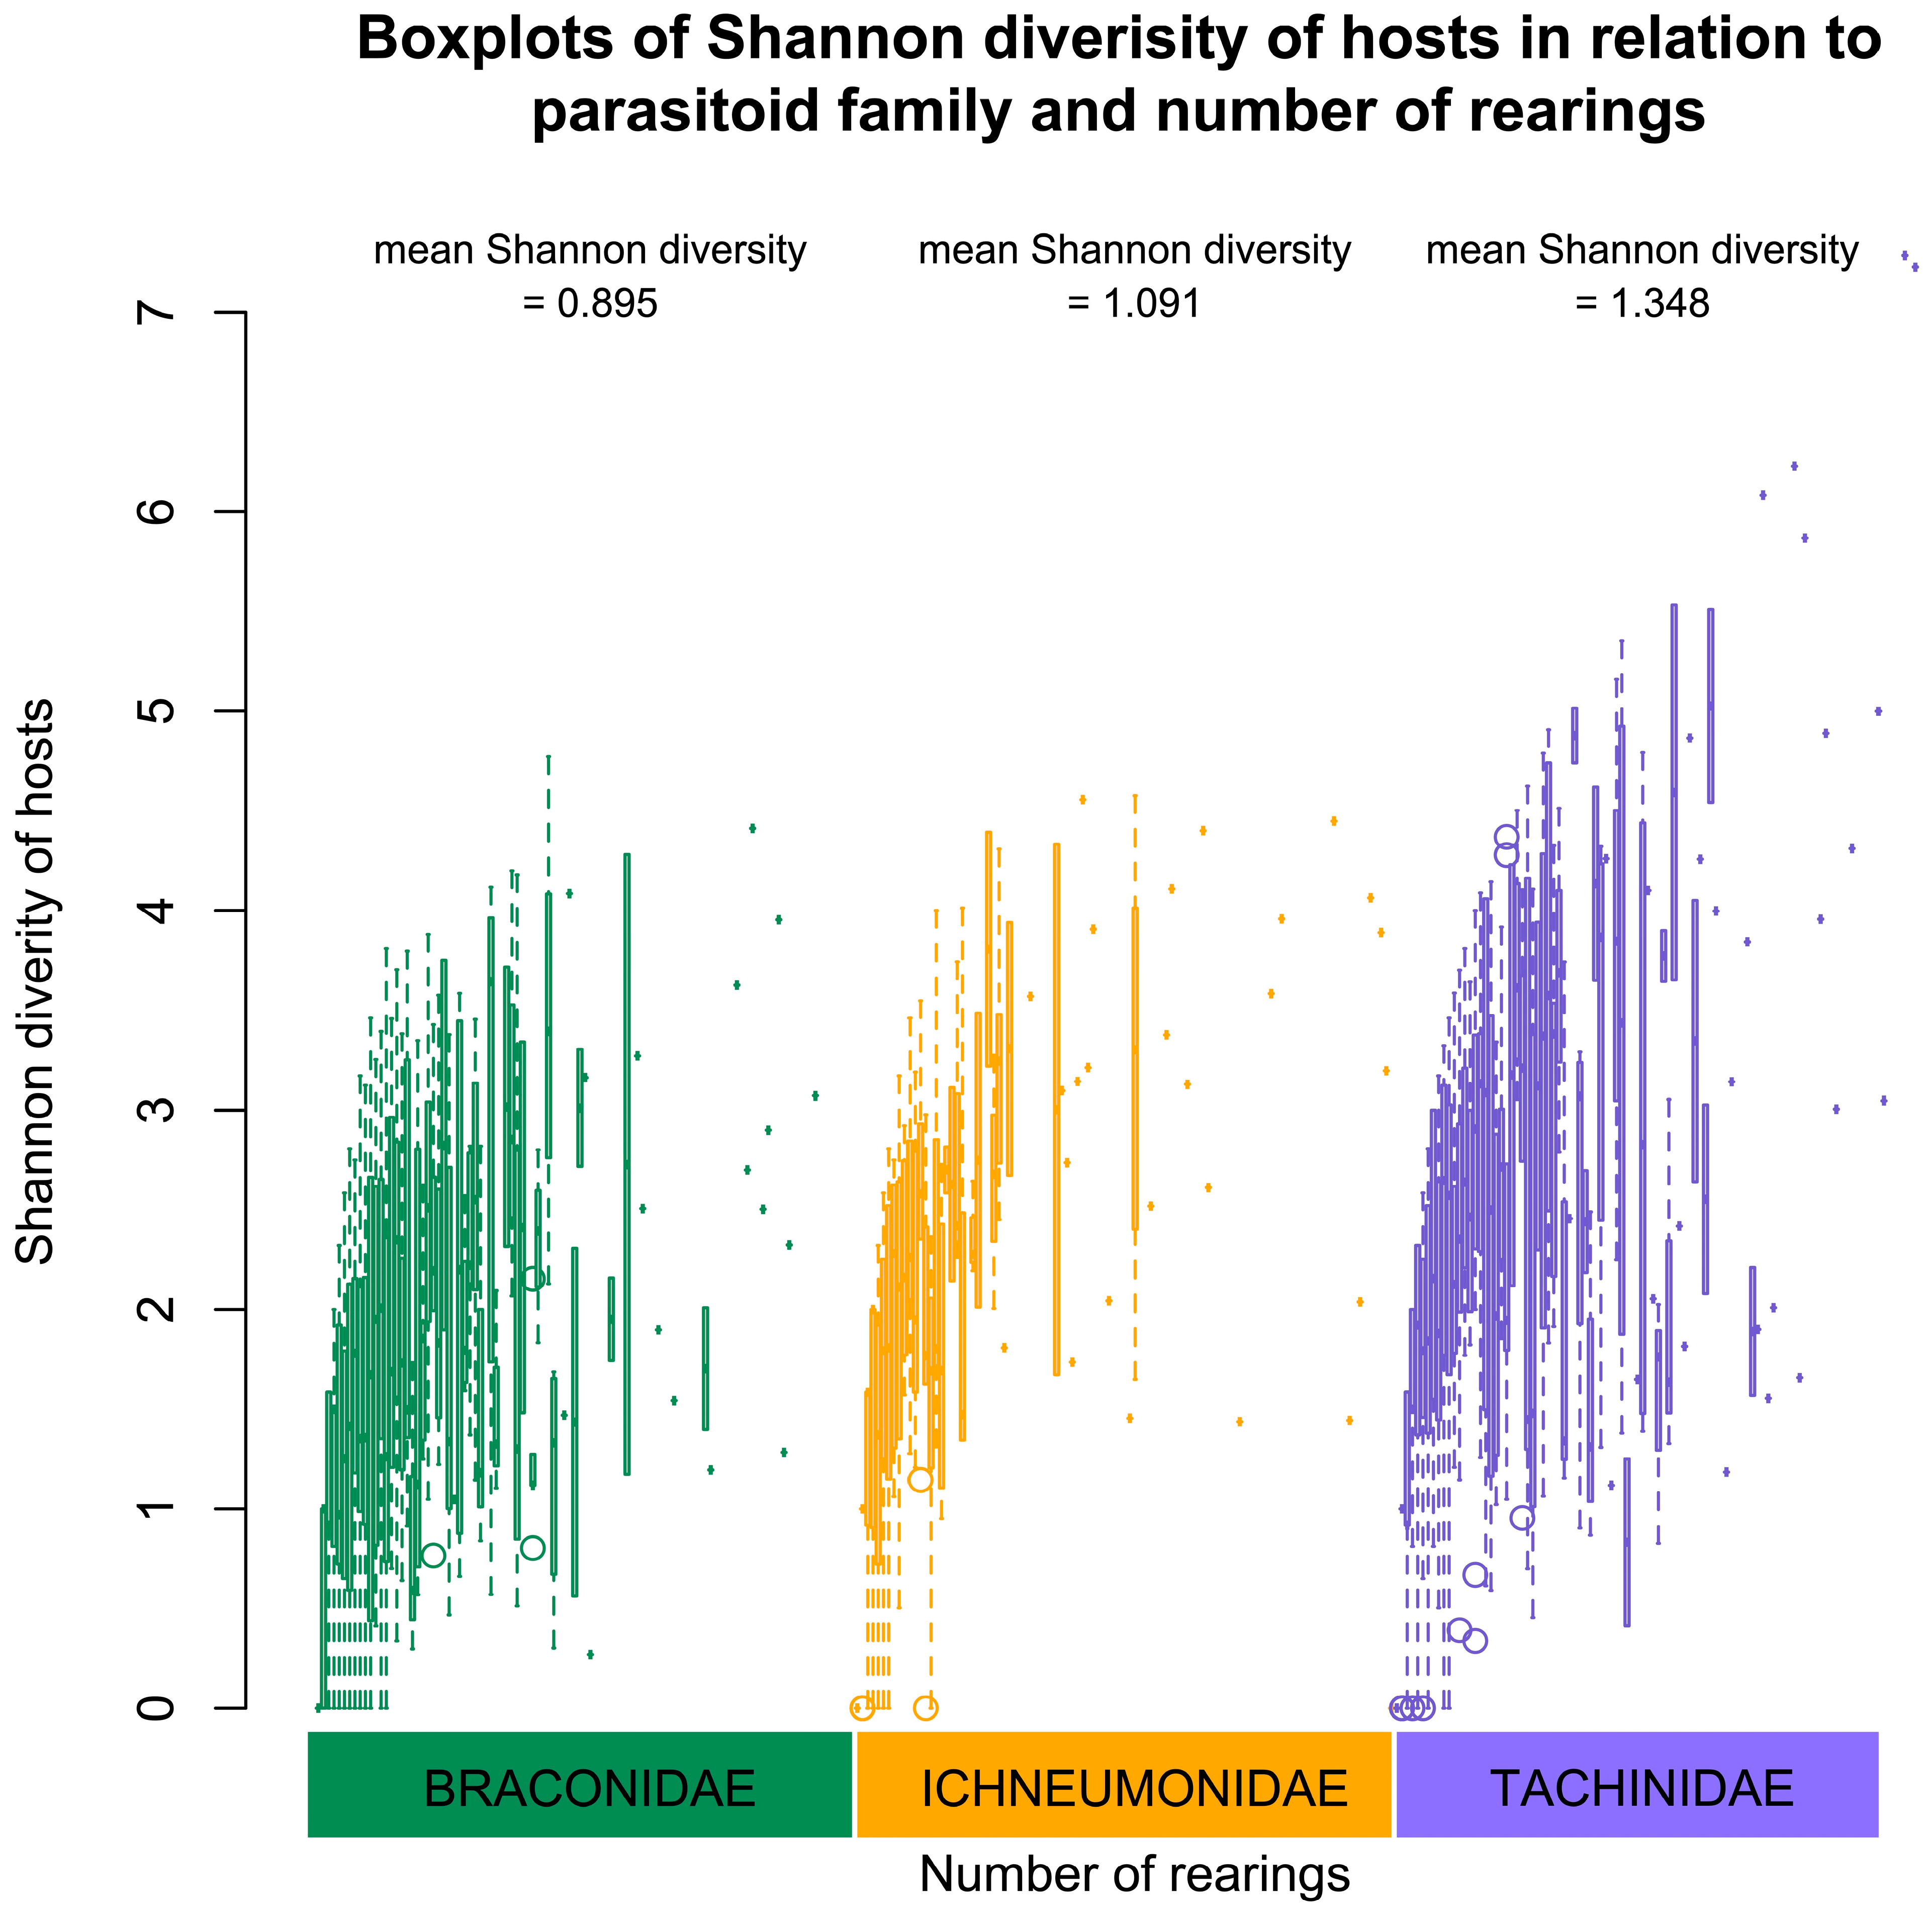
We then calculated the Shannon diversity of hosts for each braconid, ichneumonid and tachinid species and present the results as a two-factor boxplot (Figure 21). Analysis of variance with family as a factor revealed a highly significant effect (p ≪ 0.001), and all pairwise comparisons revealed highly significant differences. All terms of a GLM including the numbers of rearings as an interaction term, were highly significant. The mean Shannon host diversities of the Braconidae and Ichneumonidae were approximately the same, although the value for Ichneumonidae was significantly higher. Mean Shannon host diversity of the Tachinidae was 50% higher than that of the Braconidae and 24% higher than that of the Ichneumonidae, both highly significant differences. Examining Figure 16 suggests that for both braconids and ichneumonids, the upper bound of Shannon host diversity had reached a maximum (approximately 4.5), whereas there is no indication of the tachinid upper bound levelling (note the two most extreme right-hand data points that are level with the caption at the top of the graph). Both mean Shannon diversity (t = 8.84, d.f. = 1989, p ≪ 0.001) and its variance (F(1978,1158) = 1.63, p ≪ 0.001) were significantly higher for the tachinids than for the two ichneumonoid families’ parasitoids combined.
Parasitoid species with fairly constrained host ranges would be expected to be reared from those hosts often and only occasionally to be reared from atypical hosts, either as lucky mistakes or because their normal hosts were too rare. Therefore, for each family, we calculated the number of tachinid–caterpillar bitrophic interactions that were only detected once or twice (Table 7). The percentages of total host species in these categories for braconids and ichneumonids were very similar, but for Tachinidae, singleton host associations were relatively far more common. A comparison of the Tachinidae data with the combined Ichneumonoidea data showed that (χ2 = 748.4, d.f. = 2, p ≪ 0.001).

4. Discussion

DNA barcoding is correcting many assumptions about the polyphagy among Lepidoptera, their various parasitoid wasps [91,92,93,94] and their parasitoid flies [15,16]. This has consistently revealed that there are fewer generalist species, both in terms of Lepidoptera larval food plants and the host species of parasitoids. While cryptic species are being discovered via barcoding in all parts of the world, the problem with dark taxa in diverse tropical ecosystems is far greater than in the extra-tropics.
Over the past 45 years, more than three-quarters of a million exophagous, leaf-eating Lepidoptera caterpillars have been reared in ACG, a large mosaic wildland of mixed naturally restoring and original habitats. Whilst the majority of these yielded adult butterflies and moths, approximately 13% were parasitised by various Hymenoptera and Diptera (all being Tachinidae except for a few species of Systropus (Bombyliidae) that are specialist parasitoids of species various species of Limacodidae).
As an illustration of the importance that barcoding has been to the study of ACG Tachinidae, we present the case of the goniine genus Belvosia (Exoristinae) (Figure 22). The bipartite network of parasitoids and their host species of caterpillar had a high network-wide estimate of specialisation when all data were included (H2’ = 0.83) and this increased to 0.934 when singleton and doubleton rearing events were excluded. Thus, Belvosia are more specialised tachinids than they were once considered to be. Picked out in red in Figure 22 (lower right), viz, B. hazelcambroneroae, B. calixtomoragai and B. angelhernandezi, are three species that, prior to DNA barcoding, were considered to constitute a single generalist species (in this case, “Belvosia Woodley03”, [15,22]).
Studying tropical caterpillar food webs faces considerable difficulties. This is not only due to the greater species-richness of most groups in the tropics, but also to host specialisation [95]. Mean caterpillar diet breadth decreases markedly towards the equator [96] and this has been attributed to higher overall plant defence ability both as regards type and intensity, perhaps especially the production of toxins [97,98,99] although this widely quoted assumption has been challenged, for example, by Moles [100].
The numerous species of Lepidoptera that characterise the forests of ACG are declining [66]. It is thus not surprising that the specialised parasitoid taxa which feed on the larval forms of these species are also declining. In each of the two most frequently reared subfamilies here, there is an apparent decline in their serendipitous collections following the stabilisation of the highly skilled collection force of parataxonomists working in these forests. Moreover, the proportion of any taxonomic group of Lepidoptera infected with these parasitoids has also declined over the same decades [66]. With a generally high degree of host-specialisation evident in ACG tachinids, it is not surprising that the parasitoids would track their hosts in decline. Unfortunately, the documentation of decline here does not provide a road map for recovery. The decline in the hosts and their parasitoids is likely linked to a changing temperature and precipitation regime that is larger than the ACG’s capacity to buffer. Those species most likely to survive will be those that can move well enough to track changing conditions or those whose prey list is sufficiently generalised to allow host switching when their preferred host is gone.

4.1. Completeness of the ACG Dataset

Species accumulation curves of tachinids, their host caterpillars and the food plants of the latter show little tendency towards reaching a plateau. Contrary to this, the non-parametric Chao1 predictions based on independent rearings suggest that the study has already found a large proportion of the species (Table 2). We find this a puzzling difference and suspect that in some way, even with independent rearings (different combinations of tachinid species, host species, food plant species and collection date) the data do not conform well to the Chao1 population structure requirements.
Even more startling is the virtually linear accumulation of interactions over time (Figure 10). This is true for tachinid–caterpillar interactions, tachinid–food plant associations and tritrophic interactions. Figure 14 shows that many species that have been reared multiple times can be reared from many host species. Indeed, for many of the tachinids the number of recorded host species is essentially equal to the number of rearings. The positive relationship between the number of hosts and number of rearings is in line with findings from other smaller studies of tachinids [39,41,101] and other parasitoid systems in the tropics [102].
Chao1 estimates of the total numbers of tachinid species, their host caterpillars and the plants that they feed on (Table 2) all suggest that rearing to date has included representatives of between 70 and 90% of the species that the capture protocol might eventually achieve. However, consideration of the species accumulation curves for all three groups (Figure 5) makes this seem highly improbable since there is no sign of the diversity of any of the groups plateauing soon. We suspect that something about the manner of data collection might be in violation of the assumptions of the Chao1 estimator. One possibility might be that the spatial distributions of each group are not random and that the parataxonomists would therefore be more likely to encounter doubletons/reduced probability of finding singletons in their “patch”.

4.2. Are the Hosts of Generalists Also Generalists at ACG?

Based on their study of a tachinid caterpillar community in a primarily mesquite–oak savanna habitat in Arizona, USA, Stireman and Singer [41] noted that “Relatively specialized tachinids tended to be associated with monophagous or narrowly oligophagous hosts…”. We therefore tested whether this was the case with regard to the ACG dataset with two separate measures of host food plant range: first, considering the range as indicated only by the what those caterpillars parasitised by tachinids had been reared from, and second, by considering all rearings from the ACG irrespective of whether a fly parasitoid of any kind had been reared from them or not. These analyses yielded different conclusions, both of which differed from Stireman and Singer’s observation. Second, we found a weak but significant and negative relationship (Table 6) when considering only the food plants from tachinid-parasitised caterpillars and no effect when all food plant rearings of the species are included. Perhaps the easiest way to explain the second finding is that the ACG tachinid food web is just too incomplete to provide a signal. The negative relationship found in the first test is harder to explain but perhaps suggests that the generalist tachinids are generalist in a rather non-random way. By that we mean that they are capable of successfully parasitising many species of host, as evidenced by the large proportion of singleton host rearings (Table 7), but are constrained by their ability to locate them, perhaps by relying on plant semiochemicals.
Using an ant species as a predator, Dyer [103] first suggested that generalist caterpillars were usually less defended against predators than are specialists. Farkas et al. [104] found that parasitoid attack on generalist caterpillars in Connecticut, USA was probably mostly dependent on plant-derive parasitoid attractants (semiochemicals); see [105,106,107,108]. Similarly, Slinn et al. [109] found that parasitism levels of herbivore species in La Selva, Costa Rica, were strongly influenced by plant chemicals as well as by the host insects’ immune defence mechanisms. The attraction of plant semiochemicals can be quite specific, and tachinid parasitoids of caterpillars are attracted to the semiochemicals produced by caterpillar-damaged plants and not ones associated with other types of damage [110,111,112,113,114]. This could provide a route towards an explanation; i.e., the tachinids are locating hosts randomly with respect to host caterpillar species but are constrained in which hosts they locate by the range of food plants that provide appropriate host location signals.

4.3. Oviposition Strategies

Members of the tachinid tribe Goniini (Exoristinae) lay microtype eggs [36,115,116] and many species are believed to scatter them broadly on vegetation. However, this is not the case for members of the genus Belvosia [24]. In these species, the fly may locate a host caterpillar by being attracted to the frass of the species that is the usual host that lies around the host food caterpillar and plant (“faecal shadow”) through direct contact with it [53] or attraction to frass volatiles. After seeing the caterpillar, it then glues a single egg on the leaf, and also on other adjacent leaves, to form a dilute cloud of egg-bearing foliage some 5–15 cm from the caterpillar so that there will be a good chance that some of them will be consumed by the intended host. Obviously, another caterpillar can come along later and eat one of the egg-bearing leaves too. Generally, this is why Belvosia species are very host-specific. Nevertheless, now and then, they are reared from other species of caterpillars, and occasionally such rearings could also be due to the parataxonomist provisioning a captured caterpillar with “egg-contaminated” foliage.
The likelihood of successful parasitisation associated with microtype eggs is expected to be low (though the number of eggs produced is large [10]) and the likelihood of host specialists successfully adopting this strategy appeared low. However, decades of rearing in ACG suggested that the majority of the resident species of Belvosia were host specialists, and the addition of DNA barcoding to the rearing programme further elucidated that the other apparent generalists were also, in fact, specialised on one, or several, closely related, species. Thus, while not as specialised as some host-Hymenoptera parasitoid networks, these Dipteran parasitoids are clearly more specialised than we once considered them to be. Specialisation is evident in Figure 22 by the broad and specific links that connect some of the most common species of parasitoid to their host taxon. Note that there is one provisional name, “Belvosia Woodley04” in Figure 22, and in that case, the majority of the specimens were collected before barcoding of the parasitoid was a standard part of the rearing programme. Based on the host records, we would expect that most of these are either B. diniamartinezae or B. duniagarciae—each of which preys predominantly on (or is biased towards) caterpillars of the sphingid Enyo ocypete.
Stireman and Singer [41] found in their study of a natural tachinid–caterpillar food web in Arizona that species with wide host ranges tended to parasitise caterpillar species that also had wide food plant ranges. However, when we analysed the host food plant range for the ACG data we found no such trend. A significant portion of the variance in host range in their study was explained by their taxonomic group, which in turn was strongly correlated with their reproductive strategy. Stireman et al. [36] found that tachinids that lay microtype eggs (all members of the tribe Goniini) generally have broader host ranges, as do members of other clades that also use indirect strategists. This trend is confirmed here for the ACG dataset, although perhaps surprisingly, the host ranges of neither indirect category (microtype and macrotype eggs) differed from species with direct oviposition onto/into a host. The number of rearings was still a significant factor, but so too was a negative interaction term with goniine oviposition strategy, possibly indicating that more abundant (commmonly reared) goniine tachinids (or the more fecund ones) tend to be slightly less generalist in this data set than other goniines. However, since parataxonomist effort was not standardised or quantified (other than months worked per year), we cannot use the ACG data to test whether more generalist parasitoids were locally less abundant than specialists as Sudta et al. [117] found for caterpillar-plant interactions in Ecuador.
The food web statistics calculated varied considerably through the ACG inventory (Table S1). Part of this reflects the sample size of each time window, and part the habitat succession and changing species composition. The overall connectance of 0.00127 (Table 4) is low compared to many other caterpillar–parasitoid food web studies, which usually yield values between 0.01 and 0.2 [118]. However, they are in line with a smaller survey of all caterpillar parasitoids in secondary forest in Thailand which involved barcoding of dissected caterpillars and the parasitoid larvae detected, which was 0.0067.

4.4. Comparison of Host Utilisation by Tachinidae, Braconidae and Ichneumonidae

The relative number of tachinid species reared from various common host families varied considerably and, as a percentage of parasitism, was negatively correlated with the number of braconid species. Tachinids were generally most dominant on larger-bodied hosts (e.g., Saturniidae, Sphingidae) whereas braconids were relatively more commonly associated with smaller host caterpillars, such as Gelechiidae, Crambidae, and Tortricidae (Figure 19). This seems most likely to reflect the generally smaller body size of many braconids, whose diversity in the ACG is dominated by subfamilies such as the Microgastrinae and Cheloninae, which are both less than 5 mm long as adults. Nevertheless, there are some very small tachinids such as members of the genus Siphona which are often only 2 mm long or so [43], and in ACG they were reared from members of 19 caterpillar families, ranging from large-bodied Saturniidae and Sphingidae to small-bodies Crambidae, Geometridae, Oecophoridae and Tortricidae.
All of the above goes to support Stireman et al.’s [36] conclusion based on their study of a tropical (Ecuadorian Andes) tachinid-caterpillar community that “We will probably never know the complete tachinid-caterpillar food web for our study area”, and they note that “Even Janzen and Hallwachs’ (2009) [65] unparalleled, 45+ year effort to document parasitoid-caterpillar associations in Guanacaste Costa Rica is undoubtedly incomplete.” As an explanation, they note the obvious that such tropical communities are complex with many very rare species but also that they are likely to change on various scales over time. This latter factor is certainly very relevant to ACG because large parts of it are undergoing natural (i.e., benign neglect) succession from former agricultural land to forest [86,90], but climate change is also affecting ACG with the elevational expansion and contraction of various habitats and especially a decline in the area occupied by cloud forest due to warming and drying [66,69,119].

4.5. Numbers and Diversity of Hosts by Tachinidae, Braconidae and Ichneumonidae

Our data reveal a marked contrast between the diversity of hosts of individual species of Tachinidae and those of the ichneumonoid parasitoids. Askew [44] remarked that “…the host ranges of individual species tend to be less restricted than amongst parasitic Hymenoptera…” and cites as an example Compsilura concinnata which even at that time— the early 1970s—had been recorded from well over 100 host species involving three insect orders.
Although the rate of increase in Shannon diversity of tachinids reared from a given host species declines with increasing number of independent rearings (Figure 12), it does not appear to show an indication of reaching a plateau, which is in contrast to the situation with the ichneumonoid parasitoids (Figure 17). This again indicates that with ever increasing numbers of rearings, more and more links will be found.
Larvae of many cyclorrhaphous Diptera are well known for their capacity to dwell in noxious, sometimes anoxic, substrates such as dung, rotting carcasses and decaying vegetable material [120,121,122,123]. Thus, despite being smooth, flexible and pliant, their larval cuticle must provide an effective barrier against potentially hazardous substances and microbes. We suspect that this has a great deal to do with the ability of tachinid larvae of many species to be so highly polyphagous. Most ichneumonoid parasitoids of caterpillars have far narrower host ranges because the host’s immune defence systems generally provide a high level of protection. This has led to the parasitoids evolving sophisticated strategies to overcome host immunity, mostly involving their venoms [124], but also, in three large groups, the evolutionary incorporation of viral genomes into that of the wasp and subsequent production of virus particles into the host at the time of oviposition [125,126,127,128]. These viral associations have evolved in multiple independent occasions among the parasitic Hymenoptera, indicating the benefit they afford to the wasps [46]. A few cases of obligate multiparasitism have even been reported in the Ichneumonoidea, in which a given host species only becomes suitable for parasitism if it has already been parasitised by a different species, leading to compromised immunity [129,130,131] but none as yet are known in the Tachinidae. However, Cusson et al. [132] report on a case in which the tachinid Actia interrupta, may have better survival chances if its host has previously been parasitised by the cremastine ichneumonid Tranosema rostrale, but the multiparasitism is not obligatory.
We suspect that a large part of the reason for these differences is that those tachinids that deposit their eggs on the host cuticle, and those whose larvae locate the host, avoid many of the challenges the host’s immune system poses to endoparasitic Hymenoptera larvae. Larvae of the latter necessarily respire through their cuticle, and probably one of the main ways in which encapsulation by the host is effective at killing them is by starving them of oxygen [133,134,135,136,137,138,139]. In contrast, the tachinid larva keeps its posterior (and only) pair of spiracles on the outside of the host. Even those species whose eggs are deposited into the host haemocoel at least in their final two (of three) instars divert the host’s immune response to their advantage by inducing the host to develop a respiratory funnel for the posterior end of the tachinid larva which bears its spiracles, allowing direct access to the air either through the host’s integument or a large trachea [44,136]. In addition, the anterior end, at least in the first two instars, is surrounded by a host-derived membranous sac, which isolates it from the host’s haemocytes. Thus, the developmental stages of tachinids in their hosts are not constrained by host immune defences, and from a physiological perspective, host range would be limited only by their ability to subvert and re-engineer the host’s encapsulation response.
In conclusion, we have demonstrated, based on the large ACG dataset: (1) that just a small area of the tropics is home to a great diversity of Tachinidae and their trophic interactions, which are probably never going to be fully known; (2) that tachinids are generally associated with larger-bodied hosts in comparison with the Braconidae; and (3) that the tachinids there generally have a far larger potential host range than do members of the biologically similar Ichneumonoidea.

Supplementary Materials

The following supporting information can be downloaded at: https://www.mdpi.com/article/10.3390/d17090658/s1, Table S1: Cleaned data analysed fields (when filled)—tachinid subfamily, tachinid genus, tachinid species, caterpillar family, caterpillar species, food plant family, food plant species, major food plant group and food plant order from the APG IV system, unique specimen voucher code, BOLD DNA BIN, Dan Janzen parasitoid voucher code, ecosystem, collection date, Julian date of collection (start date = 1.i.1984), and a series of text strings with concatenations of various earlier fields; Table S2: summary tachinid-caterpillar food web statistics for each ecosystem and each 5-year sampling window (1.i.90 to 31.xii.2020), separately.

Author Contributions

Conceptualisation, D.L.J.Q., D.H.J., W.H., B.A.B. and P.D.N.H.; investigation, D.H.J., A.J.F., D.M.W. and N.E.W.; methodology, D.L.J.Q., D.H.J., W.H. and S.N.; software, D.L.J.Q.; validation, D.L.J.Q., B.A.B., D.H.J., M.J.S., W.H., J.F.-T. and J.B.W.; formal analysis, D.L.J.Q.; resources, D.H.J., W.H., P.D.N.H. and B.A.B.; data curation, D.H.J., W.H., P.D.N.H., M.A.S., R.M. and S.N.; writing, original draft preparation, D.L.J.Q.; writing, review and editing, D.L.J.Q., B.A.B., D.H.J., W.H., P.D.N.H., M.J.S., J.F.-T., J.B.W. and M.A.S.; visualisation, D.L.J.Q., D.H.J. and W.H.; supervision, B.A.B., D.H.J. and W.H.; project administration, B.A.B.; funding acquisition, D.H.J., W.H., P.D.N.H., M.A.S. and B.A.B. All authors have read and agreed to the published version of the manuscript.

Funding

We gratefully acknowledge the unflagging support of the team of ACG parataxonomists who found, reared and prepared the specimens used in this study, and the team of biodiversity managers who protect and manage the ACG forests that are home to these wasps and their caterpillar hosts. The study has been supported by U.S. National Science Foundation grants BSR 9024770 and DEB 9306296, 9400829, 9705072, 0072730, 0515699, and grants from the Wege Foundation, International Conservation Fund of Canada, Jessie B. Cox Charitable Trust, Blue Moon Fund, Guanacaste Dry Forest Conservation Fund, Permian Global, individual donors, and University of Pennsylvania (D.H.J. & W.H.). Mention of trade names or commercial products in this publication is solely for the purpose of providing specific information and does not imply recommendation or endorsement. All specimens were collected, exported and DNA barcoded under Costa Rican government permits issued to BioAlfa [140] (R-054-2022-OT-CONAGEBIO; R-019-2019-CONAGEBIO; National Published Decree #41767), JICA-SAPI #0328497 (2014) and D.H.J. and W.H. (ACG-PI-036-2013; R-SINAC-ACG-PI-061-2021; Resolución Nº001-2004 SINAC; PI-028-2021). This research is funded by Thailand Science Research and Innovation Fund Chulalongkorn University (BCG_FF_68_178_2300_039), RSPG-Chula to B.A.B. D.L.J.Q. was supported by the Rachadaphisek Somphot Fund for postdoctoral fellowship, Graduate School, Chulalongkorn University. This study was also supported by the Government of Canada through its ongoing support to the Canadian National Collection in Ottawa, and by grants from Genome Canada and Ontario Genomics to P.D.N.H. in support of the Centre for Biodiversity Genomics at the University of Guelph, and to the Natural Sciences and Engineering Research Council of Canada. Sequence analysis was supported by a Transformation 2020 award to P.D.N.H. from the New Frontiers in Research Fund, while critical infrastructure at the CBG was acquired with grants from the Gordon and Betty Moore Foundation and the Canada Foundation for Innovation (CFI). A Major Science Infrastructure award from CFI, along with matching support from the Walder Foundation in Chicago, sustains the CBG’s capacity to provide informatics and sequencing support.

Data Availability Statement

The caterpillar rearing data are available at Dan Janzen and Winnie Hallwach’s University of Pennsylvania web page, http://janen.sas.upenn.edu (accessed 29 June 2024) [65] and also at https://doi.org/10.5683/SP3/TYDAMS. The public records for barcoded ACG tachinid files along with collection metadata, are available as a public dataset on BOLD (https://doi.org/10.5883/DS-ASTACH).

Acknowledgments

We express our gratitude to Mark R. Shaw (Edinburgh) for his valuable insightful discussions.

Conflicts of Interest

The authors declare no conflict of interest.

References

  1. Burington, Z.L.; Inclán-Luna, D.J.; Pollet, M.; Stireman, J.O., III. Latitudinal patterns in tachinid parasitoid diversity (Diptera: Tachinidae): A review of the evidence. Insect Conserv. Diver. 2020, 13, 419–431. [Google Scholar] [CrossRef]
  2. Janzen, D.H. Setting up tropical biodiversity for conservation through non-damaging use: Participation by parataxonomists. J. Appl. Ecol. 2004, 1, 181–187. [Google Scholar] [CrossRef]
  3. Janzen, D.H. Ecology of dry-forest wildland insects in the Area de Conservación Guanacaste. In Biodiversity Conservation in Costa Rica: Learning the Lessons in a Seasonal Dry Forest; Frankie, G.W., Mata, A., Vinson, S.B., Eds.; University of California Press: Berkeley, CA, USA, 2004; pp. 80–96. [Google Scholar]
  4. Janzen, D.H.; Hallwachs, W. Biodiversity conservation history and future in Costa Rica: The case of Área de Conservación Guanacaste (ACG). In Costa Rican Ecosystems; Kappelle, M., Ed.; The University of Chicago Press: Chicago, IL, USA; London, UK, 2016; pp. 290–314. [Google Scholar]
  5. Janzen, D.H.; Hallwachs, W. Área de Conservación Guanacaste, northwestern Costa Rica: Converting a tropical national park to conservation via biodevelopment. Biotropica 2020, 52, 1017–1029. [Google Scholar] [CrossRef]
  6. Quicke, D.L.J.; Janzen, D.H.; Hallwachs, W.; Sharkey, M.J.; Hebert, P.D.N.; Butcher, B.A. Forty-five years of caterpillar rearing in Area de Conservación Guanacaste (ACG) Northwestern Costa Rica: DNA barcodes, BINs, and a first description of plant–caterpillar–ichneumonoid interactions detected. Diversity 2024, 16, 683. [Google Scholar] [CrossRef]
  7. McDade, L.A.; Hartshorn, G.S. Introduction to the La Selva Biological Station. In La Selva: Ecology and Natural History of a Neotropical Rain Forest; McDade, L.A., Bawa, K.S., Hespenheide, H., S Hartshorn, G.S., Eds.; University of Chicago Press: Chicago, IL, USA, 1994; pp. 6–14. [Google Scholar]
  8. Gentry, G.L.; Dyer, L.A. On the conditional nature of Neotropical caterpillar defenses against their natural enemies. Ecology 2002, 83, 3108–3119. [Google Scholar] [CrossRef]
  9. Hespenheide, H.A. Introduction to the natural history and interaction diversity of neotropical plant-caterpillar-parasitoid systems. Ann. Entomol. Soc. Am. 2011, 104, 1029–1032. [Google Scholar] [CrossRef]
  10. O’Hara, J.E. Tachinid flies (Diptera: Tachinidae). In Encyclopedia of Entomology; Capinera, J.L., Ed.; Springer: Dordrecht, The Netherlands, 2008; pp. 3675–3686. [Google Scholar]
  11. O’Hara, J.E.; Henderson, S.J. World Genera of the Tachinidae (Diptera) and Their Regional Occurrence. Version 11.0. PDF Document, 90p. 2020. Available online: https://www.uoguelph.ca/nadsfly/Tach/WorldTachs/Genera/Worldgenera.htm (accessed on 12 August 2025).
  12. Pohjoismäki, J.L.O.; Kahanpää, J.; Mutanen, M. DNA barcodes for the Northern European tachinid flies (Diptera: Tachinidae). PLoS ONE 2016, 11, e0164933. [Google Scholar] [CrossRef]
  13. O’Hara, J.E. History of tachinid classification (Diptera, Tachinidae). ZooKeys 2013, 316, 1. [Google Scholar] [CrossRef] [PubMed]
  14. Stireman III, J.O.; Cerretti, P.; O’Hara, J.E.; Blaschke, J.D.; Moulton, J.K. Molecular phylogeny and evolution of world Tachinidae (Diptera). Mol. Phylog. Evol. 2019, 139, 106358. [Google Scholar] [CrossRef]
  15. Smith, M.A.; Woodley, N.E.; Janzen, D.; Hallwachs, W.; Hebert, P.D.N. DNA barcodes reveal cryptic host-specificity within the presumed polyphagous members of a genus of parasitoid flies (Diptera: Tachinidae). Proc. Natl Acad. Sci. USA 2006, 103, 3657–3662. [Google Scholar] [CrossRef]
  16. Smith, M.A.; Wood, D.M.; Janzen, D.H.; Hallwachs, W.; Hebert, P.D.N. DNA barcodes affirm that 16 species of apparently generalist tropical parasitoid flies (Diptera, Tachinidae) are not all generalists. Proc. Natl Acad. Sci. USA 2007, 104, 4967–4972. [Google Scholar] [CrossRef]
  17. Janzen, D.H.; Hallwachs, W. Joining inventory by parataxonomists with DNA barcoding of a large complex tropical conserved wildland in northwestern Costa Rica. PLoS ONE 2011, 6, e18123. [Google Scholar] [CrossRef] [PubMed]
  18. Fleming, A.J.; Wood, D.M.; Smith, M.A.; Hallwachs, W.; Janzen, D.H. Revision of the New World species of Houghia Coquillett (Diptera, Tachinidae) reared from caterpillars in Area de Conservación Guanacaste, Costa Rica. Zootaxa 2014, 3858, 1–90. [Google Scholar] [CrossRef]
  19. Fleming, A.J.; Wood, D.M.; Smith, M.A.; Dapkey, T.; Hallwachs, W.; Janzen, D.H. Five new species of Vibrissina Rondani, 1861 (Diptera: Tachinidae) from Area de Conservación Guanacaste in Northwestern Costa Rica. Biodiv. Data J. 2017, 5, e10967. [Google Scholar] [CrossRef] [PubMed]
  20. Fleming, A.J.; Wood, D.M.; Smith, M.A.; Hallwachs, W. and Janzen, D.H. A new species of Voria Robineau-Desvoidy (Diptera: Tachinidae) from Area de Conservación Guanacaste in Northwestern Costa Rica. Biodiv. Data J. 2017, 5, e20123. [Google Scholar]
  21. Fleming, A.J.; Wood, D.M.; Smith, M.A.; Hallwachs, W.; Janzen, D.H. Twenty-two new species in the genus Hyphantrophaga Townsend (Diptera: Tachinidae) from Area de Conservación Guanacaste, with a key to the species of Mesoamerica. Biodiv. Data J. 2019, 7, e29553. [Google Scholar] [CrossRef]
  22. Fleming, A.J.; Woodley, N.; Smith, M.A.; Hallwachs, W.; Janzen, D.H. Revision of Belvosia Robineau-Desvoidy (Diptera, Tachinidae) and 33 new species from Area de Conservación Guanacaste in northwestern Costa Rica with a key to known North and Mesoamerican species. Biodiver. Data J. 2023, 11, e103667. [Google Scholar]
  23. Hebert, P.D.N.; Penton, E.H.; Burns, J.M.; Janzen, D.H.; Hallwachs, W. Ten species in one: DNA barcoding reveals cryptic species in the Neotropical skipper butterfly Astraptes fulgerator. Proc. Natl Acad. Sci. USA 2004, 101, 14812–14817. [Google Scholar] [CrossRef]
  24. Burns, J.M.; Janzen, D.H. Pan-neotropical genus Venada (Hesperiidae: Pyrginae) is not monotypic: Four new species occur on one volcano in the Area de Conservación Guanacaste, Costa Rica. J. Lepid. Soc. 2005, 59, 19–34. [Google Scholar]
  25. Solis, M.A.; Davis, D.R.; Nishida, K. Biology and systematics of Albusambia elaphaglossumae, a new genus and species of Crambidae (Lepidoptera: Pyraloidea: Crambidae) mining the fronds of Elaphoglossum conspersum (Pteridophyta: Lomariopsidaceae) in Costa Rica. Int. J. Tropic. Biol. 2005, 53, 487–501. [Google Scholar]
  26. Burns, J.M.; Janzen, D.H.; Hallwachs, W. Of many similar species in the Neotropical genus Porphyrogenes (Lepidoptera: Hesperiidae), a new one, repeatedly reared in Costa Rica, is relatively distinct. Proc. Entomol. Soc. Wash. 2010, 112, 32–42. [Google Scholar] [CrossRef]
  27. Chacón, I.A.; Janzen, D.H.; Hallwachs, W.; Sullivan, J.B.; Hajibabaei, M. Cryptic species within cryptic moths: New species of Dunama Schaus (Notodontidae, Nystaleinae) in Costa Rica. In: Schmidt BC, Lafontaine JD (Eds) Contributions to the systematics of New World macro-moths IV. ZooKeys 2013, 264, 11–45. [Google Scholar] [CrossRef]
  28. Grishin, N.V.; Burns, J.M.; Janzen, D.H.; Hallwachs, W.; Hajibabaei, M. Oxynetra: Facies and DNA barcodes point to a new species from Costa Rica (Hesperiidae: Pyrginae: Pyrrhopygini). J. Lepid. Soc. 2013, 67, 1–14. [Google Scholar] [CrossRef]
  29. Solis, M.A.; Phillips-Rodríguez, E.; Hallwachs, W.; Dapkey, T.; Janzen, D.H. Asturodes Amsel (Lepidoptera: Crambidae: Spilomelinae): Three new species from the Western Hemisphere and food plant records from Area de Conservación Guanacaste, Costa Rica. Proc. Entomol. Soc. Wash. 2020, 122, 147–171. [Google Scholar] [CrossRef]
  30. Phillips-Rodríguez, E.; Brown, J.W.; Hallwachs, W.; Janzen, D.H. Chlamydastis Meyrick of Costa Rica: Barcodes, biology, and descriptions of 36 new species (Lepidoptera: Depressariidae). Insecta Mundi 2021, 868, 1–96. [Google Scholar]
  31. Janzen, D.H. Lumpy integration of tropical wild biodiversity with its society. In A New Century of Biology; Kress, W.J., Barrett, G.W., Eds.; Smithsonian Institution Press: Washington, DC, USA, 2001; pp. 133–148. [Google Scholar]
  32. Janzen, D.H.; Hallwachs, W. DNA barcoding the Lepidoptera inventory of a large complex tropical conserved wildland, Area de Conservacion Guanacaste, northwestern Costa Rica. Genome 2016, 59, 641–660. [Google Scholar] [CrossRef]
  33. Crosskey, R.W. The immature stages and affinities of the tachinid fly Glaurocara flava, a parasite of the African bush-cricket Homorocoryphus nitidulus Vicinus. In Proceedings of the Zoological Society of London; Blackwell Publishing Ltd.: Oxford, UK, 1965; Volume 144, pp. 203–218. [Google Scholar]
  34. Bratti, A.; Gardenghi, G.; Miglioli, G. Behavior and growth rate of Archytas marmoratus (Town.) (Diptera: Tachinidae) planidia in larvae of Galleria mellonella L. (Lepidoptera Galleriidae). Boll. Ist. Entomol. Univ. Bologna 1993, 47, 141–149. [Google Scholar]
  35. Dindo, M.L.; Nakamura, S. Oviposition strategies of tachinid parasitoids: Two Exorista species as case studies. Int. J. Insect Sci. 2018, 10, 1179543318757491. [Google Scholar] [CrossRef] [PubMed]
  36. Stireman, J.O., III; Dyer, L.A.; Greeney, H.F. Specialised generalists? Food web structure of a tropical tachinid-caterpillar community. Insect Conserv. Divers. 2017, 10, 367–384. [Google Scholar] [CrossRef]
  37. Mellini, E. Sinossi di biologia dei ditteri larvevoridi (studi sui ditteri larvevoridi. L Contributo). Boll. Ist. Ent. ‘G. Grandi’ Univ. Bologna 1991, 45, 1–38. [Google Scholar]
  38. Wood, D.M. Tachinidae. In Manual of Nearctic Diptera Monograph No. 28; McAlpine, J.F., Peterson, B.V., Shewell, G.E., Teskey, H.J., Vockeroth, J.R., Eds.; Research–branch, Agriculture Canada: Ottawa, ON, Canada, 1987; pp. 1193–1269. [Google Scholar]
  39. Belshaw, R. Life history characteristics of Tachinidae (Diptera) and their effect on polyphagy. In Parasitoid Community Ecology; Hawkins, B.A., Sheehan, W., Eds.; Oxford University Press: Oxford, UK, 1994; pp. 145–162. [Google Scholar]
  40. Stireman, J.O., III; Singer, M.S. Determinants of parasitoid-host associations: Insights from a natural tachinid-lepidopteran community. Ecology 2003, 84, 296–310. [Google Scholar] [CrossRef]
  41. Stireman, J.O., III; Singer, M.S. What determines host range in parasitoids? An analysis of a tachinid parasitoid community. Oecologia 2003, 135, 629–638. [Google Scholar] [CrossRef]
  42. Stireman, J.O., III; Dyer, L.A.; Janzen, D.H.; Singer, M.S.; Lill, J.T.; Marquis, R.J.; Ricklefs, R.E.; Gentry, G.L.; Hallwachs, W.; Coley, P.D.; et al. Climatic unpredictability and parasitism of caterpillars: Implications of global warming. Proc. Natl. Acad. Sci. USA 2005, 102, 17384–17387. [Google Scholar] [CrossRef]
  43. Stireman, J.O.; O’Hara, J.E.; Wood, D.M. Tachinidae: Evolution, behavior, and ecology. Annu. Rev. Entomol. 2006, 51, 525–555. [Google Scholar] [CrossRef]
  44. Askew, R.R. Parasitic Insects; Heinemann: London, UK, 1971; 316p. [Google Scholar]
  45. Gauthier, J.; Boulain, H.; van Vugt, J.J.F.A.; Baudry, L.; Persyn, E.; Aury, J.M.; Noel, B.; Bretaudeau, A.; Legeai, F.; Warris, S.; et al. Chromosomal scale assembly of parasitic wasp genome reveals symbiotic virus colonization. Commun. Biol. 2021, 4, 104. [Google Scholar] [CrossRef]
  46. Santos, B.F.; Klopfstein, S.; Whitfield, J.B.; Sharanowski, B.J. Many evolutionary roads led to virus domestication in ichneumonoid parasitoid wasps. Curr. Opin. Insect Sci. 2022, 50, 100861. [Google Scholar] [CrossRef] [PubMed]
  47. Serbielle, C.; Dupas, S.; Perdereau, E.; Héricourt, F.; Dupuy, C.; Huguet, E.; Drezen, J.M. Evolutionary mechanisms driving the evolution of a large polydnavirus gene family coding for protein tyrosine phosphatases. BMC Evol. Biol. 2012, 12, 253. [Google Scholar] [CrossRef] [PubMed]
  48. Coffman, K.; Kauwe, A.; Gillette, N.; Burke, G.; Geib, S. Host range of a parasitoid wasp is linked to host susceptibility to its mutualistic viral symbiont. Mol. Ecol. 2024, 33, e17485. [Google Scholar] [CrossRef] [PubMed]
  49. Moreau, S.J.; Marchal, L.; Boulain, H.; Musset, K.; Labas, V.; Tomas, D.; Gauthier, J.; Drezen, J.-M. Multi-omic approach to characterize the venom of the parasitic wasp Cotesia congregata (Hymenoptera: Braconidae). BMC Genom. 2025, 26, 431. [Google Scholar] [CrossRef]
  50. Stireman, J.O., III. Learning in the generalist tachinid parasitoid Exorista mella Walker (Diptera: Tachinidae). J. Insect Behav. 2002, 15, 689–706. [Google Scholar] [CrossRef]
  51. Yamawaki, Y.; Kainoh, Y. Visual recognition of the host in the parasitoid fly Exorista japonica. Zool. Sci. 2005, 22, 563–570. [Google Scholar] [CrossRef] [PubMed]
  52. Ichiki, R.T.; Kainoh, Y.; Yamawaki, Y.; Nakamura, S. The parasitoid fly Exorista japonica uses visual and olfactory cues to locate herbivore-infested plants. Entomol. Exp. Applic. 2011, 138, 175–183. [Google Scholar] [CrossRef]
  53. Nettles, W.C.; Burks, M.L. A substance from Heliothis virescens larvae stimulating larviposition by females of the tachinid Archytas marmoratus. J. Insect Physiol. 1975, 21, 965–978. [Google Scholar] [CrossRef]
  54. Loxdale, H.D.; Lushai, G.; Harvey, J.A. The evolutionary improbability of “generalism” in nature, with special reference to insects. Biol. J. Linn. Soc. 2011, 103, 1–18. [Google Scholar] [CrossRef]
  55. Sharkey, M.J.; Baker, A.; McCluskey, K.; Smith, A.; Naik, S.; Ratnasingham, S.; Manjunath, R.; Perez, K.; Sones, J.; D’souza, M.; et al. Minimalist revision of Mesochorus Gravenhorst, 1829 (Hymenoptera: Ichneumonidae: Mesochorinae) from Área de Conservación Guanacaste, Costa Rica, with 158 new species and host records for 129 species. Rev. Biol. Trop. 2023, 71, e53316. [Google Scholar] [CrossRef]
  56. Zuñiga, R.; Valerio, A.A.; Hanson, P.; Smith, M.A.; Hallwachs, W.; Janzen, D.H. Cryptic diversity of Leurus wasps (Hymenoptera: Ichneumonidae: Metopiinae), parasitoids of caterpillars in Area de Conservación Guanacaste, Costa Rica. Zootaxa 2024, 5529, 511–531. [Google Scholar] [CrossRef] [PubMed]
  57. Kärrnäs, E.; Hansson, C.; Wahlberg, N. Large-scale DNA barcoding reveals cryptic diversity in eulophid wasps (Hymenoptera, Chalcidoidea, Eulophidae). Arthrop. Syst. Phylog. 2025, 83, 415–425. [Google Scholar] [CrossRef]
  58. Armstrong, A.L.; Sones, J.E.; Lohrmann, V.; Hebert, P.D.N.; Janzen, D.H.; Hallwachs, W.; Blaschke, J.D. Six in one: Cryptic species and a new host record for Olixon Cameron (Rhopalosomatidae, Hymenoptera) revealed by DNA barcoding. J. Hym. Res. 2024, 97, 363–378. [Google Scholar] [CrossRef]
  59. Burns, J.M.; Janzen, D.H.; Hajibabaei, M.; Hallwachs, W.; Hebert, P.D.N. DNA barcodes and cryptic species of skipper butterflies in the genus Perichares in Area de Conservacion Guanacaste, Costa Rica. Proc. Natl. Acad. Sci. USA 2008, 105, 6350–6355. [Google Scholar] [CrossRef]
  60. Brown, J.W.; Janzen, D.H.; Hallwachs, W. A food plant specialist in Sparganothini: A new genus and species from Costa Rica (Lepidoptera, Tortricidae). ZooKeys 2013, 303, 53–63. [Google Scholar] [CrossRef]
  61. Heikkilä, M.; Metz, M.A.; Hallwachs, W.; Janzen, D.H. Three new species of Rectiostoma Becker, 1982 (Lepidoptera: Gelechioidea: Depressariidae) from Area De Conservación Guanacaste, Northwestern Costa Rica. Proc. Entomol. Soc. Wash 2017, 119, 47–62. [Google Scholar] [CrossRef]
  62. Janzen, D.H.; Burns, J.M.; Cong, Q.; Hallwachs, W.; Dapkey, T.; Manjunath, R.; Hajibabaei, M.; Hebert, P.D.; Grishin, N.V. Nuclear genomes distinguish cryptic species suggested by their DNA barcodes and ecology. Proc. Natl. Acad. Sci. USA 2017, 114, 8313–8318. [Google Scholar] [CrossRef] [PubMed]
  63. Metz, M.A.; Hallwachs, W.; Janzen, D.H. Four new gelechioid species to honor Costa Rica’s conservation of wild biodiversity (Lepidoptera). Zootaxa 2020, 4810, 45–64. [Google Scholar] [CrossRef] [PubMed]
  64. Lee, K.M.; Zeegers, T.; Mutanen, M.; Pohjoismäki, J. The thin red line between species–genomic differentiation of Gymnosoma Meigen, a taxonomically challenging genus of parasitoid flies (Diptera: Tachinidae). Syst. Ent. 2021, 46, 96–110. [Google Scholar] [CrossRef]
  65. Janzen, D.H.; Hallwachs, W. Caterpillar Rearing Voucher Databases for the Area de Conservación in Northwestern Costa Rica. Available online: http://janzen.sas.upenn.edu/caterpillars/database.htm (accessed on 28 June 2024).
  66. Janzen, D.H.; Hallwachs, W. To us insectometers, it is clear that insect decline in our Costa Rican tropics is real, so let’s be kind to the survivors. Proc. Natl. Acad. Sci. USA 2021, 118, e2002546117. [Google Scholar] [CrossRef]
  67. Salcido, D.M.; Forister, M.L.; Garcia Lopez, H.; Dyer, L.A. Loss of dominant caterpillar genera in a protected tropical forest. Sci. Rep. 2020, 10, 422. [Google Scholar] [CrossRef]
  68. Herrera, W. Climate of Costa Rica. In Costa Rican Ecosystems; Kappelle, M., Ed.; The University of Chicago Press: Chicago, IL, USA, 2016; pp. 19–29. [Google Scholar]
  69. Smith, M.A. Temperature, Precipitation and Soil Characteristics of Volcan Cacao—Area de Conservacion Guanacaste (ACG), Costa Rica. 2023. Available online: https://dataverse.org/best-practices/data-citation (accessed on 14 August 2025).
  70. Basset, Y.; Novotny, V.; Miller, S.E.; Pyle, R. Quantifying biodiversity: Experience with parataxonomists and digital photography in Papua New Guinea and Guyana. BioScience 2000, 50, 899–908. [Google Scholar] [CrossRef]
  71. Basset, Y.; Novotny, V.; Miller, S.E.; Weiblen, G.D.; Missa, O.; Stewart, A.J. Conservation and biological monitoring of tropical forests: The role of parataxonomists. J. Appl. Ecol. 2004, 41, 163–174. [Google Scholar] [CrossRef]
  72. Folmer, O.; Black, M.; Hoeh, W.; Lutz, R.; Vrijenhoek, R. DNA primers for amplification of mitochondrial cytochrome c oxidase subunit I from diverse metazoan invertebrates. Mol. Mar. Biol. Biotechnol. 1994, 3, 294–299. [Google Scholar]
  73. Ivanova, N.V.; Dewaard, J.R.; Hebert, P.D.N. An inexpensive, automation-friendly protocol for recovering high-quality DNA. Molec. Ecol. Notes 2006, 6, 998–1002. [Google Scholar] [CrossRef]
  74. Ratnasingham, S.; Hebert, P.D.N. A DNA-based registry for all animal species: The Barcode Index Number (BIN) system. PLoS ONE 2013, 8, e66213. [Google Scholar] [CrossRef]
  75. Smith, M.A.; Eveleigh, E.S.; McCann, K.S.; Merilo, M.T.; McCarthy, P.C.; Van Rooyen, K.I.; Romanuk, T.N. Barcoding a quantified food web: Crypsis, concepts, ecology and hypotheses. PLoS ONE 2011, 6, e14424. [Google Scholar] [CrossRef]
  76. Prieto, C.; Faynel, C.; Robbins, R.; Hausmann, A. Congruence between morphology-based species and Barcode Index Numbers (BINs) in Neotropical Eumaeini (Lycaenidae). PeerJ 2021, 9, e11843. [Google Scholar] [CrossRef] [PubMed]
  77. R Development Core Team: A Language and Environment for Statistical Computing, R Foundation for Statistical Computing, Vienna. 2016. Available online: https://cran.r-project.org (accessed on 30 July 2024).
  78. Dormann, C.F.; Fründ, J.; Blüthgen, N.; Gruber, B. Indices, graphs and null models: Analyzing bipartite ecological networks. Open Ecol. J. 2009, 2, 7–24. [Google Scholar] [CrossRef]
  79. Wright, K. _pals: Color Palettes, Colormaps, and Tools to Evaluate Them_. R Package Version 1.9. 2024. Available online: https://CRAN.R-project.org/package=pals (accessed on 4 September 2025).
  80. Ligges, U.; Mächler, M. Scatterplot3d—an R package for visualizing multivariate data. J. Statist. Softw. 2003, 8, 1–20. [Google Scholar] [CrossRef]
  81. Bersier, L.F.; Banasĕk-Richter, C.; Cattin, M.F. Quantitative descriptors of food-web matrices. Ecology 2002, 83, 2394–2407. [Google Scholar] [CrossRef]
  82. Lewis, O.T.; Memmott, J.; Lasalle, J.; Lyal, C.H.C.; Whitefoord, C.; Godfray, H.C.J. Structure of a diverse tropical forest insect–parasitoid community. J. Anim. Ecol. 2002, 71, 855–873. [Google Scholar] [CrossRef]
  83. Gilbert, A.J. Connectance indicates the robustness of food webs when subjected to species loss. Ecol. Indic. 2009, 9, 72–80. [Google Scholar] [CrossRef]
  84. Chao, A. Non-parametric estimation of the number of classes in a population. Scand. J. Stat. 1984, 11, 265–270. [Google Scholar]
  85. Oksanen, J.; Blanchet, F.G.; Friendly, M.; Kindt, R.; Legendre, P.; McGlinn, D.; Minchin, P.R.; O’Hara, R.B.; Simpson, G.L.; Solymos, P.; et al. Vegan: Community Ecology Package. R Package Version 2.4-7. 2020. Available online: http://cran.r-project.org/package=vegan (accessed on 15 August 2025).
  86. Quicke, D.L.J.; Brown, A.; Hajibabaei, M.; Manjunath, R.; Naik, S.; Ratnasingham, S.; Sones, J.; Jacques, B.S.; Smith, M.A.; Zamora, N.; et al. Caterpillar diet breadth in Area de Conservación Guanacaste (ACG), a large and diverse Neotropical wildland in northwestern Costa Rica: Toxins, silica, aluminium and sclerophylly. Front. Ecol. Evol. 2025, 13, 1647436. [Google Scholar]
  87. Shaw, M.R. Parasitoid host ranges. In Parasitoid Community Ecology; Hawkins, B.A., Sheehan, W., Eds.; Oxford University Press: Oxford, UK, 1994; pp. 111–144. [Google Scholar]
  88. Marohasy, J. The design and interpretation of host-specificity tests for weed biological control with particular reference to insect behaviour. Biocont. News Inform. 1998, 19, 13N–20N. [Google Scholar]
  89. Novotny, V.; Basset, Y.; Miller, S.E.; Drozd, P.; Cizek, L. Host specialisation of leaf chewing insects in a New Guinea rainforest. J. Anim. Ecol. 2002, 71, 400–412. [Google Scholar] [CrossRef]
  90. Janzen, D.H. An abandoned field is not a tree fall gap. Vida Silv. Neotrop. 1990, 2, 64–67. [Google Scholar]
  91. Smith, M.A.; Rodriguez, J.J.; Whitfield, J.B.; Deans, A.R.; Janzen, D.H.; Hallwachs, W.; Hebert, P.D. Extreme diversity of tropical parasitoid wasps exposed by iterative integration of natural history, DNA barcoding, morphology, and collections. Proc. Natl. Acad. Sci. USA 2008, 105, 12359–12364. [Google Scholar] [CrossRef] [PubMed]
  92. Kaartinen, R.; Stone, G.N.; Hearn, J.; Lohse, K.; Roslin, T. Revealing secret liaisons: DNA barcoding changes our understanding of food webs. Ecol. Ent. 2010, 35, 623–638. [Google Scholar] [CrossRef]
  93. Hrček, J.; Godfray, H.C.J. What do molecular methods bring to host–parasitoid food webs? Trends Parasitol. 2015, 31, 30–35. [Google Scholar] [CrossRef]
  94. Sheikh, S.I.; Ward, A.K.; Zhang, Y.M.; Davis, C.K.; Zhang, L.; Egan, S.P.; Forbes, A.A. Ormyrus labotus Walker (Hymenoptera: Ormyridae): Another generalist that should not be a generalist is not a generalist. Insect Syst. Diver. 2022, 6, 1–14. [Google Scholar]
  95. Dyer, L.A.; Wagner, D.L.; Greeney, H.F.; Smilanich, A.M.; Massad, T.J.; Robinson, M.L.; Fox, M.S.; Hazen, R.F.; Glassmire, A.E.; Pardikes, N.A.; et al. Novel insights into tri- trophic interaction diversity and chemical ecology using 16 years of volunteer-supported research. Am. Entomol. 2012, 58, 15–19. [Google Scholar] [CrossRef][Green Version]
  96. Dyer, L.A.; Singer, M.S.; Lill, J.T.; Stireman, J.O.; Gentry, G.L.; Marquis, R.J.; Ricklefs, R.E.; Greeney, H.F.; Wagner, D.L.; Morais, H.C.; et al. Host specificity of Lepidoptera in tropical and temperate forests. Nature 2007, 448, 696–699. [Google Scholar] [CrossRef]
  97. Levin, D.A.; York, B.M., Jr. The toxicity of plant alkaloids: An ecogeographic perspective. Bioch. Syst. Ecol. 1978, 6, 61–76. [Google Scholar] [CrossRef]
  98. Gauld, I.D.; Gaston, K.J.; Janzen, D.H. Plant allelochemicals, tritrophic interactions and the anomalous diversity of tropical parasitoids: The “nasty” host hypothesis. Oikos 1992, 65, 353–357. [Google Scholar] [CrossRef]
  99. Coley, P.D.; Barone, J.A. Herbivory and plant defenses in tropical forests. Ann. Rev. Ecol. Syst. 1996, 27, 305–335. [Google Scholar] [CrossRef]
  100. Moles, A.T.; Bonser, S.P.; Poore, A.G.; Wallis, I.R.; Foley, W.J. Assessing the evidence for latitudinal gradients in plant defence and herbivory. Funct. Ecol. 2011, 25, 380–388. [Google Scholar] [CrossRef]
  101. Eggleton, P.; Gaston, K.J. Tachinid host ranges: A reappraisal (Diptera: Tachinidae). Entomol. Gaz. 1992, 43, 139–143. [Google Scholar]
  102. Memmott, J.; Godfray, H.C.J.; Gauld, I.D. The structure of a tropical host parasitoid community. J. Anim. Ecol. 2024, 63, 521–540. [Google Scholar] [CrossRef]
  103. Dyer, L.A. Tasty generalists and nasty specialists? Antipredator mechanisms in tropical lepidopteran larvae. Ecology 1995, 76, 1483–1496. [Google Scholar] [CrossRef]
  104. Farkas, T.E.; Singer, M.S. Can caterpillar density or host-plant quality explain host-plant-related parasitism of a generalist forest caterpillar assemblage? Oecologia 2013, 173, 971–983. [Google Scholar] [CrossRef]
  105. Turlings, T.C.J.; Tumlinson, J.H.; Lewis, W.J. Exploitation of herbivore-induced plant odours by host seeking parasitic wasps. Science 1990, 250, 1251–1253. [Google Scholar] [CrossRef]
  106. Godfray, H.C.J. Parasitoids: Behavioral and Evolutionary Ecology; Princeton University Press: Princeton, NJ, USA, 1994; pp. 1–473. [Google Scholar]
  107. Degenhardt, J.; Gershenzon, J.; Baldwin, I.T.; Kessler, A. Attracting friends to feast on foes: Engineering terpene emission to make crop plants more attractive to herbivore enemies. Curr. Opin. Biotech. 2003, 14, 169–176. [Google Scholar] [CrossRef]
  108. De Moraes, C.M.; Lewis, W.J.; Pare, P.W.; Alborn, H.T.; Tumlinson, J.H. Herbivore-infested plants selectively attract parasitoids. Nature 1998, 393, 570–573. [Google Scholar] [CrossRef]
  109. Slinn, H.L.; Richards, L.A.; Dyer, L.A.; Hurtado, P.; Smilanich, A.M. Across multiple species, phytochemical diversity and herbivore diet breadth have cascading effects on herbivore immunity and parasitism in a tropical model system. Front. Plant Sci. 2018, 9, 656. [Google Scholar] [CrossRef] [PubMed]
  110. Feener, D.H.; Brown, B.V. Diptera as parasitoids. Annu. Rev. Ent. 1996, 42, 73–97. [Google Scholar] [CrossRef]
  111. Mondor, E.B.; Roland, J. Host locating behaviour of Leschenaultia exul and Patelloa pachypyga: Two tachinid parasitoids of the forest tent caterpillar, Malacosoma disstria. Entomol. Exp. Applic. 1997, 85, 161–168. [Google Scholar] [CrossRef]
  112. Stireman, J.O., III. Host location and selection cues in a generalist tachinid parasitoid. Entomol. Exp. Applic. 2002, 103, 23–34. [Google Scholar] [CrossRef]
  113. Ichiki, R.T.; Ho, G.T.; Wajnberg, E.; Kainoh, Y.; Tabata, J.; Nakamura, S. Different uses of plant semiochemicals in host location strategies of the two tachinid parasitoids. Naturwissenschaften 2012, 99, 687–694. [Google Scholar] [CrossRef]
  114. Nakamura, S.; Ichiki, R.T.; Kainoh, Y. Chemical ecology of tachinid parasitoids. In Chemical Ecology of Insect Parasitoids; Wajnberg, E., Colazza, S., Eds.; Wiley & Sons: Oxford, UK, 2013; pp. 145–167. [Google Scholar]
  115. Salkeld, E.H. Microtype eggs of some Tachinidae (Diptera). Canad. Entomol. 1980, 112, 51–83. [Google Scholar] [CrossRef]
  116. Marini, M.; Campadelli, G. Ootaxonomy of Goniini (Diptera Tachinidae) with microtype eggs. Ital. J. Zool. 1994, 61, 271–283. [Google Scholar] [CrossRef]
  117. Sudta, C.; Salcido, D.M.; Forister, M.L.; Walla, T.R.; Villamarín-Cortez, S.; Dyer, L.A. Jack-of-all-trades paradigm meets long-term data: Generalist herbivores are more widespread and locally less abundant. Ecol. Letts 2022, 25, 948–957. [Google Scholar] [CrossRef]
  118. Kerkig, P.; Quicke, D.L.J.; Butcher, B.A. Molecular food web of lepidopteran hosts and their parasitoids in a tropical secondary forest in Thailand. Trop. Nat. Hist. 2025, 25, 37–56. [Google Scholar]
  119. Warne, C.P.; Hallwachs, W.; Janzen, D.H.; Smith, M.A. Functional and genetic diversity changes through time in a cloud forest ant assemblage. Biotropica 2020, 52, 1084–1091. [Google Scholar] [CrossRef]
  120. Rivers, D.B.; Thompson, C.; Brogan, R. Physiological trade-offs of forming maggot masses by necrophagous flies on vertebrate carrion. Bull. Entomol. Res. 2011, 101, 599–611. [Google Scholar] [CrossRef]
  121. Rotheray, G.E.; Lyszkowski, R. Diverse mechanisms of feeding and movement in cyclorrhaphan larvae (Diptera). J. Nat. Hist. 2015, 49, 2139–2211. [Google Scholar] [CrossRef]
  122. Rotheray, G.E. Saprophagy, developing on decay. In Ecomorphology of Cyclorrhaphan Larvae (Diptera); Rotheray, G.E., Ed.; Springer International Publishing: Cham, Switzerland, 2019; pp. 141–173. [Google Scholar]
  123. Ferrar, P.A. Guide to the Breeding Habits and Immature Stages of Diptera Cyclorrhapha: Volume 1; Brill: Leiden, The Netherlands, 2004; 907p. [Google Scholar]
  124. Quicke, D.L.J.; Butcher, B.A. Review of venoms of non-polydnavirus carrying ichneumonoid wasps. Biology 2021, 10, 50. [Google Scholar] [CrossRef]
  125. Whitfield, J. Parasitoids, polydnaviruses and endosymbiosis. Parasitol. Today 1990, 6, 381–384. [Google Scholar] [CrossRef]
  126. Whitfield, J.B.; O’Connor, J.M. Molecular systematics of wasp and polydnavirus genomes and their coevolution. In Parasitoid Viruses: Symbionts and Pathogens; Beckage, N.E., Drezen, J.-M., Eds.; Elsevier: London, UK, 2012; pp. 89–97. [Google Scholar]
  127. Strand, M.R.; Burke, G.R. Polydnaviruses as symbionts and gene delivery systems. PLoS Path. 2012, 8, e1002757. [Google Scholar] [CrossRef][Green Version]
  128. Muller, H.; Chebbi, M.A.; Bouzar, C.; Périquet, G.; Fortuna, T.; Calatayud, P.-A.; Le Ru, B.; Obonyo, J.; Kaiser, L.; Drezen, J.-M. Genome-wide patterns of bracovirus chromosomal integration into multiple host tissues during parasitism. J. Virol. 2021, 95, 10–128. [Google Scholar] [CrossRef]
  129. Arthur, A.P.; Stainer, J.E.R.; Turnbull, A.L. An interaction between Orgilus obscurator (Nees) (Hymenoptera: Braconidae) and Temelucha interruptor (Grav.) (Hymenoptera: Ichneumonidae), parasites of the pine shoot moth, Rhyacionia buoliana (Schiff.) (Lepidoptera: Olethreutidae). Canad. Entomol. 1964, 96, 1030–1034. [Google Scholar] [CrossRef]
  130. Guzo, D.; Stoltz, D.B. Obligatory multiparasitism in the tussock moth, Orgyia leucostigma. Parasitol. 1985, 90, 1–10. [Google Scholar] [CrossRef]
  131. Quicke, D.L.J. The Braconid and Ichneumonid Parasitic Wasps: Biology, Systematics, Evolution and Ecology; Wiley Blackwell: Oxford, UK, 2015; pp. 1–688. [Google Scholar]
  132. Cusson, M.; Laforge, M.; Régnière, J.; Béliveau, C.; Trudel, D.; Thireau, J.-C.; Bellemare, G.; Keirstead, N.; Stolz, D. Multiparasitism of Choristoneura fumiferana by the ichneumonid Tranosema rostrale and the tachinid Actia interrupta: occurrence in the field and outcome of competition under laboratory conditions. Entomol. Exp. Appl. 2002, 102, 125–133. [Google Scholar] [CrossRef]
  133. Salt, G. Experimental studies in insect parasitism. XV. The means of resistance of a parasitoid larva. Proc. R. Soc. Lond. B 1970, 176, 105–114. [Google Scholar]
  134. Norton, W.N.; Vinson, S.B. Encapsulation of a parasitoid egg within its natural host: An ultrastructual investigation. J. Invert. Pathol. 1977, 30, 55–67. [Google Scholar] [CrossRef]
  135. Quicke, D.L.J. Parasitic Wasps; Chapman & Hall: London, UK, 1997; pp. 1–470. [Google Scholar]
  136. Salt, G. The defence reactions of insect metazoan parasites. Parasitol. 1963, 53, 527–642. [Google Scholar] [CrossRef]
  137. Michalková, V.; Valigurová, A.; Dindo, M.L.; Vaňhara, J. Larval morphology and anatomy of the parasitoid Exorista larvarum (Diptera: Tachinidae), with an emphasis on cephalopharyngeal skeleton and digestive tract. J. Parasitol. 2009, 95, 544–554. [Google Scholar] [CrossRef] [PubMed]
  138. Zhang, K.; Nakamura, S.; Furukawa, S. Cloak scavenges the reactive oxygen species around the larvae of Drino inconspicuoides (Diptera: Tachinidae). Insects 2023, 14, 602. [Google Scholar] [CrossRef]
  139. Xu, Q.; Lu, J.; Gu, X.; Chi, F.; Zhao, Y.; Li, F.; Jiang, X.; Li, B.; Wei, J. The parasitoid Exorista sorbillans exploits host silkworm encapsulation to build respiratory funnel for survival. Insect Biochem. Molec. Biol. 2025, 177, 104255. [Google Scholar] [CrossRef] [PubMed]
  140. Janzen, D.H.; Hallwachs, W. How a tropical country can DNA barcode itself. iBOL Barcode Bull. 2019, 9, 1–6. [Google Scholar] [CrossRef]
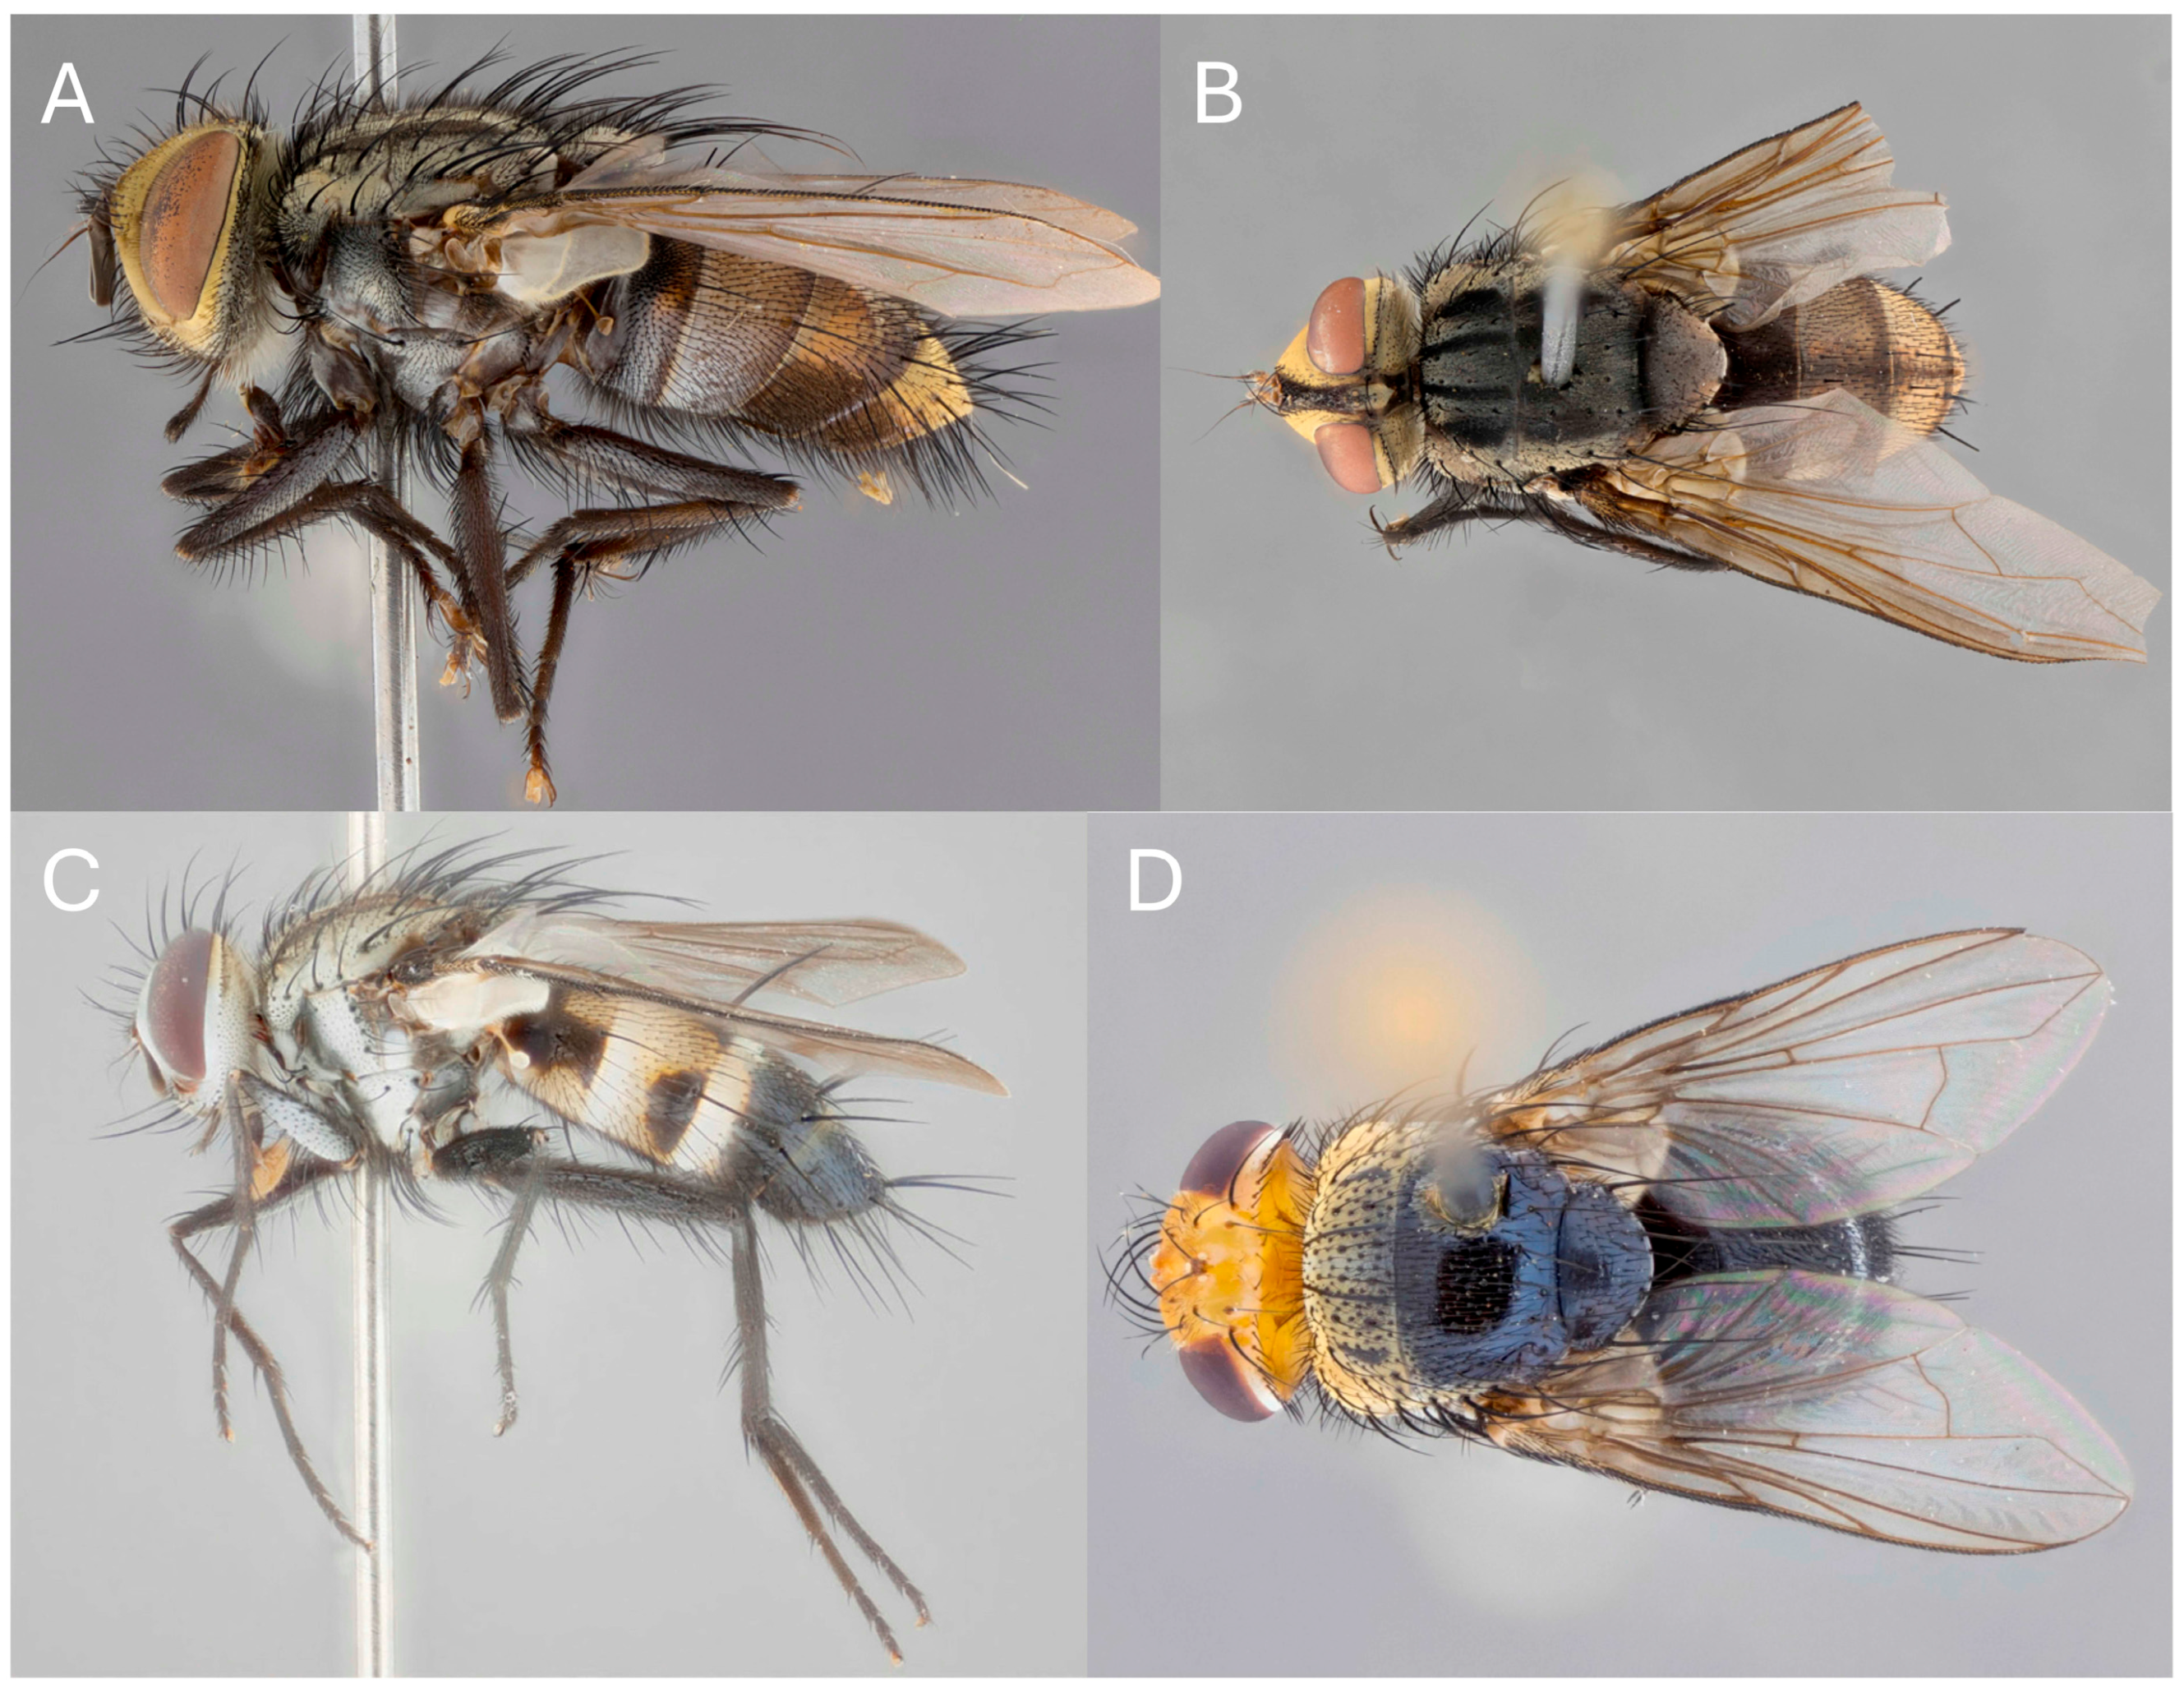
Figure 1. Four representative tachinid species from ACG. (A) Patelloa ‘xanthuraDHJ01’ voucher DHJPAR0034758; (B) Chorotegamyia sp.; (C) Spathidexia atripalpus; (D) Phosocephala alexanderi female voucher DHJPAR0048468.
Diversity 17 00658 g001
Figure 2. Map showing the main habitat zones (zonas de vida or Life Zones) in ACG. Red triangles indicate the locations of most of the rearing stations.
Diversity 17 00658 g002
Figure 3. Jaccard similarity separately for caterpillar species parasitised by tachinids (lower right triangle of three squares) and for their food plant species (upper left triangle of three squares), for each of three consecutive decades of collecting and rearing. Separate figures are presented for each of the three primary ecosystems in the ACG. The lower right block shows the overall similarities between decades of the tachinid–host (upper left) and host–food plant (lower right) bitrophic interactions. for the whole of ACG.
Diversity 17 00658 g003
Figure 4. Changes in the number of individual tachinids reared through time for the two principal tachinid subfamilies, Exoristinae (left) and Tachininae (right). The vertical broken line indicates 2005, at which time the number of parataxonomists working for the project stabilised and, other than that, there have been no changes to collecting or rearing protocols or effort. Note that numbers of independent tachinid rearings for each subfamily have been in decline since at least 2010.
Diversity 17 00658 g004
Figure 5. Species accumulation of parasitoids, hosts and food plants with rearing effort (number of independent rearings through time).
Diversity 17 00658 g005
Figure 6. Mosaic plot of numbers of tachinid species by subfamily and primary ecosystems. Rectangle areas are proportional to the observed frequency. Colour scheme: pale blue = cloud forest; dark green = rain forest; sienna = dry forest.
Diversity 17 00658 g006
Figure 7. Venn diagrams showing species overlap between ecosystems for tachinids, their host caterpillars and the latter’s food plants (only for the cases where a tachinid was reared) as well as overlaps of tritrophic interactions detected.
Diversity 17 00658 g007
Figure 8. Venn diagram comparing the diversity of tachinid flies that have been documented in ACG via rearing and those collected in ongoing Malaise trapping. The data only include barcoded specimens, and the counts refer to the number of BINS.
Diversity 17 00658 g008
Figure 9. NMDS plot of the community of species of Belvosia found in dry, rain, and cloud forest in ACG. (stress = 0.2587). Colours indicate the forest where each species of Belvosia were predominantly found, and the ellipsoids are 95% standard deviation.
Diversity 17 00658 g009
Figure 10. Unique bi- and tritrophic species interactions accumulation curves for all primary parasitoid Tachinidae.
Diversity 17 00658 g010
Figure 11. Species abundance histogram with the most commonly reared tachinids indicated.
Diversity 17 00658 g011
Figure 12. Mosaic plot showing the numbers of rearings of each tachinid subfamily from each host family. Only Lepidoptera families with 30 or more independent rearings of tachinids are shown.
Diversity 17 00658 g012
Figure 13. Mosaic plot showing relative numbers of associations of tachinid subfamilies with caterpillar families. Only Lepidoptera families with 30 or more unique host–parasitoid associations are shown. Colour scheme is as in Figure 10.
Diversity 17 00658 g013
Figure 14. Relationship between the number of host species for each tachinid species versus the number of independent rearings. Data are presented on a logarithmic scale with points jittered to improve clarity. The broken red line indicates those species with maximum host range would lie, i.e., each independent rearing was from a different host species.
Diversity 17 00658 g014
Figure 15. Relationship of Shannon diversity index of tachinid species richness and number of independent rearings of a host species.
Diversity 17 00658 g015
Figure 16. Three-dimensional perspective scatter plot of food plant range of host species (y-axis) in the whole ACG dataset in relation to number of rearings (x-axis) and number of host species (excluding unique host associations) (z-axis) for tachinid species that were reared on at least 20 independent occasions.
Diversity 17 00658 g016
Figure 17. Comparison of numbers of host species and host families for tachinids utilising three different oviposition strategies (direct, indirect with microtype eggs, and indirect with macrotype eggs). Only species reared on at least 20 independent occasions are included. Data points are jittered for clarity. The two outliers in the microtype egg category are Hyphantrophaga virilis and Patelloa ‘xanthuraDHJ01’.
Diversity 17 00658 g017
Figure 18. Comparison of numbers of parasitoid species reared from host caterpillar families by tachinid, braconid and ichneumonid parasitoids. Families are ranked in order of decreasing associated tachinid species.
Diversity 17 00658 g018
Figure 19. Relative percentage of total numbers of Tachinidae, Braconidae and Ichneumonidae species per caterpillar family ranked according to increasing relative percentage of Tachinidae species.
Diversity 17 00658 g019
Figure 20. Relationships between number of host species and number of independent rearings for ACG Braconidae and Ichneumonidae species. Data are presented on a logarithmic scale with points jittered for clarity. The broken red lines are where species with maximum host range would lie.
Diversity 17 00658 g020
Figure 21. Two-factor box and whisker plot showing Shannon diversity of hosts for increasing numbers of independent rearings separately for each of the parasitoid families, Braconidae, Ichneumonidae and Tachinidae. Note that the widths of the panels do not represent the total numbers of rearings which, respectively, are 10,425, 6082 and 11,770.
Diversity 17 00658 g021
Figure 22. Bipartite networks diagram for species of Belvosia (right or top, in blue) and their host species of Lepidoptera (left or bottom, in magenta) with all interactions included (left), with interactions recorded only once (singletons) excluded (upper right) and with interactions recorded only 1 or 2 times excluded (lower right). The size of the box associated with each parasitoid taxon represents the abundance of that taxon in the matrix, and the line width connecting the parasitoid to the host represents the frequency of each interaction on a continuum of specialist to generalist. Three species indicated in red (lower right) were once regarded as a single species based on traditional morphology alone.
Diversity 17 00658 g022
Table 1. Overview of the Tachinidae subfamily rearing results for complete morpho-species and/or molecular identification data.
SubfamilyNumber After Data CleaningNumber of Independent Rearings 1Number with BINNumber of BINsHost FamiliesHost SpeciesPlant FamiliesPlant Species
Dexiinae1195836535853031471298
Exoristinae16,61910,04369746874318581331078
Tachininae2264175713322453467196498
Overall 220,07812,636884110174321101381194
1 Each rearing from a separate combination of fly, host, plant and collection date to eliminate potential duplicates from the same food plant on the same day. This, however, distorts downwards the overall tachinid-generated caterpillar mortality caused by tropical fly faunas. 2 Column totals are shown in bold for emphasis of the overall numbers for the whole family.
Table 2. Actual and Chao1 estimates of total numbers of Tachinidae species and BINs (surrogates for species) likely to parasitise Lepidoptera caterpillars in ACG for all three habitats combined.
ObservedChao1 EstimateMultiplier (Completeness)
Tachinid species120614061.17 (86%)
Caterpillar species211030281.44 (70%)
Food plant species119413131.18 (91%)
Table 3. Overview of the Tachinidae subfamilies for bitrophic (with caterpillars and with food plants) and tritrophic associations 1.
SubfamilyFly–Caterpillar Bitrophic InteractionsFly–Food Plant Bitrophic InteractionsTritrophic Interactions
Dexiinae388434477
Exoristinae558060646695
Tachininae98610581151
Overall totals695475568323
1 Column totals are shown in bold for emphasis of the overall numbers of relationships for the whole family.
Table 4. Tachinid-caterpillar food web metrics for the whole study and for each ecosystem separately. Abbreviations: C = connectance; LD = link density; RC = rescaled connectance.
EcosystemCaterpillar SpeciesTachinid SpeciesNumber of LinksCRCLDGenerality
All2110120669631.27 × 10−32.74 × 10−32.105.77
Dry forest71860817501.99 × 10−34.01 × 10−31.322.88
Rain forest1654102151561.44 × 10−33.06 × 10−31.935.05
Cloud forest1932253934.51 × 10−39.05 × 10−30.941.75
Table 5. Numbers (and percentages) of tachinid species in three categories of host specificity by subfamily.
DexiinaeExoristinaeTachininae
most host-specific28 (25.7)313 (38.8)82 (27.2)
intermediate42 (38.5)288 (35.7)95 (31.6)
most generalist39 (35.7)205 (25.4)124 (41.2)
Table 6. Results of linear models to test whether the host range of tachinid species is correlated with the food plant range of their hosts, with number of rearings included as a second explanatory variable. Data used were only for tachinid species that had been reared at least 20 times.
DatasetUnique RearingsExplanatory VariableSlopeAdjusted R2t-Value (154 d.f.)p-Value
Only tachinid host caterpillarsIncludedNo. host species−0.0360.042−2.670.008
No. rearings0.0162.340.021
ExcludedNo. host species−0.4850.019−1.17N.S.
No. rearings0.0502.300.023
Data on caterpillar host range from all dataIncludedNo. host species0.145−0.010.69N.S.
No. rearings0.0680.65N.S.
ExcludedNo. host species0.145−0.010.69N.S.
No. rearings0.0670.65N.S.
Table 7. Numbers and percentages (in parentheses) of ACG tachinid and ichneumonoid parasitoid rearings with only one recorded host species (singletons), two recorded hosts (doubletons) or more. Only independent rearings are included.
Parasitoid FamilyParasitoid SpeciesHost SpeciesSingleton Host AssociationsDoubleton Host Associations>2 Host Species
Tachinidae120621105808 (83%)494 (7%)661 (10%)
Braconidae149220062194 (60%)530 (15%)879 (25%)
Ichneumonidae70512621228 (64%)267 (14%)433 (22%)
Disclaimer/Publisher’s Note: The statements, opinions and data contained in all publications are solely those of the individual author(s) and contributor(s) and not of MDPI and/or the editor(s). MDPI and/or the editor(s) disclaim responsibility for any injury to people or property resulting from any ideas, methods, instructions or products referred to in the content.