Article

Will They Still Be Together? Distribution Modeling of Six Co-Occurring Species of Swertia (Gentianaceae) in Asia

1
College of Tropical Agriculture and Forestry, Hainan University, Haikou 570228, China
2
Jiangxi Key Laboratory of Plant Resources and Biodiversity, Jingdezhen University, Jingdezhen 334000, China
3
Key Laboratory for Plant Diversity and Biogeography of East Asia, Kunming Institute of Botany, Chinese Academy of Sciences, Kunming 650201, China
*
Author to whom correspondence should be addressed.
Diversity 2025, 17(9), 657; https://doi.org/10.3390/d17090657
Submission received: 22 July 2025 / Revised: 11 September 2025 / Accepted: 14 September 2025 / Published: 19 September 2025
(This article belongs to the Section Biodiversity Conservation)

Abstract

Investigating the factors determining the co-existence of closely related species is key to understanding how biodiversity is structured and maintained. To this end, we seek to comprehend the geographical distribution of species, their range overlap, and the evolutionary and ecological mechanisms that promote co-existence in ecological communities. In the Anthropocene, climate change dramatically shapes ecosystems along with species distributions. Here, we focus on six co-occurring species of Swertia (Gentianaceae). For instance, all of them grow within an area of 2 km2 in the north of Kunming city, occupying different microhabitats. We employed the maximum entropy model (MaxEnt) and a geographic information system (ArcGIS) to predict how future climate change will impact their distribution. We also tested the relationship between ecological niche overlap and phylogenetic distance among these species. We found that these six species co-occur in the mountains of Yunnan, Sichuan, and Guizhou provinces. Precipitation in the warmest quarter, mean temperature of driest quarter, solar radiation, annual temperature range, and elevation influence their distribution. In the predicted future climate, four outcrossing species, S. bimaculata, S. kouitchensis, S. punicea, and S. cincta, will expand their distribution range. The other two self-pollinating species, S. macrosperma and S. nervosa, will experience range contractions. We found no significant correlation between ecological niches and the phylogenetic distances of these species. Under the future climate scenarios, the six species of Swertia plants will tend to grow in clusters, suggesting a higher likelihood of co-occurrence in the future, and creating a potentially high level of habitat and resource competition among them. These findings hold significant implications for the conservation of Swertia.

1. Introduction

The world is currently faced with the threat of global warming, as projections indicate a 1.5 °C increase in global temperatures by the end of the 21st century [1]. This trend in climate change has the potential to trigger a significant threat to biodiversity [2]. Plants’ responses to climate change are reflected in changes in their distribution range by migration and/or population extinction. The best scenario is that the distribution range of a plant may shift to the most suitable environments in the future [3]. Indeed, significant changes in plants’ geographical distribution patterns have occurred in past decades [4,5,6].
In wild communities, especially at biodiversity hotspots, we frequently find that some related species, i.e., species from the same genus (congeners) are co-existing in one place due to their historical migration and speciation. To fully understand the ecological and evolutionary mechanisms as to why these closely related species can co-exist in the same communities, we need to know their current species range distribution, distribution/ecological niche overlap, and biogeographic and evolutionary history. Most importantly, under the future climate change situation, we should predict if these species can still co-occur in their current and new habitats.
Using niche models to simulate the potential geographical distribution of species can provide a prediction for their future co-existence based on their current distribution range [7,8,9,10,11]. Species distribution modeling (SDM) is a method that predicts the potential distribution of species based on species’ current distribution points and environmental variables, considering both temporal and spatial dimensions. SDM has been widely used in both plants and animals [12,13,14,15]. The MaxEnt model, a maximum entropy model, is extensively used for this purpose. By applying machine learning methods to assess occurrence probabilities, the MaxEnt model provides accurate and high-performance predictions, yielding good results across different scales [16]. The MaxEnt model has been widely applied in predicting species distribution ranges, evaluating habitat suitability, protecting endangered species, zoning planting areas, controlling pests and diseases, and managing invasive species [17,18,19].
In general, phylogenetically related species often have similar environmental requirements for their survival and also share similar ecological traits, such as sharing pollinators. However, when similar species co-exist in communities, they may compete for limited resources, eventually filtering out weakly competitive species. In highly diverse habitats, environment heterogeneity may provide opportunities for related species occupying different microhabitats, facilitating their co-existence. In recent years, the investigation into the relationship between ecological niche and phylogeny has emerged as a hot topic in research [20,21].
Both evolutionary history and important ecological traits can influence a species’ distribution range. Species with different reproductive strategies, i.e., outcrossing and selfing, and specialized pollinators may limit the reproductive interference among species promoting their co-existence. Outcrossing species are highly dependent on their pollinators, when they disperse to new habitats, they may face a lack of pollinators, resulting in a failure of population set-up. As selfing species do not depend on pollinators, they may easily disperse and set up their population in new environments.
The genus Swertia L. belongs to the family Gentianaceae, it comprises about 150 species, mainly distributed in Asia and Africa with a few species in North America and Europe. Some species in this genus are well-known herbal medicines in China, Japan, India, and other Asian regions. They are used for traditional medicine for skincare and hair loss prevention, holding important economic value [22,23,24,25,26,27,28]. In recent years, due to climate change and increasing human disturbances, the habitats suitable for Swertia species have deteriorated rapidly, posing a serious threat to their survival, leading to a decline in wild resources [29]. There has been extensive research on the taxonomy and classification of Swertia [30,31], but studies on the ecological niche and distribution modeling of wild species are limited.
This study focuses on six representative and co-occurring species of Swertia, all of them grow within an area of 2 km2 in the north of Kunming city. A total of 23 climatic factors were selected as environmental variables. Leveraging species distribution data, the MaxEnt model and ArcGIS geographic information system spatial analysis techniques were employed to simulate and predict the potential distribution areas of these plant species under different scenarios. The study aims to investigate and address the following issues: (1) The potential distribution patterns of the six Swertia species under varying climatic scenarios. (2) The primary climatic factors influencing the distribution patterns of these six species. (3) The relationship between ecological niche changes and the phylogenetic distances of the six species under future climate scenarios.

2. Materials and Methods

2.1. Data Collection and Cleaning

Six species in the genus Swertia were selected as targets in this study (Table 1). Based on our field observation, all of them co-occur in the north of Kunming within a 2 km2 area [32]. Four species, S. bimaculata, S. cincta, S. kouitchensis, and S. punicea with protandrous flowers are outcrossing, and pollinators are required for seed production. Among them, S. bimaculata is mainly pollinated by flies, while the other three species are specialized to be pollinated by hornet wasps in the Vespidae family. While S. macrosperma and S. nervosa can self-pollinate with a delayed selfing mechanism, flies and solitary bees also visit flowers, which may result in seed production. Swertia macrosperma has the largest population, living at grass lands and the understories of forests; S. cincta has the second largest population, and its plants are frequently found at the edge of the forest; S. kouitchensis and S. punicea have sparsely located populations in the dry grasslands, with the first species flowering earlier than the second one; and S. bimaculata occurs under the forest in wet habitats [32]. All species flower from September to November. The geographic distribution data of these six co-distributed species of Swertia were collected from the Global Biodiversity Information Facility (GBIF) [33], the Chinese Virtual Herbarium (CVH), and field surveys. We obtained latitude and longitude coordinates of each record (population) of each species (Table S1). Coordinates that did not align with ecological distributions recorded in the Flora of China and our field surveys were removed.
The CSV-formatted latitude and longitude coordinates were imported into ArcGIS using the Species Distribution Modeling (SDM) tool to create distribution points. The SDM tool was then utilized to eliminate duplicate distribution points within a 10 km radius to reduce the effect of spatial autocorrelation and the consequent overfitting. This process resulted in a refined dataset of 977 valid species distribution points (Table 1). Administrative maps of China and the world were imported into ArcGIS to map these species’ distribution in various regions.
We selected and downloaded 23 environmental variables from the near-current climate (the averages for 1970–2000) and future climate (the averages for 2081–2100) from the WorldClim v2.1 database (https://www.worldclim.org/) at a spatial resolution of 2.5 arc-minutes (approximately 5 km2). The 23 environmental factors included 19 bioclimatic variables (Table S1), solar radiation, elevation, slope, and aspect, among which slope and aspect were derived from the elevation data. To provide a conservative and more extensive estimate of species distribution changes under future climate conditions, we utilized two Shared Socioeconomic Pathways (SSPs) for future climate scenarios: SSP245 (moderate climate change, the low to moderate CO2 emission scenario) and SSP585 (pessimistic climate change, the high CO2 emission scenario) from the CMIP6 (BCC-CSM2-MR) climate model [34]. The BCC-CSM2-MR (Beijing Climate Center Climate System Model) has been widely employed in species distribution modeling in East Asia and has shown good performance [35,36]. The climate data were processed using ArcGIS 10.8 software, and they were clipped and converted to ASCII format.

2.2. Ecological Niche Modeling

The MaxEnt (maximum entropy model), a statistical model based on the principle of maximum entropy, was used in this study. To avoid overfitting in the modeling process due to multicollinearity of climate variables, spatial principal component analysis was conducted on the 23 environmental variable layers in the study area, and Pearson correlation coefficients were calculated. The 23 environmental factors and species distribution data were imported into MaxEnt 3.4.1, and variables contributing more than 1.0% in the model prediction results were retained. Environmental factors with a correlation of |r| ≥ 0.80 were removed to eliminate collinearity, resulting in the final set of 14 environmental factors for model prediction (Table 2).
The distribution data of the six species of Swertia and the environmental variables for model prediction were loaded into the MaxEnt model, with 75% of distribution points randomly selected as the training set and the remaining 25% as the test set. The contribution rates of each environmental factor were calculated using the “Jackknife” method, repeated 10 times, and the model simulation effectiveness was tested using the area under the ROC curve (AUC value). The accuracy of the species distribution models was assessed using the Area Under the Receiver-Operating Characteristic Curve (AUC) values. AUC values range between 0 and 1 and are classified as failing (0.5–0.6), poor (0.6–0.7), fair (0.7–0.8), good (0.8–0.9), and excellent (0.9–1) [37,38]. Each species model was run 10 times, and the average model was used for analysis.
To determine suitable and unsuitable areas for each species, we reclassified the MaxEnt output files using MTSS (Maximum Training Sensitivity plus Specificity). We categorized potential habitats into three classes: unsuitable areas (p < MTSS), suitable areas (MTSS ≤ p < 0.66), and highly suitable areas (p ≥ 0.66) following previous studies to classify suitable habitats [11,39]. Using the SDMtoolbox v2.4 in ArcGIS, we analyzed changes in suitable habitat area and centroid shifts in target species from the present to 2100 under two future climate scenarios (SSP245 and SSP5855). We calculated the centroid coordinates of highly suitable areas for each target species in ArcGIS.

2.3. Effect of Phylogenetic Distance on Niches

We calculated the potential overlap areas of pairwise species of the six Swertia species using ArcGIS 10.8 software. The relationship between potential suitable zone changes and the phylogenetic distances of the Swertia species under different climate scenarios (SSP245 and SSP585 scenarios) was analyzed.
To quantify niche similarity between pairwise species, two metrics, Schoener’s D [40] and Warren’s I metric [41] were used to measure niche overlap. Both metrics range from 0 (niche models have no overlap) to 1 (niche models are identical). A Mann–Whitney U Test was used to determine whether interspecific niche overlap differed between species in each species pair at the near current period and two future climate scenarios. Furthermore, in order to validate the interplay between phylogenetic relationships and the rate of change in future suitable habitat area, we conducted correlation analyses. Meanwhile, we employed Schoener’s D and Warren’s I indices to evaluate the clustering tendency of the growth of six species under varying climatic conditions by comparing both indices for current and two future climate scenarios using analysis of variance (ANOVA).
The phylogenetic distance between each species was calculated using MEGA 11 software. The chloroplast whole-genome data of the six Swertia species were saved in a FASTA format file and imported into MEGA software for sequence alignment. After sequence alignment, the analysis of phylogenetic distances was conducted using the bootstrap resampling method with 1000 replicates and the p-distance method. The genetic distances between pairwise sequences were obtained and saved in XLSX format [42]. The chloroplast whole-genome data of the Swertia species were sourced from the GenBank website, with accession numbers provided (Table 1).

3. Results

3.1. Current Distribution of Six Species in the Genus Swertia

These Swertia species are predominantly found in China and its neighboring regions. However, different species of Swertia plants exhibit distinct distribution patterns across various regions. Swertia bimaculata plants are extensively distributed in multiple regions of Japan and China, with Japan having the highest distribution. In China, this species is predominantly found in southwestern and southern China, including Yunnan, Sichuan, Taiwan, Hubei, Guizhou, Guangzhou, and Chongqing, with a few occurrences in other regions, spanning latitudes and longitudes between 18° N and 42° N and between 91° E and 142° E. Swertia cincta is primarily distributed in Guizhou, Yunnan, and Sichuan, with latitudes and longitudes ranging from 98° N to 107° N and 22° E to 36° E. Swertia kouitchensis is mainly found in Guizhou, Yunnan, Hubei, and Sichuan, with latitudes and longitudes between 102° N and 110° N and between 26° E and 33° E. Swertia macrosperma is distributed in Xizang, Yunnan, Sichuan, Guizhou, Hubei, Taiwan, and Guangxi, with latitudes and longitudes ranging from 95° N to 121° N and 22° E to 32° E. Swertia nervosa is present in Xizang, Yunnan, Guangxi, Guizhou, Sichuan, Gansu, and Shaanxi, with latitudes and longitudes between 18° N and 35° N and between 79° E and 113° E. Swertia punicea is distributed in Yunnan, Sichuan, Guizhou, Hunan, Chongqing, and Zhejiang, with latitudes and longitudes spanning from 97° N to 121° N and 22° E to 34° E (Figure 1).
Overall, all six species are predominantly concentrated between 21° N and 42° N, primarily inhabiting the southwestern highlands of China and Japan. Geographically, they adapt to subtropical and subalpine climates with specific requirements for rainfall. The abundance and richness of the six species gradually decrease from south to north. In terms of species abundance, they are most prevalent in Yunnan, Sichuan, Taiwan, and Hubei in China, and also in Japan. Yunnan, Sichuan, and Guizhou exhibit the highest species richness, followed by Hubei, Chongqing, Hunan, Shaanxi, Xizang, and Gansu, among others. Conversely, Shaanxi, Fujian, Guangdong, and other regions have the lowest species richness.

3.2. MaxEnt Model Availability

Based on the ROC curve analysis, the potential geographic distributions of the six Swertia species predicted by MaxEnt were tested. The AUC2 values under the ROC curve for the training set and the test set were both higher than 0.9 (Figure S1), indicating that the MaxEnt model can be used to simulate the potential climatic suitable distribution of these species.

3.3. Dominant Environmental Variables

The main climatic factors influencing the distribution of these six species were bio18 (precipitation of the warmest quarter), bio9 (mean temperature of driest quarter), solar radiation, bio7 (temperature annual range) and elevation, with contribution rates of 25.7%, 16.9%, 15.0%, 13.4% and 12.2%, respectively (Table 2).
The climatic factors that dominated the geographical distribution of S. bimaculata were bio18 (54.8%), bio9 (23.2%), and solar radiation (9.6%), accounting for 87.6% of the dominant climatic factors after screening. The climatic factors that dominated the geographical distribution of S. cincta were (30.5%), bio6 (26.0%), bio7 (22.3%) and bio4 (14.9%) accounting for 93.7%. The climatic factors that dominated the geographical distribution of S. kouitchensis were bio9 (24.8%), solar radiation (25.7%), bio18 (23.0%) and slope (7.1%), accounting for 80.6%. The climatic factors that dominated the geographical distribution of S. macrosperma were bio18 (40.4%), elevation (19.1%), solar radiation (11.9%) and bio7 (11.1%), accounting for 82.5%. The climatic factors that dominated the geographical distribution of S. nervosa were bio18 (35.8%), bio9 (28.0%), elevation (14.6%) and slope (8.1%), accounting for 86.5%. The climatic factors that dominated the geographical distribution of S. punicea were bio7 (41.8%), solar radiation (26.9%), and bio9 (14.8%), accounting for 83.5%.
The single-factor response curves revealed distinct patterns of habitat suitability in relation to key environmental variables for the six Swertia species (Figure S3). For S. bimaculata, the response to bio9 (mean temperature of driest quarter) showed a pronounced unimodal distribution with a clear optimum at approximately 36.38 °C. Suitability values peaked at 1.0 at this optimal temperature and decreased sharply to near zero at both lower (−33.95 °C) and higher temperature extremes, indicating a narrow thermal tolerance range during the driest quarter. All species exhibited similarly shaped response curves to bio9, though with varying optimal values and tolerance ranges.

3.4. Range Changes Under Future Climate Change

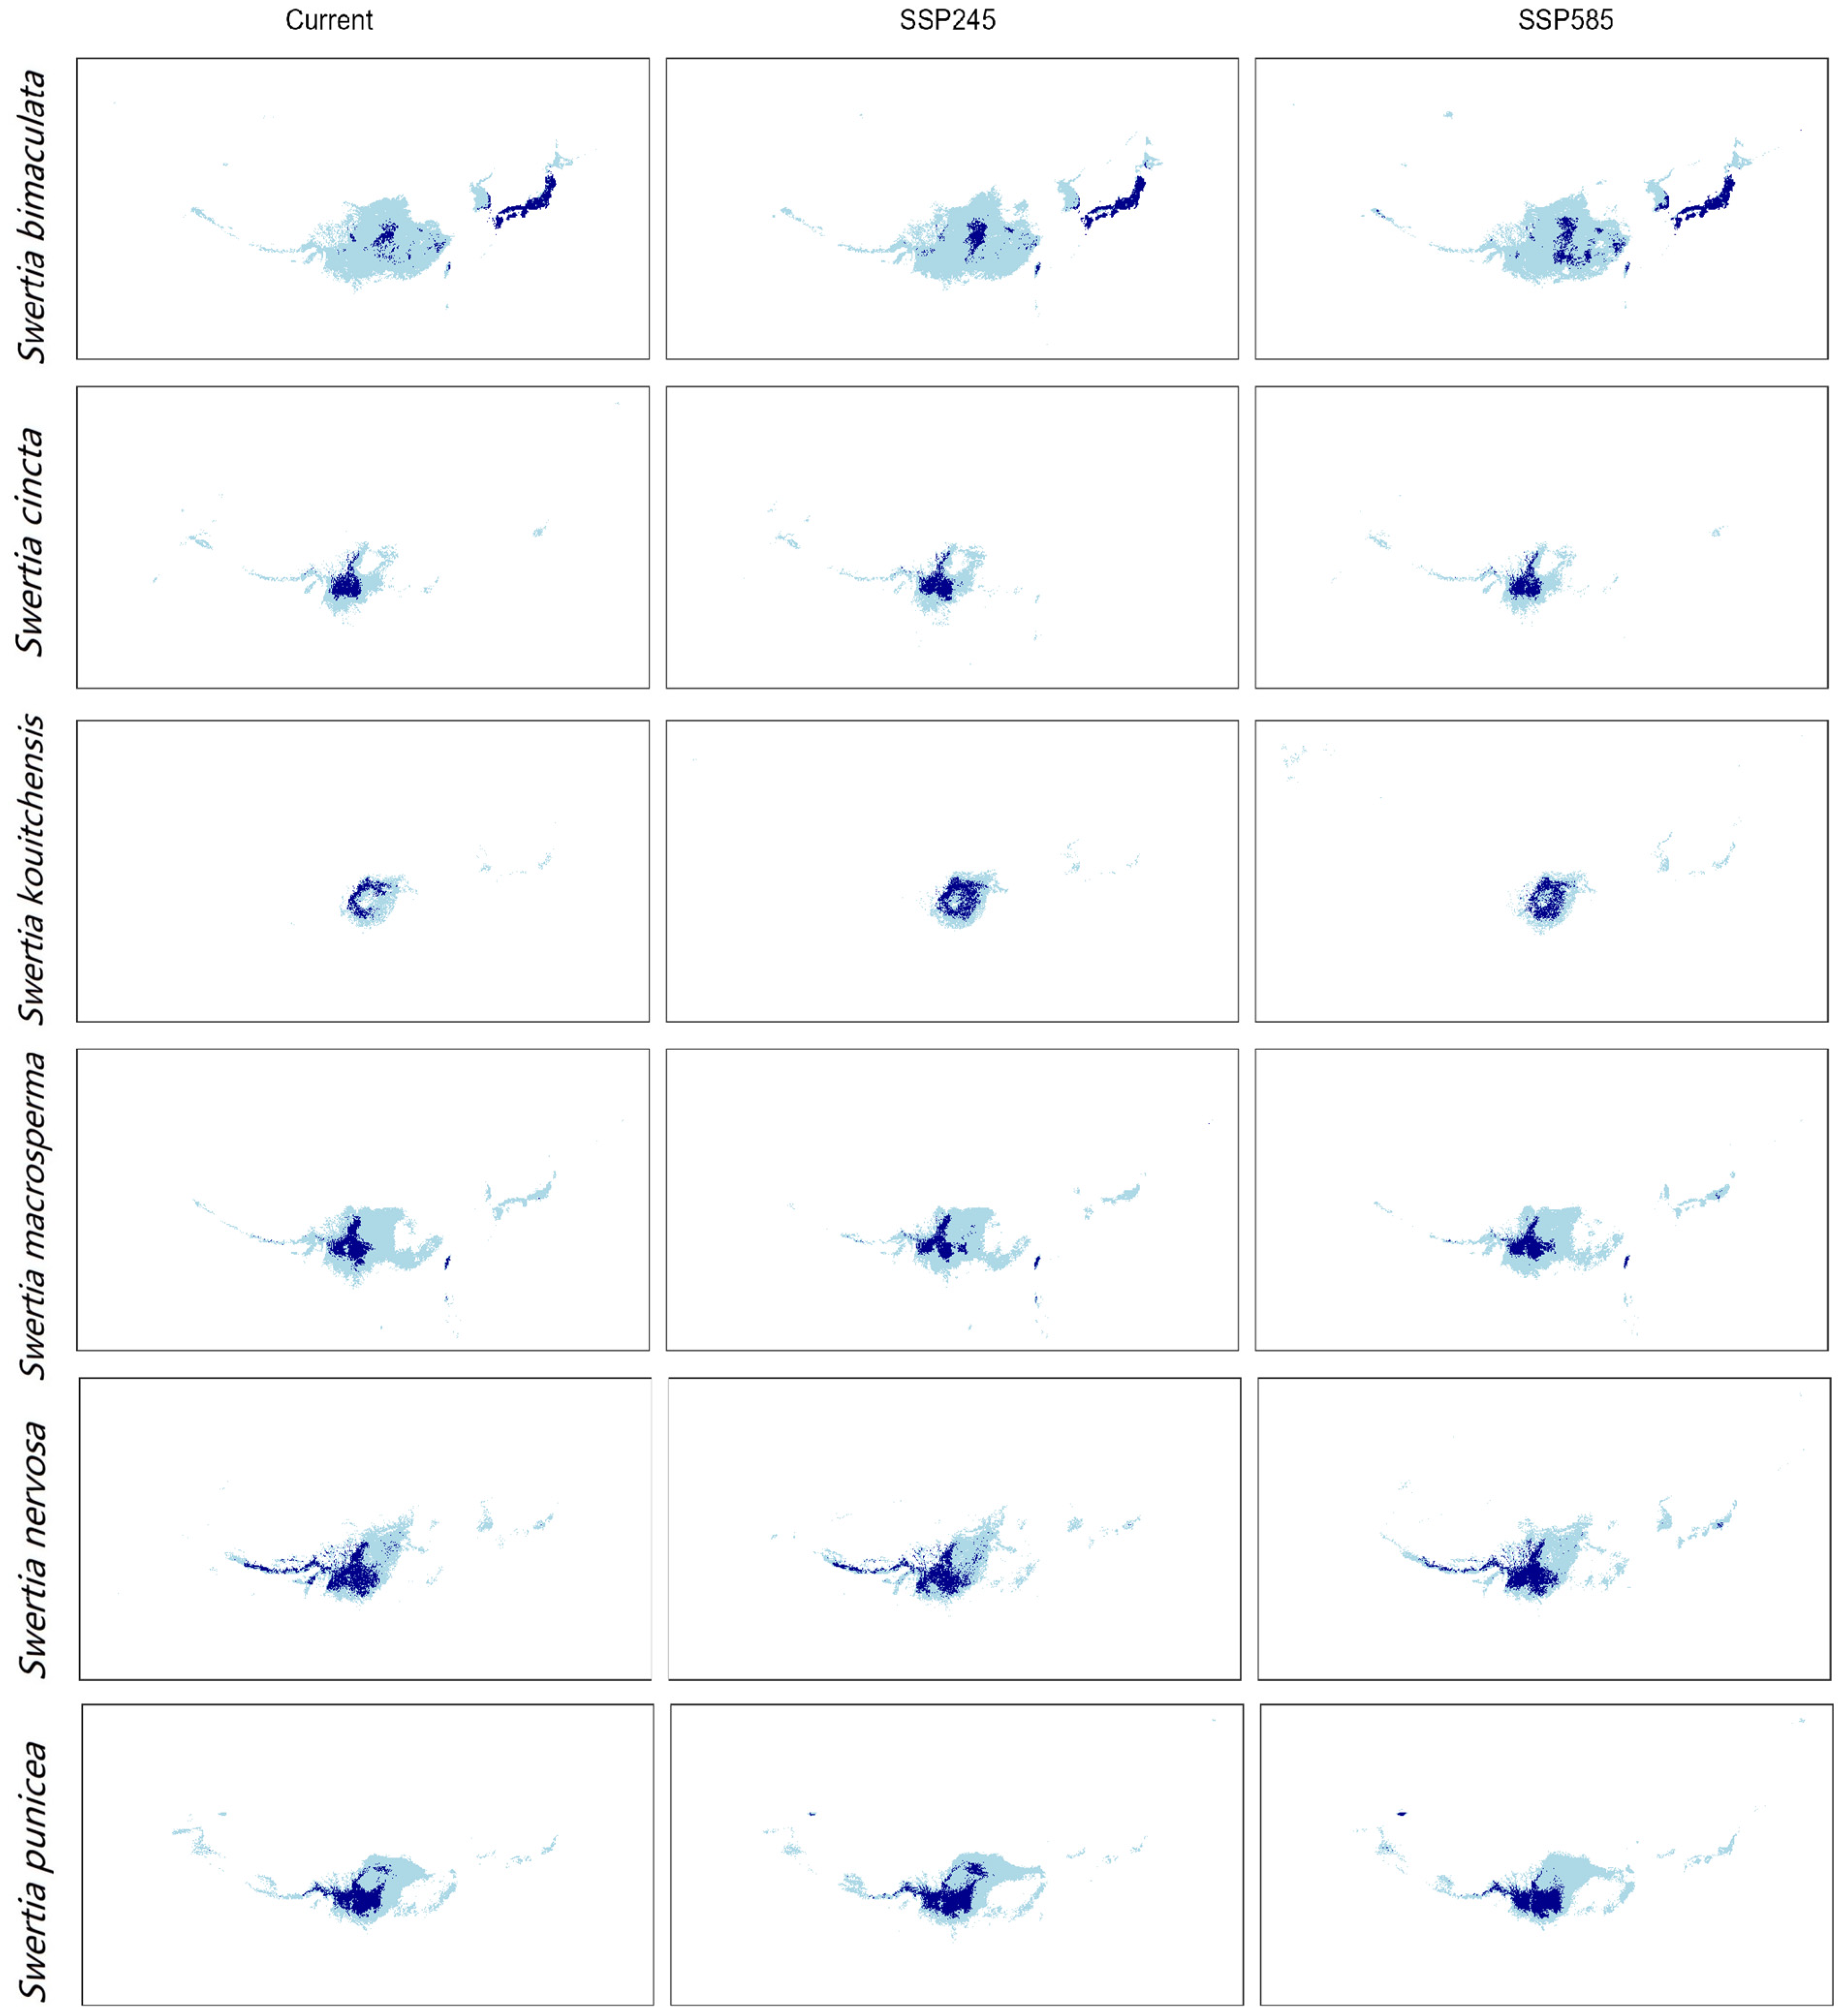
By identifying the dominant climate factors through rigorous screening processes and utilizing them as predictors for determining the potential climate suitability range, we have forecasted the distribution of climate suitability zones for six Swertia species under future climate scenarios (Figure 2).
We found that in the SSP245 scenario, the potential climate suitability zone area for the six Swertia species showed a decrease of 31% to 9%, with highly suitable zones varying from a decrease of 17% to an increase of 92%. In the SSP585 scenario, the potential climate suitability zone area ranges from a decrease of 8% to an increase of 10%, with highly suitable zones varying from a decrease of 8% to an increase of 71%. Notably, there are significant variations in the potential climate suitability zones among the different species (Table 3).
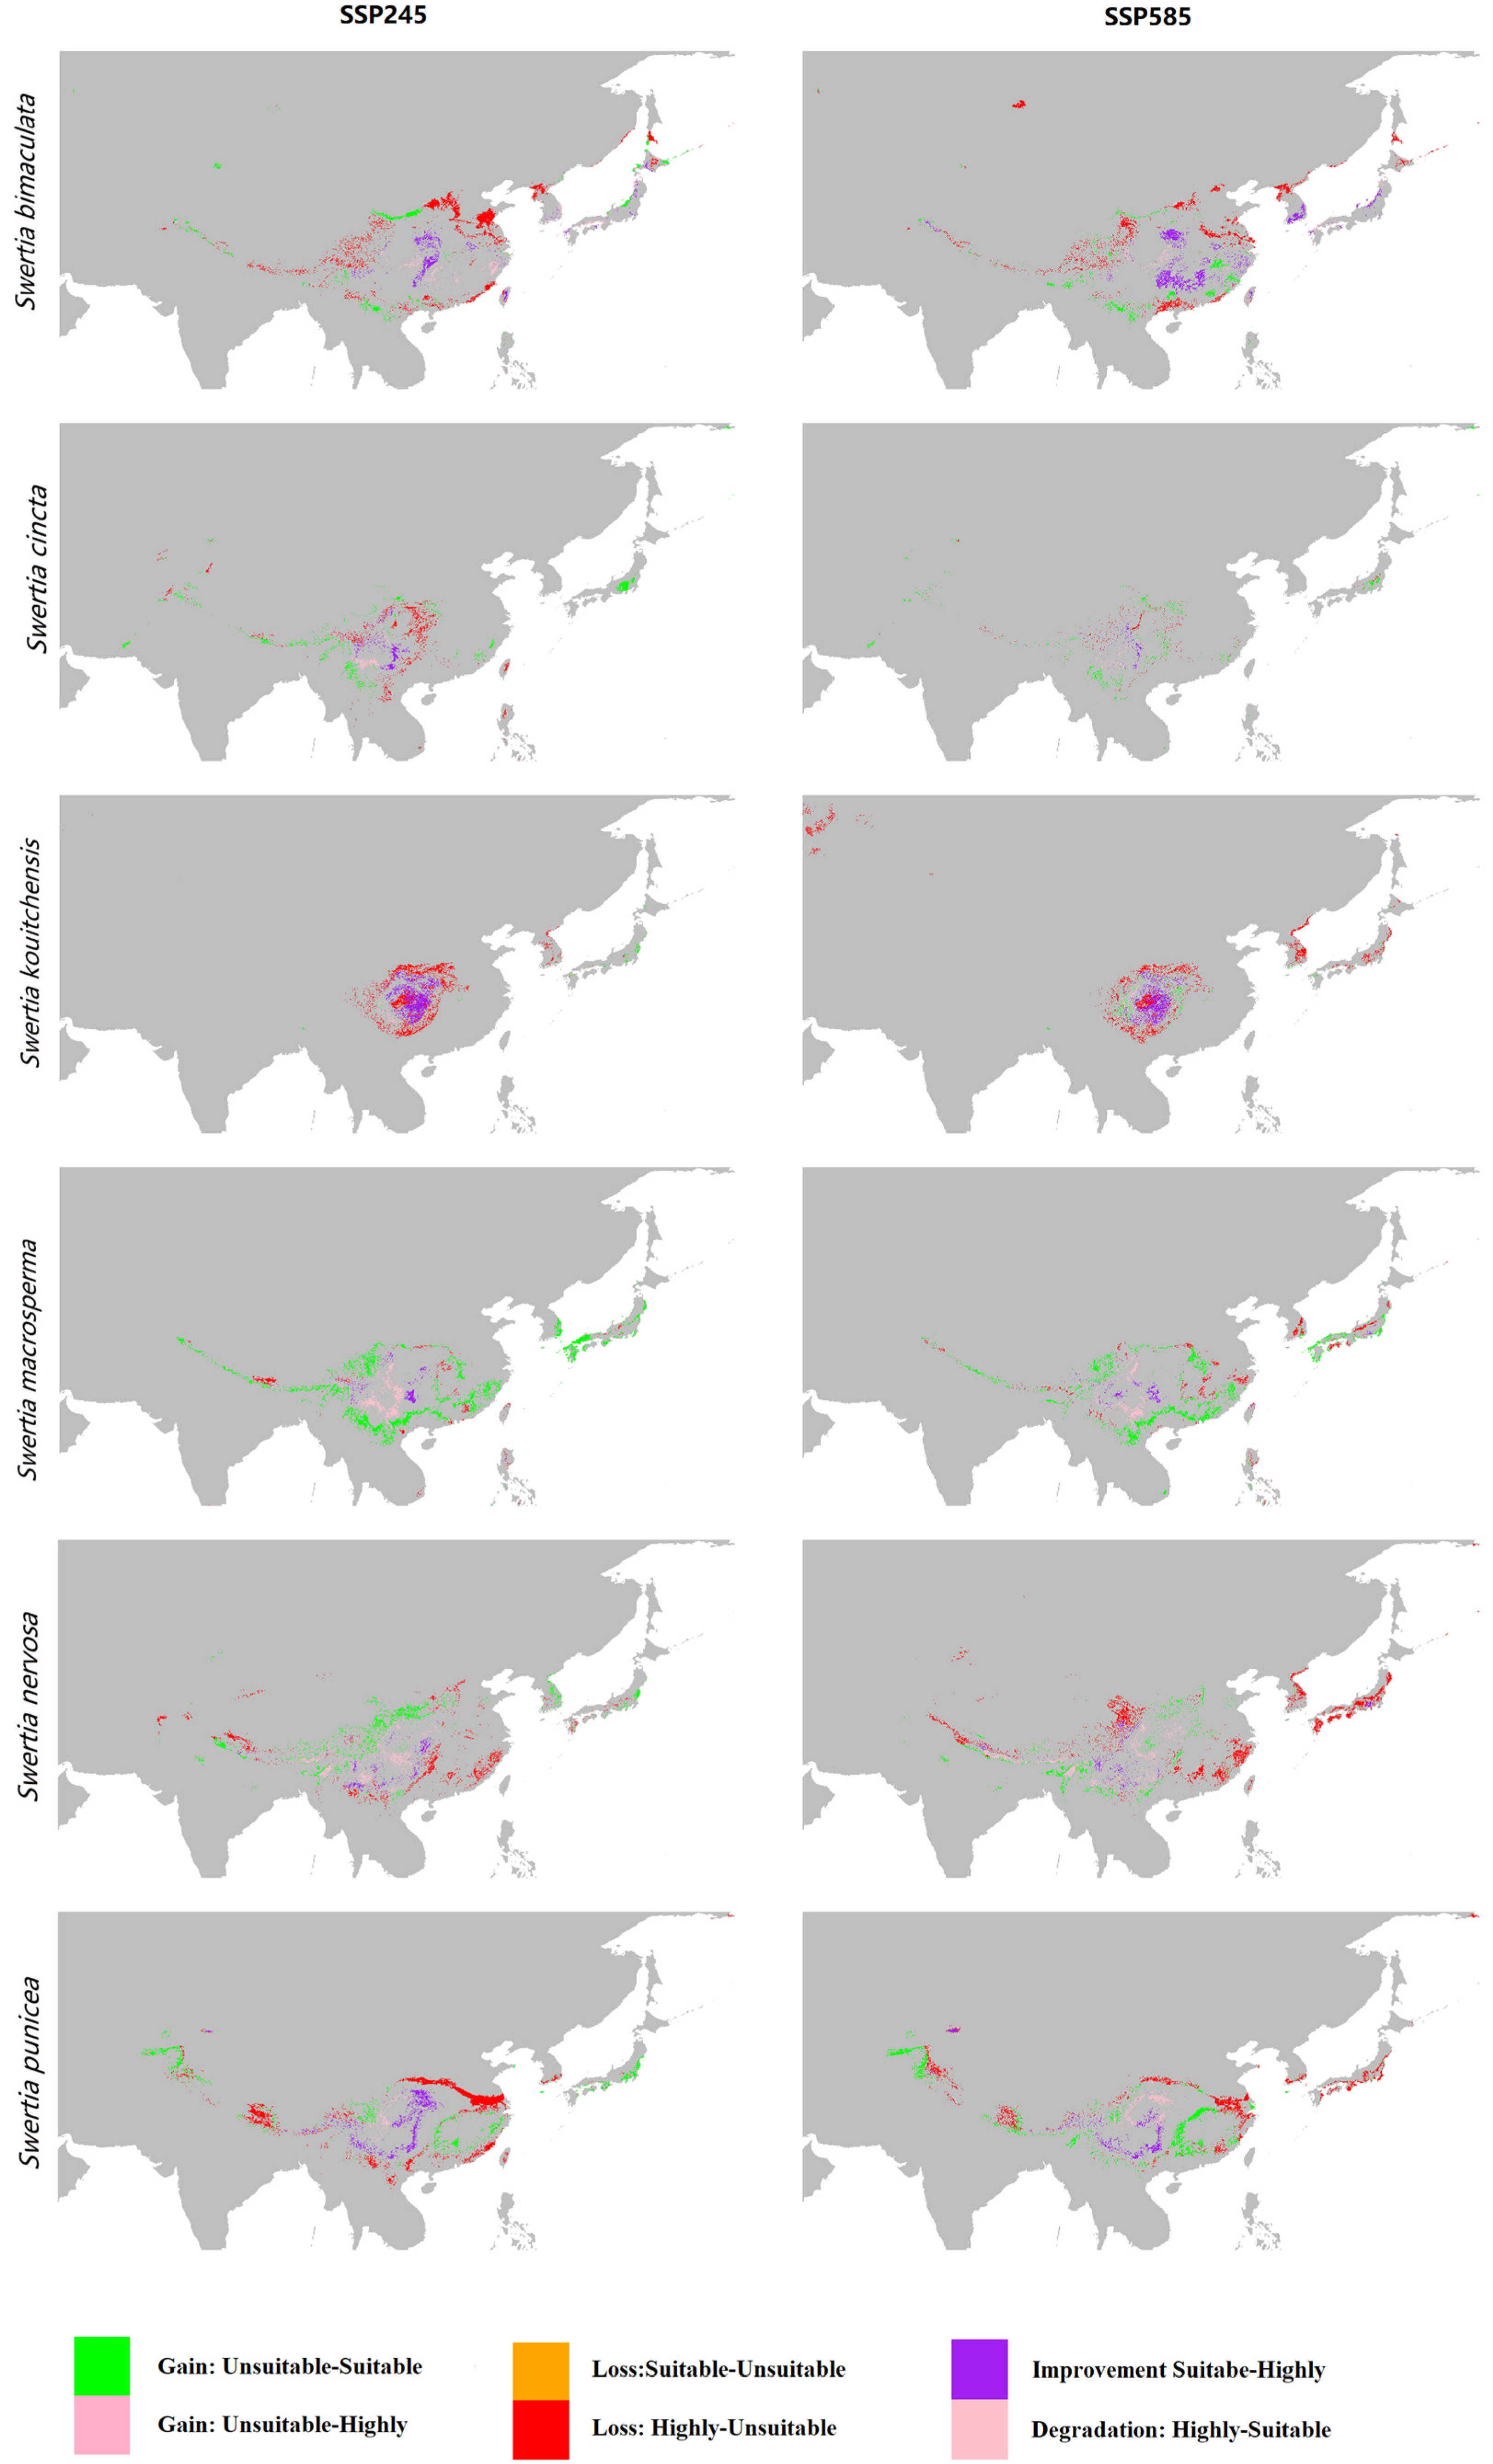
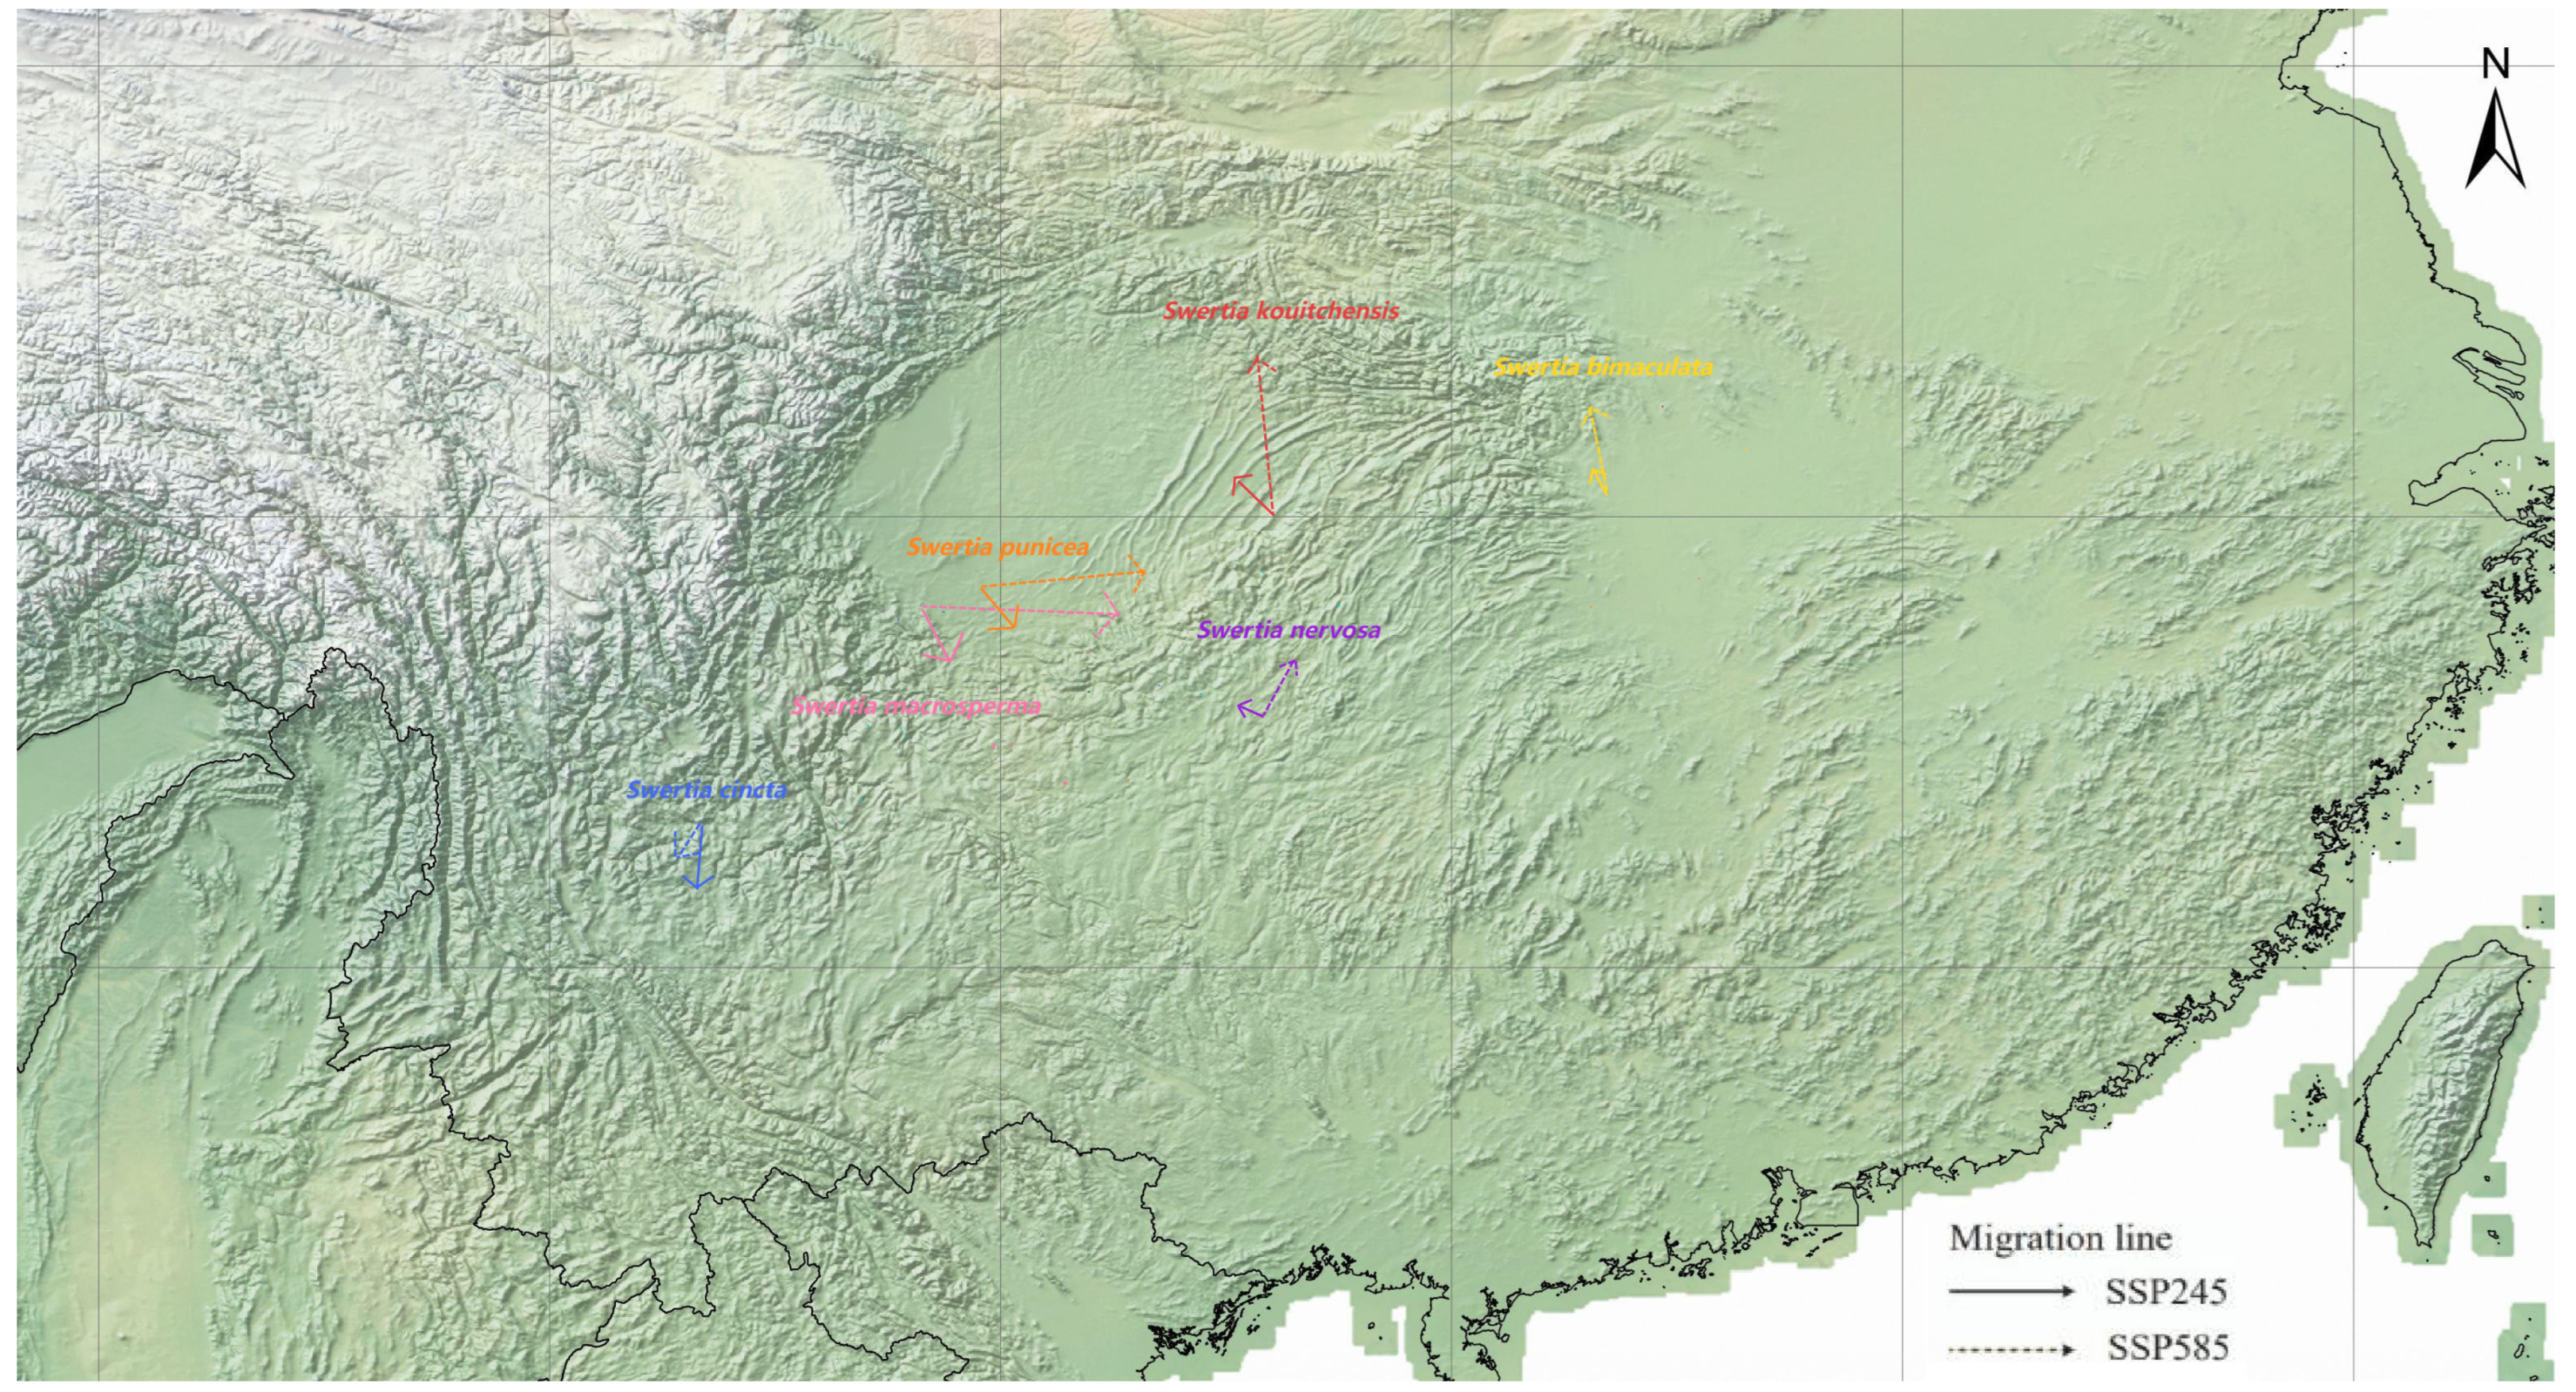
Based on the provided chart depicting distribution changes for six Swertia species under SSP245 and SSP585 scenarios, all species except S. cincta exhibit northwestward and upward (higher elevation) shifts by 2100, consistent with seeking suitable thermal conditions. However, responses are species specific (Figure 3).
In Swertia bimaculata, there is a significant loss in current southern and eastern ranges (e.g., Central and Eastern China) and it shifts towards higher elevations in the Qinling Mountains, Hengduan Mountains (W. Sichuan, N. Yunnan), and the Tibetan Plateau margin. In S. cincta, there is a minor contraction with high stability; it loses some marginal lowland areas and becomes increasingly confined to its core high-elevation habitats in the Himalayas and SE Tibetan Plateau, with a slight downward (lower elevation) shift noted, possibly tracking specific moisture regimes. Swertia kouitchensis loses habitats in its current central and eastern distribution and expands notably northwestward along the Himalayan range showing a strong shift into the N. Yunnan, W. Sichuan, and southern Gansu provinces under SSP585. In S. macrosperma, this species experiences moderate contraction, especially in lower elevation zones. It contracts into a more confined core area, shifting towards higher elevations in the Hengduan Mountains (N. Yunnan, W. Sichuan) and the eastern Himalayas. Swertia nervosa is predicted to experience a severe contraction in its range, especially under the more extreme SSP585 scenario. It will retract and shift towards Yunnan, Guizhou, Hunan, and the Sichuan Basin margin, indicating a strong eastward contraction into more humid, mountainous refugia. In S. punicea, models show minimal net contraction, demonstrating higher resilience. It will have a significant eastward and westward expansion under SSP585, reaching into Yunnan, Xizang, Hubei, Anhui, Henan, and Jiangsu, suggesting a broad tolerance to future climates.
The Hengduan Mountains (W. Sichuan, N. Yunnan), the eastern Himalayas, the Qinling Mountains, and the margin of the Tibetan Plateau emerge as critical future refugia and areas of potential expansion for most species (Figure 4). Most species shift to higher latitudes and higher elevations by 2100, while S. cincta is an exception, shifting to lower elevations. The patterns of contraction and movement are consistently more pronounced under the high-emission SSP585 scenario compared to the intermediate SSP245 scenario.

3.5. Effect of Phylogenetic on Niches

Schoener’s D and Warren’s I indices were high, with mean values of Schoener’s D ranging from 0.803 for current to 0.875 for SSP245 and 0.828 for SSP585, while the mean value of Warren’s I ranged from 0.820 to 0.889. There was a trend of increasing in both indices but without significant difference among the three scenarios for each index (both p > 0.05). Mantel tests showed that niche overlap among pairwise species was not significantly correlated with their phylogenetic distances (Figure S4). The correlation analysis also indicates that there is no correlation between the changes in climate distribution area and phylogenetic relationships.

4. Discussion

The results indicate that southwest of China, including Yunnan, Sichuan, and Guizhou will continue to be the areas with the highest abundance of the six Swertia species under current and future climate scenarios. These are in the southwestern mountains of China, which are known as a global biodiversity hotspot [43,44], characterized by high environmental heterogeneity, ample water and heat conditions conducive to the growth of the Swertia species. Therefore, the species richness in these areas is higher compared to other regions. These six Swertia species are mainly concentrated between 21° N and 42° N, as these plants occur mainly in subtropical climates. As one moves from south to north, the abundance and richness of Swertia species gradually decreases.
The geographical distribution of plants at the regional scale is mainly influenced by climate [10]. More specifically, changes in water and heat conditions directly impact the occurrence likelihood of plants [45,46]. The response of vegetation to water and heat changes shows significant spatial heterogeneity in regional ecosystems [23]. Through an analysis of blade cutting training gain, contribution rate, and single-factor response curve, we determined that the dominant climatic factors affecting the geographical distribution of Swertia species are precipitation in the warmest quarter, mean temperature of driest quarter, solar radiation, annual temperature range, and elevation. Precipitation in the warmest quarter is the most important climate factor influencing Swertia species. Swertia are herbaceous and are more sensitive to water and heat conditions; for example, S. bimaculata grows better in forests and is more likely to be found in wet habitats [32]. Our field work on the populations of these six species in the northern mountain of Kunming showed that populations of all six species were larger in the years with high precipitation than in drought years. Adequate precipitation in the warmest quarter ensures sufficient water for photosynthesis and other physiological activities during the growth period. We also found that temperature during the driest quarter represents a critical limiting factor for the distribution of these species, with each species occupying a specific thermal niche within this environmental dimension.
The geographical distribution of many plant species is also determined by temperature-related variables [45]. In this study, the geographical distribution of most Swertia species is explained more by temperature-related variables rather than precipitation-related variables. We found that the annual temperature range (bio7) between 24 °C and 35 °C maintains a distribution probability of over 80%, with the highest probability in the range of 24 °C to 30 °C. However, when the minimum temperature in the coldest month is below −15 °C, the probability of Swertia species distribution is less than 50%. With global warming, most flora and fauna tend to migrate towards higher latitudes and altitudes, where temperatures are cooler [47]. We project here that five of the Swertia species will migrate to higher altitudes and latitudes in response to predicted temperature changes under future climate change. This aligns with most previous research findings [47]. However, S. cinata is predicted to shift its distribution range to lower altitudes, possibly due to its higher initial distribution altitude, which is largely limited by variables related to precipitation, indicating a response to changes in precipitation conditions. We found that populations of this species in wet years were much larger than in dry years in northern Kunming.
The hypothesis of phylogenetic niche conservatism is considered common in nature [21,48,49,50]. However, in this study, no significant relationship was detected between ecological niche overlap and phylogenetic relatedness in Swertia species. Additionally, there is no correlation between the future trends of Swertia species and their phylogenetic relationships, indicating the limit constraint of evolutionary history. Therefore, a large-scale ecological niche differentiation may not be the primary driver of Swertia species diversity as we see from their co-occurring distribution pattern. The current distribution of these six Swertia species shows that there is a high level of eco-geographic niche overlap. Moreover, compared to the current situation, Schoener’s D and Warren’s I indices of the SSP245 and SSP585 scenarios increases indicate an even higher ecological niche overlap in the future, leading to more clustered growth of Swertia species. Most of them show a high-elevation movement which will lead them to meet other Swertia in high elevation. Therefore, we may expect higher numbers of congeners co-occurring together in the same region.
As one of the global mega-biodiversity hotspots, the mountains of southwestern China harbor many recent or old radiated groups of plants shared similar geographic ranges, coexisting commonly within overlapping elevation gradients, i.e., Pedicularis [51]. They occupy diversified micro-habitats, and some of them also share generalized pollinator groups [52]. The adaptive radiation of our Swertia species assemblage is similar to Pedicularis in this region, but we have to admit that regional scale niche modeling is not enough to understand their co-existence mechanism. More abiotic factors including vegetation, soil and biotic factors, i.e., pollinators should be included into the model to better predict their future distribution and co-occurring pattern. Ideally, a fine scale of modeling of their dispersal along the elevation of a mountain will be helpful to understand if they can still stay together in fine scale in the future.
Selfing is a reproductive insurance strategy in plants. In this study, S. macrosperma and S. nervosa species can be self-pollinating, showing a contracted geographic performance in future climates. Selfing species may have a low genetic diversity, they can easily expand local populations, but may not be well adapted to variable and stressful environments in the future. Another possible reason is that both selfing species show a selfing syndrome with a lower number of ovules per flower; consequently, both species have a low number of seeds compared with the high number of seeds per fruit for outcrossing species. This may limit the chance of seed dispersal. Four species, S. kouitchensis, S. punicea, S. bimaculata, and S. cincta are cross-pollinating plants, and all of them show a trend of expanding their distribution. They require pollinators for reproduction. The spatial distribution of plant species that rely on animal pollination for reproduction is influenced by the geographical distribution of their pollinators. Swertia bimaculata is usually found in wet understories of forest and pollinated mainly by various flies [53]. Importantly, three other out-crossing species are specialized to hornet wasp pollination. Their geographic distribution should be strongly influenced by specialized hornet wasp pollinators. Importantly, one of these three species’ pollinating hornet wasps, Vespa velutina, has expanded its distribution in Asia and Europe, becoming an invasive species [54]. Therefore, it is likely that pollinators may not be a restrictive factor for these three Swertia species. In the future, using a joint niche modeling approach to simulate suitable distribution changes for these species and their pollinating hornet wasps under climate change scenarios, considering both partners’ dispersal ability, will be insightful to predict their future migration and for their conservation [11].
In conclusion, our results show that, in the future, these six Swertia species will be more clustered in the mountains of southwestern China, but their responses to climate change vary. Protection measures should prioritize the two selfing species as they will face less favorable conditions for their growth and spread under future climates. Meanwhile, measures shall focus on protecting the most species-rich areas in the southwestern mountains of China, even considering translocation and implementing artificial breeding and cultivation for endangered species. More clustered distribution of these species in the future may create more resource competition, i.e., microhabitat and pollinators. These fine scale ecological and evolutionary trends should receive more attention in the future. During our field work in past years, extreme drought in 2023 caused rapid population decline for all six Swertia species; therefore, in the future, the impact of sudden and extreme climate events on local populations in shorter periods should be also examined to better predict their population dynamic and to indicate a suitable conservation management.

Supplementary Materials

The following are available online at: https://www.mdpi.com/article/10.3390/d17090657/s1. Table S1. Latitude and longitude coordinates of each record of six Swertia species and 19 bioclimatic variables used in this study. Figure S1. ROC curve of MaxEnt model prediction results under the current climate scenario for six Swertia species. Figure S2. Percentage of distributional gain of environmental variables on Swertia species detected using the knife-cut method. Figure S3. Single factor response curves for each plant species. Figure S4. The niche overlap (D and I values) and phylogenetic distances of six Swertia species. The niche overlap value and phylogenetic distance for each pair of species is represented by a dot.

Author Contributions

Conceptualization, Z.-X.R., D.W. and Z.W.; methodology, M.-X.D. and Z.-X.R.; formal analysis, M.-X.D.; investigation, M.-X.D. and S.-J.W.; resources, Z.-X.R.; data curation, M.-X.D. and Z.-X.R.; writing—original draft and editing, M.-X.D. All authors have read and agreed to the published version of the manuscript.

Funding

This research was financially supported by National Natural Science Foundation of China (No. 32271594).

Institutional Review Board Statement

Not applicable.

Data Availability Statement

Data are contained within this article.

Acknowledgments

We thank Carlos Eduardo Pereira Nunes of the University of São Paulo for comments om an earlier draft of this manuscript and polishing the English writing.

Conflicts of Interest

The authors declare no conflicts of interest.

References

  1. IPCC. Climate Change 2013: The Physical Science Basis. Contribution of Working Group I to the Fifth Assessment Report of the Intergovernmental Panel on Climate Change; Cambridge University Press: Cambridge, UK; New York, NY, USA, 2008. [Google Scholar]
  2. Trisos, C.H.; Merow, C.; Pigot, A.L. The projected timing of abrupt ecological disruption from climate change. Nature 2020, 580, 496–501. [Google Scholar] [CrossRef]
  3. Holm, J.A.; Kueppers, L.M.; Chamber, J.Q. Novel tropical forests: Response to global change. New Phytol. 2017, 213, 988–992. [Google Scholar] [CrossRef] [PubMed]
  4. Körner, C.; Kèorner, C. Alpine Plant Life. Functional Plant Ecology of High Mountain Ecosystems; Springer: Berlin, Germany, 1999; pp. 247–257. [Google Scholar]
  5. Kuo, C.C.; Liu, Y.C.; Su, Y.; Liu, H.Y.; Lin, C.T. Responses of alpine summit vegetation under climate change in the transition zone between subtropical and tropical humid environment. Nature 2022, 12, 13352. [Google Scholar] [CrossRef]
  6. Wang, Y.; Wang, R.; Li, Y.; Man, Z. Natural Vegetation Distribution and Climate Ecology Prediction Based on Geographic Information System. Environ. Eng. Manag. J. 2020, 19, 1623–1630. [Google Scholar] [CrossRef]
  7. Huang, S.; Zhang, W.; Hong, Z.; Yuan, Y.; Tan, Z.; Wang, Y.; Chen, Z.; Zheng, J.; Zhang, Z.; Zhang, L.; et al. Geographic distribution and impacts of climate change on the suitable habitats of Glycyrrhiza species in China. Environ. Sci. Pollut. Res. 2023, 30, 55625–55634. [Google Scholar] [CrossRef]
  8. Des, M.; Martínez, B.; deCastro, M.; Viejo, R.M.; Sousa, M.C.; Gómez-Gesteira, M. The impact of climate change on the geographical distribution of habitat-forming macroalgae in the Rías Baixas. Mar. Environ. Res. 2020, 161, 105074. [Google Scholar] [CrossRef] [PubMed]
  9. Ouyang, X.; Pan, J.; Wu, Z.; Chen, A. Predicting the potential distribution of Campsis grandiflora in China under climate change. Environ. Sci. Pollut. Res. 2022, 29, 63629–63639. [Google Scholar] [CrossRef]
  10. Huang, E.; Chen, Y.; Fang, M.; Zheng, Y.; Yu, S. Environmental drivers of plant distributions at global and regional scales. Glob. Ecol. Biogeogr. 2021, 30, 697–709. [Google Scholar] [CrossRef]
  11. Shi, Y.; Ren, Z.X.; Wang, W.; Xu, X.; Liu, J.; Zhao, Y.; Wang, H. Predicting the spatial distribution of three Astragalus species and their pollinating bumblebees in the Sino-Himalayas. Biodivers. Sci. 2021, 29, 79–769. [Google Scholar] [CrossRef]
  12. Deng, N.; Caixia, L.; Ma, F.; Song, Q.; Tian, Y. Understory vegetation diversity patterns of Platycladus orientalis and Pinus elliottii communities in Central and Southern China. Open Life Sci. 2023, 18, 791. [Google Scholar] [CrossRef]
  13. Vasconcelos, T.S.; Rodriguez, M.A.; Hawkins, B.A. Species distribution modelling as a macroecological tool: A case study using New World amphibians. Ecography 2012, 35, 539–548. [Google Scholar] [CrossRef]
  14. Mirhashemi, H.; Ahmadi, K.; Heydari, M.; Karami, O.; Valkó, P.; Nabaz, R.K. Climatic variables are more effective on the spatial distribution of oak forests than land use change across their historical range. Environ. Monit. Assess 2024, 196, 289. [Google Scholar] [CrossRef] [PubMed]
  15. Chen, X.; Wang, L.; Niu, Z.; Zhang, M.; Li, C.; Li, J. The effects of projected climate change and extreme climate on maize and rice in the Yangtze River Basin, China. Agric. For. Meteorol. 2020, 15, 282–283. [Google Scholar] [CrossRef]
  16. Phillips, S.J.; Anderson, R.P.; Schapire, R.E. Maximum entropy modeling of species geographic distributions. Ecol. Model. 2006, 190, 231–259. [Google Scholar] [CrossRef]
  17. Subedi, S.C.; Drake, S.; Adhikari, B.; Coggeshall, M.V. Climate-change habitat shifts for the vulnerable endemic oak species (Quercus arkansana Sarg.). J. For. Res. 2024, 35, 23. [Google Scholar] [CrossRef]
  18. Hu, W.J.; Wang, Y.Y.; Zhang, D.; Yu, W.W.; Chen, G.C.; Xie, T.; Liu, Z.H.; Ma, Z.Y.; Du, J.G.; Chao, B.X.; et al. Mapping the potential of mangrove forestrestoration based on species distribution models: A case study in China. Sci. Total Environ. 2020, 748, 142321. [Google Scholar] [CrossRef]
  19. Vessella, F.; Schirone, B. Predicting potential distribution of Quercus suber in Italy based on ecological niche models: Conservation insights and reforestation involvements. Forest. Ecol. Manag. 2013, 304, 150–161. [Google Scholar] [CrossRef]
  20. Qiu, L.; Jacquemyn, H.; Burgess, K.; Zhang, L.; Zhou, Y.; Yang, B.; Tan, S. Contrasting range changes of terrestrial orchids under future climate change in China. Sci. Total Environ. 2023, 895, 165128. [Google Scholar] [CrossRef]
  21. Yin, X.; Jarvie, S.; Guo, W.Y.; Deng, T.; Mao, L.F.; Zhang, M.H.; Chu, C.J.; Qian, H.; Svenning, J.C.; He, F.L. Niche overlap and divergence times support niche conservatism in eastern Asia-Eastern North America disjunct plants. Glob. Ecol. Biogeogr. 2021, 30, 1990–2003. [Google Scholar] [CrossRef]
  22. Kumar, V.; Van Staden, J. A review of Swertia chirayita (Gentianaceae) as a traditional medicinal plant. Front. Pharmacol. 2016, 6, 308. [Google Scholar] [CrossRef] [PubMed]
  23. Uprety, Y.; Asselin, H.; Boon, E.; Yadav, S.; Shrestha, K. Indigenous use and bio-efficacy of medicinal plants in the Rasuwa District, Central Nepal. J. Ethnobiol. Ethnomedicine 2010, 6, 101168. [Google Scholar] [CrossRef] [PubMed]
  24. Brahmachari, G.; Mondal, S.; Gangopadhyay, A.; Gorai, D.; Mukhopadhyay, B.; Saha, S.; Brahmachari, A. Swertia (Gentianaceae): Chemical and pharmacological aspects. Chem. Biodivers. 2004, 1, 1627–1651. [Google Scholar] [CrossRef]
  25. Li, J.; Zhao, Y.; Huang, H.; Wang, Y. Phytochemistry and pharmacological activities of the genus Swertia (Gentianaceae): A review. Am. J. Chin. Med. 2017, 45, 667–736. [Google Scholar] [CrossRef]
  26. Li, J.; Feng, L.; Sun, B.; Ikeda, T.; Nohara, T. Hepatoprotective activity of the constituents in Swertia pseudochinensis. Biol. Pharm. Bull. 2005, 28, 534–537. [Google Scholar] [CrossRef]
  27. Tian, C.; Zhang, T.; Wang, L.; Shan, Q.; Jiang, L. The hepatoprotective effect and chemical constituents of total iridoids and xanthones extracted from Swertia mussotii Franch. J. Ethnopharmacol. 2014, 154, 259–266. [Google Scholar] [CrossRef] [PubMed]
  28. He, T.; Liu, S. A Worldwide Monograph of Swertia and Its Allies; Beijing Science Press: Beijing, China, 2015. [Google Scholar]
  29. Chaudhuri, R.K.; Amita, P.; Timir, B.J. Production of genetically uniform plants from nodal explants of Swertia chirata Buch.-Ham. ex Wall.—An endangered medicinal herb. Vitr. Cell. Dev. Biol. 2007, 46, 467–472. [Google Scholar] [CrossRef]
  30. Cao, Q.; Xu, L.; Wang, J.; Zhang, F.; Chen, S. Molecular phylogeny of subtribe Swertiinae. Bull. Bot. Res. 2021, 41, 408–418. [Google Scholar]
  31. Hagen, K.B.V.; Kadereit, J.W. The phylogeny of Gentianella (Gentianaceae) and its colonization of the southern hemisphere as revealed by nuclear and chloroplast DNA sequence variation. Org. Divers. Evol. 2001, 1, 61–79. [Google Scholar]
  32. Wen, S.J.; Deng, M.X.; Ding, W.; Wang, Z.Y.; Ren, Z.X. Comparative floral nectar attributes in four Swertia species (Gentianaceae). Biodivers. Sci. 2024, 32, 23297. [Google Scholar] [CrossRef]
  33. The Global Biodiversity Information Facility (2023). Available online: https://www.gbif.org/ (accessed on 15 December 2023).
  34. O’Neill, B.C.; Kriegler, E.; Riahi, K.; Ebi, K.L.; Hallegatte, S.; Carter, T.R.; Mathur, R.; van Vuuren, D.P. A new scenario framework for climate change research: The concept of shared socioeconomic pathways. Clim. Chang. 2014, 122, 387–400. [Google Scholar] [CrossRef]
  35. Liu, H.C.; Jacquemyn, H.; He, X.Y.; Chen, W.; Huang, Y.Q.; Yu, S.; Lu, Y.P.; Zhang, Y. The impact of human pressure and climate change on the habitat availability and protection of Cypripedium (Orchidaceae) in northeast China. Plants 2021, 10, 84. [Google Scholar] [CrossRef] [PubMed]
  36. Ouyang, X.H.; Lin, H.P.; Bai, S.H.; Chen, J.; Chen, A.L. Simulation the potential distribution of Dendrolimus houi and its hosts, Pinus yunnanensis and Cryptomeria fortunei under climate change in China. Front. Plant Sci. 2022, 13, 1054710. [Google Scholar] [CrossRef] [PubMed]
  37. Swets, J.A. Measuring the accuracy of diagnostic systems. Science 1998, 240, 1285–1293. [Google Scholar] [CrossRef]
  38. Fielding, A.H.; Bell, J.F. A review of methods for the assessment of prediction errors in conservation presence/absence models. Environ. Conserv. 1997, 24, 38–49. [Google Scholar] [CrossRef]
  39. Radosavljevic, A.; Anderson, R.P. Making better Maxent models of species distributions: Complexity, overfitting and evaluation. J. Biogeogr. 2014, 41, 629–643. [Google Scholar] [CrossRef]
  40. Schoener, T.W. The Anolis lizards of Bimini: Resource partitioning in a complex fauna. Ecology 1968, 49, 704–726. [Google Scholar] [CrossRef]
  41. Warren, D.L.; Glor, R.E.; Turelli, M. Environmental niche equivalency versus conservatism: Quantitative approaches to niche evolution. Evolution 2008, 62, 2868–2883. [Google Scholar] [CrossRef]
  42. Kumar, S.; Stecher, G.; Li, M.; Knyaz, C.; Tamura, K. MEGA X: Molecular Evolutionary Genetics Analysis across Computing Platforms. Mol. Biol. Evol. 2018, 35, 1547–1549. [Google Scholar] [CrossRef]
  43. Myers, N.; Mittermeier, R.A.; Mittermeier, C.G.; da Fonseca, G.A.B.; Kent, J. Biodiversity hotspots for conservation priorities. Nature 2000, 403, 853–858. [Google Scholar] [CrossRef]
  44. Sun, H.; Zhang, J.W.; Deng, T.; Boufford, D.E. Origins and evolution of plant diversity in the Hengduan Mountains, China. Plant Divers. 2017, 39, 161–166. [Google Scholar] [CrossRef]
  45. Zhang, X.; Yan, X. Spatiotemporal change in geographical distribution of global climate types in the context of climate warming. Clim. Dyn. 2014, 43, 595–605. [Google Scholar] [CrossRef]
  46. Zhang, K.L.; Liu, H.N.; Pan, H.L.; Shi, W.H.; Zhao, Y.; Li, S.L.; Liu, J.C.; Tao, J. Shifts in potential geographical distribution of Pterocarya stenoptera under climate change scenarios in China. Ecol. Evol. 2020, 10, 4828–4837. [Google Scholar] [CrossRef]
  47. Chen, I.; Hill, J.K.; Ohlemüller, R.; Roy, D.B.; Thomas, C.D. Rapid range shifts of species associated with high levels of climate warming. Science 2011, 333, 1024. [Google Scholar] [CrossRef]
  48. Kou, J.; Wang, T.J.; Yu, F.Y.; Sun, Y.W.; Feng, C.; Shao, X.M. The moss genus Didymodon as an indicator of climate change on the Tibetan Plateau. Ecol. Indic 2020, 113, 106204. [Google Scholar] [CrossRef]
  49. Qian, H.; Ricklefs, R.E. Geographical distribution and ecological conservatism of disjunct genera of vascular plants in eastern Asia and eastern North America. J. Ecol. 2004, 92, 253–265. [Google Scholar] [CrossRef]
  50. Holt, R.D. Bringing the Hutchinsonian niche into the 21st century: Ecological and evolutionary perspectives. Proc. Natl. Acad. Sci. USA 2009, 106, 19659–19665. [Google Scholar] [CrossRef]
  51. Liang, H.; Ren, Z.X.; Tao, Z.B.; Zhao, Y.H.; Bernhardt, P.; Wang, H. Impact of pre- and post-pollination barriers on pollen transfer and reproductive isolation among three sympatric Pedicularis species. Plant Biol. 2018, 20, 662–673. [Google Scholar] [CrossRef]
  52. Xu, X.; Liang, H.; Ren, Z.X.; Maruyama, P.K.; Rech, A.R.; Trunschke, J.; Zhao, Y.H.; Li, H.D.; Wang, H. Generalised bumblebee-flower interactions demonstrate weak floral niche partitioning despite a high bee diversity. Ecography 2025. [Google Scholar] [CrossRef]
  53. Wang, S.; Fu, W.-L.; Du, W.; Zhang, Q.; Li, Y.; Lyu, Y.-S.; Wang, X.-F. Nectary tracks as pollinator manipulators: The pollination ecology of Swertia bimaculata (Gentianaceae). Ecol. Evol. 2018, 8, 3187–3207. [Google Scholar] [CrossRef]
  54. Lioy, S.; Bergamino, C.; Porporato, M. The invasive hornet Vespa velutina: Distribution, impacts and management options. CABI Rev. 2022. [Google Scholar] [CrossRef]
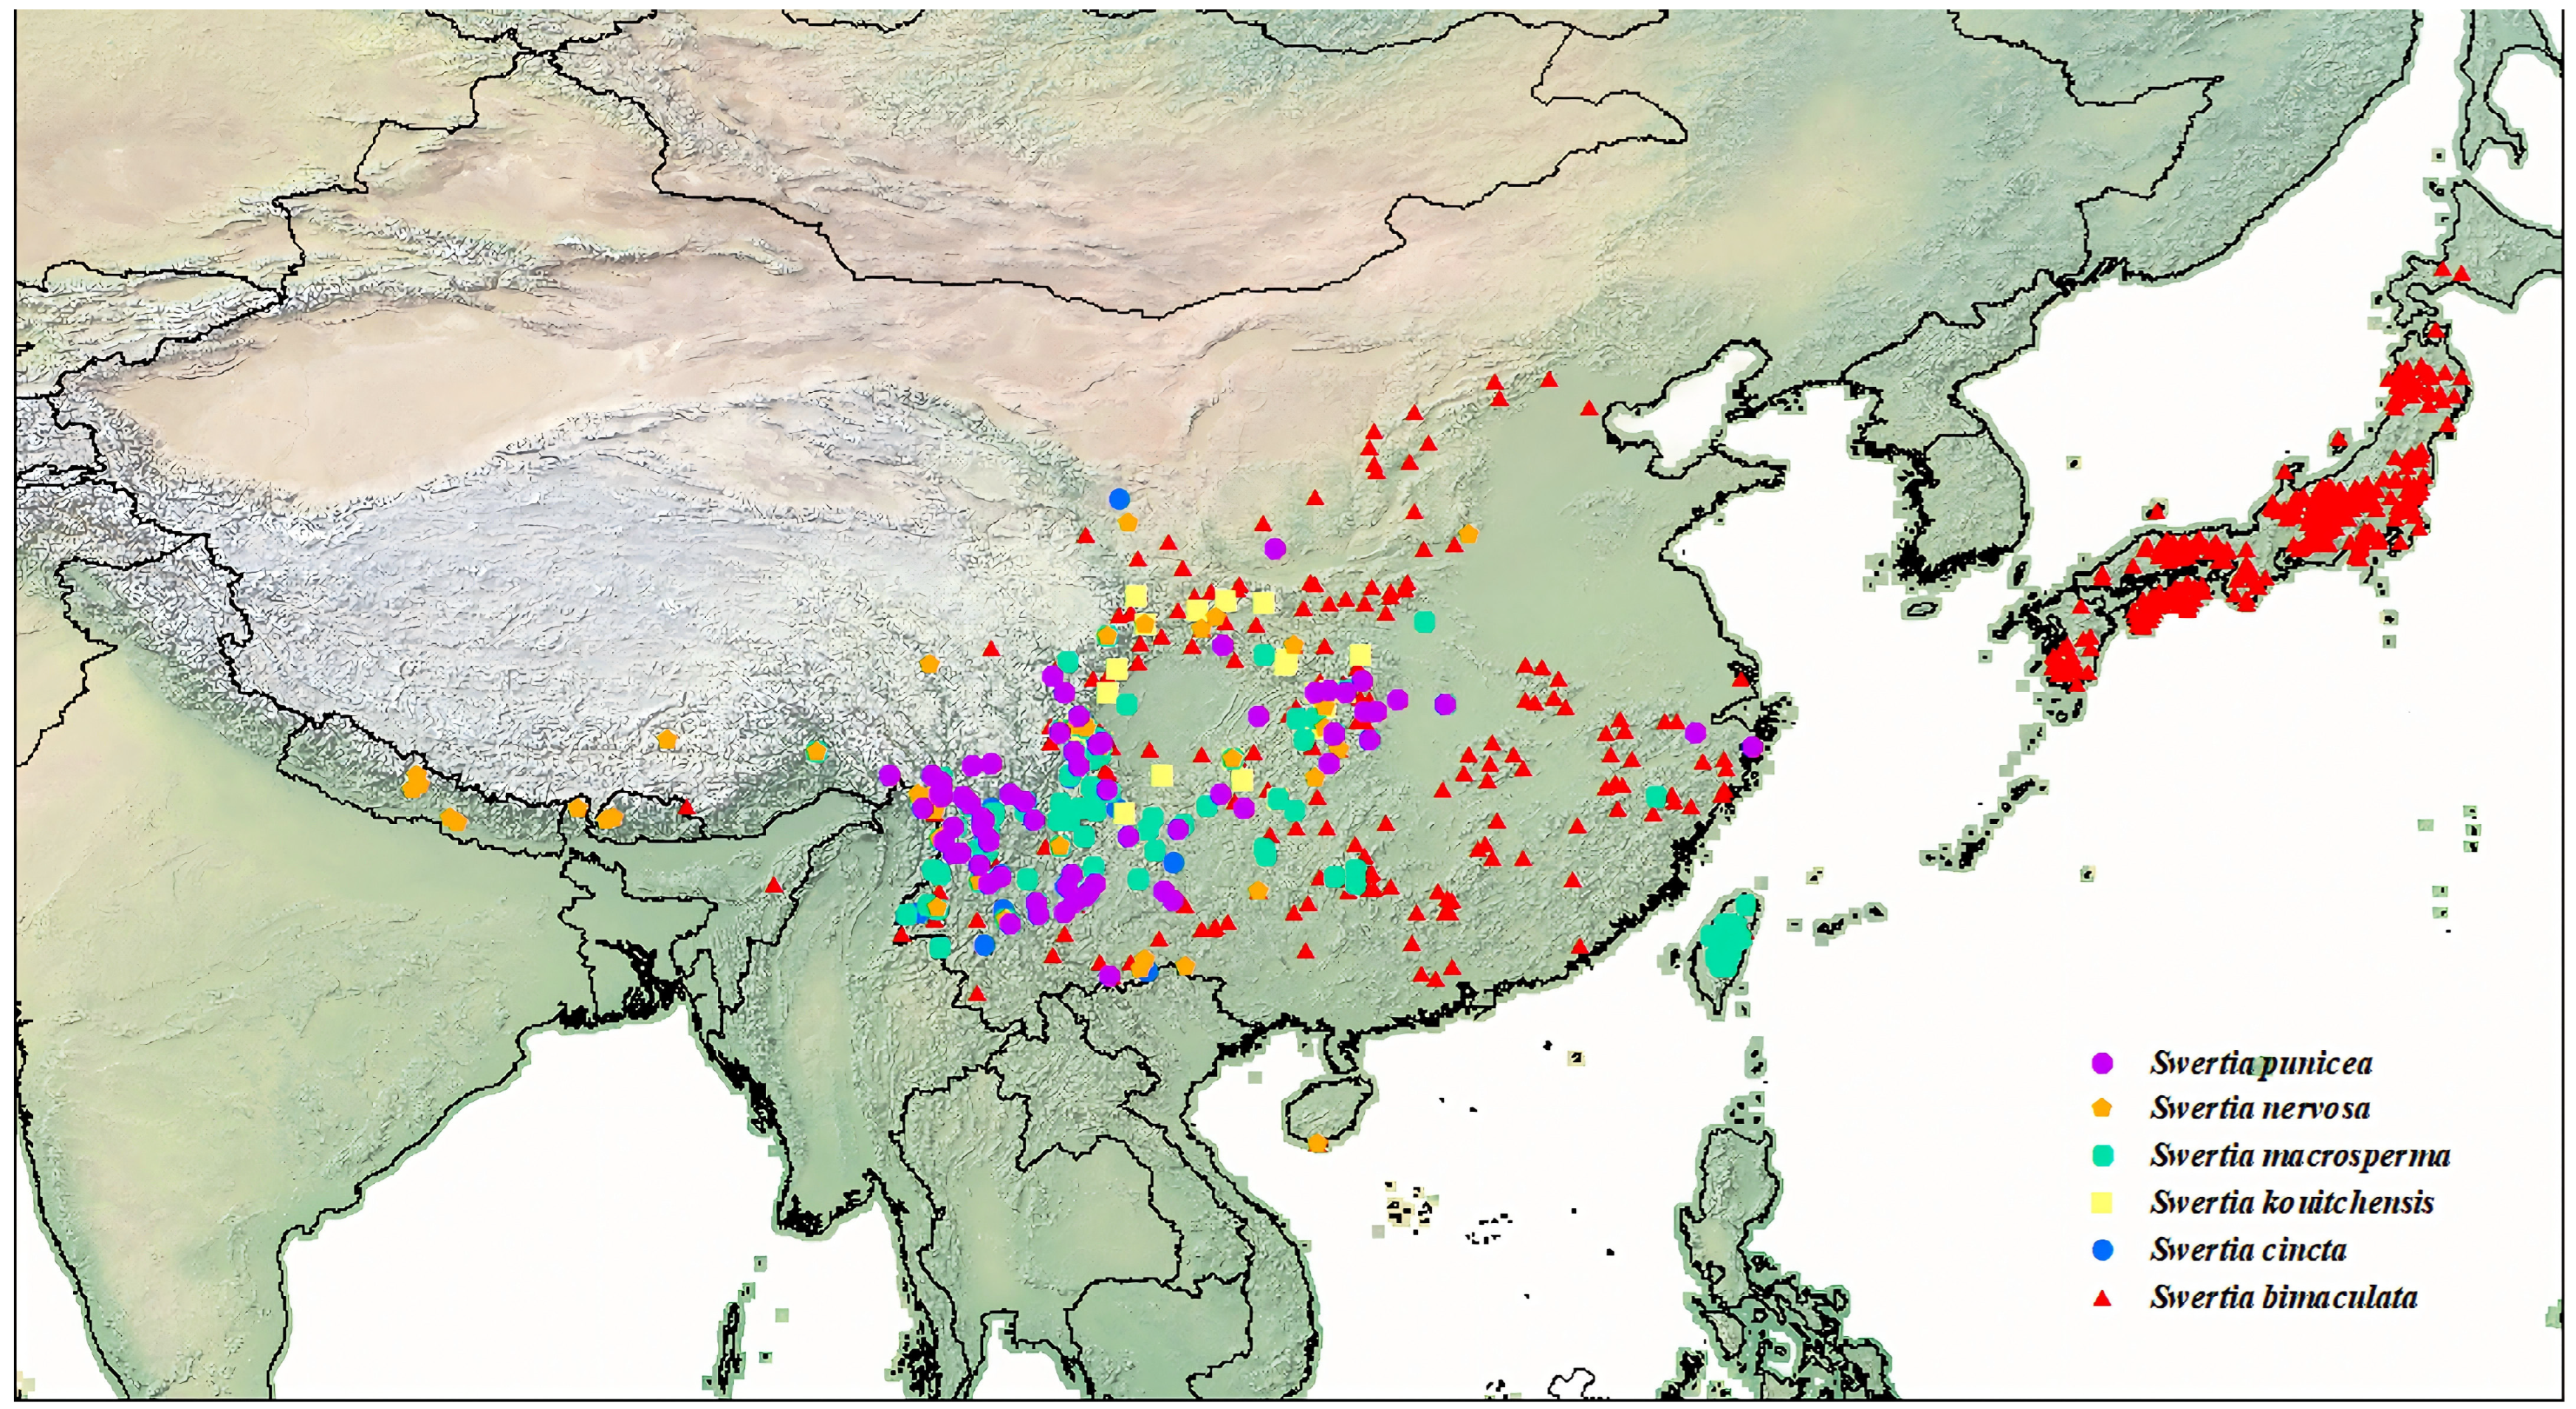
Figure 1. Current distribution and occurrence points of six Swertia species.
Diversity 17 00657 g001
Figure 2. Projections of current and future modeled distribution areas of six Swertia species at near current (1970–2000) and spatial change at 2100 (2081–2100) under two climate change scenarios (SSP245 and SSP585). light blue indicates potentially suitable area; dark blue indicates potentially highly suitable area.
Diversity 17 00657 g002
Figure 3. Comparison of suitable habitats under current and future climates.
Diversity 17 00657 g003
Figure 4. Centroid migration routes of six Swetia species under SSP245 and SSP585 climate scenarios.
Diversity 17 00657 g004
Table 1. The six species of Swertia that were studied, their breeding systems, pollinators, the number of occurrence points, and GenBank accession numbers for the complete chloroplast genomes. Pollinator data is from Wen et al. [32].
SpeciesBreeding SystemsPollinatorsNumber of RecordsGenBank Accession Numbers
Swertia bimaculataOutcrossingFlies643MW344296
Swertia cinctaOutcrossingHornet wasps47MZ261898
Swertia kouitchensisOutcrossingHornet wasps26MZ261902
Swertia macrospermaSelfingFlies and bees114MZ261903
Swertia nervosaSelfingFlies and bees78NC057596
Swertia puniceaOutcrossingHornet wasps69MZ261896
Table 2. Climatic factors used to model the potential suitable distribution of Swertia.
Bioclimatic VariablesThe Proportion of Environmental Factors in Different Models (%)Contribution
Ratio (%)
Swertia
bimaculata
Swertia
cincta
Swertia
kouitchensis
Swertia
macrosperma
Swertia
nervosa
Swertia
punicea
aspect0.10000.700.1
bio2 (Mean diurnal range)0.64.86.43.21.202.7
bio3 (Isothermality)1.2001.9000.5
bio4 (Temperature seasonality)1.20006.401.3
bio6 (Min temperature of coldest month)02600004.3
bio7 (Temperature annual range)022.35.211.1041.813.4
bio8 (Mean temperature of wettest quarter)0.6000000.1
bio9 (Mean temperature of driest quarter)23.2024.810.328.014.816.9
bio15 (Precipitation seasonality)5.30.11.61.400.21.4
bio18 (Precipitation of warmest quarter)54.802340.435.8025.7
bio19 (Precipitation of coldest quarter)00.96.204.15.62.8
elevation030.5019.114.69.112.2
slope2.50.57.10.78.11.53.4
solar radiation9.614.925.711.91.126.915.0
Table 3. Rate of change in suitable areas in the simulated distribution of the six study species in the genus Swertia.
Rate of Change in Suitable AreasRate of Change in Highly Suitable Areas
SSP245SSP585SSP245SSP585
S. bimaculata6.59%4.35%6.39%38.29%
S. cincta0.69%−3.63%8.81%2.78%
S. kouitchensis31.45%27.61%92.20%71.19%
S. macrosperma−16.04%−8.43%−17.35%−7.94%
S. nervosa−0.72%10.20%−11.81%−8.35%
S. punicea9.24%1.30%24.26%5.34%
Disclaimer/Publisher’s Note: The statements, opinions and data contained in all publications are solely those of the individual author(s) and contributor(s) and not of MDPI and/or the editor(s). MDPI and/or the editor(s) disclaim responsibility for any injury to people or property resulting from any ideas, methods, instructions or products referred to in the content.