Article

Thermal Ecology of Hermann’s Tortoise, Testudo hermanni and Glass Lizard Pseudopus apodus in a Seasonal Environment

1
Natural History Association of Montenegro, Pažići 12, 81410 Danilovgrad, Montenegro
2
Faculty of Natural Sciences and Mathematics, Department of Biology, University of Montenegro, 81000 Podgorica, Montenegro
3
Faculty of Sciences, University of Montenegro, 81000 Podgorica, Montenegro
4
Institute for Development, Ecology, Conservation and Cooperation, Via G. Tomasi di, Lampedusa 33, 00144 Rome, Italy
*
Author to whom correspondence should be addressed.
Diversity 2025, 17(9), 638; https://doi.org/10.3390/d17090638
Submission received: 15 July 2025 / Revised: 22 August 2025 / Accepted: 26 August 2025 / Published: 11 September 2025
(This article belongs to the Section Animal Diversity)

Abstract

The importance of temperature for the biology and ecology of reptiles is well known. In temperate regions where temperatures fluctuate on a daily and seasonal basis, reptiles must respond appropriately to maintain body temperatures that enable activity. In this study, we describe temporal changes in the thermal environment from January to December in Montenegro and the impact on two species of reptile, Hermann’s tortoise, Testudo hermanni, and the large, legless lizard Pseudopus apodus. These reptiles differ in morphology and diet and have a long phylogenetic separation but experience the same thermal environment. To give insight into any impact of these factors on their thermal ecology we calculated monthly thermoregulatory efficiency indexes derived from field body temperatures, set point temperatures—defined as the preferred body temperatures, and temperatures of null models. The results indicated that both species exhibited high thermoregulatory efficiency, with T. hermanni showing the highest levels across the active year and also maintaining higher body temperatures than P. apodus potentially reflecting the dietary and lifestyle differences. During the hottest months, body temperatures of T. hermanni frequently exceeded the set point range but were not exceeded by P. apodus at any time. Microhabitat patches of closely situated sunlight and shaded areas were the most frequently selected patches in both species, with T. hermanni spending greater amounts of time in shaded patches compared to P. apodus. The efficiency indexes, together with data on microhabitat selection, indicated both species moved non-randomly through the environment, selecting appropriate habitat patches and maintaining body temperatures close to the set point range whilst avoiding the dangerously high body temperatures that occur during the hotter months. During the winter months from November to February, the second and third quartiles of the model temperatures fell below the set point range temperatures of both species. This corresponded with their dormant period. In general, the results emphasise the importance of habitat diversity and integrity in reptile ecology and for their conservation.

1. Introduction

Temperature influences all aspects of the physiological processes in reptiles and is now well understood to be a key factor in driving their behaviour, physiology, and ecology [1,2,3]. However, different regions and climates impose different ecological constraints, which in turn will determine the extent of the thermoregulatory effort required to reach preferred body temperatures, e.g., [3,4,5,6,7]. Consider a hypothetical reptile living in a heterogeneous thermal environment in a temperate zone habitat composed of a mosaic of sunlit, partial sunlit and shaded patches. In such environments the reptile will potentially encounter predators and food resources and face a wide range of heat loads both on a daily and seasonal basis. If the microhabitat patches contain few predators and offer a range of temperatures that are easy for the reptile to access, then it is defined as a low-cost thermal environment, since the energy and ecological costs of accessing appropriate thermal resources will be low. Therefore, to move optimally and efficiently regulate body temperature, the reptile must behave non-randomly and select the appropriate patches that present the required temperatures. If the environment begins to cool, they can respond by decreasing basking intensity and shifting the optimum body temperature ranges or increase basking intensity and reduce the time for other activities [4,5,6]. Therefore, how successfully a reptile maintains their body temperature in the field will depend on the degree of thermoregulatory effort and the extent of the constraints imposed by the thermal environment [1]. Larger species face different problems due to differences in body mass/skin surface area, resulting in slower heating and cooling rates that may impact their capacity to reach target body temperatures required for activity [3,8,9,10] and avoid overheating, e.g., [11].
Two of the largest species found in Europe are in the latter category, Hermann’s tortoise, Testudo hermanni, and the glass lizard, Pseudopus apodus. Both species are frequently found in syntopy in Montenegro, which has a typical sub-Mediterranean climate with very hot summers and mild winters. They therefore experience the same thermal environment where they forage widely: T. hermanni for selective plant material [12,13] and P. apodus for invertebrates and small vertebrates [14,15]. Hermann’s tortoise can potentially attain a body mass of 2 kg (Figure 1A,B), while P. apodus, Europe’s largest lizard species, is capable of attaining a body mass of around 0.5 kg (RM, unpublished observations based on data from populations over the wider area). This lizard has a snake-like morphology that is heavily armoured with osteoderms present within the outer scales (Figure 1C,D [16]). The thermal ecology of both species has been studied in several areas in the Balkans including further south in Greece [15,17,18,19,20,21,22,23] and in Italy [24]. In these regions, there are seasonal and daily differences in temperature that offer opportunities to attain the body temperatures required for activity, but there is also a risk of overheating in the hot summer months. The latter involves the critical thermal maximum body temperature (CTM), the temperatures that disorganize the locomotory capacity and limit their ability to avoid further body temperature increases due to enzyme malfunctions and tissue damage that will ultimately lead to death [6,25,26]. In T. hermanni, for example, the CTM range is 39–42 °C [27].
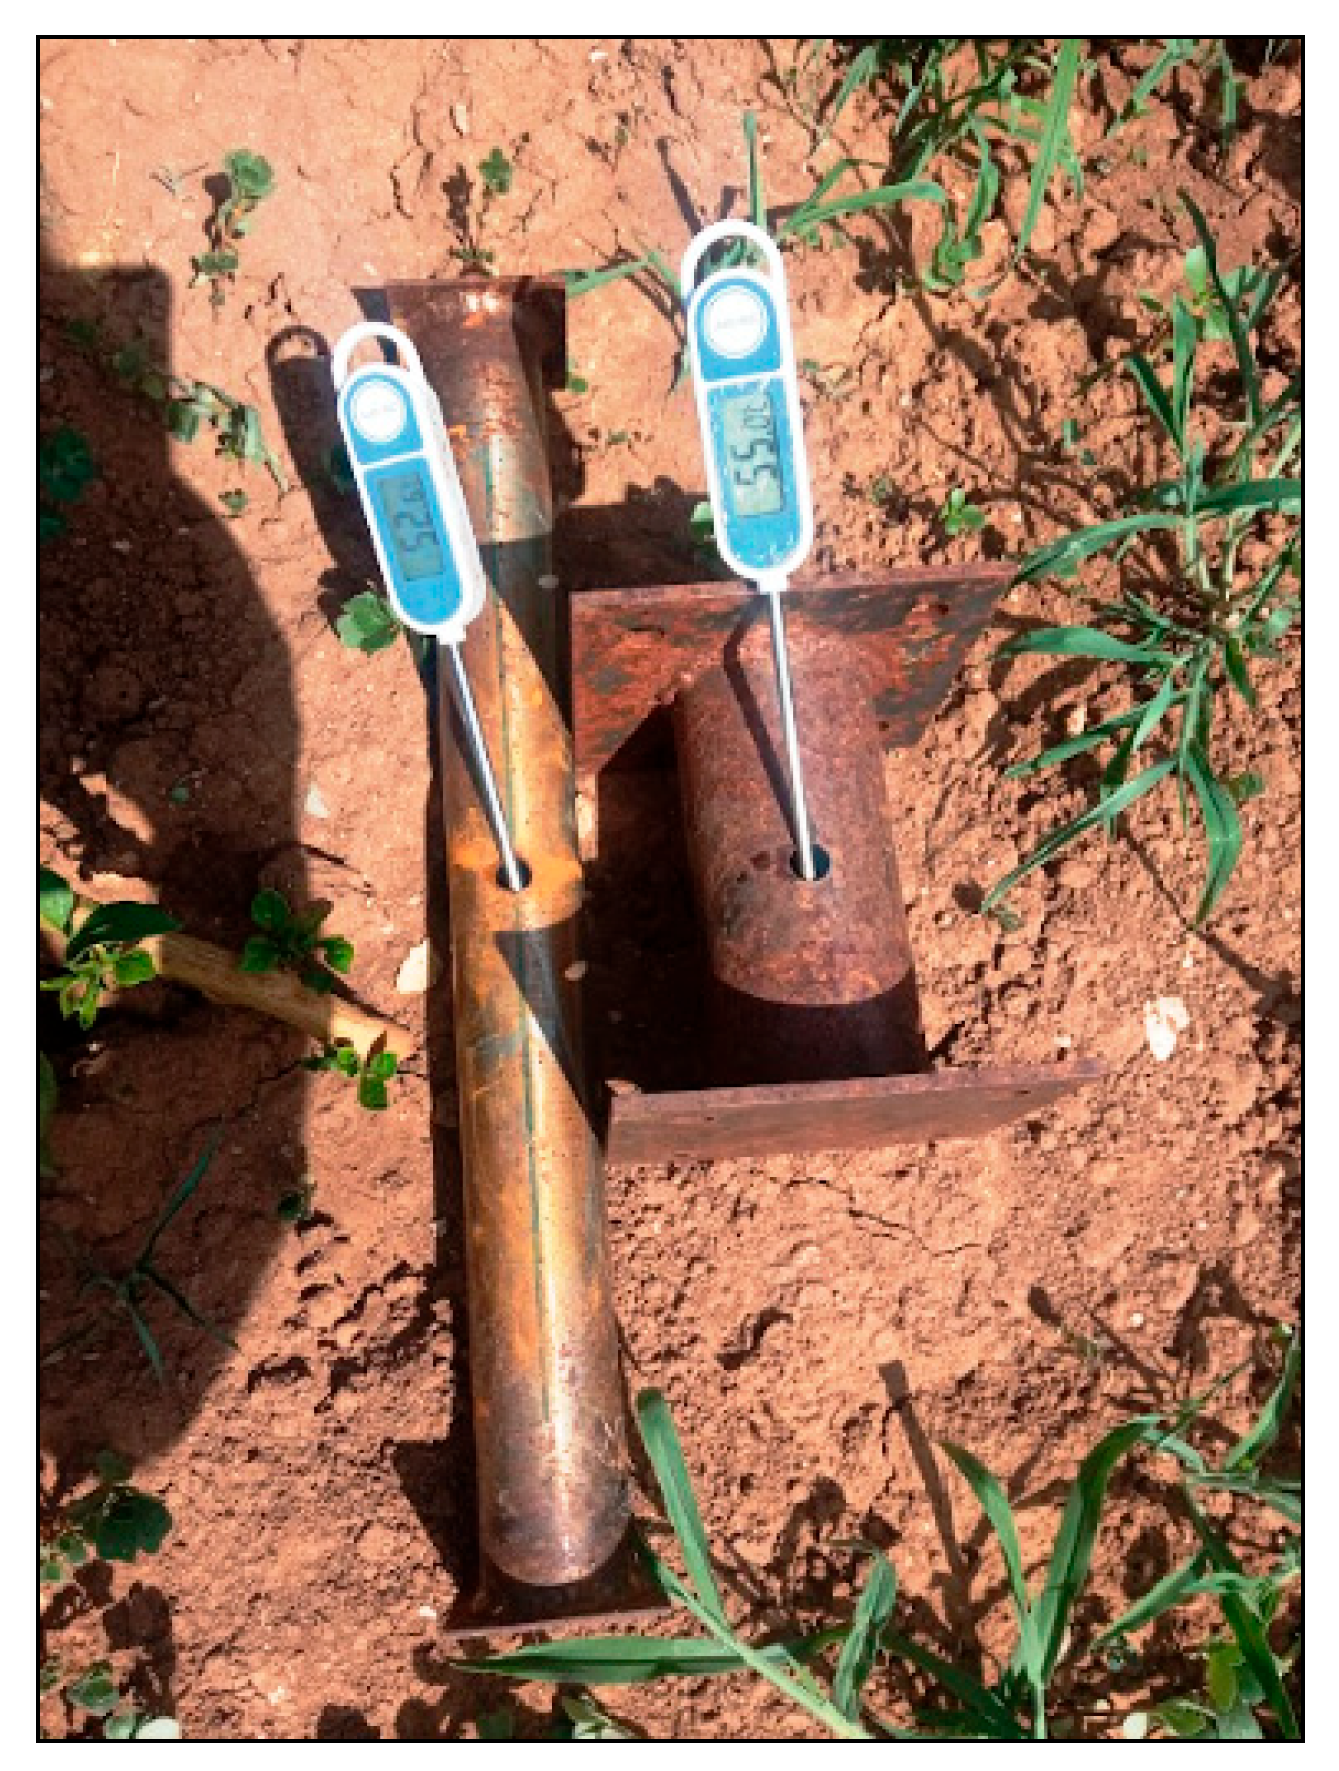
To give a more comprehensive understanding of how effectively reptiles thermoregulate in changing thermal environments requires data that encompass the complete annual activity period by synthesising information on reptile body temperatures (Tb’s) in field environments; their preferred Tb’s, derived from Tb’s selected in laboratory heat gradients, defined as Tset and changes in environmental heat loads using null models are required [5]. In this study, we employed hollow-walled metal tubes as null models (Tm’s) to record the changes in the thermal environment (Figure 2). The models have value in that they have a low heat capacity and rapid response to changes in radiation levels [28]. If they are situated in appropriate locations, they give insight into how much heat is present in the environment at different times in different locations and can be employed to evaluate the thermal quality of the environment that is available for both reptiles. In theory, the models represent the point at which the Tb of a reptile would equilibrate if it behaved as a thermoconformer and made no movement or thermoregulatory adjustments. A reptile, for example, could potentially equilibrate with the models in dappled sun by positioning itself equally in half sun and half shade or with the shade models by remaining in shaded areas. The models situated in open, sunlit areas have additional value in predicting how frequently environmental temperatures exceed physiological threshold temperatures or are within Tb ranges. However, the models have limitations in predicting reptile Tb’s because of differences in heating and cooling rates compared to real reptiles that employ blood shunt mechanisms and posture adjustments to accelerate rates of heating or slow heat loss [4]. The types of models used have been subject to debate, but studies have indicated that model shape, size, and colour have minor effects on model temperatures (<1 °C on mean Tm [29,30,31,32]). We emphasise that our aim is not to determine precise measurements of thermoregulation but to give insight into how the changes in the thermal environment impact the behaviour of the reptiles and their body temperatures as the seasons change.
The present study is a continuation of previous research where we examined thermoregulatory efficiency in T. hermanni during the summer months when temperatures varied during cloudy and sunny weather. The results showed high levels of thermoregulatory efficiency, mostly by selecting appropriate habitat patches and increasing thermoregulatory effort when the weather was less than favorable [23]. The present observations are derived from data that covers a complete seasonal gradient of changing weather conditions. We also gathered information on the lizard P. apodus to enable a more integrative approach into reptile thermal ecology that could potentially allow for comparisons on the extent or absence of the thermal matching theory [33]. The biological similarities between the species are primarily the employment of a passive defence using the bony shell by T. hermanni and dermal armour in P. apodus, which is 70% as armoured as T. hermanni and has a low resistance to fatigue [21,34]. However, there are differences in morphology (see Figure 1) and diet and also a long phylogenetic separation dating from the late Permian (i.e., Lepidosauria and Chelonia) [35]; hence, this should minimize the potential for autocorrelation [36,37]. These similarities and differences present a series of questions of how two species with a long phylogenetic separation including dietary and morphological differences respond to a changing thermal environment? Specifically, we ask the following questions:
1.
What are the environmental temperatures that T. hermanni and P. apodus experience during a complete year in a temperate zone, and how do the changes impact their activity? To answer this question, we use information from null models and relate it to above-ground activity and inactivity.
2.
Do both species show microhabitat matching and, if so, to what extent? To answer this question, we compare monthly changes in microhabitat selection during the full activity season.
3.
Theory predicts that herbivorous reptiles require higher Tb’s than carnivorous forms due to a greater food passage time for herbivores to digest plant material. This predicts that the herbivorous T. hermanni should maintain higher Tb levels than the carnivorous P. apodus [38]. We answer this question by comparing the Tb’s of both species throughout the annual activity period.
4.
How efficient are T. hermanni and P. apodus in regulating Tb’s to within their respective Tset ranges, and how frequently do they exceed or are unable to achieve Tset? This is an important question, because an inability to reach Tset’s may impact the efficiency of physiological process, whilst Tb’s exceeding critical thermal maximum temperatures risk overheating. To answer this question, we used the thermoregulatory efficiency indexes to compare the frequencies of Tb’s within Tsets.
5.
Are there interspecific differences in terms of the efficiency of thermoregulation? This is a key question because of the dietary and major differences in body morphology, specifically in skin surface areas to body mass geometry and lifestyle—predator versus herbivore. To answer this question, we calculated monthly thermoregulatory efficiency E-values for both species to enable direct comparisons.

2. Methods

2.1. Study Area

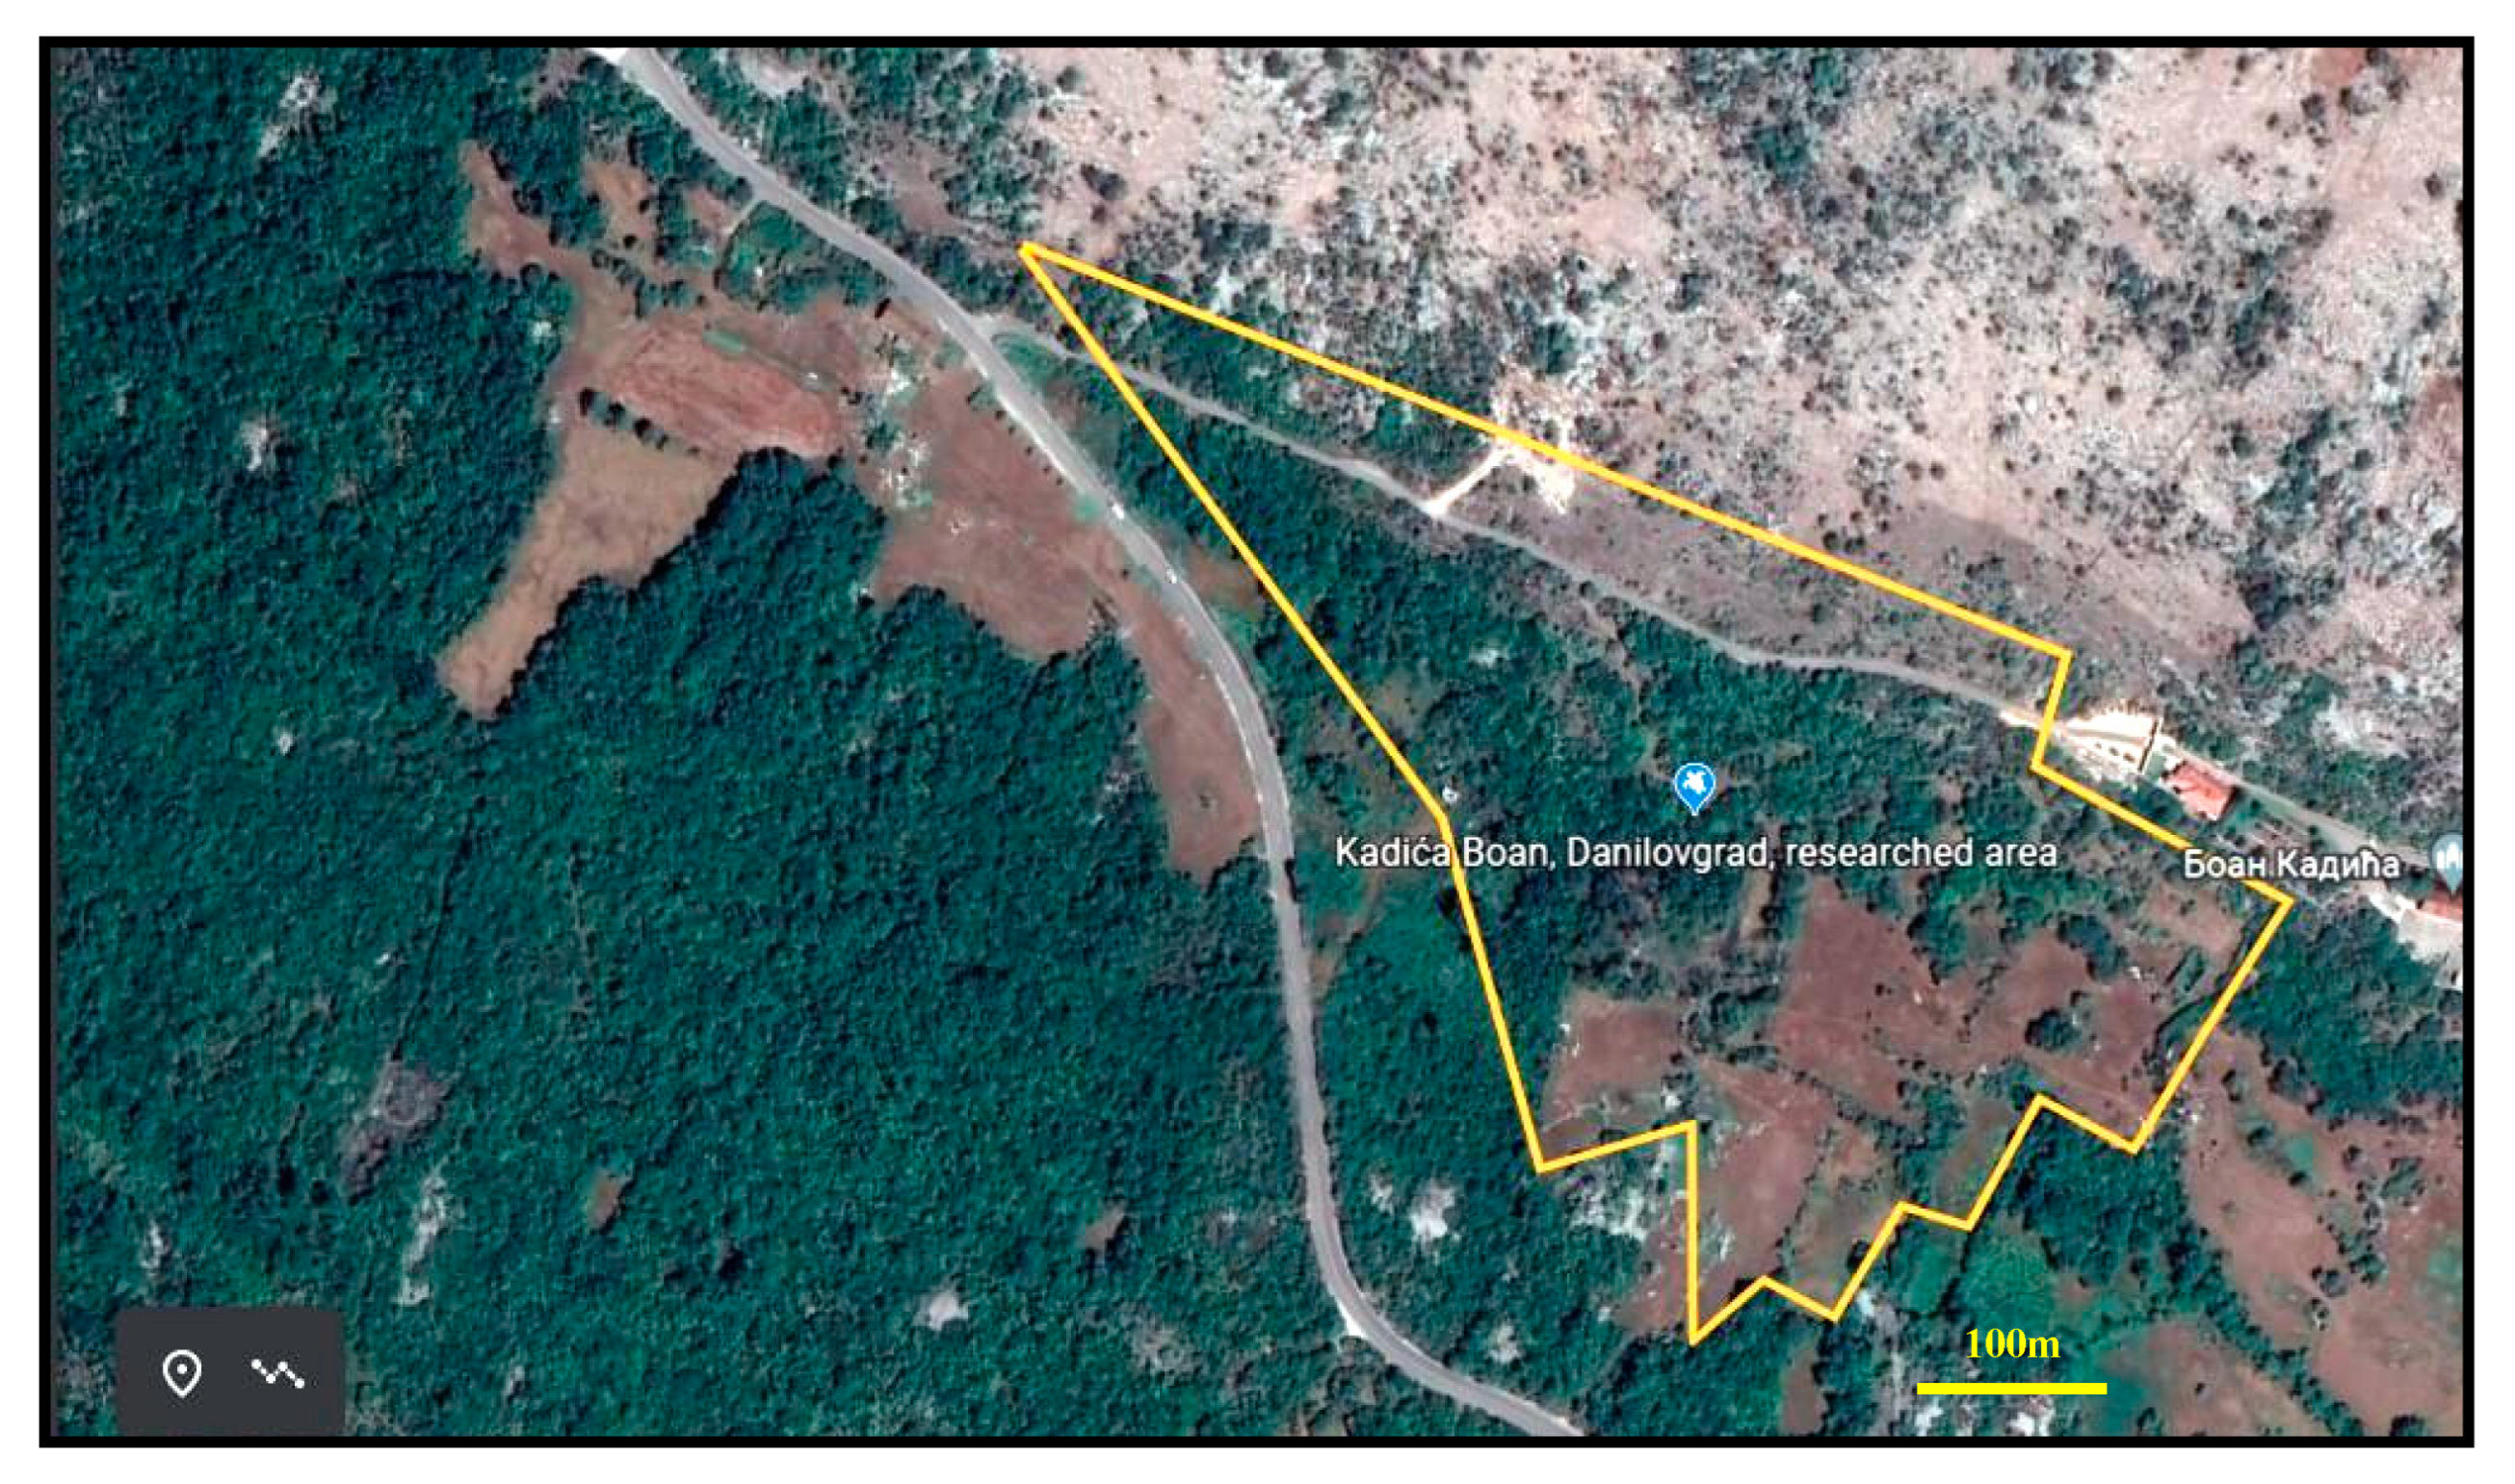
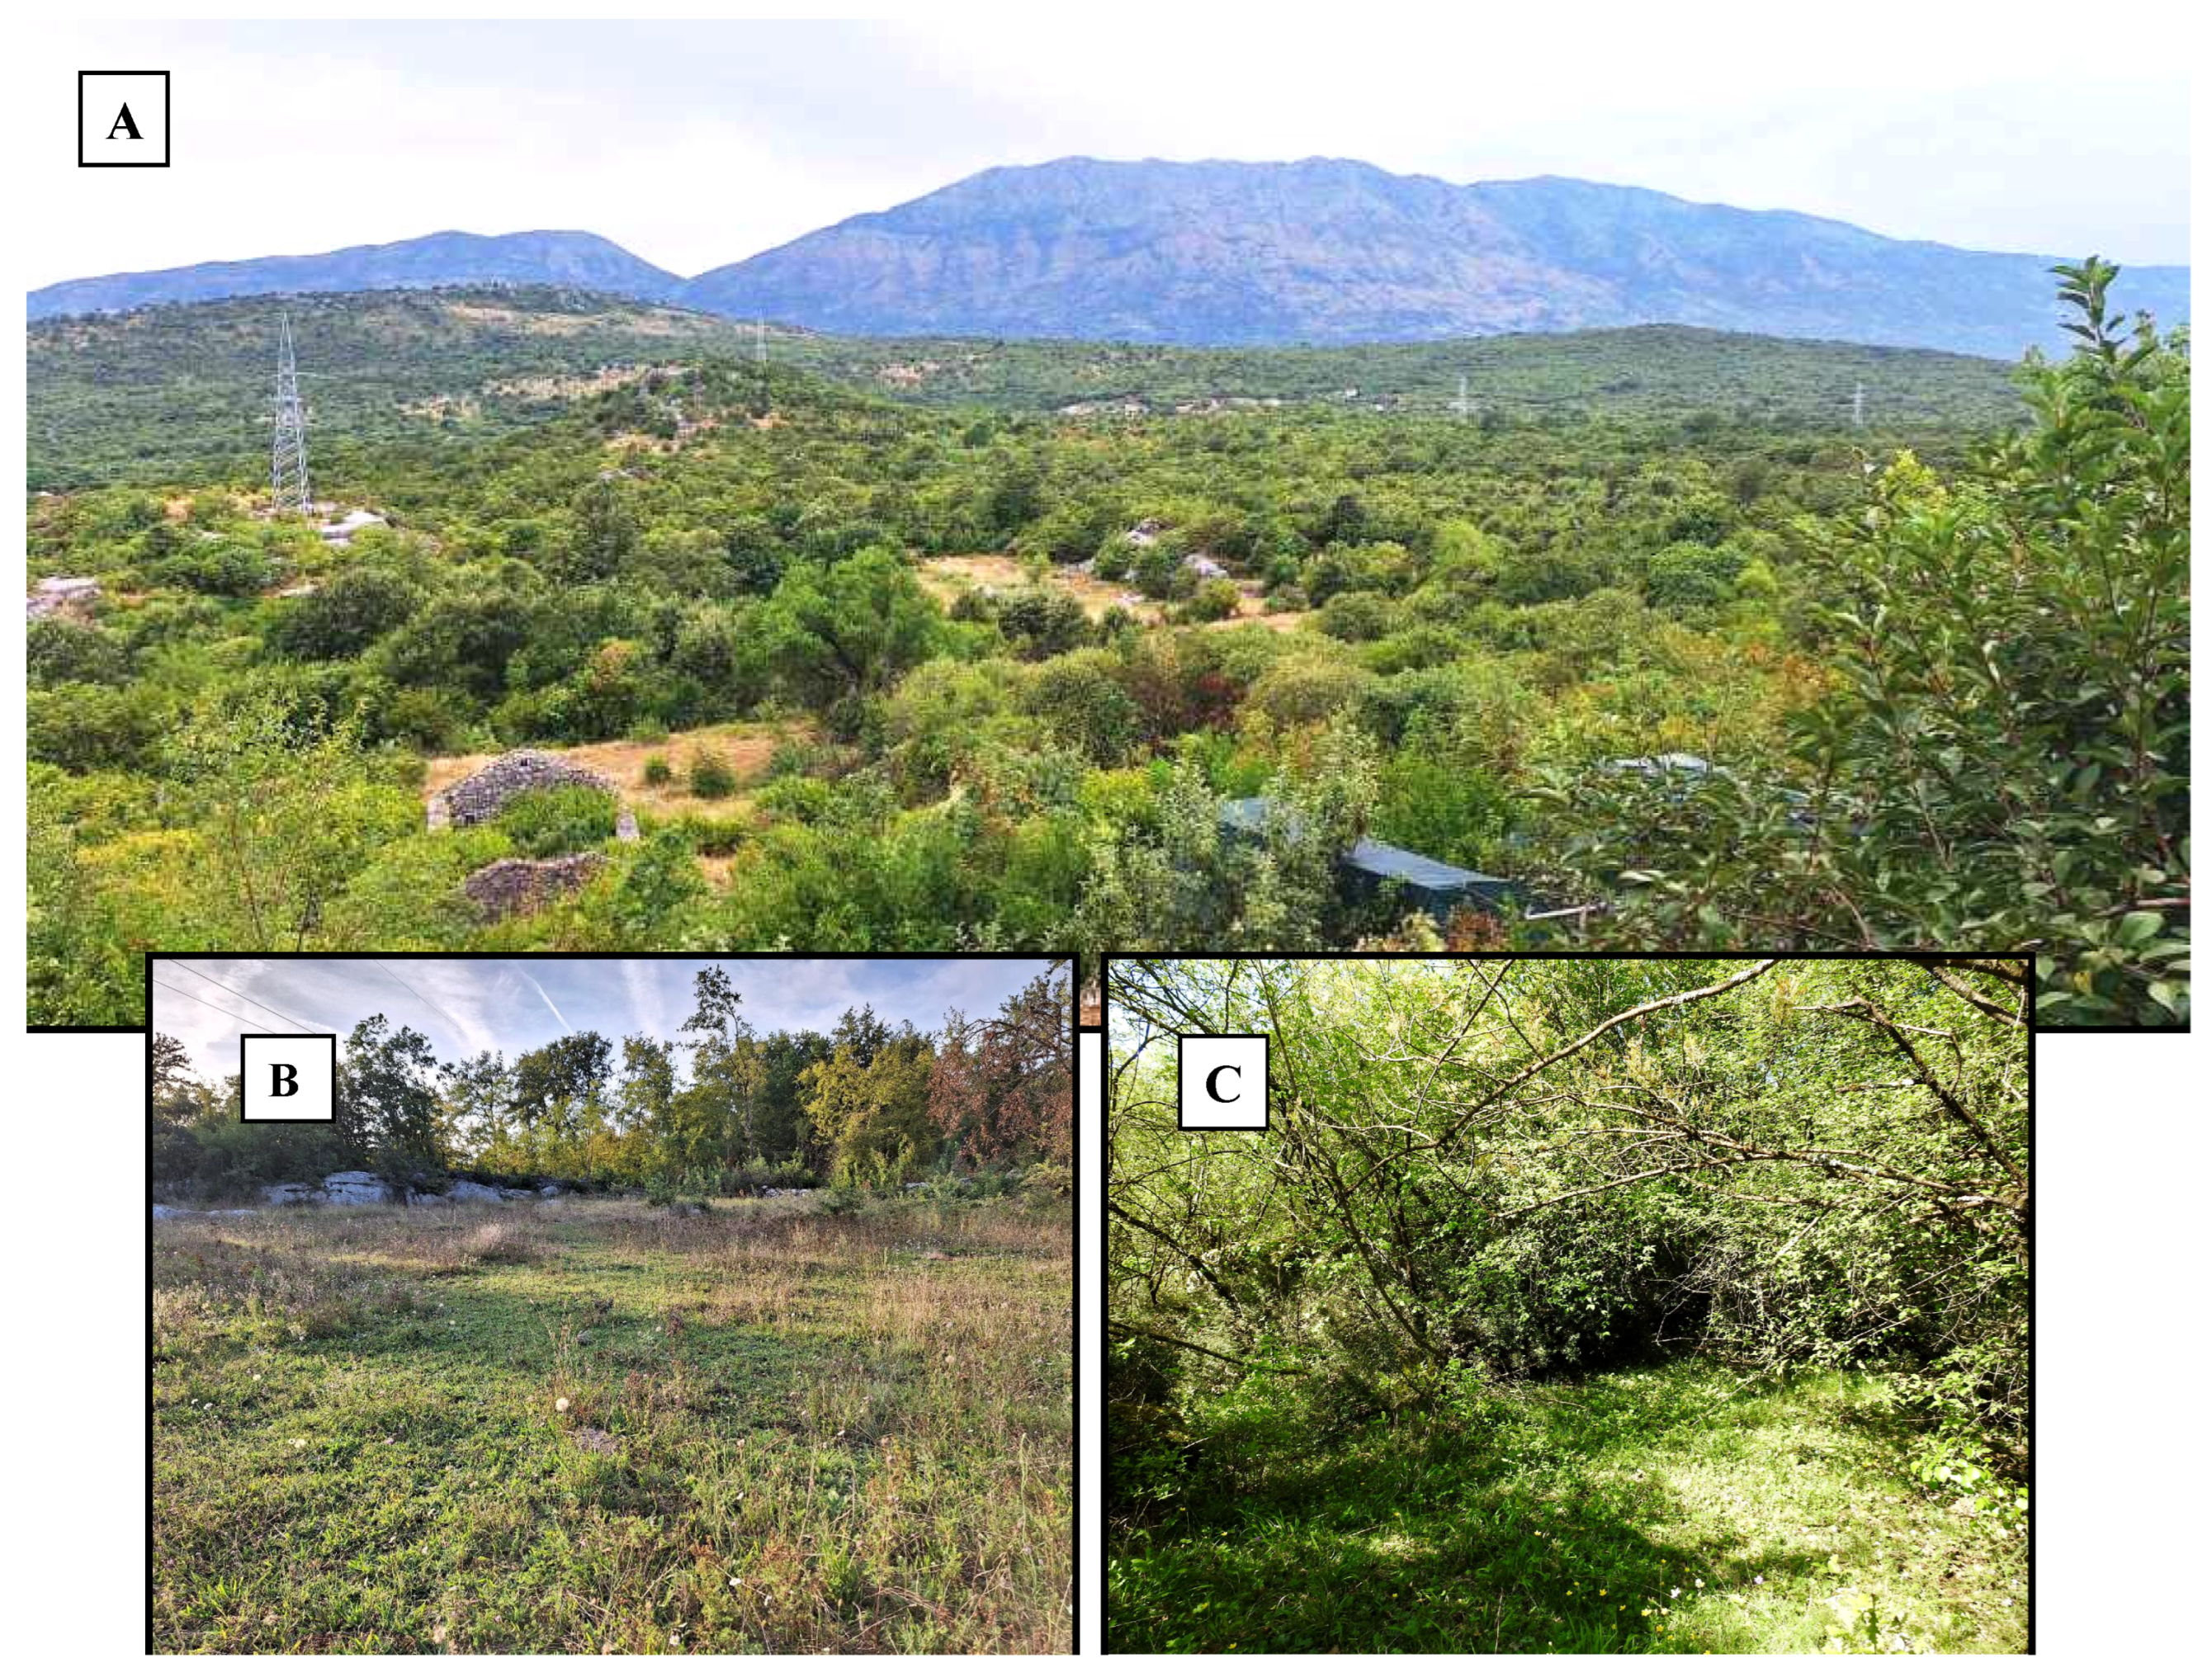
The study site is situated at Kadica boan (Danilovgrad municipality), in central Montenegro, 345,547.00 mE and 4,716,026.00 mN, with an approximate elevation of 132 m above sea level. It is a 5.70 ha area composed of trees and bush of various heights that presented densely shaded areas, open, sunlit patches, and a mosaic of shaded/sunlit patches giving a typical open-type thermophilic deciduous thicket (Figure 3). The area is a mixture of rocky terrain and open clearings with a flora composed of mainly Pistacia terebinthus Punica granatum, Quercus trojana, Q. cerris, Fraxinus ornus, Ruscus acculeatus, Asparagus acutifolia, Carpinus betulus and Cornus masas, the dominant vegetation. Other less common types were Cotinus coggygria, Paliurus spina-christi, and Quercus pubescens. The climate is sub-Mediterranean, with the average annual temperature of 15 °C.
Data was collected between August 2021 and December 2024 from approximately 10:00 h to 17:00 h each daily period. During 2021, 9 days were spent in the field when the reptiles were active. For 2022, this was 9 days during the active season and 1 day when they were inactive (winter dormancy). In 2023, there were 18 field days in the active season and 10 days during the dormant period. For 2024, 23 days were spent in the field, all during the active season. This gives totals of 59 days during the active season and 11 during the dormant period, which equates to a total of 236 field hours.
Surveying covered all areas of the study site, but different routes were used during each daily surveying event. Given that both tortoises and lizards were present in all areas of the study site, and that these areas were regularly sampled, we assumed this satisfied the requirement for random encounters. All captured individuals of both species were marked for identification. This avoids measuring the same individual multiple times each day [23]. Sex determination in T. hermanni was by the concave plastron and longer tail in males in contrast to a flat plastron and short tail in females. Sexing P. apodus was more difficult and may be especially difficult in some populations of this species [39], and although some males ejected the hemipenes when caught, due to the limited accuracy of sexing for each lizard, we decided to pool the data from both sexes for analysis. When either a T. hermanni or P. apodus was located, measurements were taken of Tb at the cloaca as quickly as possible to avoid any handling effects on the Tb of the reptiles. However, given the size of our study species, we expected any heat transfer to have been minimal. Following that, we then recorded corresponding model temperatures using a digital thermometer (Model TFA Dostmann, Wertheim-Reicholzheim, Germany) with an approximate error of 0.5 °C. Type of microhabitat patch (full sun, full shade, and mosaic of sunny and shaded patches) where each individual was found was recorded.

2.2. Null Models

Eight metal cylinders were used consisting of two sets of different dimensions. Five were closer to T. hermanni in shape with lengths of 130 mm and a diameter of 57 mm, which, when filled, held 320 mL of water. Three cylinders of an elongated shape that approximated P. apodus had lengths of 400 mm and a diameter of 38 mm and held 460 mL of water. A small opening was present at the top of each cylinder into which the thermometer was inserted (Figure 4). The models were dispersed randomly into different areas of the respective patch types [5] that broadly represented the three different thermal environments of full shade, mosaic, or dappled sunlight patches and open, sunny locations. The models give approximate estimates of the temperatures that reptiles would encounter if they randomly moved through the habitat patches with different temperatures. Models situated in shaded microhabitats represented the coolest areas, and those in fully sunlit areas were the hottest areas, with models in partially sunlit areas offering the potential for both heating and cooling for a reptile moving in these patches (Figure 3C). Changes in the position of the sun required the cylinders to be moved during sampling, especially those situated in sunny or sunlit/shaded patches but were always moved to appropriate microhabitat types. Temperatures were measured approximately every 10 min or when a tortoise or lizard was located. The models showed a good general agreement in size of an average adult glass lizard or tortoise, but given the range of sizes of both species, they cannot accurately reproduce the size and shape of all individuals; hence, our approach was to estimate the approximate temperatures that either species would encounter if they moved through the different patches.

2.3. Statistical Analysis

A z-proportions test was used to calculate interspecific differences in patch use throughout the full active season. At a finer level, we constructed an intrinsic theoretical null model of monthly patch use throughout the active year by employing the patch use of T. hermanni as the expected probability against P. apodus patch use as the observed frequency. The test used was a two-sided Kolmogorov–Smirnov Goodness of Fit test. This test is distribution-free and based on a comparison of the absolute values of the observed distribution with the hypothetical distribution and calculated from the following:
O(m1)Pa = E(m1)Th; O(m2)Pa = E(m2)Th………O(m8)Pa = E(m8)Th
where O represents the observed distribution (P. apodus) and E the intrinsic null distribution (T. hermanni), with months (m) and attached sub-numerics representing the months from March to October (n = 8). For significance at P ≤ 0.05, the Dmax values must exceed the critical value (CF).
The Kolmogorov–Smirnov Goodness of Fit test was also used to evaluate departures from the equality of monthly Tb above or below Tset with a hypothesis that monthly frequencies of Tb’s above or below Tset should be in statistical agreement. The expected probability Ex is calculated from Ex = Σn/(Nmonth), where n is the total sample size for each month and N is the number of months.
Monthly differences between male and female T. hermanni Tb’s were analyzed using the Kruskal–Wallis H-test. This ranks and then combines the data sets to evaluate the null hypothesis that any randomly selected number from each of the months will have an equal probability of being the highest ranked value. The null hypothesis is
Ho: Tbm1 = Tbm2 = Tbm3……… Tbm8 = Tbm8
against
H1:Tbm1 ≠ Tbm2 ≠ Tbm3……… Tbm8 ≠ Tbm8
where m represents the months and the sub-numeric of the months from April (sub1) through to October (sub8).
To test for monthly variations in body temperatures, we used a Leven’s test for mean absolute deviations (MAD) that uses ANOVA to compare MAD from the centre of monthly median values. The F-statistic gives both the ratio of the group variances and the variance within each data set. The null hypothesis is
Ho: σ21 = σ22 = σ23……… σ28 = σ28
against
H1: σ21 ≠ σ22 ≠ σ23………. σ28 ≠ σ28
where σ21 to σ28 are monthly variances from April to October. Post Hoc tests were performed by a Tukey HSD. Monthly differences between male and female Tb’s over the active season were analysed using a ranked two sample Mann–Whitney U-tests set at α = 0.05.
Due to size differences and body surface areas between male and female tortoises and, thus, their potential differences in their heating rates, we randomly selected 5 individual males (body masses from 544 to 818 gm, mean = 687 ± 111.9) and 5 females in the field with body masses ranging from 1155 to 1421 g, mean = 1222.8 ± 161.3. The tortoises were placed in an outdoor enclosure with dimensions of 610 cm × 285 cm. Measurements of their heating rates were carried out between 0735 and 1435 hrs CET during sunny weather in early September 2024 between 02 09 23 and 17 09 23. Regression analysis was then applied to the results using male and female Tb’s as the dependent variables and time as the independent variable, giving
Tb(change) = m ± ε * time + b
where m is the regression coefficient, b is the y-intercept, and ε is the white noise error. The m coefficients for males and females were then compared using t-tests at n-4 d.f. [40]. We predicted that, given the differences in the skin surface area to body mass ratios between males and females, the smaller males would be more likely to attain higher Tb’s, especially during the cooler spring or autumn months [20].
Thermoregulatory efficiency tests (E) [41] were applied for both months and across the active season. This gave insight into how efficient the reptiles were at thermoregulating within each of their Tset ranges during the active season from the time of emergence from winter dormancy through the summer and cooler autumn months approaching winter dormancy. The distributions of Tb and Tm are often skewed [42]; thus, we analyzed decimal proportions in the tests. The variables were the temperatures of null models (Tm), tortoise or lizard body temperatures in the field (Tb), and set point body temperatures (Tset) determined from the Tb’s recorded in laboratory heat gradients, where high and low temperatures were available for both species [34,43,44]. The Tb’s selected in the risk-free thermal environment of laboratory thermal gradients are assumed to be the preferred Tbs. Theoretically, if E has a value of 1, perfect thermoregulatory efficiency has been achieved; when E = 0 indicates no thermoregulatory efficiency. The equation has the form
E = 1 − ((P)Tm = Tset)/((P)Tb = Tset)
where thermoregulatory efficiency E was derived from the proportion (P) of monthly Tm’s that lie within Tset ((P)Tm = Tset), divided by the proportion of monthly Tb’s that lie within Tset ((P) Tb = Tset); Tset is the Tb ranges from 29 to 32 °C selected by T. hermanni and from 24 to 35 °C selected by P. apodus in laboratory heat gradients. For inclusion of a Tb within Tset, we allowed for a measurement error of ±0.2 °C. During the winter months when the reptiles were below ground and inactive, E is undefined since the Tset is unattainable [5]. The differences between the monthly means and variances of the E-values were made using the Levene’s test for the equality of variances after testing for normality using Anderson Darling a2.
All statistical testing was carried out on Minitab 19 and various websites (e.g., https://www.statskingdom.com/230var_levenes.html accessed several times between 4 July 2023 and 11 December 2023).

3. Results

3.1. General Considerations

In total, 353 tortoise Tb’s were measured, of which 163 were from males and 190 from females. Females had a significantly greater body mass (mean = 1019.2 ± 368.7) than males (mean = 625.6 ± 215.2), F = 71.86, and P < 0.001. The earliest recorded tortoises were two females during March, with Tbs of 27.6 and 31 °C. Monthly counts were April (18 F, 11 M), May (F17, 12 M), June (6 M, 32 F), July (25 M, 12 F), August (56 M, 77 F), September (37 M, 27 F), and October (16 M, 5 F). There were no sightings of either species during January or February or during November and December. In total, 65 P. apodus were detected, all of which were adults during March (4), April (24), May (13), June (6), September (7), and October (11).

3.2. The Thermal Environment

Figure 5A,B shows monthly distributions of Tm’s. In total, we collected 2808 measurements of model temperatures of the T. hermanni shape (Figure 5A) and 1188 of the P. apodus shape (Figure 5B). This shows that the highest Tm’s were recorded during July, August, and September and the lowest during November, December, January, and February when both species were dormant. Monthly comparisons showed significant differences during the months when the reptiles were active in the field, determined from a Welch’s ANOVA with the post hoc Tukey; the April mean was significantly lower (25.04 ± 8.7 °C, n = 250) and July was significantly higher (mean =36.4 ± 7.8 °C, n = 370). The data shows the Tm’s during January/February and November/December were almost all lower than the Tset’s of both species, particularly T. hermanni, and illustrate to a large degree why both species were inactive during these months. The monthly comparison of model types showed the monthly medians of the long models were mostly higher, but the differences were only significant during June (medians 35.3 versus 28.5 °C, w = 14,105.5, and P = 0.0008) and August (32.3 versus 27.5 °C, w = 39,753.5, and P < 0.00001) (Figure 5B). These results answer Question 1.

3.3. Microhabitat Selection

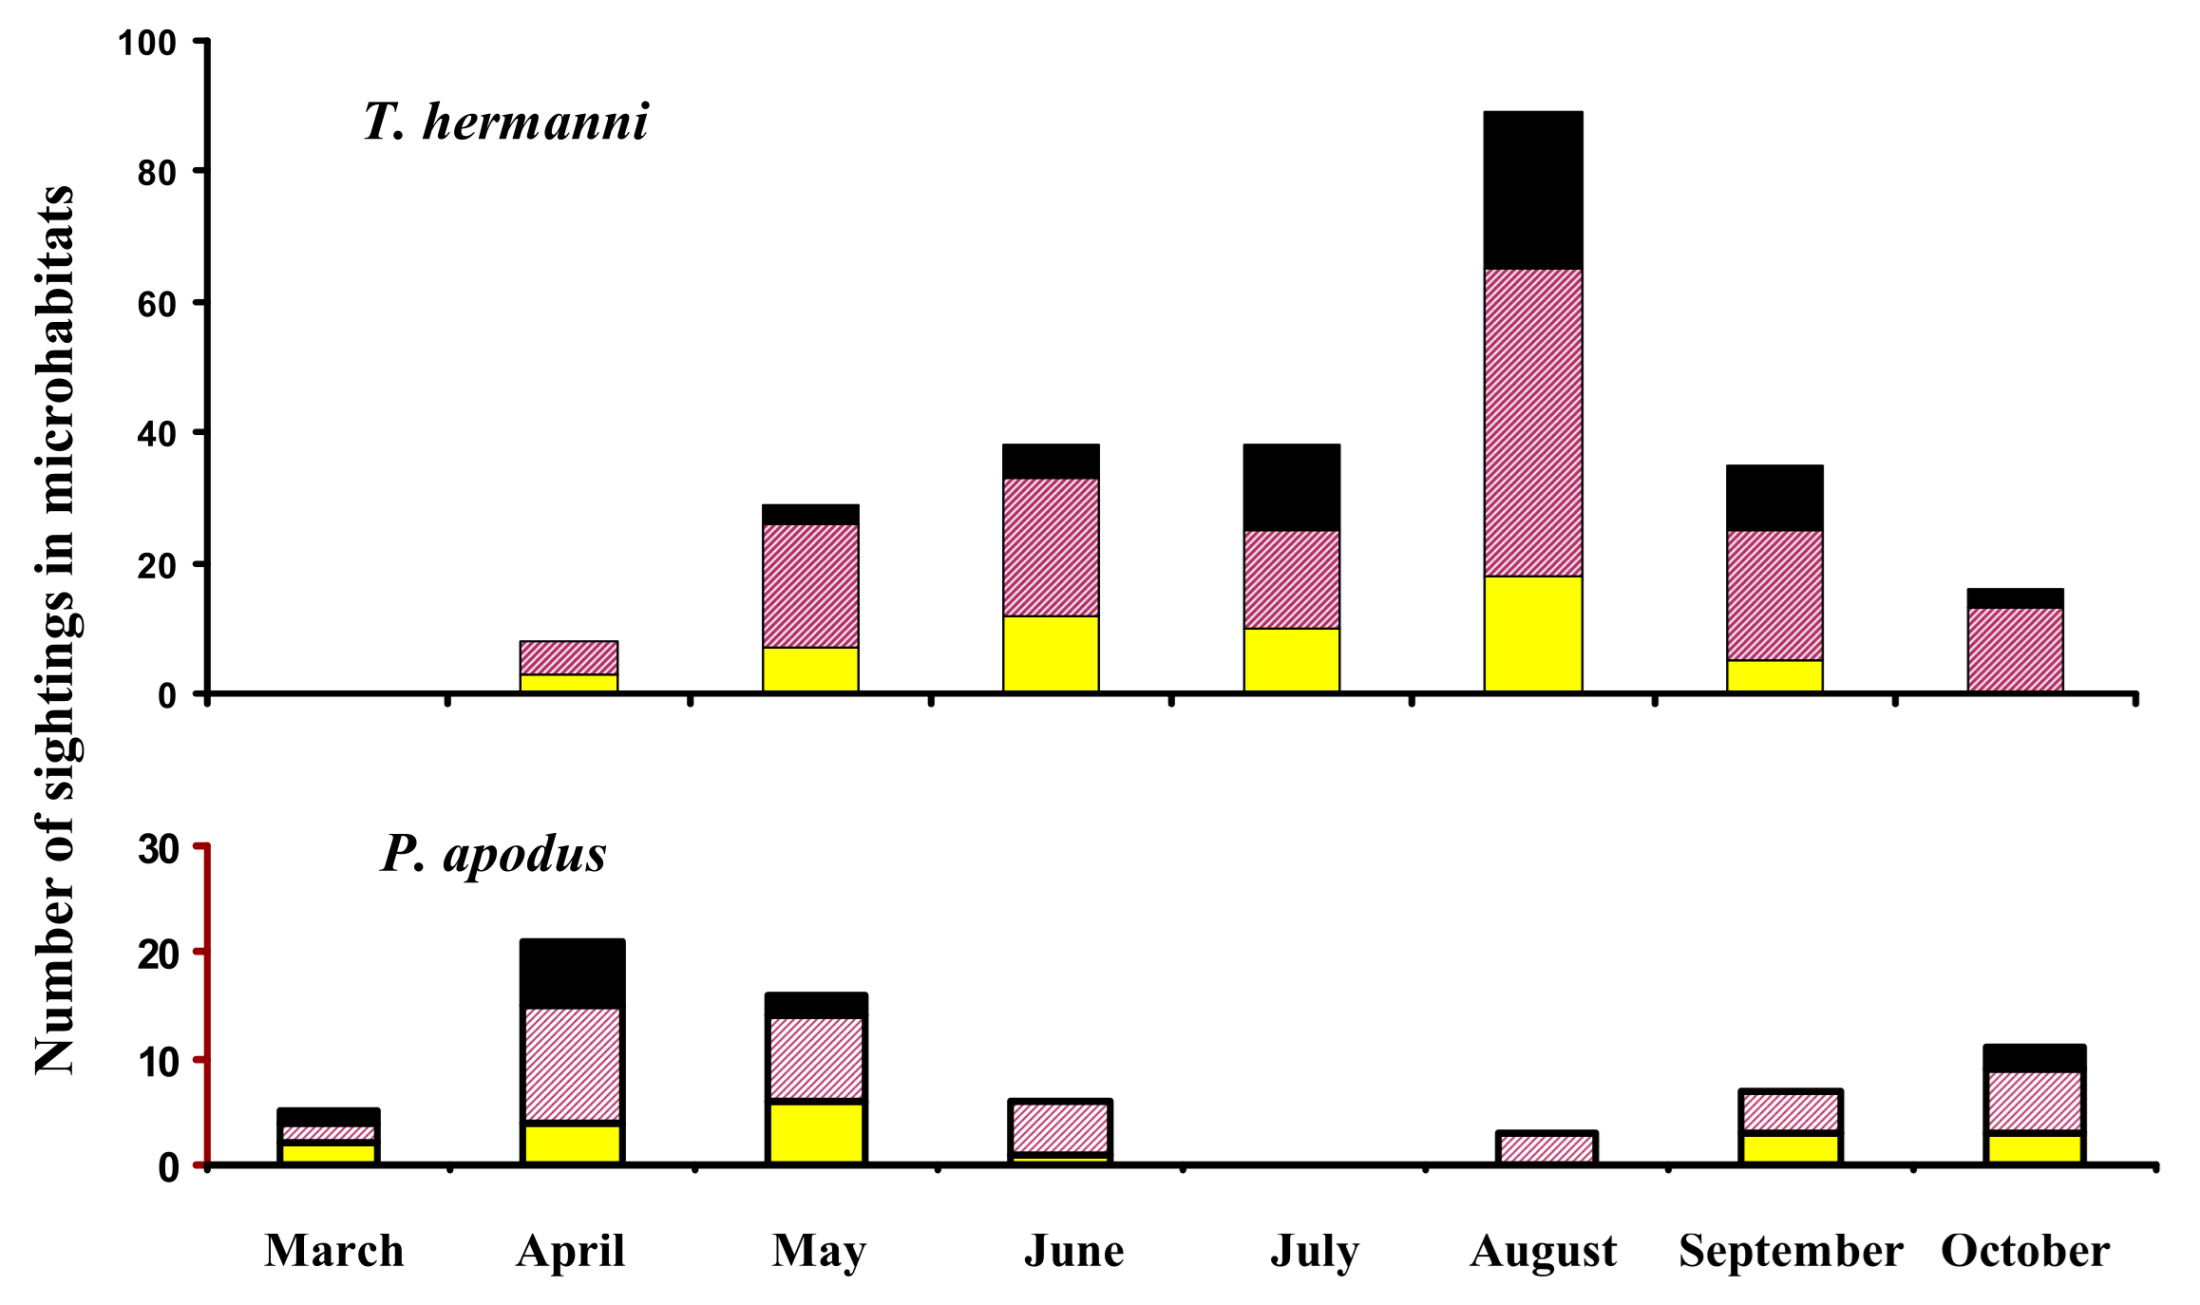
From March to October, both species showed a strong selection for a mosaic of sunlit and shaded patches. For T. hermanni this represented 55.3% of total observations (n = 353) and for 56.5% of total observations (n = 67). The time spent in open, sunlit patches was greater in P. apodus at 27.5% against 21.8% in T. hermanni. Greater amounts of time were spent in fully shaded patches (22.9%) compared to P. apodus (15.9%). The Kolmogorov Goodness of Fit tests indicated P. opodus spent significantly greater amounts of time in fully sunlit patches during April and May compared to T. hermanni (3.9 versus 2.5 times greater) and also during September and October (1.74 and 3 times greater respectively); Dmax = 0.45, P < 0.01; and CF = 0.36. The time spent in dappled sunlit patches was, in general, greater in P. apodus throughout the active year compared to T. hermanni, especially during May, June, and July (Dmax = 0.51, P < 0.01; CF = 0.26). These results, shown graphically in Figure 6, answer Question 2, indicating differences in microhabitat selection.

3.4. Heating Rates of Adult Male and Female T. hermanni

The expected slower rates of heat gain by female tortoises due to their greater size was confirmed with the regression coefficients in males m = 0.017 ± 0.0009 and females m = 0.012 ± 0.0004, which were significantly different (t = 5.07, P < 0.0001). The mean difference in the Tb increase per minute in males was 0.014 ± 0.007 compared to females 0.010 ± 0.002. Only one of the five females (max = 28.4 °C) reached the set point range during the test compared to all five males (28.3–35.5 °C). These results support our decision to detach the data for males and females in the analysis. This result, along with the monthly Tb data, indicates that, despite slower female heating rates, they were still able to attain similar monthly Tb’s during the active year.

3.5. Monthly Body Temperatures of T. hermanni

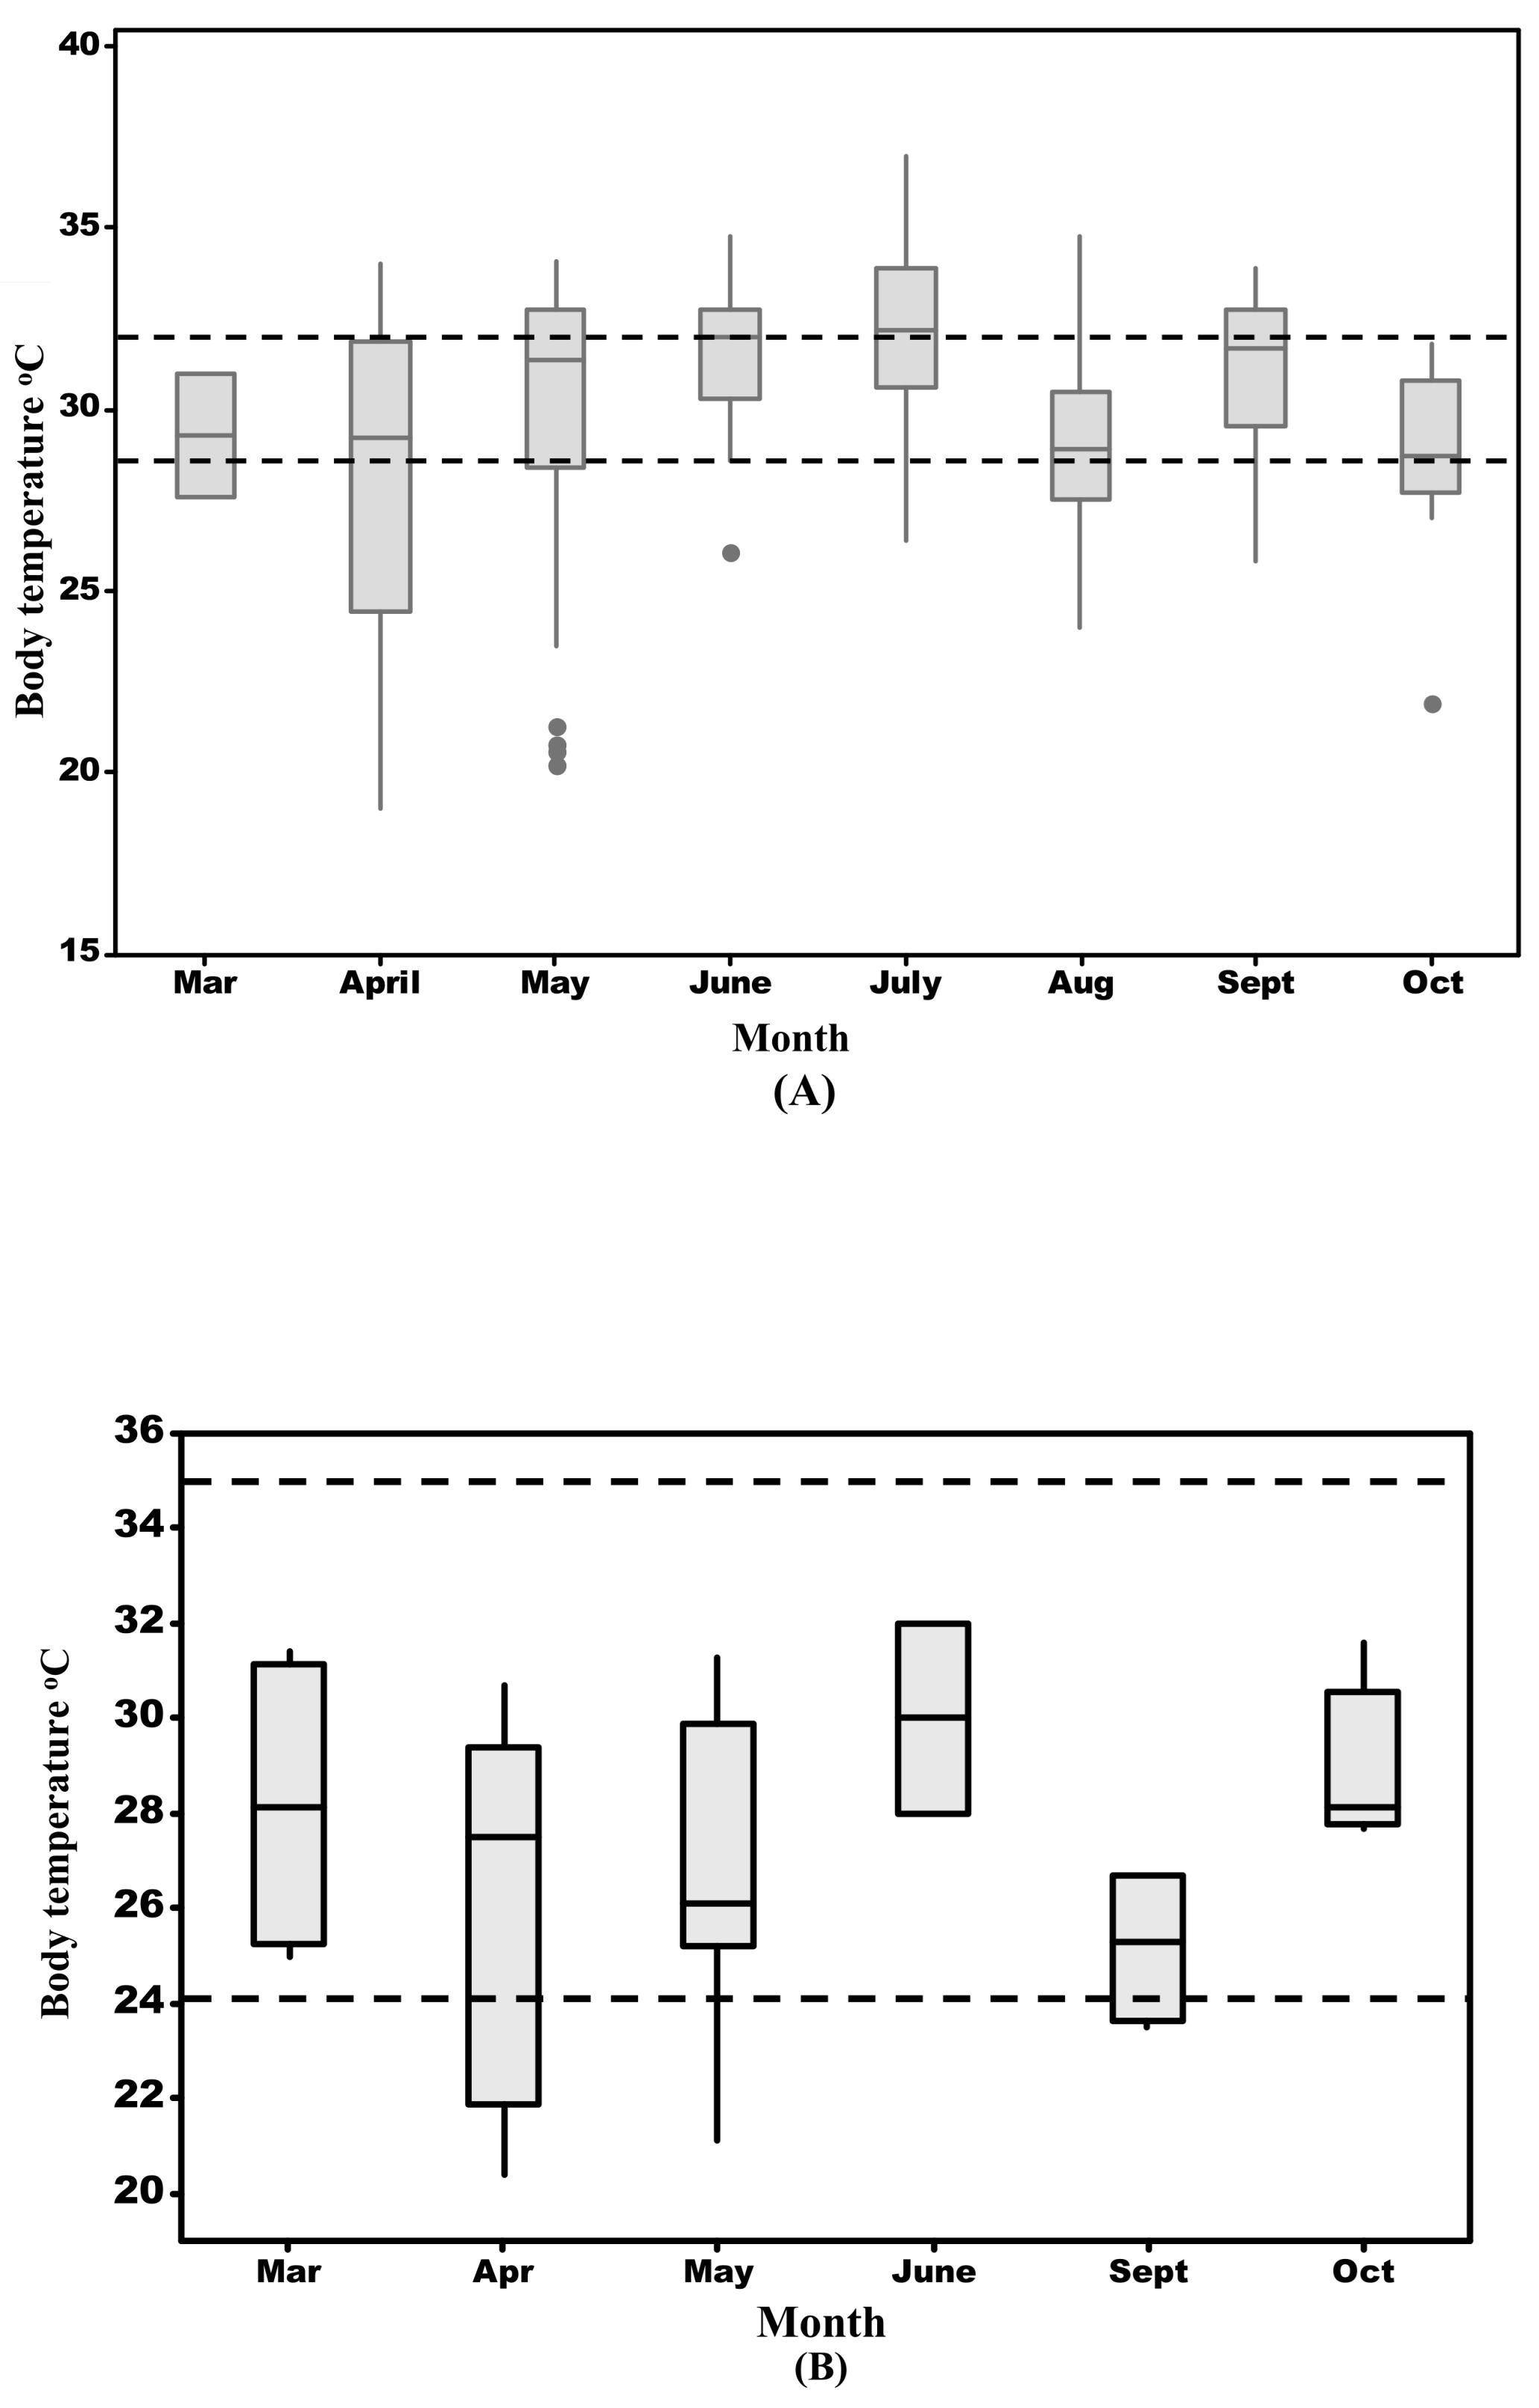
Males: The Kruskal–Wallis H-test indicated significant differences in monthly male Tb’s; χ2 (df 6) = 30.3, P < 0.001. The post hoc Dunn’s test with Bonferroni correction showed male body temperatures during July were significantly higher than during August and September. The Levene’s test also showed significant differences in monthly male Tb variances, F(6,135) = 2.88, P = 0.01, with a Tukey HSD post hoc indicating the variance differences were between April and June, April and August, and between April and September (n = 141 for males and females respectively). Figure 7A shows box plots of monthly Tb’s with the horizontal lines representing the maximum and minimums for Tset.
Females: Monthly differences in the mean Tbs of females were also identified, with χ2(d.f.6) = 36.28, P < 0.001, and n = 187. The post hoc test indicated the differences were between April, which was lower than June and August. July Tb’s were significantly higher than during August. The Levene’s test showed differences in monthly female Tb variances, F(6,181) = 3.72, P = 0.004 with the post hoc test indicating the differences were between April and May compared to June. Monthly comparisons of male and female mean Tb’s using a non-parametric Mann-Whitney U-test indicated no significant difference between monthly medians; W = 55.5, P = 0.74 or between monthly Tb variances; W = 51.5, P = 0.95. Full results are shown in Table 1.

3.6. Monthly Body Temperatures of P. apodus

The distribution of P. apodus monthly Tb’s are shown in Figure 7B and Table 1. There was a good agreement in Tb’s from March to June and from September and October (Kruskal Wallace χ2 (5) 11.06, P = 0.06) with variances in the monthly Tb also in good agreement (F(5, 36) = 1.06, P = 0.18).

3.7. Species Comparisons

To compare the monthly Tb’s of both species, the data for T. hermanni was pooled and compared with corresponding available monthly P. apodus Tb’s using a Mann–Whitney U-test. This showed that T. hermanni had significantly higher Tbs during May (W = 675.5) and September (W = 1562), both P < 0.01, with April, June, and October not significantly different. However, monthly Tb variances between species were in good agreement (F = 1.14, P = 0.86). These results answer Question 3, indicting that although all comparable months showed T. hermanni maintained higher mean Tbs, the differences were only significant during certain months.

3.8. Body Temperatures: Skewness

To improve sample sizes for skewness tests (S) [42]. The Tb’s of both species were examined for skewness within seasons and, in T. hermanni, for males and females separately. The results showed negative skewness for T. hermanni during spring and summer, with S-values from −0.16 to −0.87 in males and from −0.8 to –0.87 in females, respectively. Autumn showed S-values of −0.83 in females and −1.4 in males. Due to the low numbers of P. apodus in summer months, we could only examine spring and autumn. This gave for spring S-values of −0.7 and autumn −0.3. Hence, both species showed left skewed Tb distributions during all times of the active year. The skewness values for T. hermanni in autumn (longer negative tail) likely reflect slower rates of heating during the cooler period.

3.9. Tb’s and the Set Point Range

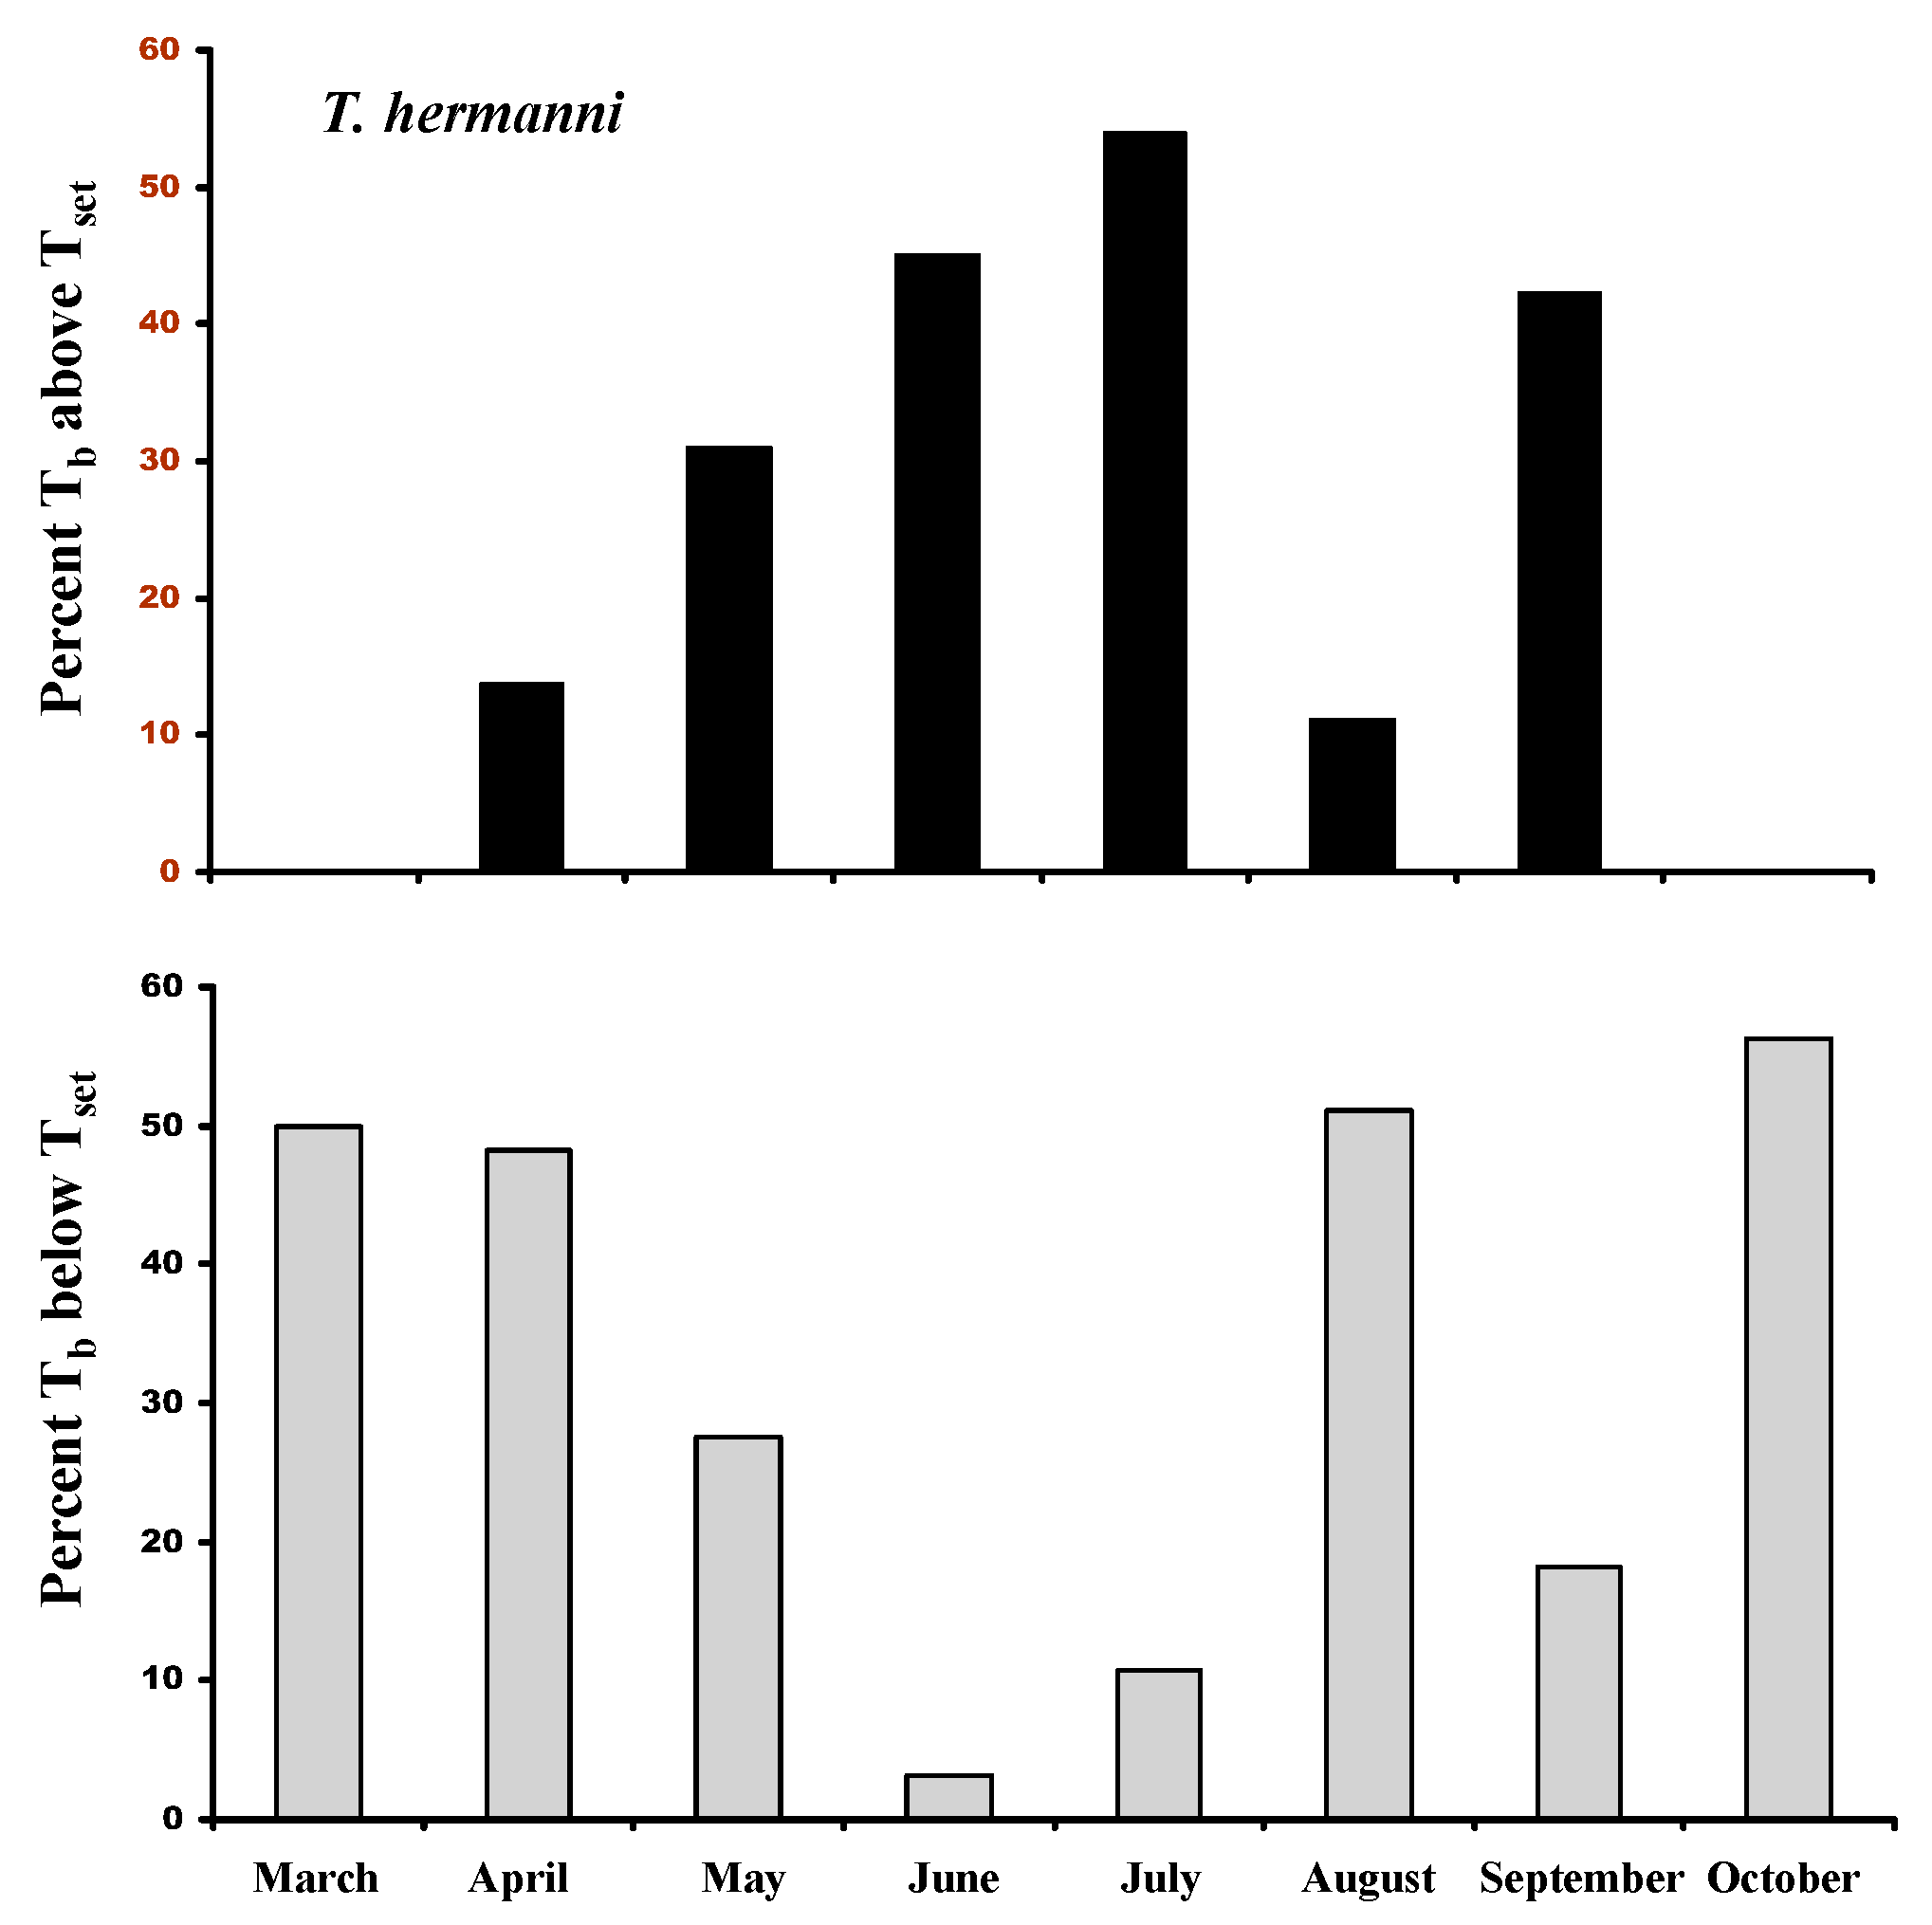
Between March and October, 63 of 253 (24.9%) T. hermanni Tb’s were above Tset. The Kolmogorov–Smirnov test indicated Tb’s above and below Tset departed significantly from the monthly equality, Dmax = 0.14, P = 0.01, with May, July, and September identified as months when Tbs were most frequently above the Tset range. These were 1.9, 2.17, and 1.69 times greater than the expected frequency, respectively. Tb’s below Tset were also significantly different, Dmax = 0.38, P = 0.01, with the critical months being August at 2.33 times and October 2.77 times lower than expected. This indicates that tortoises responded to changing thermal conditions during the active year by allowing Tbs to exceed the Tset, for example, during the hottest months (Figure 7A). In contrast, during cooler weather, the tortoises were less able to attain Tset (Figure 8). During the study period, no P. apodus Tb’s exceeded the maximum Tset. This contrasts the findings for T. hermanni, although the more limited monthly data for P. apodus renders direct comparisons invalid. This result shows major differences between the two species in relation to exceeding the Tset and answers Question 4.

3.10. Monthly Thermoregulatory Efficiency: T. hermanni

The tests for monthly thermoregulatory efficiency are shown in Table 2. The results indicate that the highest levels of efficiency were during April, May, September, and October. The lowest values were found during May and August in females, which gave E-values of 0.44 and 0.45. Over the total monthly activity periods the mean monthly E-values ranged from 0.36–0.91 in males (mean = 0.67 ± 0.16) and 0.44–0.94 in females (grand mean = 0.64 ± 0.20), with no significant difference between the E-value means, F = 0.56, P = 0.25, or their variances, Levene’s test = 0.04, and P = 0.85.

3.11. Monthly Thermoregulatory Efficiency: P. apodus

During most of the active year, P. apodus’s thermoregulatory efficiency was high, albeit at slightly lower levels than found for T. hermanni, with monthly mean E-values of 0.56 ± 0.20. Figure 7B shows high matching of the central distribution of Tbs with Tset, which is good supporting evidence for the efficiency results. A low priority power for these data (0.163) renders interspecific monthly comparisons invalid. Inactivity during the colder winter months (January–March and November–December) in both species was likely due to an inability to achieve Tset’s, and, therefore, E is undefined. These results showing general high E-values for the active months, answering Question 5.

4. Discussion

4.1. General Results

The present study, the most comprehensive to date on the thermal ecology of T. hermanni and P. apodus in the field, has given several key outcomes. Important was the value of Tm’s as a research tool to quantify the extent of the changing thermal environment over the activity periods, especially when temperatures were either very high or low. The method has previously been used and widely discussed [28,30,31]. Important also was the data in Figure 5A,B, showing that during the colder months the second and third quartiles for Tm, fell below Tset and, hence, were a key factor in initiating inactivity. This was not unexpected, since abandoning activity during the cold months when thermal energy is minimal or absent and limited due to the absence of food is an adaptive behaviour due to the constraints of inclement weather [45]. The comparison of model types showed that the long models (Figure 4), as expected, generally reached higher temperatures during the annual period but were significantly different only during two of the mid-summer months (June and August) (Figure 5C). These are months with low rainfall and habitat drying and correspond with low sightings of P. apodus, probably due to the increasing food scarcity of prey species. This has been recorded in other P. apodus populations, for example, in Bulgaria [15].
Interspecific differences in phylogeny, physiology, and morphology including Tset, Tb, and lifestyle—predator versus herbivore—might have predicted major differences in the thermal ecology between the two subject species [37,46]. However, in general, both species responded to the changing thermal conditions in very similar ways including showing high levels of thermoregulatory efficiency and, in this sense, thermal matching. Differences in diet and phylogeny probably explain differences in selected Tb’s for activity, but generally, our data show support for the notion of the importance of the thermal environment in driving reptile thermoregulatory behaviour. A notable difference was the frequency of T. hermanni Tb’s above Tset (Question 2; Figure 8) which raises the question of Tset as a real-world target during a complete active year and the possibility that the Tset may change according to environmental conditions, resources, or physiological state. This has been found in other reptiles [47,48], leading to a hypothesis of multiple physiological optimum Tb’s and Tsets, as already shown in lizards driven by climatic changes [49]. Adjusting Tset would be adaptive in facilitating more extensive movement across the landscape, which is important given that T. hermanni has strong preferences for highly nutritional plants [13]. Exceeding the Tset is known from previous studies, for example, in small insectivorous lizards and attributed to the conflict between time limitations and the need to complete foraging activities [50].

4.2. Interspecific Dietary Differences on Thermal Ecology

The predicted higher Tb’s of T. hermanni compared to P. apodus supports the hypothesis that herbivorous reptiles will maintain higher Tbs than sympatric carnivorous species (Question 3). The results included Tb’s falling mostly within the Tset and tight Tb variances, especially in the larger female T. hermanni, despite slower heating rates compared to smaller males, as shown in the comparative heating rates tests. Elevated Tb’s in reptilian herbivores increase food passage time in the gut [51,52], which is important for sustaining gut microsymbionts for digesting plant cell walls [53] including impaction, which is associated with those species that consume toxic compounds, as found in T. hermanni [13]. Of particular interest was T. hermanni lowering Tb’s, during August when heat resources were available but food was scarce. This concurs with the behaviour of many reptiles, including chelonians [47], that reduce Tb’s when food is scarce. Operating at preferred Tb’s when stomachs are empty may be maladaptive [1]. Food availability and quality can also influence seasonal differences in preferred or selected body temperatures in reptiles, e.g., [4,5,51].

4.3. Thermoregulatory Efficiency

The low E-values found during July and August in female T. hermanni are likely due to movement into microhabitats that mostly consist of sunlit/shaded patches or full shade. This suggests a period of thermoconforming in a drying habitat. However, if Tm’s in microhabitats are close to the Tset, this would impact E-values, since the efficiency equation is based on the intrinsic relationship between Tm, Tb, and Tset. For example, when entering certain thermal patches, if Tb = Tm this will produce a lower E-value irrespective of the Tset. The midsummer months were critical periods for both species, since Tm’s approached or exceeded their lethal maximums (Question 1; Figure 5A,B). This contrasted with the high Tb variances observed during spring (April, May; Figure 5A,B), the main reproductive period, which is probably driven by increased movement through habitat patches searching for mates and also high-energy food plants (T. hermanni [13] and invertebrates (P. apodus [14])) that are crucial resources for reptiles during this time. Precise thermoregulation during spring may have a secondary importance, since movement often took place in sunlit/shaded patches where the distances between patches were mainly short (Question 4; Figure 3C). Wide Tb variances can also reflect wide fluctuating Tm’s and have been found in European lacertid lizards during spring and attributed to the impact of the thermal environment [54], including the influence of reproductive status on Tb levels [55]. However, since both species scored relatively high values in the E-tests and low Tb variances, this supports the notion that high quality thermal environments enable reptiles to thermoregulate more precisely. In larger species, including P. apodus and T. hermanni, patch use and size are likely key factors in attaining thermoregulatory precision [56]. In contrast, the cooler months become high cost since they reduce thermal opportunities and impact the metabolic costs for activity. Of interest in this respect is that chelonians may be able to counter these problems with metabolisms that are less sensitive to operating at low Tb’s compared to other reptiles. For example, in some chelonians Q10 values between 16 and 32 °C (Q10 = 1.92 ± 0·1; [57]) were lower than the Q10 ranges reported for other reptiles (Q10’s ≈ 2 to 3; [58]). This indicates that as Tb declines the subsequent metabolic rate decline is lower in chelonians, and, thus, the impact on the rate of digestion is less. Such a response would be adaptive in a field environment and illustrates one of the findings in the present study, which is that what a reptile may do in a laboratory situation does not necessarily reflect their behaviour in a natural environment.

4.4. P. apodus

Our data for P. apodus is less comprehensive but nevertheless also demonstrated high levels of thermoregulatory efficiency, including Tbs never exceeding the Tset. This species has a much broader Tset range than T. hermanni but during the study restricted maximum Tb’s to around 32 °C, even when the thermal environment facilitated further Tb increases. The comparatively lower Tb’s were maintained despite faster morning heating rates of mean 5–6 °C h−1 compared to a T. hermanni mean of 3.0 °C h−1 [30]. Maximum Tb’s of P. apodus in Bulgaria in two populations ranged from 31.5 °C in spring to 30.0 °C in summer [15], which is in agreement with our data, suggesting that these thermal maximums are due to thermoregulation. Interspecific differences in the Tb ranges between T. hermanni and P. apodus may involve phylogeny [46] since low temperature activity is a characteristic of anguid lizards in general [34,59,60,61] and associated with hunting slow-moving prey in cool weather (snails, slugs, etc.; [14] and RM pers. observation). Therefore, this lifestyle difference between the two species must constrain P. apodus to operate below Tset to facilitate contact with prey species, including activity during periods of light rain [19]. However, this potentially increases predation risk given their low metabolic scope and limited ability for sustained activity in P. apodus [21,34]. This differs from many other anguids (e.g., Anguis fragilis; [60,62]) that restrict basking to more secluded locations. Field observations have shown that, in P. apodus, thermal factors tend to drive the response to potential predators, including humans. For example, at high Tb’s, the primary response is flight into dense bush; at low Tb’s, passive defence is performed by remaining immobile, not attempting to bite when captured, and initiating a twisting action along the body. Reliance on dermal armour and non-movement is the normal response when Tb’s are low and conditions are cool and damp. Similar anti-predator behaviours were observed in individuals in Greece during sunny weather in summer when Tb’s (mean ± SD = 28.0 ± 3.1 °C; [21]) were similar.

4.5. Habitat Integrity and Conservation

The importance of habitat patches to control Tb by both species was a key finding of this study [63,64,65,66]. Movement increases energy costs in reptiles by approximately 30–50% [67], and, hence, selecting appropriate patches is the most effective and economical mechanism for reptiles of this size range to thermoregulate [8]. This was supported in studies of a tropical tortoise Kinixys spekii [68]. However, to effectively thermoregulate, a reptile will also depend on the quality of the thermal environment, but in many areas, these are under threat, particularly from habitat degradation and increased fire risk due to increasing temperatures, as has been observed in the study area [69]. The vapour pressure deficit produced by fires and the subsequent habitat degradation includes plant destruction and thus impacts on shade availability, which is even more acute during the hotter summer months. In such a degraded environment, plant cover loss may particularly impact P. apodus given that it avoids high Tbs. Environmental impacts on habitats have been found in other species [70,71], including chelonians, where in dry tropical regions, the amount of shade from vegetation determines activity in Gopherus evgoodei [66]. The Tm data here also highlight the potential for overheating and a likely need for increased shuttling or remaining inactive in shade during the summer months [68,70,71]. Habitat management is critical for species-specific thermal opportunity, thermoregulatory behaviour, and thermal physiology in reptiles [70,72]. Our study points to a possibility that a warming thermal environment would potentially first affect the low maximum Tb and cool weather active P. apodus, both in terms of physiology and prey opportunities.

4.6. Concluding Remarks

In conclusion, it may seem obvious to many thermal biologists that both species of reptile would abandon activity during the colder months, becoming dormant rather than attempting to maintain activity. However, the full impact of changes in the thermal environment on the lives of reptiles is rarely quantified over the full annual period but is often restricted to times when reptiles are able to attain preferred Tb ranges. However, the climatic conditions that determine inactivity are equally important, for example, the impact this has on growth and reproduction. The use of null models and corresponding Tb’s has enabled the quantification of the thermal environment, giving insight into thermoregulatory differences between sympatric species of different lifestyles. These are known to occur in other reptiles, including snakes, e.g., [73,74]. Research on temperatures inside winter dens would increase our understanding of the thermal ecology of both species.

Author Contributions

Conceptualization: R.M., A.V., and V.P.; methodology: R.M.; formal analysis: A.V. and R.M.; field work/data collection A.V.; writing—original draft preparation: R.M., A.V., and V.P.; writing—review and editing: all authors; supervision: R.M. and V.P. All authors have read and agreed to the published version of the manuscript.

Funding

This research received no external funding.

Institutional Review Board Statement

The study did not require ethical approval since no experimental procedures were carried out.

Informed Consent Statement

Not applicable.

Data Availability Statement

The data presented in this study are shown graphically in the figures and are not publicly available due to ongoing longitudinal analysis.

Acknowledgments

The authors greatly appreciate comments by anonymous referees that improved on the original submitted draft.

Conflicts of Interest

The authors declare no conflicts of interest.

References

  1. Huey, R.B.; Slatkin, M. Costs and benefits of lizard thermoregulation. Q. Rev. Biol. 1976, 51, 363–384. [Google Scholar] [CrossRef]
  2. Bauwens, D.; Hertz, P.E.; Castilla, A.M. Thermoregulation in a lacertid lizard: The relative contributions of distinct behavioral mechanisms. Ecology 1996, 77, 1818–1830. [Google Scholar] [CrossRef]
  3. Smith, G.R.; Ballinger, R.E. The ecological consequences of habitat and microhabitat use in lizards: A review. Contemp. Herpetol. 2001, 3, 1–37. [Google Scholar] [CrossRef]
  4. Christian, K.A.; Tracy, C.R.; Porter, W.P. Seasonal shifts in body temperature and use of microhabitats by Galapagos land iguanas (Conolophus pallidus). Ecology 1983, 664, 463–468. [Google Scholar] [CrossRef]
  5. Christian, K.A.; Tracy, C.R. Body temperatures and the thermal environment. In Reptile Ecology and Conservation: A Handbook of Techniques; Dodd, C.K., Ed.; Oxford University Press: Oxford, UK, 2016; pp. 337–351. [Google Scholar]
  6. Meek, R. Reptiles, thermoregulation and the environment. Testudo 1995, 4, 56–78. [Google Scholar]
  7. Butler, C.J. A Review of the effects of climate change on chelonians. Diversity 2019, 11, 138. [Google Scholar] [CrossRef]
  8. Stevenson, R.D. The relative importance of behavioral and physiological adjustments controlling body temperature in terrestrial ectotherms. Am. Nat. 1985, 126, 362–386. [Google Scholar] [CrossRef]
  9. Stevenson, R.D. Body size and limits to the daily range of body temperature in terrestrial ectotherms. Am. Nat. 1985, 125, 102–117. [Google Scholar] [CrossRef]
  10. Carrascal, L.M.; López, P.; Martin, J.; Salvador, A. Basking and antipredator behaviour in a high altitude lizard: Implications of heat-exchange rate. Ethology 1992, 92, 143–154. [Google Scholar]
  11. Swingland, I.R.; Frazier, J.G. The conflict between feeding and overheating in the Aldabran giant tortoise. In A Handbook of Biotelemetry and Radio Tracking; Amlaner, C.J., MacDonald, D.W., Eds.; Pergamon Press: Oxford, UK, 1979; pp. 611–615. [Google Scholar]
  12. Haxhiu, I. Results of studies on the chelonians of Albania. Chelonian Conserv. Biol. 1995, 1, 324–326. [Google Scholar]
  13. Meek, R. Nutritional selection in Hermanns tortoise, Testudo hermanni, in Montenegro and Croatia. Testudo 2010, 7, 88–95. [Google Scholar]
  14. Çiçek, K.; Tok, C.; Hayretdağ, S.; Ayaz, D. Data on the food composition of European glass lizard, Pseudopus apodus (Pallas, 1775) (Squamata: Anguidae) from Çanakkale (Western Anatolia, Turkey). Acta Zool. Bulgar. 2014, 66, 433–466. [Google Scholar]
  15. Telenchev, I.; Simeonovaska-Nikolova, D.; Tzonev, N. Habitat use and activity of European glass lizard, Pseudopus apodus (Pallas, 1775) in southeastern Bulgaria. Turk. J. Zool. 2017, 41, 2. [Google Scholar] [CrossRef]
  16. Liang, C.; Marghoub, A.; Kever, L.; Bertazzo, S.; Abzhanov, A.; Vickaryous, M.; Herrel, A.; Evans, S.; Moazen, M. Lizard osteodermsmorphological characterisation, biomimetic design and manufacturing based on three species. Bioinspir. Biomim. 2021, 16, 066011. [Google Scholar] [CrossRef]
  17. Meek, R. Thermoregulatory behaviour in a population of Hermann’s tortoise (Testudo hermanni) in southern Yugoslavia. Br. J. Herpetol. 1984, 6, 387–391. [Google Scholar]
  18. Meek, R. Field body temperature of the glass lizard Ophisaurus apodus in Yugoslavia. Amphibia-Reptilia 1986, 7, 43–49. [Google Scholar] [CrossRef]
  19. Meek, R. The thermal ecology of Hermann’s tortoise (Testudo hermanni) in summer and autumn in Yugoslavia. J. Zool. 1988, 215, 99–111. [Google Scholar] [CrossRef]
  20. Hailey, A.; Theophilidis, G. Cardiac response to stress and activity in the armoured legless lizard (Ophisaurus apodus): Comparison with snake and tortoise. Comp. Biochem. Physiol. 1987, 88, 201–206. [Google Scholar] [CrossRef]
  21. Wright, J.; Steer, E.; Hailey, A. Habitat separation in tortoises and the consequences for activity and thermoregulation. Can. J. Zool. 1988, 66, 1537–1544. [Google Scholar] [CrossRef]
  22. Vujović, A.; Pešić, V.; Meek, R. Living in a thermally diverse environment: Field body temperatures and thermoregulation in Hermann’s tortoise, Testudo hermanni, in Montenegro. Conservation 2023, 3, 59–70. [Google Scholar] [CrossRef]
  23. Willemsen, R.E. Differences in thermoregulation between Testudo hermanni and Testudo marginata and their ecological significance. Herpetol. J. 1991, 1, 559–567. [Google Scholar]
  24. Rugiero, L.; Luiselli, L. Ecological modelling of habitat use and the annual activity patterns in an urban population of the tortoise, Testudo hermanni. Ital. J. Zool. 2006, 73, 219–225. [Google Scholar] [CrossRef]
  25. Moulherat, S.; Delmas, V.; Slimani, T.; El Mouden, E.; Louzizi, T.; Lagarde, F.; Bonnet, X. How far can a tortoise walk in open habitat before overheating? Implications for conservation. J. Nat. Conserv. 2014, 22, 186–192. [Google Scholar] [CrossRef]
  26. Gangloff, E.J.; Telemeco, R.S. High temperature, oxygen, and performance: Insights from reptiles and amphibians. Integr. Comp. Biol. 2018, 58, 9–24. [Google Scholar] [CrossRef]
  27. Hutchison, V.H.; Vinegar, A.; Kosh, R.J. Critical thermal maxima in turtles. Herpetologica 1966, 22, 32–41. [Google Scholar]
  28. O’Connor, M.P.; Zimmerman, L.C.; Dzialowski, E.M.; Spotila, J.R. Thick-walled physical models improve estimates of operative temperatures for moderate to large-sized reptiles. J. Therm. Biol. 2000, 25, 293–304. [Google Scholar] [CrossRef]
  29. Walsberg, G.E.; Wolf, B.O. A test of the accuracy of operative temperature thermometers for studies of small ectotherms. J. Therm. Biol. 1996, 21, 275–281. [Google Scholar] [CrossRef]
  30. Vitt, L.J.; Sartorius, S.S. HOBO’s, Tidbits and lizard models: The utility of electronic devices in field studies of ectotherms thermoregulation. Funct. Ecol. 1999, 13, 670–674. [Google Scholar] [CrossRef]
  31. Shine, R.; Kearney, M. Field studies of reptile thermoregulation: How well do physical models predict operative temperatures? Funct. Ecol. 2001, 15, 282–288. [Google Scholar] [CrossRef]
  32. Dzialowski, E.M. Use of operative temperature and standard operative temperature models in thermal biology. J. Therm. Biol. 2005, 30, 317–334. [Google Scholar] [CrossRef]
  33. Claunch, N.M.; Goodman, C.; Reed, R.N.; Romagosa, C.M.; Taylor, E.N. Invaders from Islands: Thermal Matching, Potential, or Plasticity? Biol. J. Linn. Soc. 2021, 134, 587–603. [Google Scholar] [CrossRef]
  34. HaiIey, A. Thermoregulation and activity metabolism in the armoured anguid Ophisaurus apodus. Br. J. Herpetol. 1984, 6, 391–398. [Google Scholar]
  35. Gable, S.M.; Mendez, J.M.; Bushroe, N.A.; Wilson, A.; Byars, M.; Tollis, M. The state of Squamate genomics: Past, present, and future of genome research in the most speciose terrestrial vertebrate order. Genes 2023, 7, 1387. [Google Scholar] [CrossRef]
  36. Huey, R.B.; Bennett, A.F. Phylogenetic studies of coadaptation: Preferred temperatures versus optimal performance temperatures of lizards. Evolution 1987, 41, 1098–1115. [Google Scholar] [CrossRef]
  37. Huey, R.B.; Garland, T., Jr.; Turelli, M. Revisiting a key innovation in evolutionary biology: Felsenstein’s Phylogenies and the Comparative Method. Am. Nat. 2019, 193, 655–672. [Google Scholar]
  38. Tracy, C.R.; Flack, K.M.; Zimmerman, L.A.C.; Espinoza, R.E.; Tracy, C.R. Herbivory imposes constraints on voluntary hypothermia in lizards. Copeia 2005, 2005, 12–19. [Google Scholar] [CrossRef]
  39. Glavaš, O.J.; Počanić, P.; Lovrić, V.; Derežanin, L.; Tadić, Z.; Lisičić, D. Morphological and ecological divergence in two populations of European glass lizards, Pseudopus apodus (Squamata: Anguidae). Zool. Res. 2020, 41, 172–181. [Google Scholar] [CrossRef]
  40. Bailey, N.T.J. Statistical Methods in Biology; Cambridge University Press: Cambridge, UK, 1995. [Google Scholar]
  41. Hertz, P.E.; Huey, R.B.; Stevenson, R.D. Evaluating temperature regulation by field-active ectotherms: The fallacy of the inappropriate question. Am. Nat. 1993, 142, 796–818. [Google Scholar] [CrossRef]
  42. Dewitt, C.B.; Friedman, R.M. Significance of skewness in ectotherm thermoregulation. Am. Zool. 1979, 19, 195–209. [Google Scholar] [CrossRef]
  43. Cherchi, M. Termoregulazione in Testudo hermanni. Bolletino Musei Inst. Biol. Univ. Genova 1956, 28, 9–87. [Google Scholar]
  44. Cherchi, M. Uteriori richerchi sulla termoregulazione in Testudo hermanni. Bolletino Musei Inst. Biol. Univ. Genova 1960, 30, 35–60. [Google Scholar]
  45. Mautz, W.J.; Nagy, K.A. Ontogenetic changes in diet, field metabolic rate, and water flux in the herbivorous lizard Dipsosaurus dorsalis. Physiol. Zool. 1987, 60, 640–658. [Google Scholar] [CrossRef]
  46. Felenstein, J. Phylogenies and the comparative method. Am. Nat. 1987, 125, 1–15. [Google Scholar] [CrossRef]
  47. Gatten, R.E. Effects of nutritional status on the preferred temperature of the turtles Pseudemys scripta and Terrapene ornata. Copeia 1974, 1974, 912–917. [Google Scholar] [CrossRef]
  48. Obbard, M.E.; Brooks, R.J. Factors affecting basking in a northern population of the common snapping turtle, Chelydra serpentina. Can. J. Zool. 1979, 57, 435–440. [Google Scholar] [CrossRef]
  49. Van Damme, R.; Bauwens, D.; Castilla, A.M.; Verheyen, R.F. Altitudinal variation in the thermal biology and running performance in the lizard Podarcis tiliguerta. Oecologia 1989, 80, 51624. [Google Scholar] [CrossRef] [PubMed]
  50. Grant, B.W.; Dunham, A.E. Elevational covariation in environmental constraints and life histories of the desert lizard Sceloporus merriami. Ecology 1990, 71, 1765–1776. [Google Scholar] [CrossRef]
  51. Nagy, K.A. Cellulose digestion and nutrient assimilation in Sauromalus obesus, a plant-eating lizard. Copeia 1977, 1977, 355–362. [Google Scholar] [CrossRef]
  52. Tracy, C.R.; Zimmerman, L.C.; Tracy, C.; Dean-Bradley, K.; Castle, K. Rates of food passage in the digestive tract of young desert tortoises: Effects of body size and diet quality. Chelonian Conserv. Biol. 2006, 5, 269–273. [Google Scholar] [CrossRef]
  53. Troyer, K. Small differences in daytime body temperature affect digestion of natural food in a herbivorous lizard (Iguana iguana). Comp. Biochem. Physiol. 1987, 87, 623–626. [Google Scholar] [CrossRef]
  54. Castilla, A.M.; Van Damme, R.; Bauwens, D. Field body temperatures, mechanisms of thermoregulation and evolution of thermal characteristics in lacertid lizards. Nat. Croat. 1999, 8, 253–274. [Google Scholar]
  55. Tosini, G.; Avery, R.A. Intraspecific variation in lizard thermoregulatory set points: A thermographic study in Podarcis muralis. J. Therm. Biol. 1993, 18, 19–23. [Google Scholar] [CrossRef]
  56. Vickers, M.; Manicom, C.; Schwarzkopf, L. Extending the cost-benefit model of thermoregulation: High-temperature environments. Am. Nat. 2011, 177, 452–461. [Google Scholar] [CrossRef]
  57. Dubois, Y.; Blouin-Demers, G.; Thomas, D.W. Temperature selection in wood turtles (Glyptemys insculpta) and its implications for energetics. Ecoscience 2008, 215, 398–406. [Google Scholar] [CrossRef]
  58. Bennett, A.F. The thermal dependence of lizard behaviour. Anim. Behav. 1980, 28, 752–762. [Google Scholar] [CrossRef]
  59. Capula, M.; Luiselli, L. Ecology of an alpine population of the slow worm, Anguis fragilis Linnaeus 1758. Thermal biology of reproduction. Herpetozoa 1993, 6, 57–63. [Google Scholar]
  60. Meek, R. Null models and the thermal biology of the anguid lizard Anguis fragilis; evidence for thermoregulation? Amphibia-Reptilia 2005, 26, 445–450. [Google Scholar] [CrossRef]
  61. Sinervo, B.; Mendez-De-La-Cruz, F.; Miles, D.B.; Heulin, B.; Bastiaans, E.; Villagrán-Santa Cruz, M.; Lara-Resendiz, R.; Martínez-Méndez, N.; Calderón-Espinosa, M.L.; Meza-Lázaro, R.N.; et al. Erosion of lizard diversity by climate change and altered thermal niches. Science 2010, 328, 894–899. [Google Scholar] [CrossRef]
  62. Del Vecchio, S.; Burke, R.L.; Rugiero, L.; Capula, M.; Luiselli, L. The turtle is in the details: Microhabitat choice by Testudo hermanni is based on microscale plant distribution. Anim. Biol. 2011, 61, 249–261. [Google Scholar] [CrossRef]
  63. Scheffers, B.R.; Edwards, D.P.; Diesmos, A.; Williams, S.E.; Evans, T.A. Microhabitats reduce animal’s exposure to climate extremes. Glob. Change Biol. 2014, 20, 495–503. [Google Scholar] [CrossRef]
  64. Lara–Resendiz, R.A.; Miles, D.B.; Rosen, P.C.; Sinervo, B. Micro and macroclimatic constraints on the activity of a vulnerable tortoise: A mechanistic approach under a thermal niche view. Funct. Ecol. 2022, 36, 2227–2239. [Google Scholar] [CrossRef]
  65. Huey, R.B.; Pianka, E.R. Ecological consequences of foraging mode. Ecology 1981, 62, 991–999. [Google Scholar] [CrossRef]
  66. Hailey, A.; Coulson, I.M. Temperature and the tropical tortoise Kinixys spekii: Constraints on activity level and body temperature. J. Zool. 1995, 240, 523–536. [Google Scholar] [CrossRef]
  67. Vujović, A.; Iković, V.; Golubović, A.; Đorđević, S.; Pešić, V.; Tomović, L. Effects of fires and roadkills on the isolated population of Testudo hermanni Gmelin, 1789 (Reptilia: Testudinidae) in central Montenegro. Acta Zool. Bulg. 2015, 67, 75–84. [Google Scholar]
  68. Sears, M.W.; Angilletta, M.J.; Schuler, M.S.; Borchert, J.D.; Dilliplane, K.F.; Stegman, M.; Rusch, T.; Mitchell, W.A. Configuration of the thermal landscape determines thermoregulatory performance of ectotherms. Proc. Natl. Acad. Sci. USA 2016, 113, 10595–10600. [Google Scholar] [CrossRef]
  69. Gaudenti, N.; Nix, E.; Maier, P.; Westphal, M.F.; Taylor, E.N. Habitat heterogeneity affects the thermal ecology of an endangered lizard. Ecol. Evol. 2021, 11, 14843–14856. [Google Scholar] [CrossRef]
  70. Asplund, K.K. Body size and habitat utilisation in whiptail lizards (Cnemidophorus). Copiea 1974, 1974, 695–703. [Google Scholar] [CrossRef]
  71. Lee, J.C. Comparative thermal ecology of two lizards. Oecologia 1980, 44, 171–176. [Google Scholar] [CrossRef]
  72. Basson, C.H.; Levy, O.; Angilletta, M.J.; Clusella-Trullas, S. Lizards paid a greater opportunity cost to thermoregulate in a less heterogeneous environment. Funct. Ecol. 2017, 31, 856–865. [Google Scholar] [CrossRef]
  73. Giacometti, D.; Yagi, K.T.; Abney, C.R.; Jung, M.P.; Tattersall, G.T. Staying warm is not always the norm: Behavioural differences in thermoregulation of two snake species. Can. J. Zool. 2021, 99, 11. [Google Scholar] [CrossRef]
  74. Giacometti, D.; Palaoro, A.V.; Leal, L.C.; Barros, F.C. How seasonality influences the thermal biology of lizards with different thermoregulatory strategies: A meta-analysis. Biol. Rev. 2023, 99, 409–429. [Google Scholar] [CrossRef] [PubMed]
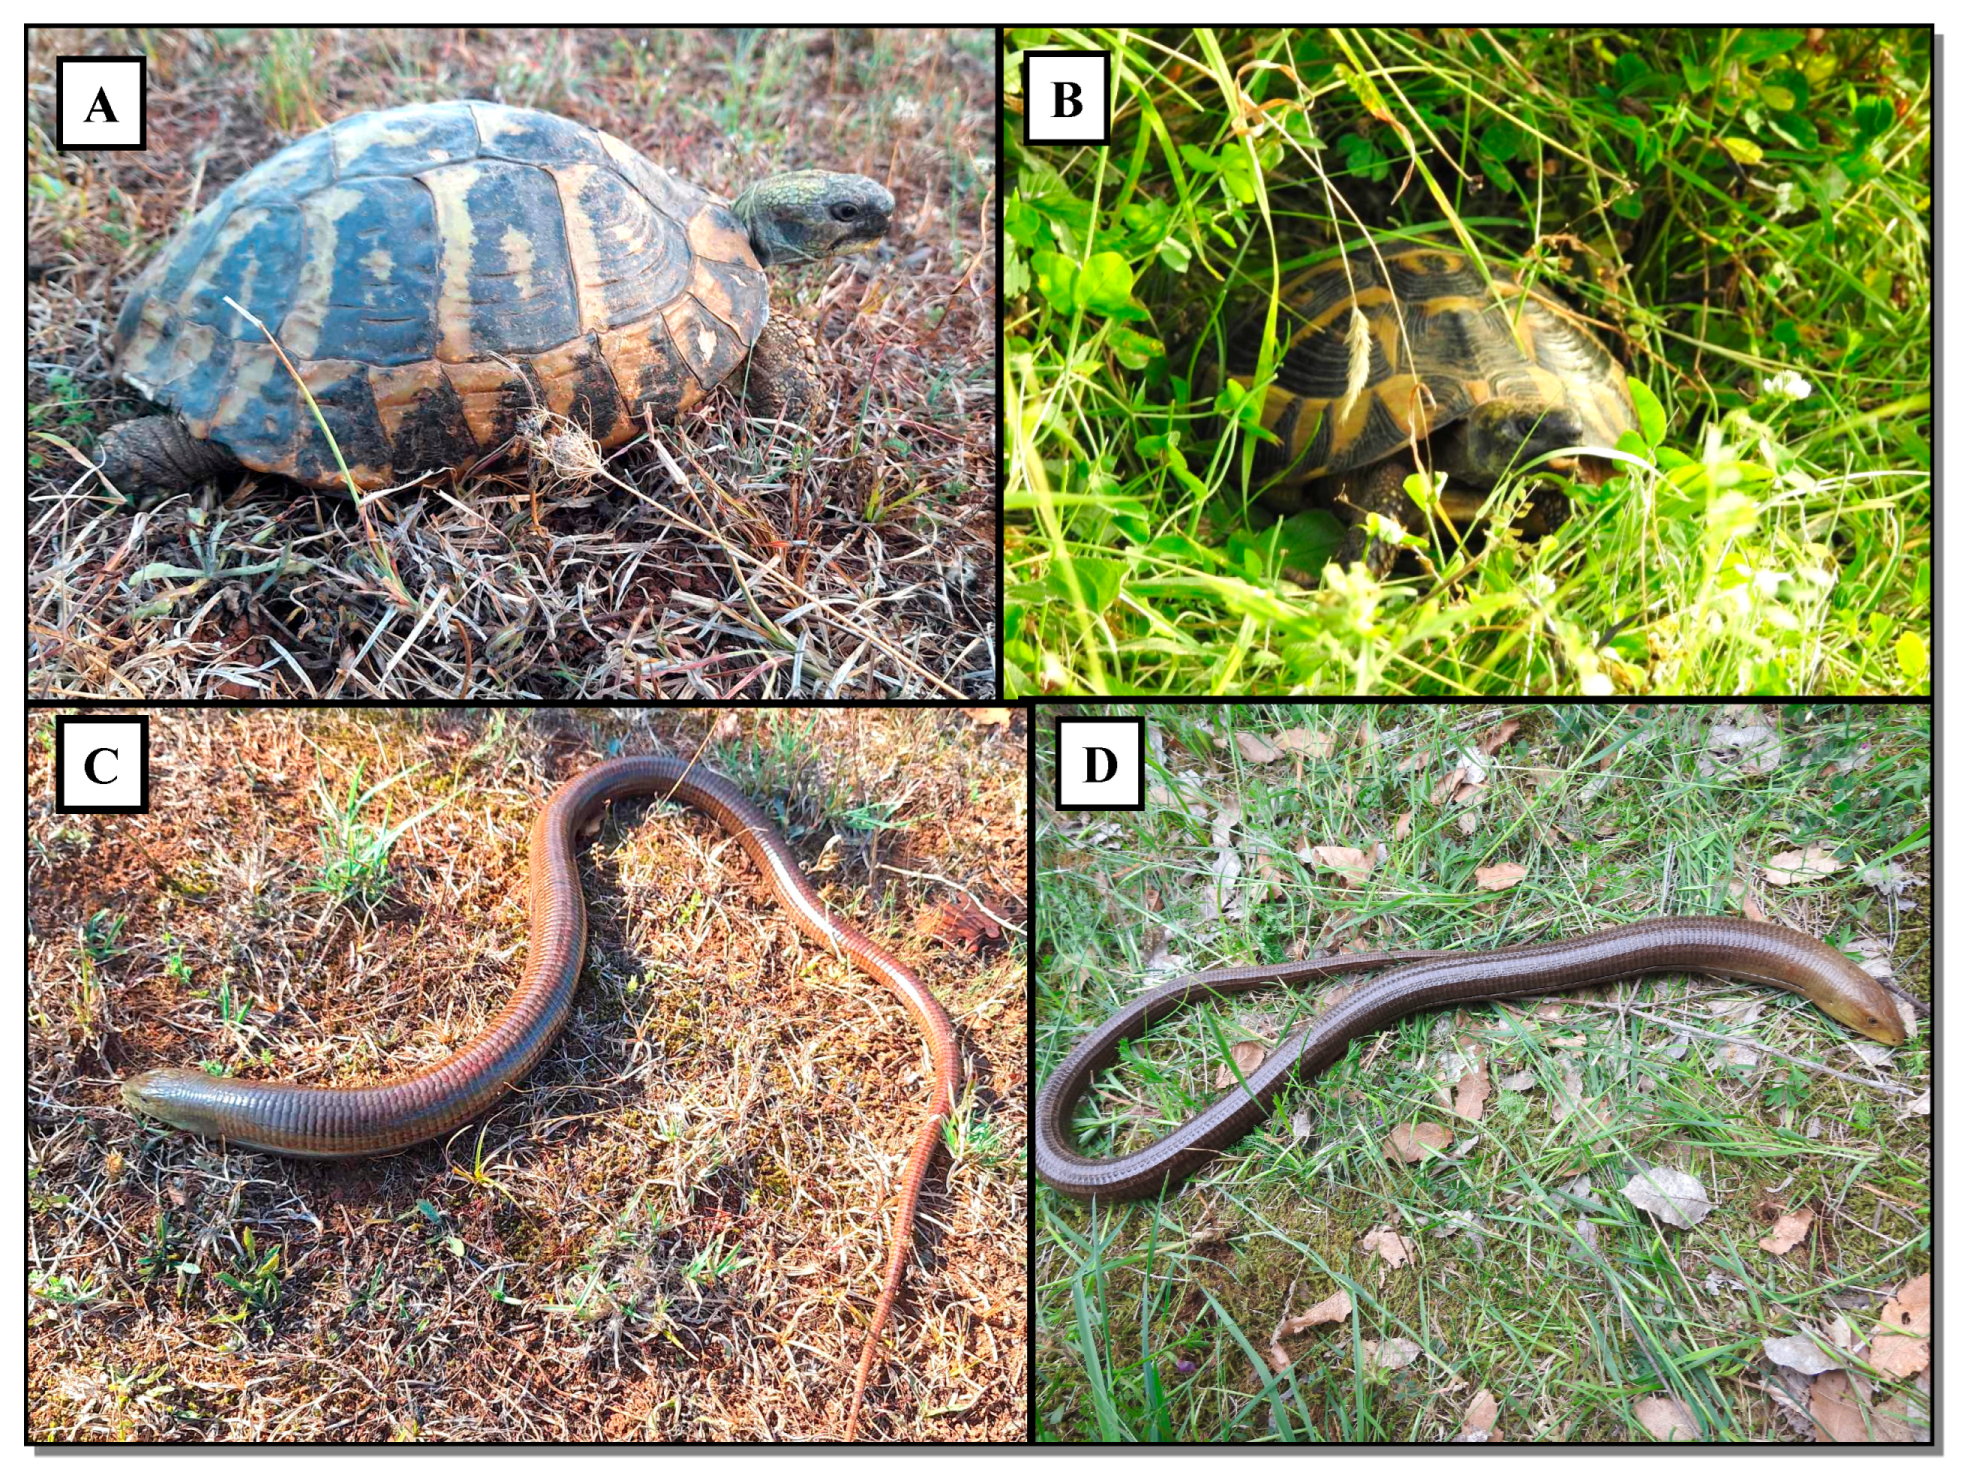
Figure 1. Examples of T. hermanni (A,B) and O. apodus, showing snake-like morphology in the latter (C,D).
Diversity 17 00638 g001
Figure 2. Google Earth view of the study locality, with area surveyed shown inside the yellow lines. Text on the Figure shows local names for the study locality in Serbian.
Diversity 17 00638 g002
Figure 3. Views of the study locality showing (A) wider area view, (B) wide open sunny patches, and (C) mosaic patches of sunlit and shaded areas, the most frequently used patches by both species.
Diversity 17 00638 g003
Figure 4. Examples of both types of null models and thermometers used.
Diversity 17 00638 g004
Figure 5. (A). Monthly temperature distributions (January to December) of short null model cylinders. (B). Monthly temperature distributions (March to December) of long null models. The boxes in the figures show the interquartile ranges that represent the central 50% of Tm’s. Horizontal lines within the boxes being the median values. The circles represent outliers. The broken lines in A and B represent maximum and minimum Tset’s for T. hermanni and P. apodus respectively. (C). Comparison of changes in monthly median Tm’s of different model types (long versus short models—see Figure 4) between March and December. Squares represent median values for the long models the triangles represent the short models. This shows that the long models had higher temperatures during most months but were significantly higher only during June and August.
Diversity 17 00638 g005
Figure 6. The time spent in different microhabitats from March to October in both species. Black cell represent the time spent in shaded areas, cross-hatched sections the time spent in the mosaic of sunlit and shaded patches and yellow the time spent in open sunlit areas.
Diversity 17 00638 g006
Figure 7. (A). Body temperature (Tb) distributions of T. hermanni between March and October. Boxes show 2nd and 3rd quartiles (50%) of Tbs. The horizontal lines in the boxes are the medians and the circles the outliers. (B). Body temperature (Tb) distributions of P. apodus between March and October but with July and August data absent due to low or zero observations. Boxes show 2nd and 3rd quartiles (50%) of Tbs, horizontal lines the medians and the circles outliers (only for T. hermanni). The continuous horizontal lines represent the Tset ranges for both species.
Diversity 17 00638 g007
Figure 8. Frequency of body temperature (Tb) distributions above (black histograms) or below (grey histograms) set point ranges (Tset) in T. hermanni.
Diversity 17 00638 g008
Table 1. Seasonal differences in the means and standard deviations of Tbs for T. hermanni and P. apodus. NA indicates no data or insufficient data for a valid analysis.
MarchAprilMayJuneJulyAugustSeptemberOctoberΣn
T. hermanni
Males
----------28.4 ± 4.429.9 ± 4.131.5 ± 1.332.3 ± 2.629.3 ± 2.331.3 ± 1.628.8 ± 2.6
n =01112625563716163
T. hermanni
Females
28.8 ± 2.427.7 ± 4.229.5 ± 4.631.6 ± 1.831.5 ± 2.228.7 ± 2.429.9 ± 3.229.5 ± 1.6
n =21817321277275190
P. apodus28.9 ± 3.425.8 ± 3.826.7 ± 3.230.7 ± 1.3NANA25.2 ± 1.728.9 ± 1.6
n =424136 71165
Table 2. Results of monthly thermoregulatory efficiency tests derived from the equation E = 1 − ((P)Tm = Tset)/((P)Tb = Tset). ND indicates insufficient or no data. See text for more details.
MarchAprilMayJuneJulyAugustSeptemberOctoberMean
E
SD of E
T. hermanniFemalesND0.940.440.80.50.450.570.770.640.20
MalesND0.930.790.740.550.550.470.660.670.16
P. apodusPooled0.70.640.830.32NDND0.310.560.560.20
Disclaimer/Publisher’s Note: The statements, opinions and data contained in all publications are solely those of the individual author(s) and contributor(s) and not of MDPI and/or the editor(s). MDPI and/or the editor(s) disclaim responsibility for any injury to people or property resulting from any ideas, methods, instructions or products referred to in the content.