Abstract
Elucidating the relationship between changes in insect assemblage structure and diversity and the number of years of ecological restoration will help us evaluate the effectiveness of ecological restoration. Our objective is to investigate the response of the structure and diversity of insect communities in the ecological restoration area of Yimin Surface Mine in Inner Mongolia to different restoration years (1 year, 4 years, 7 years) by monitoring in 2018, 2021, and 2024. A total of 1282 insect specimens were collected using sweep-netting methods, representing 70 species from 46 families across 8 orders. The results demonstrated that as restoration progressed, insect taxa significantly increased from 25 to 55 species (p < 0.01), with key functional groups (Coleoptera and Lepidoptera) showing marked richness enhancement. α-diversity indices (Shannon–Wiener and Margalef) significantly increased, while the Simpson dominance index decreased, indicating a more homogeneous species distribution. β-diversity analysis revealed reduced compositional dissimilarity among plots during later restoration stages, reflecting enhanced assemblage stability. The trophic structure shifted from phytophagous dominance to stabilized proportions across all feeding guilds, signaling food web maturation and ecosystem development. Overall, local ecological restoration projects had a significantly positive effect on insect survival and biodiversity development. Our research addresses a gap in faunal assemblage studies of coal mine rehabilitation zones.
1. Introduction
Mining has historically been a cornerstone of economic development in China, particularly in resource-abundant areas, such as Inner Mongolia and Gansu, where coal, metal ores, and other minerals have propelled rapid industrial growth [1,2]. However, mining imposes heavy environmental burdens, especially acute in arid zones characterized by fragile ecosystems, harsh climates, and water scarcity. Land degradation, loss of biodiversity, and contamination of soil and water resources are particularly pronounced in these regions [3,4]. In abandoned mining areas, operations often leave vast tracts of land without rehabilitation, posing long-term ecological risks. Without proper closure plans, the landscape remains degraded, and natural recovery processes are insufficient to restore ecological balance [5]. Confronting these issues, China has rolled out policies like the “Mine Environmental Protection and Restoration Program (MEPRP)” [6], designed to facilitate ecological restoration. At present, various ecological restoration methods are used in China [7], such as Wu et al.’s application of a multi-stage remediation approach (termed “nine-section whip”) to resolve mining environmental issues [8] and Cao et al.’s utilization of abandoned open-pit mines for oil storage and energy accumulation [9]. Internationally, the United States has established commercial-scale operations across multiple abandoned open-pit mines, including San Juan, Black Warrior, Northern Appalachia, and Raton [10]. Concurrently, Song et al. evaluated the feasibility of installing floating photovoltaic (FPV) systems in abandoned mine pit lakes, conducting a case study at South Korea’s Ssangyong limestone quarry [11]. Their analysis confirmed both the economic viability and ecological benefits of FPV deployment on such sites.
The scientific assessment of ecological restoration efficacy requires established evaluation metrics to accurately determine project outcomes and sustainability, thereby informing subsequent management. In 2004, the Society for Ecological Restoration (SER) proposed nine assessment criteria spanning species diversity, environmental carrying capacity, and sustainable development potential [12]. Ruiz-Jaen et al. posited that restoration progress and ecosystem self-sustainability can be reflected through vegetation structure, diversity, and ecological processes [13,14]. Earlier assessments of grassland restoration predominantly emphasized vegetation characteristics, with plant diversity recovery deemed critical [15]. Subsequently, evaluation frameworks incorporated diverse ecological metrics, including biodiversity, vegetation coverage, and soil organic matter [16,17]. For instance, steppe restoration projects adopted vegetation cover, aboveground biomass, and assemblage species richness as key indicators [18]. Recently, insects have gained prominence in evaluating degraded ecosystem recovery [19,20,21,22,23].
Insect assemblage diversity serves as a vital bioindicator, intrinsically linked to compositional structure, habitat conditions, and vegetation traits [24,25,26]. Consequently, insect assemblage dynamics are widely employed to assess disturbance intensity, habitat quality, and restoration success across forests, wetlands, and grasslands. The richness of multiple insect taxa has been used to quantify edge effects in agricultural landscapes, guiding conservation planning. For example, taxa sensitive to environmental change function as restoration indicators [27]. Audino et al. integrated species/functional diversity to evaluate tropical forest recovery across chrono sequences [28]. Diversity contrasts of phytophagous and predatory insects inside/outside enclosures, correlated with vegetation parameters, reveal recovery mechanisms [29].
Here, we comprehensively evaluated the structure and diversity of insect communities in the ecological restoration area of Yimin Surface Mine across time series (initial, 4-year, and 7-year restorations) and spatial gradients. In order to explore the effects of local ecological restoration projects on insect communities, the effectiveness and sustainability of ecological restoration measures in the region were explored from the perspective of insects.
2. Materials and Methods
2.1. Study Region
Yimin Surface Mine is located in the Hulunbeier grassland on the western slope of the Greater Khingan Mountains, the eastern part of the Hailar Basin, and the western side of the middle and lower reaches of the Yimin River. The periphery of the basin is dominated by low mountains and hills, with the highest elevation of 758.3 m. The basin is located in the alluvial plain, with an elevation range of 671~673 m and a relative elevation difference of nearly 90 m. The original water system in the mining area was drained by the open-pit coal mine, which belongs to the semi-arid continental monsoon climate in the middle temperate zone. The winter is cold and long, the summer is warm and cool, and the temperature changes rapidly in spring and autumn. The spring temperature is higher than the autumn temperature, the autumn rain is more than the spring rain, and the frost-free period is short. The vegetation coverage in the mining area is nearly 100%, and the vegetation type is a typical grassland type. Dominant vegetation includes Leymus chinensis, Elymus dahuricus, Agropyron mongolicum, Bromus inermis, Psathyrostachys juncea, Taraxacum mongolicum, Belamcanda chinensis, Bupleurum chinense, Sanvitalia procumbens, etc. (Figure 1).
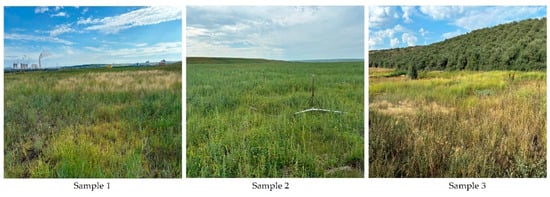
Figure 1.
Typical environmental map of the sampling site.
2.2. Design of Experiments
The experimental sites are located in Yiminhe Town, Ewenki Autonomous Banner, Hulun Buir Prairie. A comprehensive ecological assessment was carried out by selecting samples from different years and different spatial locations in the ecological restoration area of Yimin Surface Mine. A total of three sample sites were selected, and four research plots were selected from each sample point, amounting to a total of 12 plots (Figure 2). Insect surveys were conducted in June and September of 2018 (the year of restoration), 2021 (the fourth year of restoration), and 2024 (the seventh year of restoration).
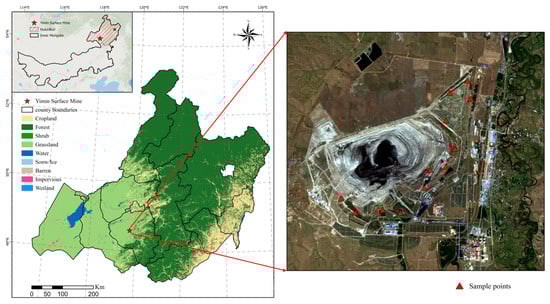
Figure 2.
Sample site distribution diagram (red triangles indicate sample plots).
2.3. Sample Collection
GPS was used to record the longitude and latitude of each collection point, and the annual precipitation, warmest season precipitation, annual average temperature, and coldest monthly average temperature data of the region were obtained from WorldClim (https://www.worldclim.org (accessed on 2 May 2025)). Normalized Difference Vegetation Index (NDVI) data were obtained from the NASA website (https://ladsweb.modaps.eosdis.nasa.gov/search (accessed on 3 May 2025)).
The method of field investigation was adopted to collect insect specimens. During the day, the net sweeping method was primarily adopted. (A nylon net with a mesh size of 1 mm was used, with a diameter of 38 cm, a depth of 50 cm, and a stem of 1.5 m. The Z-shaped net sweeping sampling method was used. Square sample plots with a side length of less than 10 m, according to the environment and terrain of each area, were identified. Each sample plot was swept 5 to 10 times; each back-and-forth sweep counted as one sweep, and the sweeping angle was 180° each time. The sampling time was between 9:00 and 15:00.) The net sweeping method was used to collect insects from 12 sample plots. After each group finished sweeping the net, the insects in the net were placed in a poison gas cylinder and killed; then, they were poured out from the collection net and collected in Kraft wrapping paper so that they could be classified and counted after returning to the laboratory. The environmental characteristics of the collection area were simply recorded. Nocturnal insects were collected by light traps at night. The investigators selected a low-lying open space with lush vegetation in each sample plot, placed trapping lights and curtains, and set the period from dark to 3 h after dark. All insects attached to the curtain were quickly killed with a poison bottle filled with ethyl acetate and brought back to the laboratory for classification and statistical analysis. The location and sampling time of the insect lights and curtains were fixed for each survey. The trapping lamp used a black light, and the curtain was 2 m × 2 m of white cloth.
The collected insect samples were classified and identified, and the species composition and quantity were recorded. Insect classification and identification were based on the Chinese Academy of Sciences [30], the Illustrated Handbook of Insects in China [31], Inner Mongolia Insect Fauna, Volume I, Book 1 [32], Catalogue of Grassland Pests in Inner Mongolia [33], Economic Insect Fauna of China [34], and Insect Classification [35].
2.4. Statistical Analyses
Prior to statistical analyses, the insect abundance data matrix was standardized to account for differences in the total sample size across plots and years. Specifically, species abundances were transformed into relative abundances (number of individuals of each species divided by the total number of individuals per plot). This standardization was conducted in R 4.3.1 (R Core Team, Auckland, New Zealand) using the decostand function in the vegan package.
The insect α-diversity (Shannon–Wiener index, Simpson index, Pielou’s evenness index, and Margalef richness index) was calculated as follows:
Shannon–Wiener diversity index:
Pielou’s evenness index:
Simpson’s diversity index:
Margalef richness index:
where Pi is the ratio of the number of individuals of the ith species to the total number of individuals; S is the number of all species in the insect assemblage; and N is the total number of individuals. Standardized diversity estimates were additionally calculated using the iNEXT package [36]. The spatial autocorrelation of Shannon index residuals was tested using Moran’s I, implemented in the ape package [37].
The β-diversity was measured by the Bray–Curtis dissimilarity index. The formula was as follows:
where aN is the sum of the number of species individuals in plot A; bN is the sum of the number of species in plot B; and jN is the sum of the smaller individuals of the common species in plot A and plot B in the two plots. Differences in assemblage structure were further tested using Permutational Multivariate Analysis of Variance (PERMANOVA) [38] and Mantel tests in the vegan package [39]. Species contributions to between-group dissimilarities were evaluated using SIMPER analysis.
Graphs were generated using Prism GraphPad 8.0 software (GraphPad Software, San Diego, CA, USA).
3. Results
3.1. The Changes in Insect Assemblage Structure with the Increase in Restoration Years
A total of 1282 insect specimens were collected, belonging to 70 species across 46 families and eight orders (see Supplementary Materials, Table S1). Hemiptera exhibited the highest species richness and abundance, with 371 individuals representing 19 species under 10 families. These accounted for 27.14% of the total species and 28.94% of all collected individuals, including families such as Callaphididae, Pentatomidae, Aphrophoridae, Cixiidae, Miridae, Psyllidae, Acanthosomatidae, Aphididae, Cicadellidae, and Alydidae. Orthoptera followed with nine species (12.86% of the total species), covering seven families: Oedipodidae, Catantopidae, Acrididae, Gryllidae, Tetrigidae, Tettigoniidae, and Pyrgomorphidae. Both Neuroptera and Odonata were represented by fewer families and species. Neuroptera yielded only 1 family, 1 species, and 13 individuals, while Odonata comprised 2 families, 3 species, and 13 individuals (Table S1). With the increase in restoration years, the number of insect groups showed an increasing trend. There were 25 groups at the 1-year restoration, 39 groups at the 4-year restoration, and 55 groups at the 7-year restoration (Table 1).

Table 1.
Species differences between different restoration years.
Table 2 shows that the number of families, species, and individuals basically increased with the increase in restoration years. Among them, the sample size of Hymenoptera and Odonata in each sample point is small.
Table 2.
Numbers of insects (family, species, and individuals) differences between different restoration years.
In the initial restoration phase (2018), phytophagous insects (e.g., Dolycoris baccarum, Oedaleus asiaticus) dominated the assemblage, exhibiting a simplistic structure with pronounced dominant species (see Supplementary Materials, Table S2). By the mid-restoration stage (2021), the proportions of zoophagous (e.g., Coccinellidae, Ichneumonidae) and omnivorous insects (e.g., Syrphidae) increased. In the late restoration phase (2024), functional group proportions stabilized, forming a more complex assemblage structure with a heightened diversity of Hymenoptera (bees, wasps) and Coleoptera (ladybugs, leaf beetles) (Figure 3, Table S2).
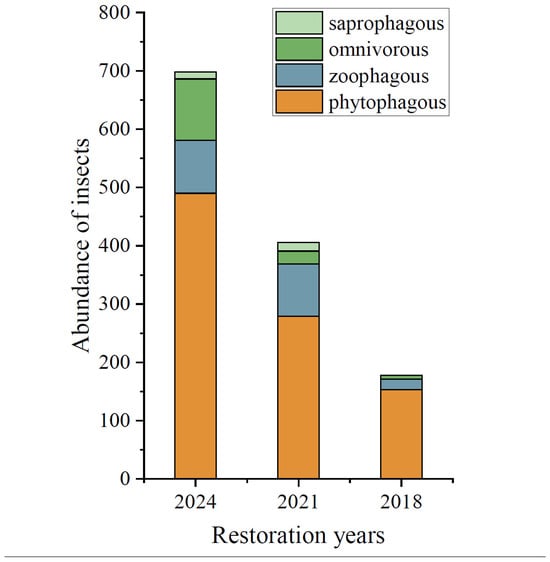
Figure 3.
Bar graphs showing the abundance of four different feeding insects in different restoration years: 2018 (the year of restoration), 2021 (the fourth year of restoration), and 2024 (the seventh year of restoration).
3.2. The Change in Insect Diversity with the Increase in Restoration Years
The analysis of the insect diversity indices at the Yimin Surface Mine under different restoration durations revealed that with increasing ecological restoration time, the Shannon diversity index, Pielou’s evenness index, and Margalef richness index of the insect assemblage all demonstrated a significant upward trend (Figure 4). After 7 years of restoration (in 2024), the Shannon diversity index, Pielou’s evenness index, and Margalef richness index of the insect samples were significantly higher than those at sites restored for 4 years and 1 year. This indicates that longer restoration periods lead to higher species diversity and richness within the insect assemblage (Figure 4a,b,d). Furthermore, the Simpson dominance index showed a declining trend with increasing restoration time (Figure 4c). Seasonal changes have different effects on the diversity of insect communities in different restoration years. After 4 years of ecological restoration, the Simpson dominance index was significantly lower in June than in September (Figure 4c). After 7 years of ecological restoration, Pielou’s evenness index was significantly higher in June than in September (Figure 4b).
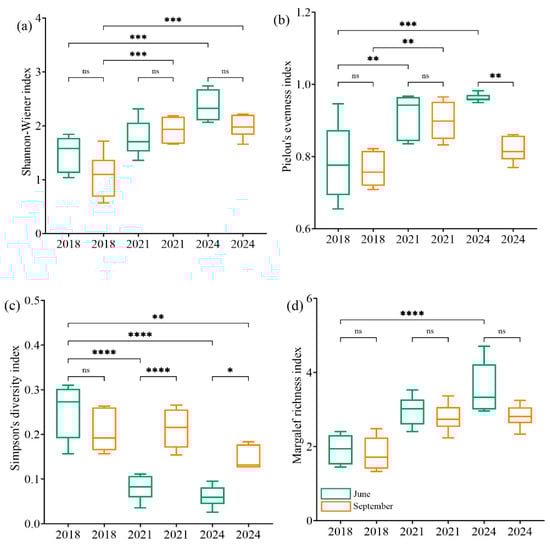
Figure 4.
The change in insect diversity with the increase in restoration years: Shannon-Wiener index (a), Pielou’s evenness index (b), Simpson’s diversitu index (c), Margalef richness index (d), 2018 (the year of restoration), 2021 (the fourth year of restoration), and 2024 (the seventh year of restoration). ns: A p-value > 0.05 indicates that the result is not statistically significant; *: A p-value < 0.05 indicates that the result is statistically significant; **: A p-value < 0.01 indicates that the result is highly significant; ***: A p-value < 0.001 indicates that the result is particularly significant. ****: A p-value < 0.001 indicates that the result is extremely significant.
The interaction analysis of year and month revealed distinct patterns among the diversity indices (Figure 5). For most indices, the values in June were generally higher than those in September, whereas the Simpson index showed the opposite trend. Despite this consistent seasonal pattern, the absolute values fluctuated among years, indicating that seasonal effects were relatively stable, while interannual effects primarily influenced the overall diversity level. Furthermore, the indices exhibited different change patterns, suggesting that each metric varied in its sensitivity to particular aspects of assemblage structure.
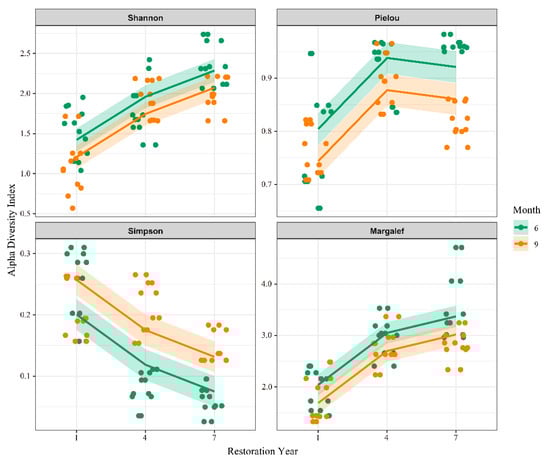
Figure 5.
Interaction effects of year and month on α-diversity indices. Lines represent temporal trends in diversity for different months across years.
The PERMANOVA analysis method based on the Bray–Curtis dissimilarity index was used to evaluate the differences in species composition between sample plots of different restoration durations. In the between-group comparisons, the species composition differed least between plots restored for 1 year and 4 years, while differences increased when comparing the 1-year with 7-year plots and the 4-year with 7-year plots (Table 3). This pattern indicates that, as restoration time increased, the divergence in species composition between different restoration stages became more pronounced, suggesting that ecological restoration drives communities to gradually differentiate over time. Thus, the longer the ecological restoration period, the greater the compositional differences among plots of different restoration ages, reflecting a progressive trajectory of assemblage succession (Table 3).
Table 3.
PERMANOVA analysis of species composition between sample plots of different restoration durations: 2018 (the year of restoration), 2021 (the fourth year of restoration), and 2024 (the seventh year of restoration). *: A p-value < 0.05 indicates that the result is statistically significant; **: A p-value < 0.01 indicates that the result is highly significant.
To identify the taxa contributing to these differences, SIMPER analysis was performed for the three pairwise comparisons (Table 4). SIMPER analysis revealed that a core group of taxa—Tetrix japonica, Oedaleus decorus, Adelphocoris quadripunctatus, Coccinula sinensis, and Anastoechus neimongolanus—consistently explained nearly half of the compositional dissimilarities across all pairwise comparisons (Table 4). Additional taxa contributed in a stage-specific manner: Bombus patagiatus and Voria ruralis were important in 2018 vs. 2021, while Pontia edusa, Oecleopsis sp., Pimpla disparis, and Harmonia axyridis became influential in comparisons involving 2024. These results indicate that while dominant herbivores and predators drove persistent differences, restoration also facilitated the emergence of stage-specific species.
Table 4.
SIMPER analysis of species composition dissimilarities among restoration stages. The table lists species that together explained up to 70% of the Bray–Curtis dissimilarity in each pairwise comparison: 2018 (first year of restoration), 2021 (fourth year), and 2024 (seventh year). Values indicate the average contribution of each species, with cumulative contributions shown in parentheses. “-” denotes species not among the main contributors for a given comparison.
PERMANOVA revealed that significant differences in species composition among the 1-year, 4-year, and 7-year restored plots in June (Table 5), with the largest divergence occurring between the 1-year and 7-year plots. In contrast, in September (Table 6), differences between restoration durations were not statistically significant, although R2 values still indicated moderate levels of dissimilarity. This indicates that as restoration time increased, species composition diverged progressively across restoration stages, but the detectability of these differences was season-dependent. Furthermore, seasonal variations exerted varying degrees of influence on species composition between plots of different restoration durations. Specifically, restoration-driven differentiation was more evident in June, while in September, stronger seasonal effects may have masked restoration-related differences (Table 5 and Table 6).
Table 5.
PERMANOVA analysis of species composition between different restoration years in June (pairwise comparisons among restoration durations). *: A p-value < 0.05 indicates that the result is statistically significant; **: A p-value < 0.01 indicates that the result is highly significant; ***: A p-value < 0.001 indicates that the result is particularly significant.
Table 6.
PERMANOVA analysis of species composition between different restoration years in September (pairwise comparisons among restoration durations).
In addition, a spatial autocorrelation analysis of Moran’s I was conducted on the residuals of the Shannon diversity index for the two sampling months (June and September) across the three sampling years (2018, 2021, and 2024) (Figure S1). The results showed that in most year–month combinations, the assemblage α-diversity did not exhibit significant spatial autocorrelation. However, in September 2024, the Moran’s I test result was significant, indicating the presence of spatial clustering of α-diversity among plots during this period. This suggests that the assemblage α-diversity during this period may have be driven by certain spatially structured factors, such as seasonal environmental conditions, resource distribution patterns, or spatial consistency of external disturbances. This phenomenon indicates that the spatial pattern of the assemblage may have temporal dynamics, meaning that spatial autocorrelation does not exist stably for a long time but only manifests under specific periods and conditions.
We also conducted Mantel tests for the three years (2018, 2021, 2024) and two sampling months (June and September) to evaluate the correlation between assemblage composition (based on Bray–Curtis dissimilarity) and geographical distance (Figure S2). The results showed that the correlation between Bray–Curtis dissimilarity and geographical distance was not significant in any of the six year × month combinations. This indicates that at the spatial scale of this study, the differences between communities were not significantly affected by the geographical distance between plots.
4. Discussion
Unlike existing domestic coal mine restoration studies, predominantly focused on isolated factors (e.g., revegetation or soil remediation), our research establishes a multitrophic animal assemblage model for restored mining sites. This research may fill the knowledge gap in faunal diversity recovery within post-mining landscapes, providing an indicator and theoretical foundation for ecological restoration efficacy assessment. The multi-scale and multi-dimensional methods provide a reference for further improving the monitoring framework for the restoration of ecosystems disturbed by mining.
4.1. Restoration Years and Insect Assemblage Structure
Our results suggest that during the plant restoration of Yimin Surface Mine, the number of families, species, and individuals of insects across various feeding guilds generally increased with the duration of restoration, and their proportions gradually stabilized. Local-scale native plant restoration can induce an alternative stable state shift by altering vegetation assemblage composition [40]. Plant restoration can result in the formation of unique insect assemblages within restored grasslands [41,42,43]. Samples of certain insect species were collected across all three restoration-age plots, such as Oedaleus asiaticus (Asian migratory locust), Tetrix japonica (Japanese pygmy grasshopper), Dictyophara patruelis (Burri planthopper), and Phryxe heracleid (a tachinid fly). This likely indicates that these species possess strong environmental adaptability, enabling them to survive in different stages of the restoration environment and gradually become relatively stable components of the regional ecosystem [44,45]. Another group of insects appeared only after four or seven years of restoration, including Atractomorpha sinensis (Short-horned grasshopper), Acrida cinerea (Chinese grasshopper), Episyrphus balteatus (Marmalade hoverfly), and Triceratopyga calliphoroides (a blowfly). These species have higher demands regarding the ecological environment and require a certain period of restoration and ecosystem improvement before they appear [46,47]. Conversely, some species decreased or even disappeared after prolonged environmental restoration. These species may be better adapted to relatively barren environments and experience population declines in later stages due to being outcompeted for dominant ecological niches by other species [48]. Among these, Hymenoptera (wasps, bees, ants) and Odonata (dragonflies, damselflies) consistently had low sample counts across all plots, likely due to their high mobility and elusiveness [49,50]. Therefore, changes in their abundance alone cannot be used as an indicator of restoration effectiveness.
Our study revealed that restoration sites at the 1-year stage exhibited the greatest dissimilarity in internal species composition, characterized by a simple assemblage structure dominated by herbivorous insects. This is likely attributable to the simplified structure of the early-stage vegetation assemblage, featuring low plant diversity, limited biomass, and consequently restricted availability of food resources (e.g., specific host plants, pollen, nectar) and physical habitat structures (e.g., litter layer, shrub thickets) [51]. Such resource-limited environments primarily support the survival and proliferation of adaptable herbivorous insects with broad dietary ranges (polyphagous or oligophagous species), particularly those feeding on dominant pioneer plants, which form the core of the initial assemblage [52]. During the midterm restoration phase, an increase in carnivorous and omnivorous insects was observed, signifying the gradual development of food chains and enhanced niche differentiation. One key driver of this phenomenon is the increased availability of prey resources; burgeoning populations of herbivorous insects, acting as primary consumers, provide ample prey or host resources for carnivorous insects (e.g., ladybugs, ground beetles, hoverflies, parasitoid wasps), meeting their survival and reproductive requirements. In the later stages of restoration, functional group proportions stabilized, forming a more complex assemblage structure exemplified by heightened diversity in Hymenoptera and Coleoptera, signaling progression toward ecosystem maturation [53]. The general increase in the number of insect families, species, and individuals with restoration age demonstrates that the ecological restoration efforts at the Yimin Surface Mine have significantly facilitated insect survival. Furthermore, SIMPER analysis indicated that assemblage dissimilarities among different restoration stages were primarily driven by a core group of widespread taxa, including Tetrix japonica, Oedaleus decorus, Adelphocoris quadripunctatus, Coccinula sinensis, and Anastoechus neimongolanus, which together explained nearly half of the compositional differences. At the same time, stage-specific taxa, such as Bombus patagiatus, Voria ruralis, Pontia edusa, and Harmonia axyridis, contributed uniquely to particular comparisons, suggesting that while dominant herbivores remained persistent, additional species emerged over time. This pattern reflects progressive reassembly of insect communities, with restoration both maintaining core species and promoting the recruitment of new taxa that increase trophic and functional complexity.
4.2. The Effects of Ecological Restoration Years and Seasons on the Diversity of Insect Communities
Insect communities serve as reliable indicators of grassland ecosystem health [54]. By monitoring changes in insect diversity and abundance, subtle shifts in the ecosystem can be detected in a timely manner, providing scientific guidance for ecological conservation and restoration efforts, and promoting sustainable development in the region [55,56]. Our study systematically reveals the dynamic recovery process of the ecosystem at the Yimin Surface Mine by integrating a multi-dimensional indicator system, including insect assemblage structure, feeding functional groups, and spatiotemporal diversity patterns. By innovatively employing methods such as combined α-β-diversity analysis and dynamic monitoring of functional groups, this research analyzes the succession patterns of insect communities across different restoration durations (1-year, 4-year, 7-year) and seasons (June, September).
Our study found that with an increase in ecological restoration duration, the diversity of insect communities in the study area exhibited a significant upward trend. Long-term monitoring revealed that the number of insect taxonomic groups progressively increased from 25 groups in the initial restoration stage to 55 groups after 7 years of restoration, representing an increase of 120%. This substantial growth in taxonomic group richness indicates the ongoing recovery of the ecosystem’s biodiversity. In particular, the species richness of key functional groups, such as Coleoptera (beetles) and Lepidoptera (butterflies and moths), showed significant enhancement, reflecting the gradual improvement in ecosystem structure and function [57]. The analysis of α-diversity showed that with increasing restoration time, the ecosystem’s diversity, evenness, and richness all demonstrated significant upward trends. This indicates that species distribution became more even, and ecosystem stability increased. The insect diversity in June exceeded that in September, potentially due to the following: (1) Plants entering the productive phase or senescing by September, resulting in reduced nutritional value (elevated cellulose content) and a sharp decline in pollen/nectar availability, substantially diminishing both the total amount and diversity of food resources [58]. (2) Many species complete 1–2 generations of reproduction by this period, leading to increased adult mortality, fewer newly emerged individuals, with only overwintering life stages (eggs, pupae) or cold-tolerant species (e.g., some Hemiptera and Orthoptera) remaining [59,60]. The influence of seasonal variation on species composition attenuates with increasing restoration time. This likely correlates with the higher species diversity and more mature ecosystem characteristics of long-term restoration sites. The analysis of β-diversity revealed that as restoration duration increased (from 1 to 7 years), the compositional differences among insect communities significantly decreased. The Bray–Curtis dissimilarity index indicated that as the restoration time increased, the compositional differences between different restoration stages became more significant. Due to the issues of the plant growth period and insect development stage mentioned above, the differences caused by the restoration effect were more obvious in June. This indicates that with the increase in restoration time, the species composition in different restoration stages gradually differentiates, reflecting the progressive trajectory of assemblage succession [61,62]. This demonstrates that ecological restoration effectively enhanced assemblage stability and resistance to disturbances. These results confirm that long-term restoration promotes the development of the ecosystem toward a mature stage.
5. Conclusions
Our findings demonstrate that prolonged ecological restoration significantly enhances both the diversity and evenness of the insect assemblage in the study area. In later restoration stages, insect species composition converged among sample plots, and the dietary guild structure shifted from herbivore dominance towards a stable equilibrium across trophic levels. This signals the refinement of food chains and the maturation of the ecosystem. In conclusion, this discovery confirms that the local ecological restoration project has achieved great success in restoring biodiversity. The local ecological restoration project has increased biodiversity and the number of taxonomic units, making the assemblage of biodiversity richer and more stable, which reflects the improvement in the food chain and the maturity of the ecosystem. The project can transform wastelands left after mining in the mining area into a normal ecosystem, laying a good foundation for possible future grazing activities or farmland reclamation. Meanwhile, our research provides another biological indicator for evaluating the effectiveness of ecological restoration and also demonstrates the effectiveness and sustainability of the ecological restoration measures implemented in this region.
Supplementary Materials
The following supporting information can be downloaded at: https://www.mdpi.com/article/10.3390/d17090635/s1, Figure S1: Results of Moran’s I test for the residuals of the Shannon index; Figure S2: Results of the Mantel test based on the Bray–Curtis dissimilarity matrix and the geographic distance matrix; Table S1: Total species list; Table S2: Species differences between different restoration years.
Author Contributions
Conceptualization, S.G.; Methodology, S.G.; Formal analysis, Y.Z.; Investigation, Y.Z., Y.Y., R.S., X.L., H.Y. and X.B.; Data curation, X.L., H.Y. and X.B.; Writing—original draft, Y.Z.; Writing—review & editing, Y.Y. and R.S.; Visualization, Y.Z., X.L., H.Y. and X.B.; Project administration, Y.Y. and R.S.; Funding acquisition, S.G. All authors have read and agreed to the published version of the manuscript.
Funding
This research was funded by the Special Fund of the Chinese Central Government for Central Public-interest Scientific Institution Basal Research, grant number (1610332022012), the Natural Science Foundation of the Inner Mongolia Autonomous Region, grant number (2023QN03007), and the Government Procurement of Services Project of the National Forestry and Grassland Administration, grant number (2024045003).
Data Availability Statement
The original contributions presented in this study are included in the article and Supplementary Materials. Further inquiries can be directed to the corresponding author.
Acknowledgments
We would like to thank Yan Chuncai and Liu Wenbin from Tianjin Normal University and Researcher Han Haibin from Inner Mongolia Agricultural University for helping us to identify insect species.
Conflicts of Interest
Author Haoran Yan was employed by the company M-Grass Ecology and Environment (Group) Co., Ltd. Author Xue Bai was employed by the company Inner Mongolia Autonomous Region Agricultural and Animal Husbandry Technology Extension Center. The remaining authors declare that the research was conducted in the absence of any commercial or financial relationships that could be construed as a potential conflict of interest.
Correction Statement
This article has been republished with a minor correction to the Data Availability Statement. This change does not affect the scientific content of the article.
References
- Ge, T.; Hao, X.; Li, J. Effects of Public Participation on Environmental Governance in China: A Spatial Durbin Econometric Analysis. J. Clean. Prod. 2021, 321, 129042. [Google Scholar] [CrossRef]
- Aung, T.S.; Fischer, T.B.; Shengji, L. Evaluating Environmental Impact Assessment (EIA) in the Countries along the Belt and Road Initiatives: System Effectiveness and the Compatibility with the Chinese EIA. Environ. Impact Assess. Rev. 2020, 81, 106361. [Google Scholar] [CrossRef]
- Le Gouill, C.; Poupeau, F. A Framework to Assess Mining within Social-Ecological Systems. Curr. Opin. Environ. Sustain. 2020, 44, 67–73. [Google Scholar] [CrossRef]
- Yang, F.; Geng, X.; Wang, R.; Zhang, Z.; Guo, X. A Synthesis of Mineralization Styles and Geodynamic Settings of the Paleozoic and Mesozoic Metallic Ore Deposits in the Altay Mountains, NW China. J. Asian Earth Sci. 2018, 159, 233–258. [Google Scholar] [CrossRef]
- Aili, A.; Zhang, Y.; Lin, T.; Xu, H.; Waheed, A.; Zhao, W.; Kuerban, A.; Liu, K.; Dou, H. Optimizing Vegetation Restoration: A Comprehensive Index System for Reclaiming Abandoned Mining Areas in Arid Regions of China. Biology 2025, 14, 23. [Google Scholar] [CrossRef]
- Wu, Z.; Wu, J.; Liu, J.; He, B.; Lei, T.; Wang, Q. Increasing Terrestrial Vegetation Activity of Ecological Restoration Program in the Beijing–Tianjin Sand Source Region of China. Ecol. Eng. 2013, 52, 37–50. [Google Scholar] [CrossRef]
- Ye, Y.; Xu, X.; Li, Y.; Han, W. Effects of thermal treatment on properties and ecological functions of contaminated soil. Hjgcjsxb 2021, 11, 371–377. [Google Scholar] [CrossRef]
- Wu, Q.; Liu, H.; Zhao, H.; Zhang, M.; Liu, S.; Zeng, Y. Discussion on the nine aspects of addressing environmental problems of mining. Mtxb 2019, 44, 10–22. [Google Scholar] [CrossRef]
- Shouhe, C.A.O.; Shuzhao, C.; Tao, S.; Meng, Y. Comprehensive utilization model of oil storage and energy storage of abandoned open-pit. Zgky 2021, 30, 89–94. [Google Scholar] [CrossRef]
- Esterhuizen, G.S.; Gï¿ ½rtunca, R.G. Coal Mine Safety Achievements in the USA and the Contribution of NIOSH Research. J. South. Afr. Inst. Min. Metall. 2006, 106, 813–820. [Google Scholar]
- Song, J.; Choi, Y. Analysis of the Potential for Use of Floating Photovoltaic Systems on Mine Pit Lakes: Case Study at the Ssangyong Open-Pit Limestone Mine in Korea. Energies 2016, 9, 102. [Google Scholar] [CrossRef]
- Clewell, A.; Aronson, J.; Winterhalder, K. The SER International Primer on Ecological Restoration; Society for Ecological Restoration International: Tucson, Arizona, 2004. [Google Scholar]
- Ruiz-Jaen, M.C.; Mitchell Aide, T. Restoration Success: How Is It Being Measured? Restor. Ecol. 2005, 13, 569–577. [Google Scholar] [CrossRef]
- Ruiz-Jaén, M.C.; Aide, T.M. Vegetation Structure, Species Diversity, and Ecosystem Processes as Measures of Restoration Success. For. Ecol. Manag. 2005, 218, 159–173. [Google Scholar] [CrossRef]
- Jiang, G.F.; Yan, Z.G.; Cen, M. Insect community and its diversity in Mangrove forest at Yingluo Bay of Guangx. Chin. J. Appl. Ecol. 2000, 11, 95–98. (In Chinese) [Google Scholar] [CrossRef]
- Zou, Y. The Health Evaluation of Grassland Ecosystem in Xilin Hot Open Pit Mining Area. Master’s Thesis, Inner Mongolia Agricultural University, Hohhot, China, 2020. (In Chinese). [Google Scholar] [CrossRef]
- Liu, T. Health Assessment of Alpine Grassland Ecosystem in Northwest Sichuan—A Case Study in Anqu Township. Master’s Thesis, Sichuan Agricultural University, Chengdu, China, 2016. (In Chinese). [Google Scholar]
- Hou, H.Y.; Yun, X.J.; Zhou, J.W.; Liu, H.J.; Li, Y.H.; Guo, Y.J.; Zhang, Y.Z.; Liu, X.J.; Gao, S.B. Assessing Restoration Effectiveness: A Comparative Analysis of Ecological Restoration Methods in Temperate Degraded Grassland of Inner Mongolia. Chin. J. Grassl. 2025, 47, 39–47. [Google Scholar] [CrossRef]
- Watts, C.H.; Didham, R.K. Rapid Recovery of an Insect–Plant Interaction Following Habitat Loss and Experimental Wetland Restoration. Oecologia 2006, 148, 61–69. [Google Scholar] [CrossRef]
- Shuey, J.A. Habitat Re-Creation (Ecological Restoration) as a Strategy for Conserving Insect Communities in Highly Fragmented Landscapes. Insects 2013, 4, 761–780. [Google Scholar] [CrossRef] [PubMed]
- Forister, M.L.; Black, S.H.; Elphick, C.S.; Grames, E.M.; Halsch, C.A.; Schultz, C.B.; Wagner, D.L. Missing the Bigger Picture: Why Insect Monitoring Programs Are Limited in Their Ability to Document the Effects of Habitat Loss. Conserv. Lett. 2023, 16, e12951. [Google Scholar] [CrossRef]
- Basima, L.B.; Cisirika, B.M.; Muhigwa, J.-B.B. Animal Recolonization as a Success Indicator of the Progressive Ecological Rehabilitation around a Tropical Highland Open Pit Mine. J. Environ. Prot. 2025, 16, 87–110. [Google Scholar] [CrossRef]
- Wilson, R.J.; Fox, R. Insect Responses to Global Change Offer Signposts for Biodiversity and Conservation. Ecol. Entomol. 2021, 46, 699–717. [Google Scholar] [CrossRef]
- Bried, J.; Tear, T.; Shirer, R.; Zimmerman, C.; Gifford, N.; Campbell, S.; O’Brien, K. A Framework to Integrate Habitat Monitoring and Restoration with Endangered Insect Recovery. Environ. Manag. 2014, 54, 1385–1398. [Google Scholar] [CrossRef]
- Köthe, S.; Schneider, F.D.; Bakanov, N.; Brühl, C.A.; Eichler, L.; Fickel, T.; Gemeinholzer, B.; Hörren, T.; Lux, A.; Meinel, G.; et al. Improving Insect Conservation Management through Insect Monitoring and Stakeholder Involvement. Biodivers. Conserv. 2023, 32, 691–713. [Google Scholar] [CrossRef]
- Hallmann, C.A.; Ssymank, A.; Sorg, M.; de Kroon, H.; Jongejans, E. Insect Biomass Decline Scaled to Species Diversity: General Patterns Derived from a Hoverfly Community. Proc. Natl. Acad. Sci. USA 2021, 118, e2002554117. [Google Scholar] [CrossRef] [PubMed]
- Albrecht, M.; Schmid, B.; Obrist, M.K.; Schüpbach, B.; Kleijn, D.; Duelli, P. Effects of Ecological Compensation Meadows on Arthropod Diversity in Adjacent Intensively Managed Grassland. Biol. Conserv. 2010, 143, 642–649. [Google Scholar] [CrossRef]
- Audino, L.D.; Louzada, J.; Comita, L. Dung Beetles as Indicators of Tropical Forest Restoration Success: Is It Possible to Recover Species and Functional Diversity? Biol. Conserv. 2014, 169, 248–257. [Google Scholar] [CrossRef]
- Cao, Z.Y.; Zhang, H.X.; Xiong, C.Y.; Cui, Y.F.; Wang, Y.; Shi, C.; Ban, L.P.; Zhang, R.; Wei, S.H. Effects of different types of steppe fencings on insect diversity. J. Plant Prot. 2024, 51, 1189–1202. [Google Scholar] [CrossRef]
- Institute of Zoology, Chinese Academy of Sciences. Fauna Sinica; Science Press: Beijing, China, 2001. (In Chinese) [Google Scholar]
- Cai, W.; Li, H. Illustrated Handbook of Insects in China; Shanxi Science and Technology Press: Taiyuan, China, 2015. (In Chinese) [Google Scholar]
- Nengnaizhabu. Inner Mongolia Insect Fauna, Book 1; Inner Mongolia People’s Publishing House: Hohhot, China, 1986; Volume I. (In Chinese) [Google Scholar]
- Bai, X.; Liu, A. Catalogue of Grassland Pests in Inner Mongolia; Inner Mongolia University Press: Hohhot, China, 2015. (In Chinese) [Google Scholar]
- Editorial Committee of Fauna Sinica, Chinese Academy of Sciences. Economic Insect Fauna of China; Science Press: Beijing, China, 1959–1997. (In Chinese) [Google Scholar]
- Zheng, L.; Gui, H. Insect Classification; Nanjing Normal University Press: Nanjing, China, 1999. (In Chinese) [Google Scholar]
- Hsieh, T.C.; Ma, K.H.; Chao, A. iNEXT: An R package for rarefaction and extrapolation of species diversity (Hill numbers). Methods Ecol. Evol. 2016, 7, 1451–1456. [Google Scholar] [CrossRef]
- Zhang, H.G.; Bu, W.J. Applications of the ape package in zoological systematics and evolution. Bio-Protoc. J. 2021, Bio-101, e1010674. (In Chinese) [Google Scholar]
- Anderson, M.L. Permutational Multivariate Analysis of Variance (PERMANOVA); Wiley StatsRef: Hoboken, NJ, USA, 2017; Statistics Reference Online; pp. 1–15. [Google Scholar] [CrossRef]
- Dixon, P. VEGAN, a package of R functions for community ecology. J. Veg. Sci. 2003, 14, 927–930. [Google Scholar] [CrossRef]
- Summerville, K.S.; Bonte, A.C.; Fox, L.C. Short-Term Temporal Effects on Community Structure of Lepidoptera in Restored and Remnant Tallgrass Prairies. Restor. Ecol. 2007, 15, 179–188. [Google Scholar] [CrossRef]
- Luong, J.C.; Turner, P.L.; Phillipson, C.N.; Seltmann, K.C. Local Grassland Restoration Affects Insect Communities. Ecol. Entomol. 2019, 44, 471–479. [Google Scholar] [CrossRef]
- Grunzweig, L.; Spiering, D.J.; Labatore, A.; Warren, R.J. Non-Native Plant Invader Renders Suitable Habitat Unsuitable. Arthropod-Plant Interact. 2015, 9, 577–583. [Google Scholar] [CrossRef]
- Lane, C.P.; Andow, D.A. Oak Savanna Subhabitat Variation and the Population Biology of Lycaeides Melissa Samuelis (Lepidoptera: Lycaenidae). Entomol. Soc. Am. 2003, 96, 799–809. [Google Scholar]
- Geva, N.; Guershon, M.; Orlova, M.; Ayali, A. Memoirs of a Locust: Density-Dependent Behavioral Change as a Model for Learning and Memory. Neurobiol. Learn. Mem. 2010, 93, 175–182. [Google Scholar] [CrossRef] [PubMed]
- Renault, D.; Laparie, M.; McCauley, S.J.; Bonte, D. Environmental Adaptations, Ecological Filtering, and Dispersal Central to Insect Invasions. Annu. Rev. Entomol. 2018, 63, 345–368. [Google Scholar] [CrossRef] [PubMed]
- Yue, H.; Liu, G.; Zhang, S.; Ta, F.; Han, G.; Tang, K.; Wang, N. Grassland Insect Diversity and Its Influencing Factors in Central Inner Mongolia. Chin. J. Grassl. 2024, 46, 124–132. [Google Scholar] [CrossRef]
- Li, W.; Gao, Y.; Cui, J.; Shi, S.-S. Effects of Temperature on the Development and Fecundity of Atractomorpha Sinensis (Orthoptera: Pyrgomorphidae). J. Econ. Ѐntomol. 2020, 113, 2530–2539. [Google Scholar] [CrossRef]
- Wootton, R. Dragonfly Flight: Morphology, Performance and Behaviour. Int. J. Odonatol. 2020, 23, 31–39. [Google Scholar] [CrossRef]
- Wootton, R.J. The Functional Morphology of the Wings of Odonata. Adv. Odonatol. 1991, 5, 153–169. [Google Scholar]
- Carpenter, J.M. Towards Simultaneous Analysis of Morphological and Molecular Data in Hymenoptera. Zool. Scr. 1999, 28, 251–260. [Google Scholar] [CrossRef]
- Branduzzi, A.M. Enhancing Native Plant Diversity on Legacy Minelands. Theses and Dissertations—Forestry and Natural Resources. Master’s Thesis, University of Kentucky, Lexington, KY, USA, 2020. [Google Scholar] [CrossRef]
- Joern, A.; Provin, T.; Behmer, S.T. Not Just the Usual Suspects: Insect Herbivore Populations and Communities Are Associated with Multiple Plant Nutrients. Ecology 2012, 93, 1002–1015. [Google Scholar] [CrossRef]
- He, D.H.; Chang, Y.D.; Tian, Z.; Yang, Y.; Yang, S.; Yang, Y.; Li, Y.; Ma, S. Dynamics in composition, trophic structure and diversity of an insect community during the processes of succession and restoration. Acta Ecol. Sin. 2001, 1, 117–125. (In Chinese) [Google Scholar]
- Sollai, G.; Solari, P. An Overview of “Insect Biodiversity”. Diversity 2022, 14, 134. [Google Scholar] [CrossRef]
- Li, Y.; Ji, L.; Bai, X. Survey and Diversity Assessment of Key Insect Communities in Different Grassland Types in Inner Mongolia. Sci. Rep. 2025, 15, 22307. [Google Scholar] [CrossRef] [PubMed]
- Forister, M.L.; Pelton, E.M.; Black, S.H. Declines in Insect Abundance and Diversity: We Know Enough to Act Now. Conserv. Sci. Pract. 2019, 1, e80. [Google Scholar] [CrossRef]
- Quan, H.; Tu, K.; Shu, P.; Chen, L.; Zhang, C.; Ding, Y.; Zou, Z. Community structure and faunal analysis of Coleoptera and Lepidoptera insects in Jiulingshan, Jiangxi. J. Nanchang Univ. 2025, 49, 172–183. (In Chinese) [Google Scholar] [CrossRef]
- Lennartsson, T.; Wissman, J.; Bergström, H.-M. The Effect of Timing of Grassland Management on Plant Reproduction. Int. J. Ecol. 2012, 2012, 156274. [Google Scholar] [CrossRef]
- Papadopoulos, A.G.; Koskinioti, P.; Zarpas, K.D.; Papadopoulos, N.T. Differential Cold Tolerance on Immature Stages of Geographically Divergent Ceratitis Capitata Populations. Biology 2023, 12, 1379. [Google Scholar] [CrossRef]
- Danks, H.V. Long Life Cycles in Insects. Can. Entomol. 1992, 124, 167–187. [Google Scholar] [CrossRef]
- Ricotta, C.; Podani, J. On Some Properties of the Bray-Curtis Dissimilarity and Their Ecological Meaning. Ecol. Complex. 2017, 31, 201–205. [Google Scholar] [CrossRef]
- Legendre, P. Interpreting the Replacement and Richness Difference Components of Beta Diversity. Glob. Ecol. Biogeogr. 2014, 23, 1324–1334. [Google Scholar] [CrossRef]
Disclaimer/Publisher’s Note: The statements, opinions and data contained in all publications are solely those of the individual author(s) and contributor(s) and not of MDPI and/or the editor(s). MDPI and/or the editor(s) disclaim responsibility for any injury to people or property resulting from any ideas, methods, instructions or products referred to in the content. |
© 2025 by the authors. Licensee MDPI, Basel, Switzerland. This article is an open access article distributed under the terms and conditions of the Creative Commons Attribution (CC BY) license (https://creativecommons.org/licenses/by/4.0/).