Review

The Yellow Sea Green Tides: Spatiotemporal Dynamics of Long-Distance Transport and Influencing Factors

1
The Institute for Advanced Study of Coastal Ecology, Ludong University, Yantai 264025, China
2
CAS Key Laboratory of Coastal Environmental Processes and Ecological Remediation, Yantai Institute of Coastal Zone Research, Chinese Academy of Sciences, Yantai 264003, China
*
Authors to whom correspondence should be addressed.
Diversity 2025, 17(9), 614; https://doi.org/10.3390/d17090614
Submission received: 4 August 2025 / Revised: 30 August 2025 / Accepted: 31 August 2025 / Published: 1 September 2025

Abstract

Since 2007, the Yellow Sea has experienced the world’s largest green tides, with Ulva prolifera O.F. Müller as the dominant species. Those blooms severely impacted the local tourism and aquaculture, resulting in significant economic losses, as well as negative social and ecological consequences. Unlike other global green tides, those in the Yellow Sea are characterized by long-distance drifting and an astonishing scale. These destructive events display significant temporal and spatial variability, which is largely driven by dynamic environmental conditions and human activities. In this review, we summarize recent advancements in understanding the spatiotemporal patterns of long-distance transport, the interannual variability in bloom size, and the underlying mechanisms driving these fluctuations. Additionally, we highlight important knowledge gaps that need further investigation to support the development of effective management strategies for mitigating the impacts of green tides in the Yellow Sea.

1. Introduction

Green tides, caused by the extensive growth and accumulation of unattached green macroalgae, have increased globally in both severity and geographical extent, primarily driven by the eutrophication of marine environments [1,2]. These floating green tides significantly impact marine ecosystems by disturbing zooplankton communities, altering seawater chemistry, reducing phytoplankton biomass, and even modifying the carbonate system [3,4,5]. Additionally, the accumulation of algae on beaches and in coastal waters disrupts the balance of coastal ecosystems, leads to the death of cultured organisms, and damages tourism industries [2,3,6].
Since 2007, the world’s largest green tide, driven by Ulva prolifera O.F. Müller, has occurred annually in the Yellow Sea [7,8,9]. Unlike other green tides around the world, these floating algal mats do not remain in their original blooming region, but drift to the open area driven by surface winds and associated currents [10,11,12]. During this long-distance transport, the green macroalgae grow rapidly under favorable light, temperature and nutrient conditions [13,14,15], forming large-scale blooms characterized by extensive affected areas and high biomass production [8,15,16]. Eventually, substantial algae biomass washes ashore along the coasts of China’s Shandong and Jiangsu provinces [8,10,17]. Between 2008 and 2015, the combined costs of mitigation efforts and aquaculture losses due to green tide blooms were estimated to be approximately 350 million U.S. dollars [2,18,19].
The entire process of long-distance movement and the scale of Ulva prolifera blooms show strong temporal and spatial variability, influenced by changing environmental conditions or human activities, such as wind and current patterns, light and nutrient availability, and the management of Porphyra yezoensis seaweed cultivation [14,20,21]. Understanding these variations and their underlying causes is crucial for assessing the impacts of green tides on biogeochemical systems and for developing effective management strategies. Moreover, the spatiotemporal dynamics of Ulva prolifera have drawn significant public attention since the initial sudden outbreak in 2007, due to their close ties with the mariculture and tourism industries.
Satellite tracking methods, which can capture and instantaneously record Earth’s surface information, have provided a comprehensive view of the spatiotemporal dynamics of green tides [9,13,20,22,23]. In addition, various attempts, including field and laboratory research combined with ecological modeling, have been devoted to explaining the observed patterns [14,24,25,26,27]. This review focuses on the current understanding of the unique characteristics of green tides in the Yellow Sea, particularly their long-distance movement and the interannual variability in bloom size. We also briefly discuss the underlying mechanisms driving these fluctuations.

2. Diversified Macroalgae Monitoring Realized by Remote Satellites

Multiple satellite data are employed for macroalgae monitoring. MODIS optical imagery is the most widely utilized due to its broad swath width (2330 km) and high revisit capacity (morning and afternoon passes) [28]. However, its relatively coarse resolution (500 m) often fails to detect small macroalgal patches and can result in overestimations of total macroalgal coverage [29,30]. This limitation also applies to green algal detection using COMS GOCI (500 m) imagery. To address this issue, satellites with higher spatial resolution, such as the Landsat series, Sentinel 1A/2A, HJ 1A/1B, and GF series, are increasingly being used for detailed bloom monitoring [31,32]. In addition to optical sensors, microware data provide valuable all-day and all-weather observation capabilities, serving as an effective supplement for monitoring Ulva prolifera blooms.
In optical satellite images, macroalgae are commonly detected using vegetation indices, such as the Normalized Difference Vegetation Index (NDVI) [9], the Enhanced Vegetation Index (EVI) [33], and the Modified Normalized Difference Algae Index (NDAI) [34]. These indices are effective due to the spectral similarity between macroalgae and terrestrial vegetation [35]. However, such indices are often sensitive to environmental and observational perturbations, including aerosol effects and variations in solar/viewing angles [36]. To improve detection accuracy, several specialized algae indices have been developed, including the Floating Algae Index (FAI) [37], the Scaled Algae Index (SAI) [38], the Virtual-Baseline Floating macroAlgae Height (VB-FAH) index [29], the Difference of Vegetation Index (DVI) [29], and the Floating Green Algae for GOCI (IGAG) index [33,36].
In microwave imagery, macroalgal pixels can be identified using threshold methods that capitalize on the distinctive backscattering characteristics of algae in microwave bands [28,30]. It should be noted that macroalgae typically form elongated stripes or irregular patches. As a result, pixels identified as macroalgae in satellite imagery are often mixed with non-algal signals [12,28].
To address this issue, advanced techniques, such as linear pixel unmixing, image composition and machine learning, have been introduced. These approaches integrate both moderate- and coarse-resolution data to estimate algae coverage more accurately [12,28,39,40]. Furthermore, multi-sensor, multi-temporal, and multi-spatial (3 M) remote-sensing strategies have been utilized to improve the monitoring of macroalgal blooms [13]. Overall, advancements in methodologies and the application of comprehensive analytical tools have significantly enhanced the understanding and quantification of the spatiotemporal dynamics in green tides, with remote sensing technologies playing a crucial role in this progress. For a more comprehensive review of remote sensing monitoring techniques, refer to Geng et al. [41].

3. Spatiotemporal Variation in the Long-Distance Transport of Green Tides

3.1. Long-Distance Drifting

3.1.1. Northward Drifting

The most distinctive and well-known feature of the green tides in the Yellow Sea is their seasonal long-distance northward transport (Figure 1). Satellite observations have documented that floating Ulva prolifera initially originates from the Porphyra yezoensis cultivation area on the Jiangsu Shoal in late April and early May [7,42,43]. After being released into the seawater during facility recycling, the algae are carried out of Subei Shoal and undergo rapid growth under favorable light, temperature, and nutrient conditions [10,14,15]. Driven by seasonal monsoons and the associated surface currents [11,44], large floating mats of Ulva prolifera aggregate into long, extensive patches, often distributed as irregularly shaped stripes or clusters [3,12,28]. These mats typically reach their peak size by mid-June and eventually land along the southern coast of Shandong province [45]. Afterward, the Ulva prolifera green tides begin to decline, with floating mats only being sporadically observed in the coastal areas by early August [10].
This seasonal northward drift exhibits significant interannual variability in both the spatiotemporal distribution of Ulva prolifera and the overall duration of the bloom (Table 1). This variability is clearly reflected in the annual satellite-derived maps of algal locations. For instance, a comparison of Ulva prolifera blooms from 2015 to 2021 (Figure 1) shows that years with large-scale blooms, such as 2015, 2019, and 2021, had relatively extensive diffusion areas and longer durations. In contrast, smaller-scale blooms like those in 2017 and 2020 exhibited more limited spatial extent and shorter duration.
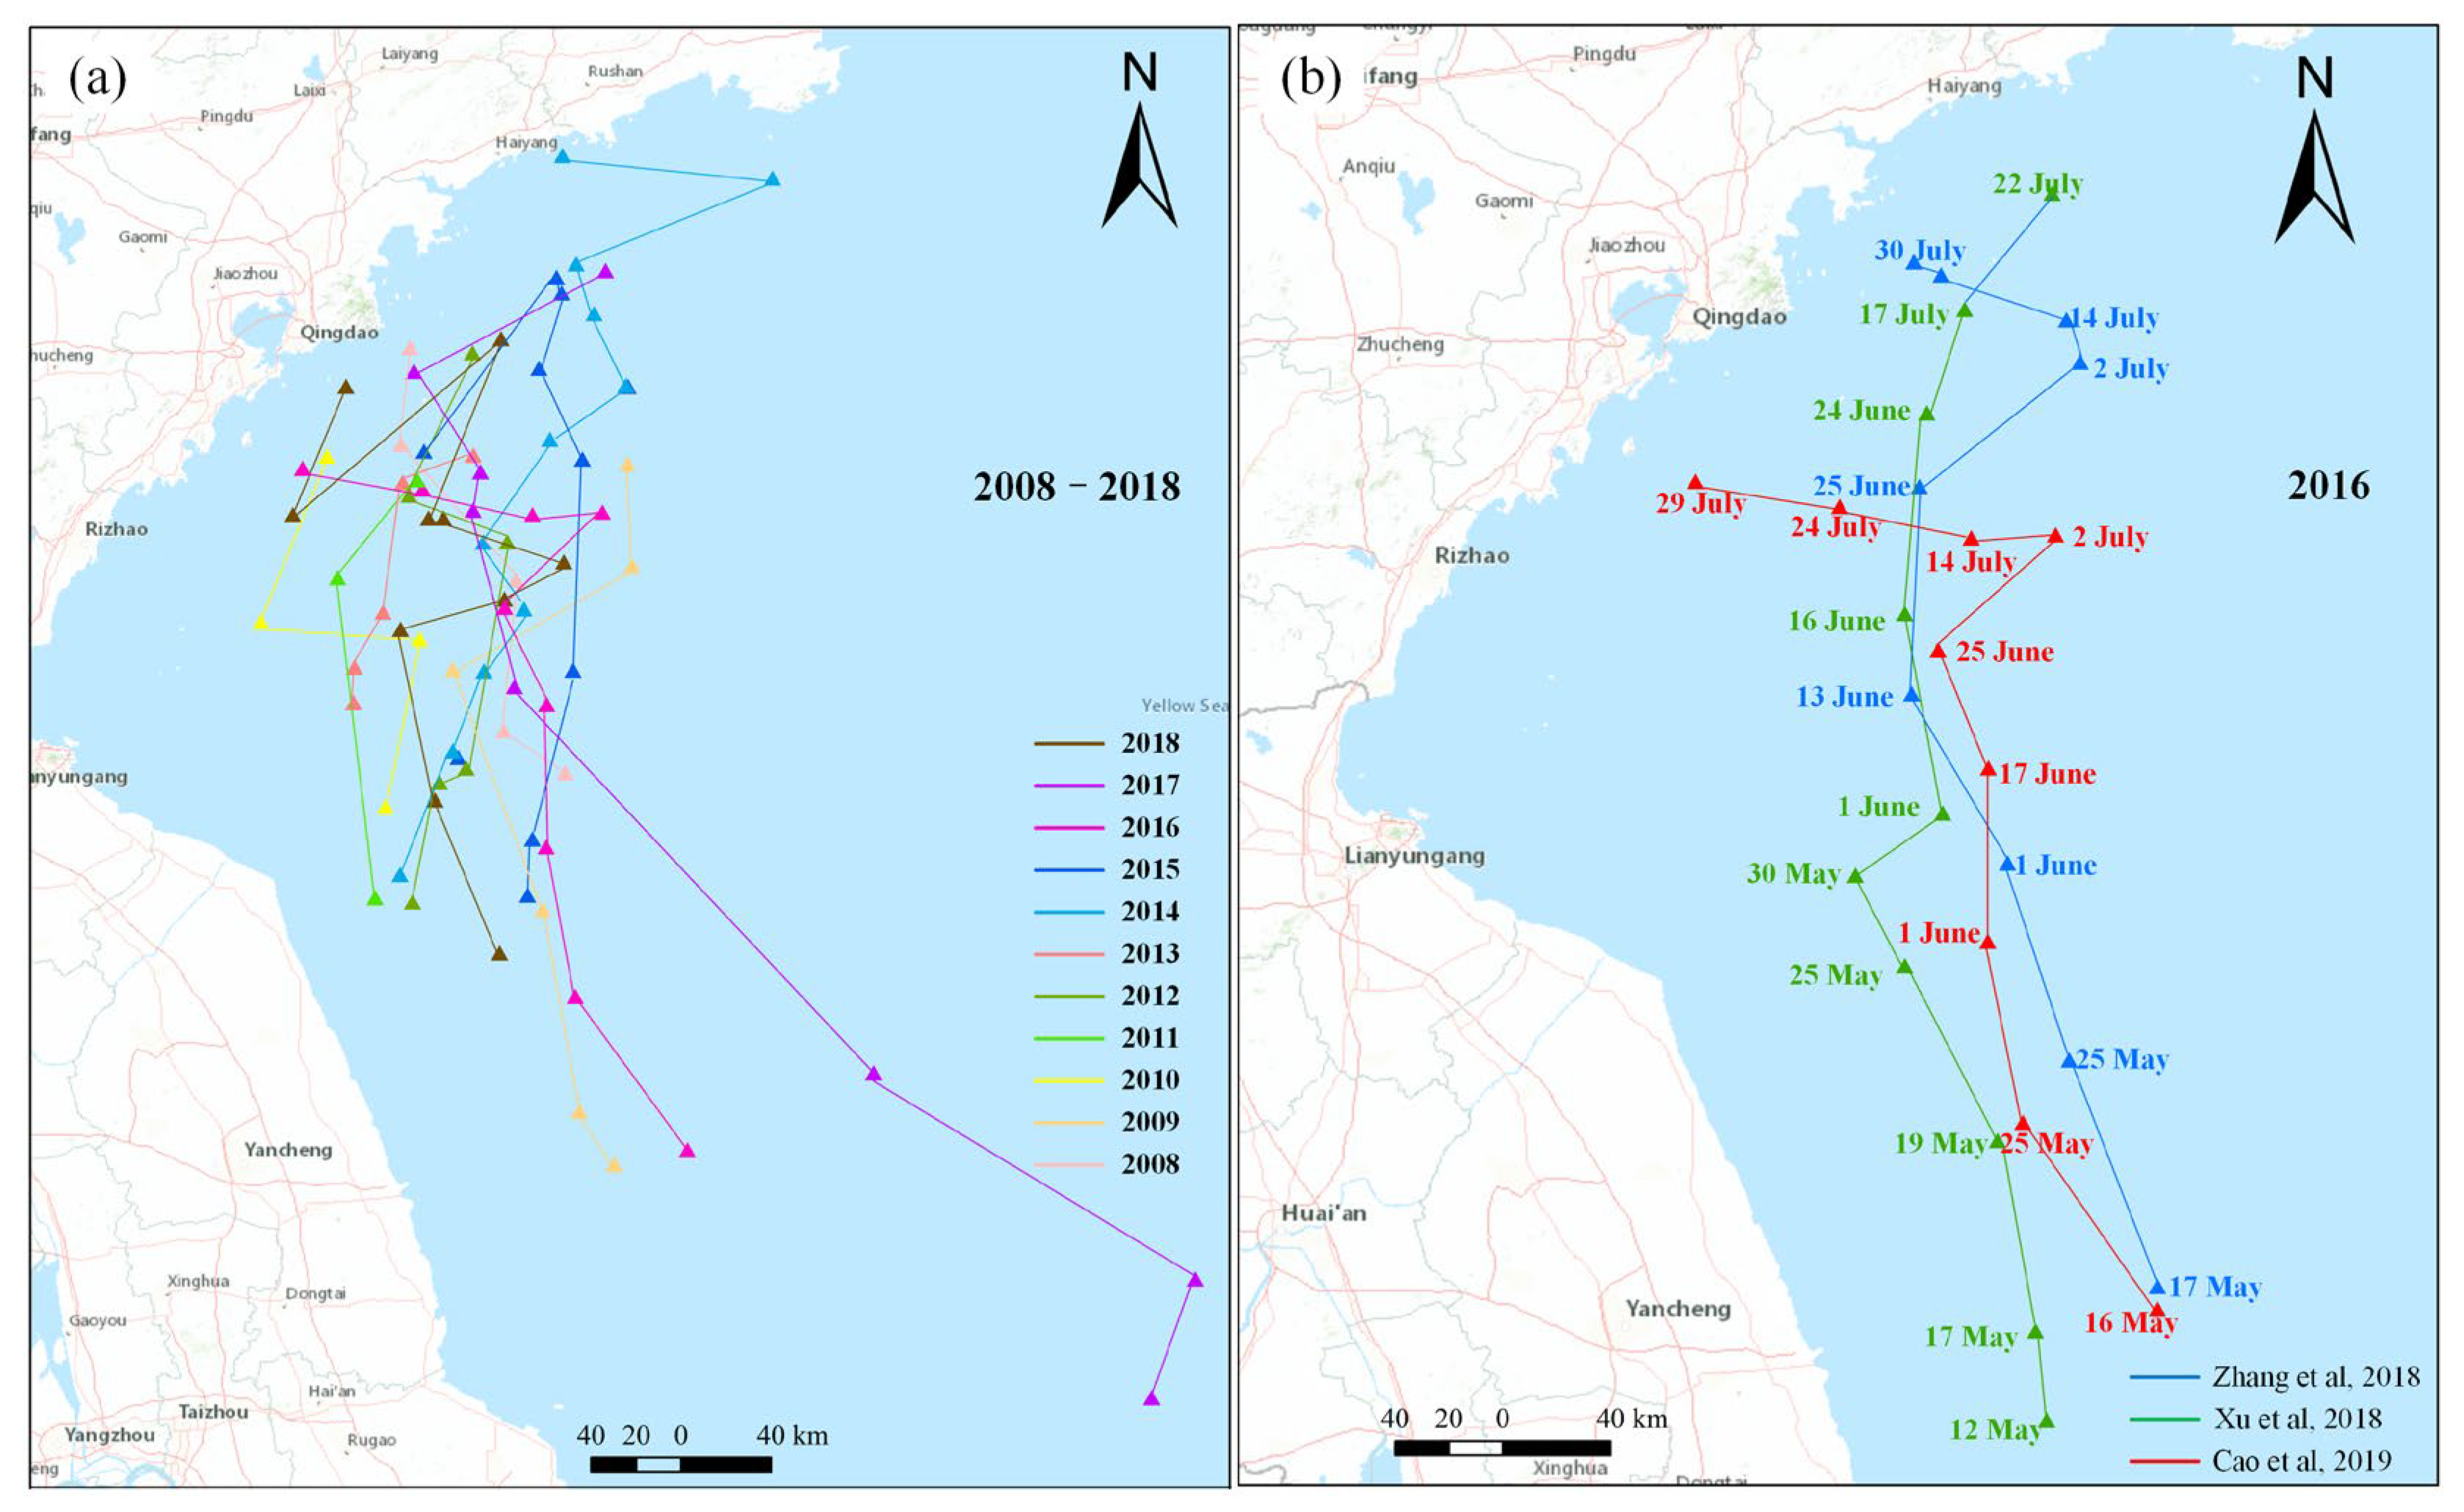
The quantified migration trajectories, derived from geometric or barycenter calculations, further highlight interannual spatiotemporal variations since 2007. These include differences in offshore distance and discrepancies in north–south or east–west movement (Figure 2a) [46,47,48]. The different methodologies for tracking the green macroalgae result in some discrepancies, such as the migration trajectory in 2016 (Figure 2b). Nevertheless, the floating path consistently exhibits a gradual northward drift.

3.1.2. Eastward Drifting

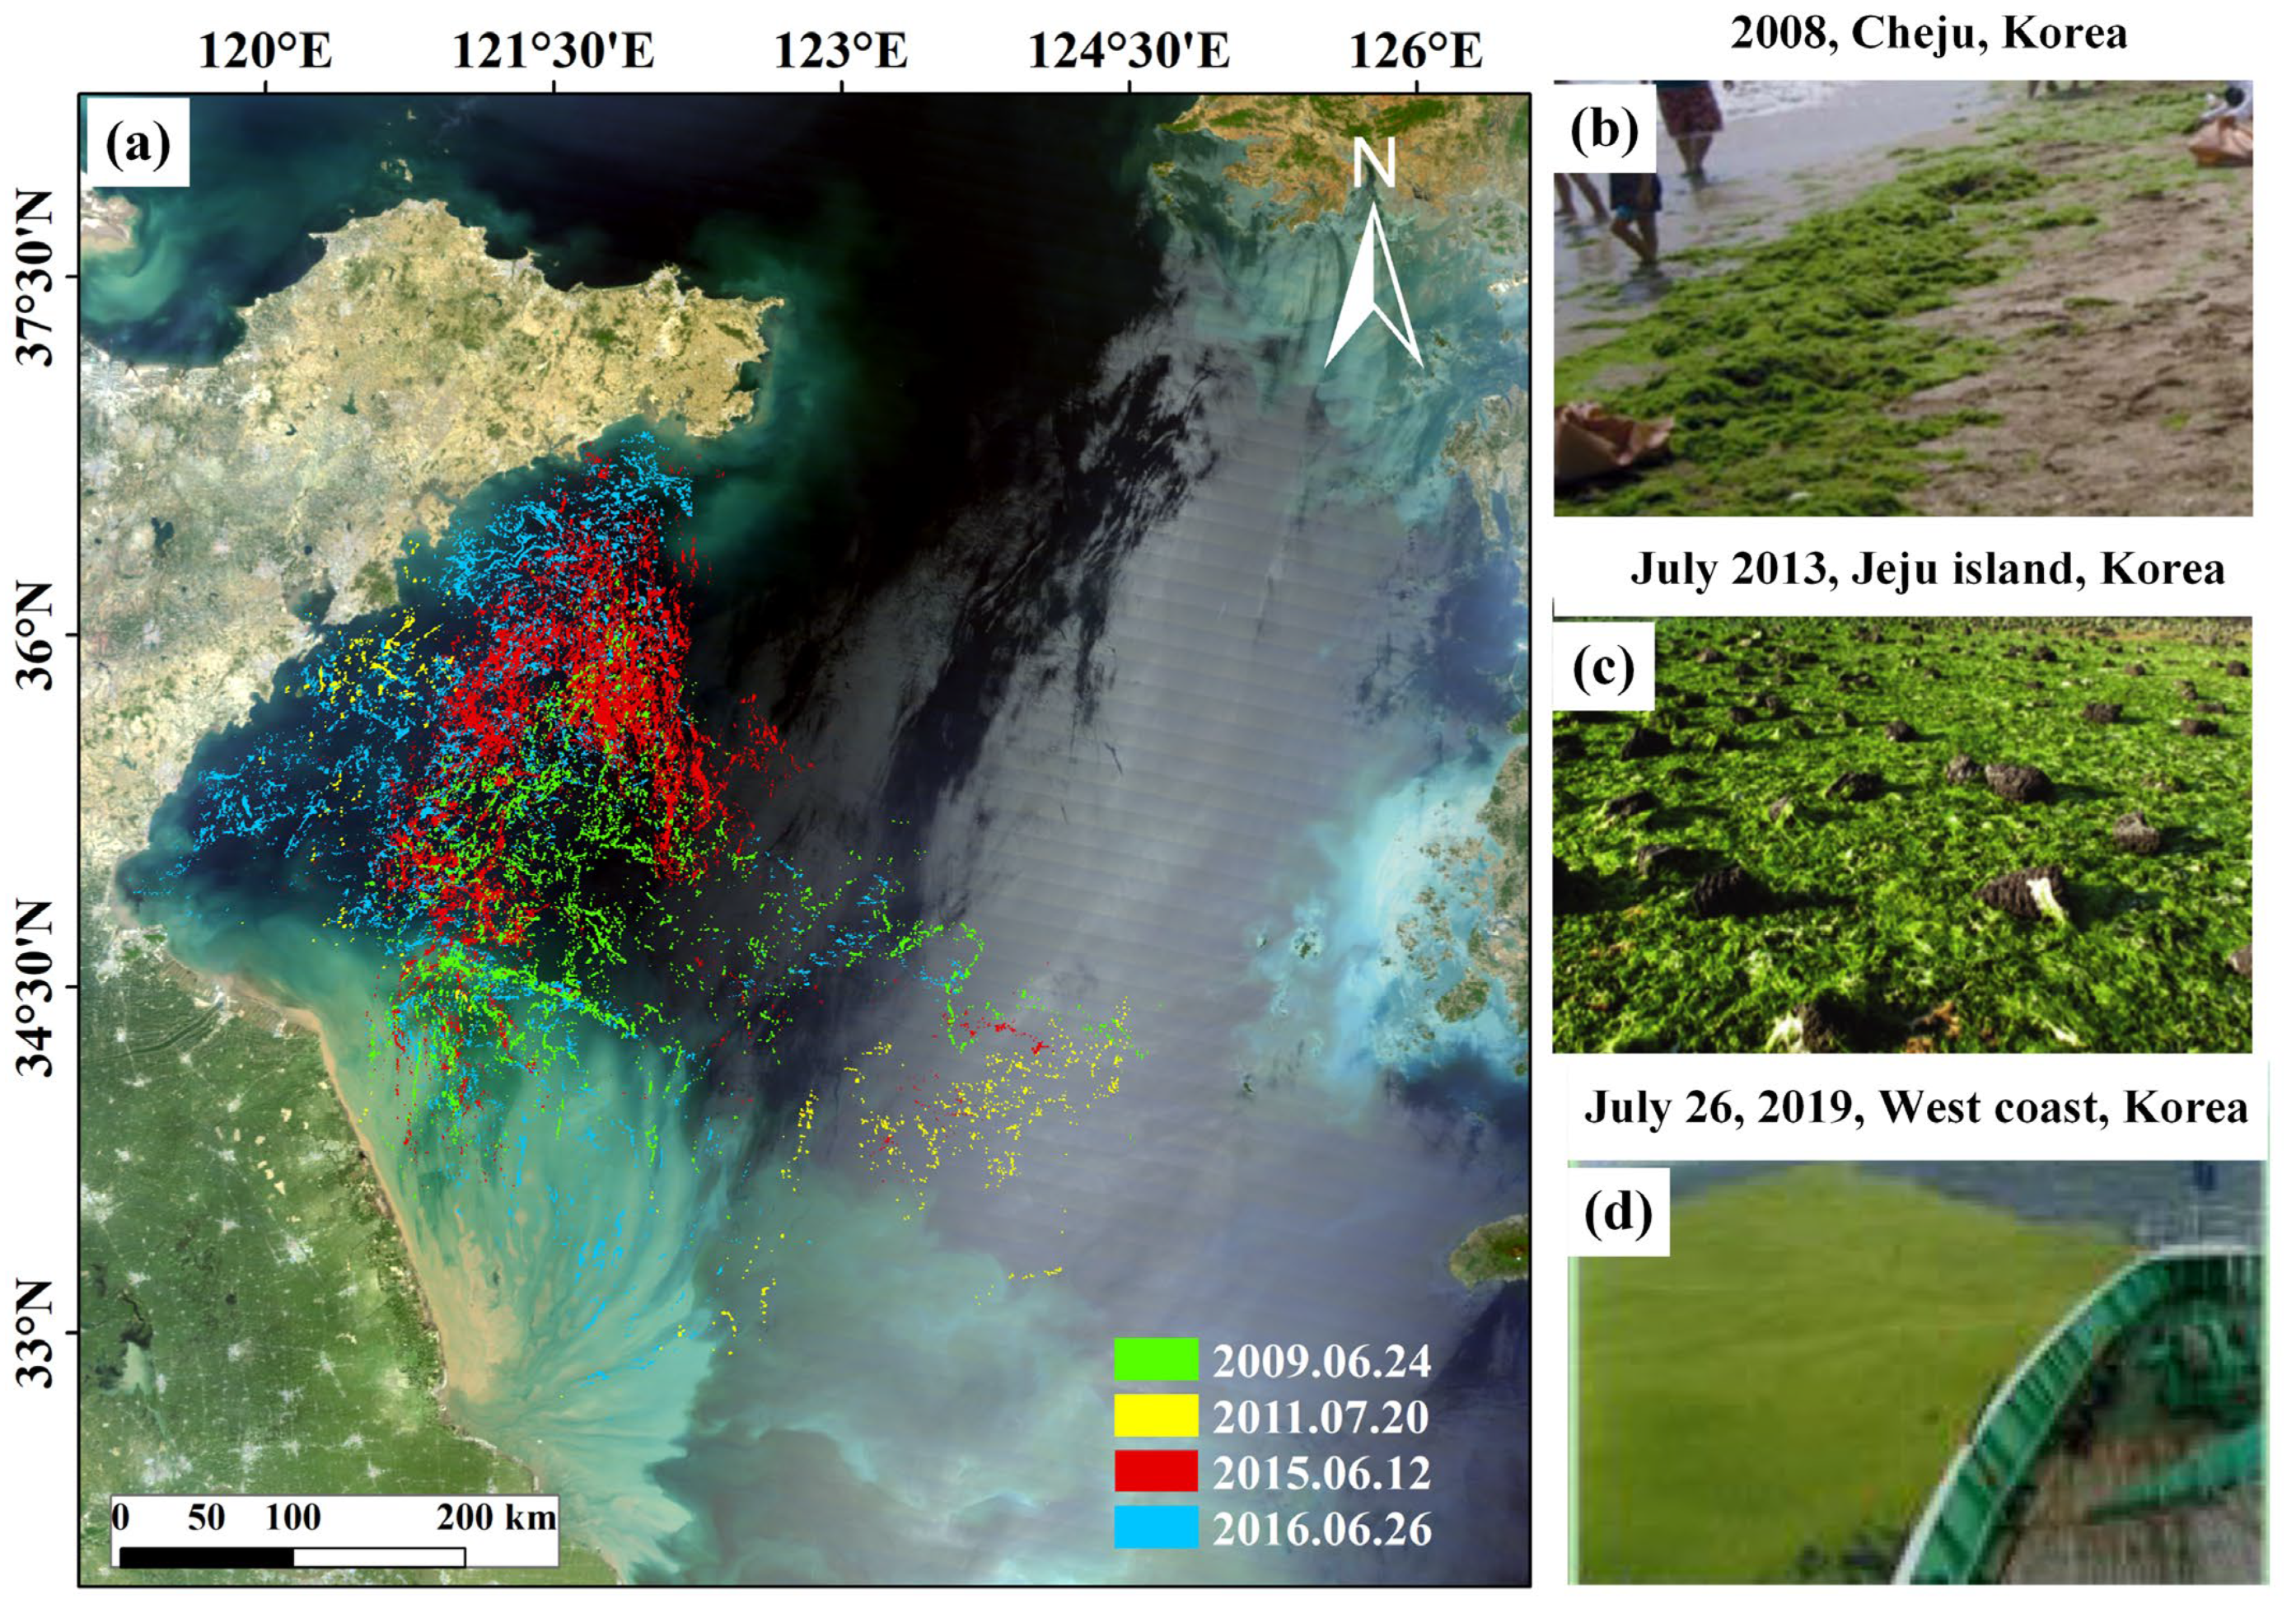
In addition to the primary northward path, rafting green macroalgae has been consistently observed in the eastern Yellow Sea and even off the west coast of Korea (Figure 3), indicating a recurrent eastward migration pathway. Documented occurrences of this eastward drift include 2008, 2009, 2011, 2012, 2015 and 2016 [17,29,33,36,48,49,50]. Typically, less than 4% of the green tide biomass from the western Yellow Sea was transported to the eastern Yellow Sea, with the exception of 2011, when the proportion reached 44% [17]. During this transit, algal biomass often decreased significantly due to limited nutrient levels in the middle Yellow Sea [49], leading to reduced growth and increased sinking. Compared to the predominant northward drift, the eastward drift of the green algae occurs less frequently and involves smaller amounts of biomass. However, its potential ecological implications remain significant, especially if floating algae reach Korean coast waters, where they could cause issues similar to those experienced in China.
Several mechanisms have been proposed to explain these atypical eastward transport events. Son et al. attributed the 2011 event to abnormal currents induced by Tropical Storm MEARI [36]. Similarly, Min et al. and Cao et al. linked the southeastward drift in July 2015 to typhoon-related wind and current anomalies caused by Typhoon Chan-hom [49,51]. In addition, Xing & Hu suggested that the southeast extension of turbid water plumes from the Subei Shoal could carry algae toward the central Yellow and East China Seas [29]. Nevertheless, the drivers of eastward migration in years without typhoon activity remain poorly understood. The role of nutrient supply in sustaining eastward-drifting algae is unclear. While the central and southern Yellow Sea are generally oligotrophic, some studies suggest that nutrient inputs from the Changjiang Diluted Water [50] or wind-driven upwelling of nutrient-rich deep water [49] may temporarily support algal growth during transit. Yet, these hypotheses lack empirical validation. In summary, current understanding of the initiation and maintenance of eastward migration is incomplete, highlighting the need for more targeted and mechanistic studies.
Figure 3. (a) Eastward-drifting green tides in the South Yellow Sea. Colored patches show satellite-detected macroalgae; (bd) in situ photos of green tides in the eastern Yellow Sea, sourced from (b) [49]; (c) [52]; (d) [17].
Diversity 17 00614 g003

3.2. Final Landing and Decomposing Process

The final phase of green macroalgae drift is marked by portions of the floating green algae accumulating along the southern coast of Shandong Province, while the remaining algae in the water sink to the seabed and decompose [53,54]. Typically concluding around August (Table 1), these processes show considerable spatiotemporal variability and have significant ecological and socioeconomic consequences.
The washing ashore of Ulva prolifera causes destructive damage to coastal aquaculture, imposes substantial economic costs for cleanup, negatively affects tourism, and leads to environmental degradation [10,55]. During decomposition, oxygen depletion occurs, along with the release of sulfide and ammonia, leading to mortality among abalone and sea cucumbers [56]. Furthermore, nutrients released from decaying macroalgae may trigger secondary blooms, including toxic microalgae responsible for “red tides” [56,57].
Landing patterns exhibit notable spatial and interannual variations. Studies indicate that the sequence of green tides landings along the Shandong Peninsula can be classified into two general patterns: one beginning in Rizhao and proceeding to Qingdao, Rushan, and Haiyang, and the other following the reverse order [58]. Although Qingdao most frequently experiences the largest biomass accumulations, unprecedented large stranding have also affected Lianyungang and Rizhao since 2015 [59]. Despite this, other landing variables, such as landing duration and landing volumes biomass show significant interannual fluctuations, though these aspects remain poorly studied.
The deposition and decomposition zones also vary considerably across years. Based on the distribution pattern of 28-isofucosterol content, one study identified a potential settlement region southeast of the Shandong Peninsula (around 122.66° E, 36.00° N) [54]. Based on spatial distribution of Ulva prolifera during dissipation phase, An et al. [58] proposed a broader depositional zone encompassing coastal waters off the Shandong Peninsula and the central waters of the South Yellow Sea (33°31′ N ~ 35°22′ N, 120°14′ E~122°8′ E), with offshore settlements dominating in certain years (e.g., 2007, 2010, 2014, 2015, and 2019) and inshore settlements in others. Similarly, Li et al. [60] reported that dissipation centers were consistently located near Qingdao, within an 80 km radius. Utilizing remote sensing data with higher spatial resolutions and C/N values, Zhang et al. [61] identified primary decomposition regions that were located south of the Shandong Peninsula (35.2–37° N, 120.3–123° E). However, without laboratory measurements to verify the findings, the reliability of the satellite-estimated results remains uncertain.
A major limitation across these satellite-based studies is the reliance on indirect methods without sufficient ground-truthing. Thus, future studies should prioritize field observations and experimental verification to better understand the dynamics and environmental impacts of green tide landing and decomposition.

4. Interannual Variability in the Size of Green Tide Bloom

The bloom size, typically expressed by the annual maximum daily macroalgal biomass, can be intuitively displayed through satellite observations. As shown in Xing et al. [13], the spatiotemporal characteristics of green tides, including their geographical distribution and annual extension patterns, are clearly depicted. In addition to these intuitive and visual representations, another common approach involves quantifying the macroalgal coverage or biomass.

4.1. Macroalgae Coverage

Two common methods are used to quantify the bloom size of Ulva prolifera: algae-mixed pixel coverage, which represents a collection of pixels corresponding to Ulva prolifera identified directly from remote sensing images under the pure pixel assumption [3], and pure algae coverage, which is derived by correcting for the mixed pixel effect [18,19,28,31]. Using proxies such as the maximum daily Ulva prolifera algae-mixed pixel coverage or pure algae coverage, several studies have been conducted to explore the interannual variations in bloom size [13,20,22,45,62].
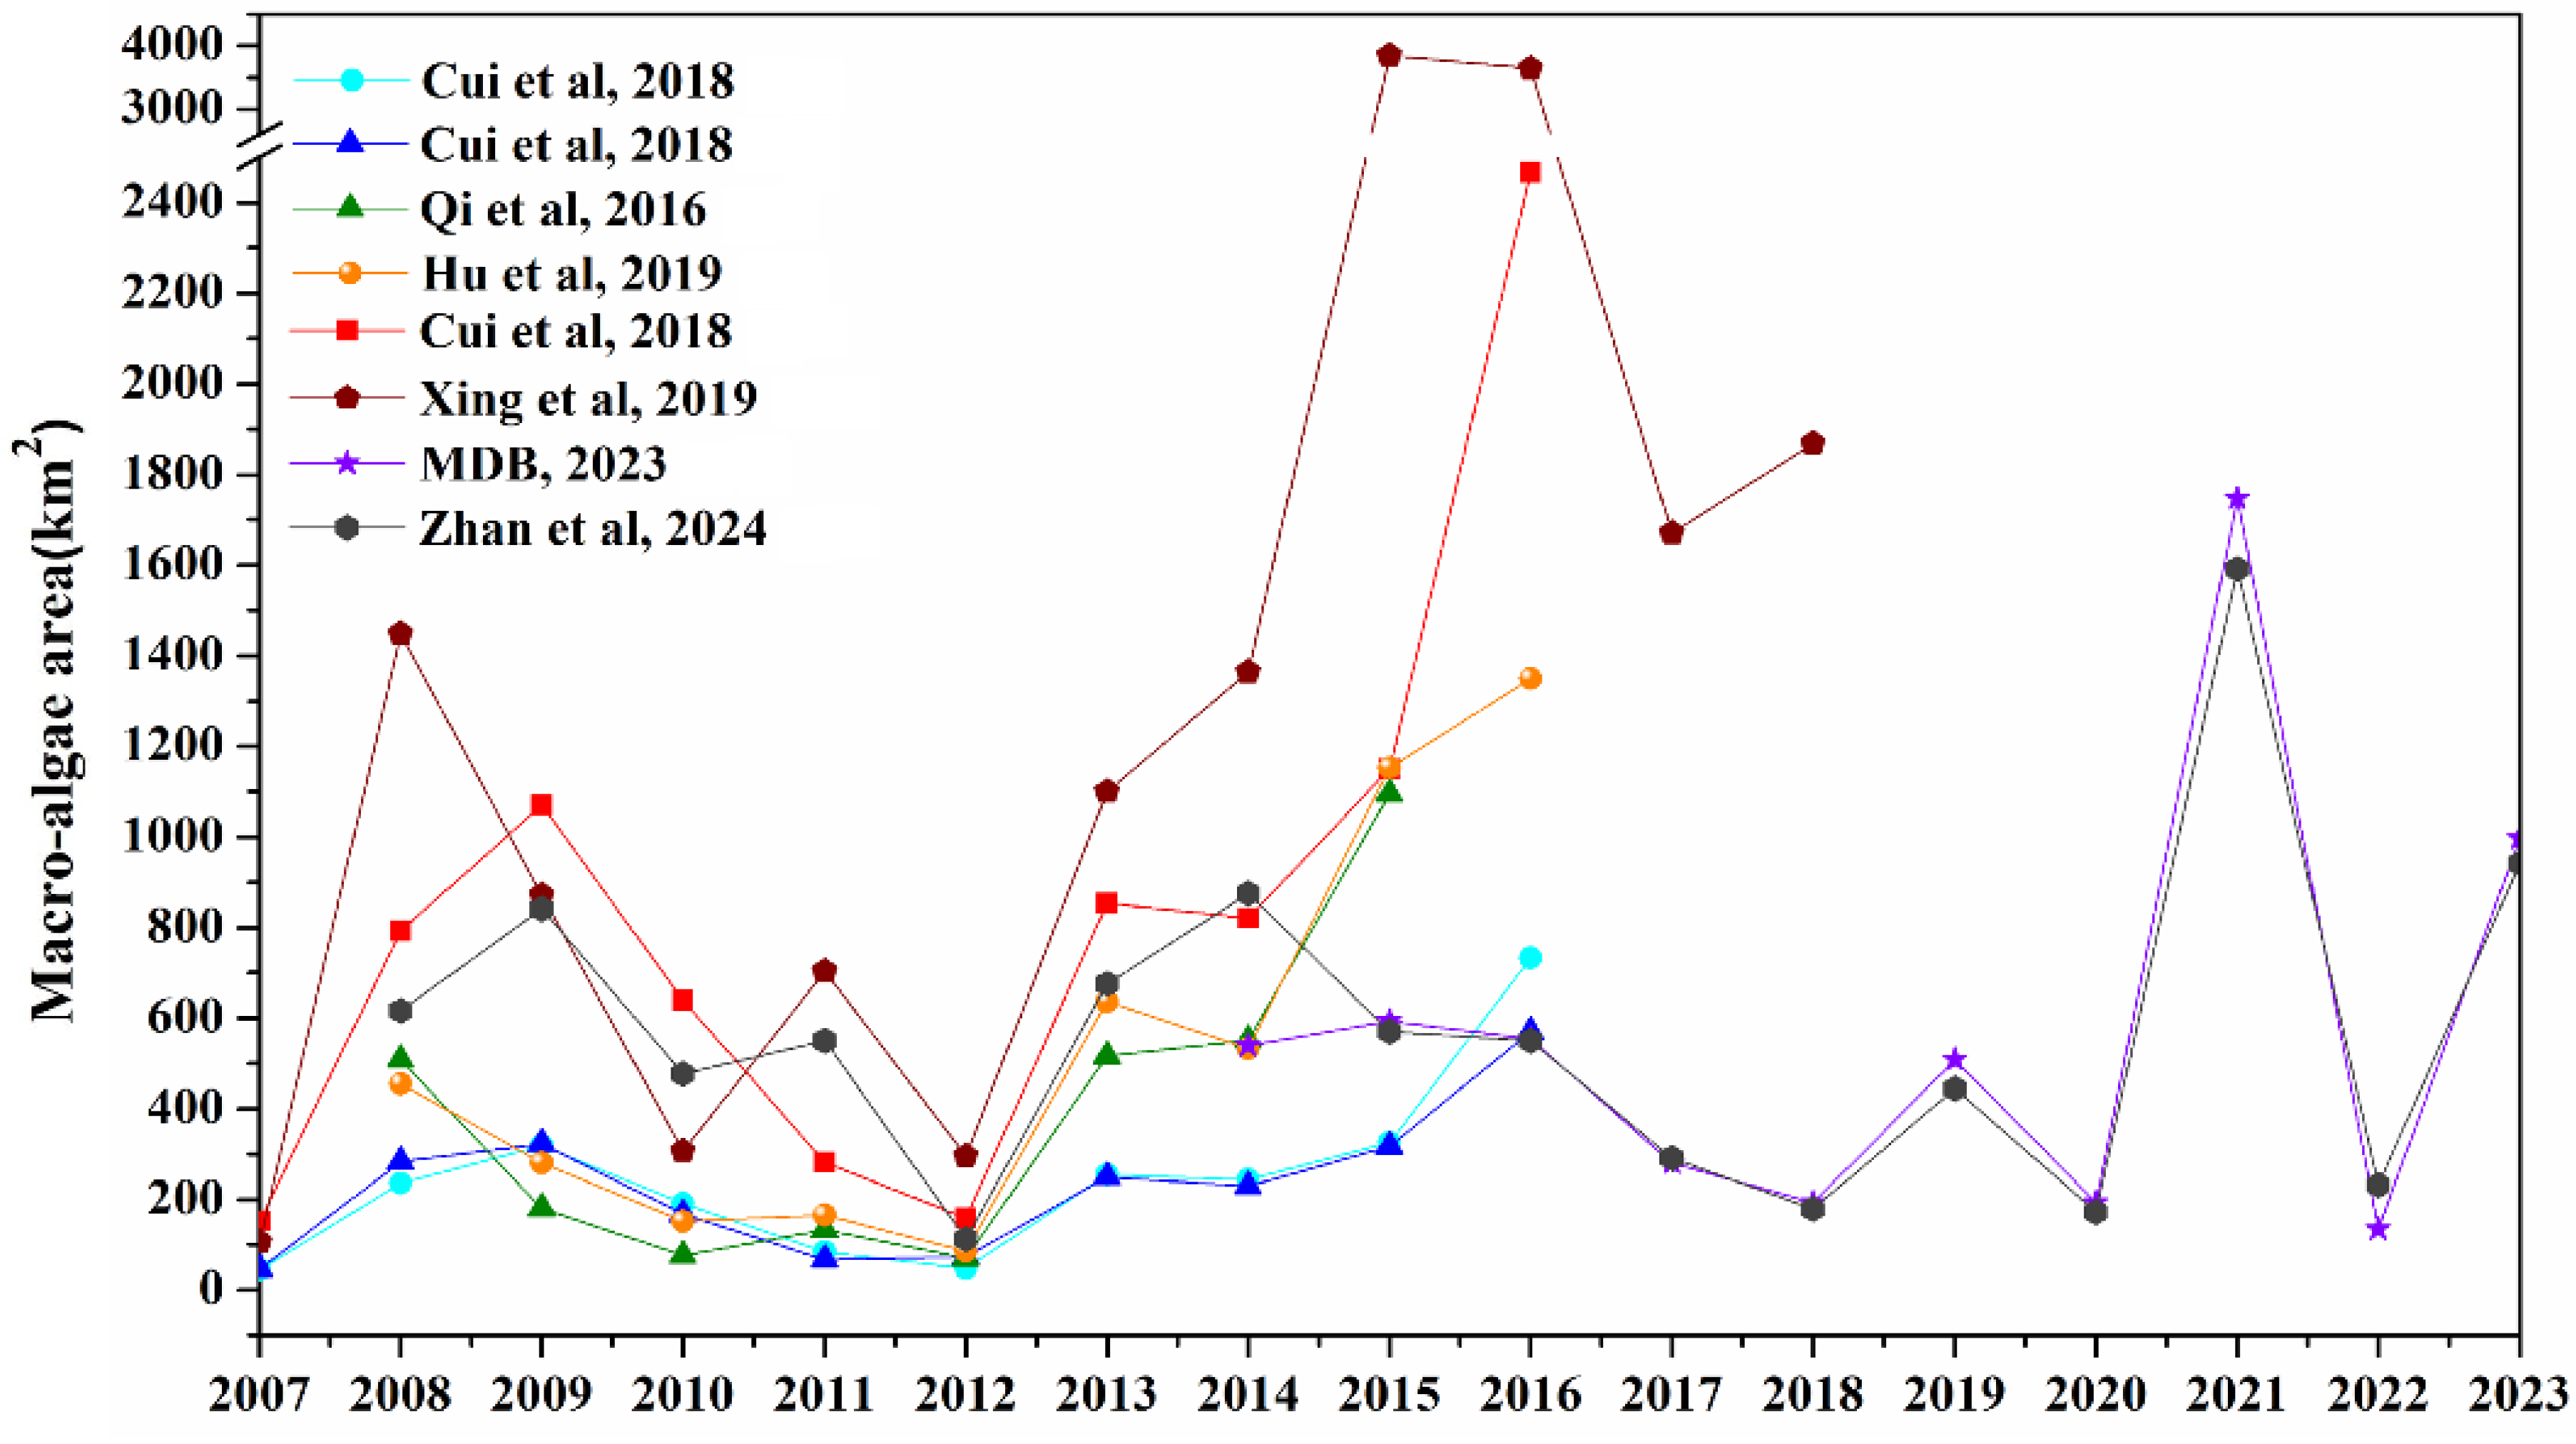
As summarized in Figure 4, the bloom size of green tides exhibited significant interannual changes, with notable differences observed across years. A key observation is that algae-mixed pixel coverage was 1.5 to 20.0 times larger than pure algae coverage, likely due to the mixed pixel effect [28]. After pixel unmixing, this difference was reduced to no more than 2.0 times for studies between 2008 and 2012 [20,28,31]. From 2013 to 2018, however, differences remained higher, ranging from 2.5 to 3.6 times.
These variations may arise from methodological differences, such as differences in the indices used, how algae-containing pixels were treated, and the thresholds applied for distinguishing algae from surrounding water during pixel un-mixing [28]. Estimates derived from high-resolution imagery were closer to the actual value [63]. Since 2015, even without pixel unmixing, the extraction areas derived from high-resolution images exhibited a high degree of consistency between MDB [64] and Zhan et al. [65].
Figure 4. Annual maximum daily macroalgal covering area in the Yellow Sea from 2007 to 2023. Annual maximum daily macroalgal covering area in the Yellow Sea from 2007 to 2023. The red dots represent Cui et al.’s statistical mixed-pixel correction [28]; blue triangles and red squares represent their additional results using DVI-based linear unmixing and NDVI under the pure-pixel assumption [28]; green triangles and orange dots depict FAI-based linear unmixing results from Qi et al. [20] and Hu et al. [31]; the wine-colored pentagon indicates Xing et al.’s DVI results under the pure-pixel assumption [13]; purple stars correspond to the Bulletin of China Marine Disaster (2023) [64]; and dark gray hexagons represent peak coverage from Zhan et al. [65]. In addition to the most striking numerical difference, the yearly fluctuations also exhibit considerable variation (Figure 4). For instance, the peak year, either before or after 2012 (which had the lowest algae coverage), varied significantly. Before 2012, studies by Cui et al. [28] and Zhang et al. [3] identified a sudden burst in 2009, while other studies reported the peak year as 2008. This inconsistency is also observed in other researches (Figure 5). After 2012, according to MDB [64] and Zhan et al. [65], the maximum daily coverage was in 2021. The distinct methodological differences and inconsistent thresholds, as mentioned above, are certainly responsible for this inconsistency [66]. In addition to this, the daily maximum obtained from a cloud-free day may be several days or weeks away from the real maximum day; the differences in the identified maximal bloom day across studies may be the main factor contributing to this inconsistency (Table 2) [66]. To address this issue, Qi et al. [40] applied image composition to remove clouds and other artifacts to estimate monthly mean biomass and bloom size.
Diversity 17 00614 g004

4.2. Macroalgae Biomass

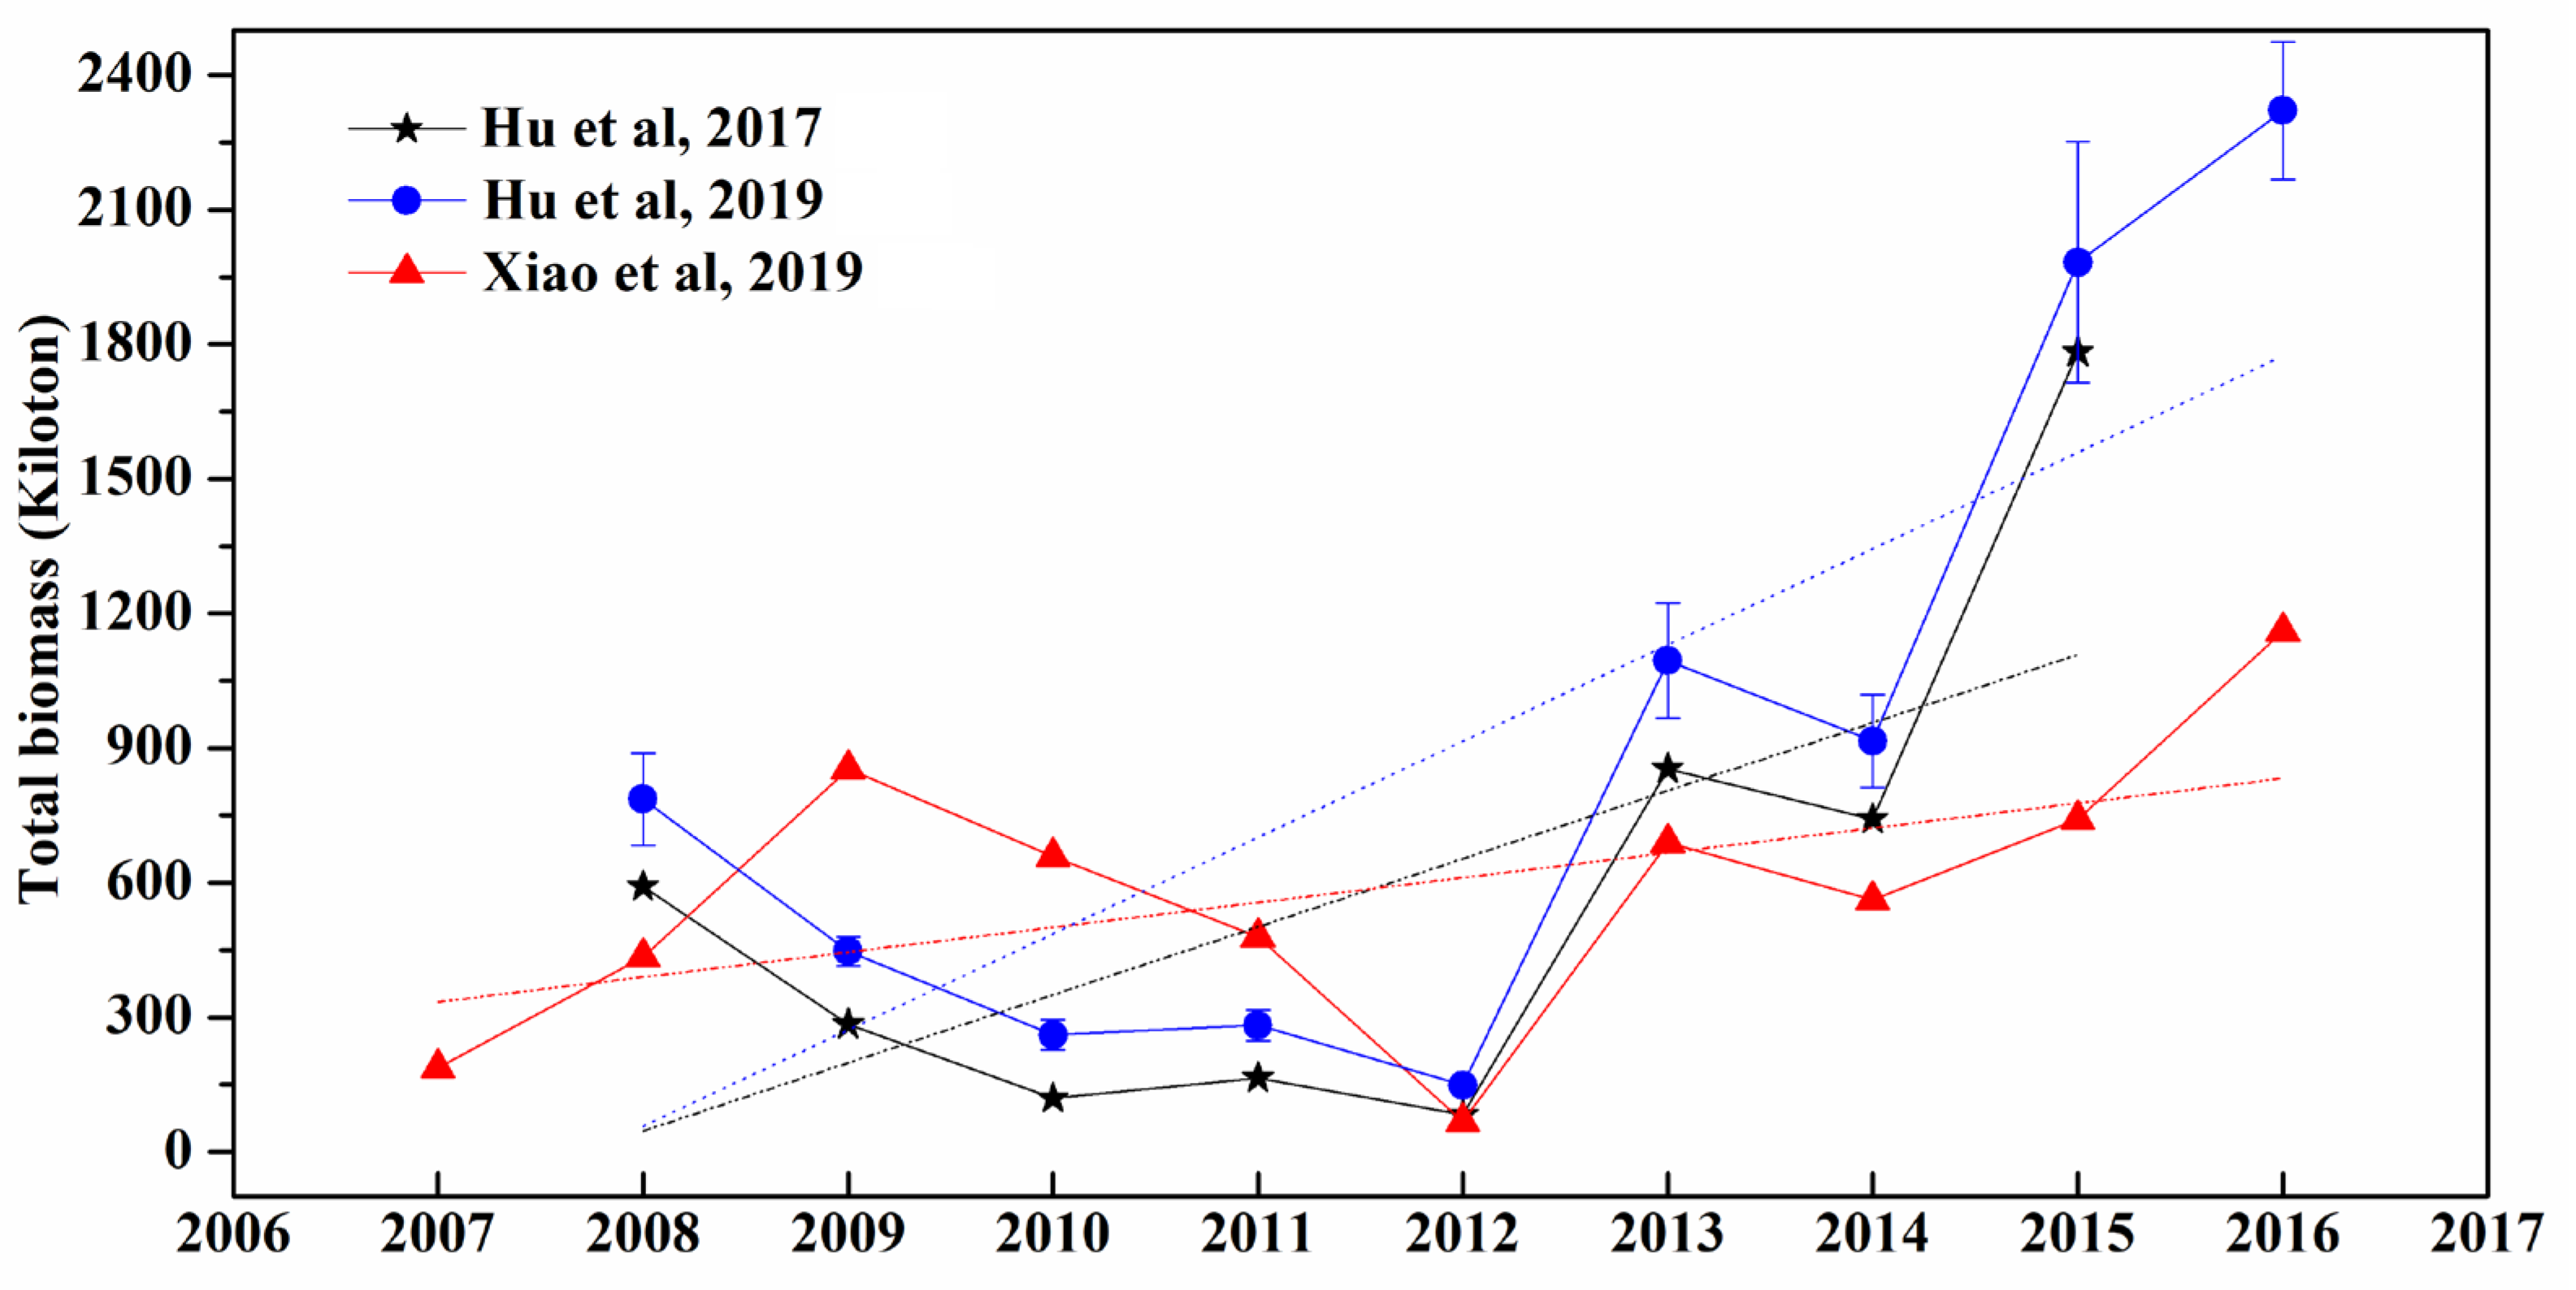
Total biomass, compared to the coverage area, provides a more reliable indicator of the severity of green tide blooms. However, while extensive research has focused on the macroalgae coverage, studies estimating biomass remain relatively limited [18,19,31]. In practice, green tide biomass is mostly derived by converting pure algae coverage using specific conversion equations. Thus, the interannual patterns (Figure 5) of macro-algal biomass closely resemble those of macro-algal coverage. Similar to coverage, the biomass estimates differ substantially. For instance, the maximum biomass for 2016, estimated by Hu et al. [31] at around 2321 ± 154 kilotons, is nearly twice the biomass estimate (approximately 1190 kilotons) reported by Xiao et al. [18]. Meanwhile, a clear increasing trend in macroalgal biomass can be observed.
Significantly, all the algal biomass estimates made so far have neglected the influence of floating algae thickness on estimation accuracy. Lu et al. indicated that the thickness effects contribute approximately 36% to the uncertainty in total biomass estimation, while around 43% of the overall uncertainty is attributed to a few pixels with high MODIS-derived FAI values (FAI > 0.05) [67].

5. Factors Leading to the Variations

5.1. Abiotic Factors

Nutrient supply serves as the primary driver for the rapid growth of marine macroalgae [68]. In the Jiangsu shoal, coastal eutrophication, as indicated by the area-weighted nutrient pollution (AWCPI-NP) index, increased by 45% from 2007 to 2012 compared to that of 2001–2006 [5]. Elevated concentrations of nutrient species, particularly dissolved inorganic nitrogen (DIN), have facilitated both the extensive expansion and prolonged duration of green tides, thereby determining their seasonal pattern [69]. As reported by Li et al. [70], the biomass of Ulva prolifera is positively correlated with DIN concentrations (Spearman correlations, r = 0.84, p < 0.001) from late March to April. When nutrient availability is sufficient, dissolved inorganic phosphorus (DIP) becomes the key limiting factor for phytoplankton biomass [41].
To investigate the relationship between nutrient availability and the biomass of Ulva prolifera blooms on an interannual scale, Xiao et al. assumed the Sheyang river to be a significant nutrients source for the Yellow Sea and reported a significant positive correlation (r = 0.52, p < 0.01) between the annual maximum biomass of Ulva prolifera and the total nutrient load from the Sheyang River [18]. However, factors other than river discharge, such as terrestrial input, aquaculture wastewater, atmospheric deposition, submarine groundwater discharge, and nutrient uptake by macroalgae, also significantly influence nutrient concentrations [68]. Therefore, the correlation found by Xiao et al. [18] is insufficient to explain the interannual variation. To date, the role of nutrients in driving these interannual fluctuations remains unclear, primarily due to the lack of long-term nutrient data [20].
Temperature has a significant impact on Ulva germination and vegetative growth [71]. Under nutrient-rich conditions, temperature is the key abiotic factor that influences biomass accumulation and species succession during the initial phase [26,72]. The initial biomass of Ulva prolifera showed a strong correlation with SST in March from 2011 to 2016 [14]. From May to July, water temperature ranges from 15 °C to 25 °C, creating suitable conditions for the growth of green macroalgal [57]. Within this range, Ulva prolifera exhibits the highest growth rates at temperatures ranging between 17 °C and 22 °C [65]. However, extreme high temperatures, such as the prolonged heatwave (>30 °C) that lasted for more than a month in 2017, greatly inhibited algal growth [17] and slowed the expansion of the algal blooms [52]. Despite these effects, changes in SST have no significant effect on the interannual variability of the floating Ulva prolifera biomass [20,45].
Besides nutrients and temperature, several abiotic factors, such as salinity, light intensity, and pH, also influence the productivity of Ulva prolifera [16,70]. However, none of these factors alone can fully explain the spatial-temporal variability in the growth of Ulva prolifera [16]. Ulva prolifera exhibits a strong capacity to adapt to a wide range of environmental conditions [6]. Therefore, the variation in the Ulva prolifera species may be influenced by a range of environmental factors acting in a complex and non-linear manner. Moreover, as reported by Jin et al. [14], different abiotic factors played different roles during different growth phases of Ulva prolifera. Thus, comprehensive and multi-disciplinary field studies are essential for understanding the annual variations.

5.2. The Rapid Expansion and Cultivation of Porphyra Mariculture in Jiangsu Province

Ulva prolifera in the Yellow Sea is believed to have originated from the raft frames used for Porphyra cultivation along the coast of Jiangsu Province [13,18]. Annually, approximately 6500 tons of Ulva prolifera detach from the Porphyra rafts, with 62% floating on the surface water, ultimately leading to the formation of massive green tide blooms [10]. The Porphyra aquaculture area has increased sharply since 2007, with rapid expansion occurring on offshore tidal flats of the Sansha region. In these areas, attached Ulva prolifera can quickly drift into the Northern Yellow Sea [73]. Statistically, the maximum daily Ulva prolifera shows a relatively high coefficient (r = 0.63) with the Porphyra cultivation area in the northern part of the Jiangsu Shoal [13], underscoring its significant role in the interannual variation of Ulva prolifera.
In addition to the scale of Porphyra cultivation, Xing et al. suggested that the timing of raft recycling [13], which influences early macroalgal biomass accumulation, may also be a key factor influencing the interannual biomass of Ulva prolifera. Shao et al. [24] further noted that geographical features and farming patterns of Porphyra in Subei Shoal triggered the formation of massive floating Ulva prolifera. Nevertheless, without statistically meaningful evidence, the extent to which these factors contribute to interannual variation remains unclear.

5.3. Monsoons and Ocean Currents

Southeastward monsoons prevail in the Yellow Sea from May to July, driving the movement of surface ocean particles and thus facilitating the northward migration of green tides [2,74]. Consequently, interannual variation in the local monsoon wind field, which is controlled by or lags behind the climatological variation of the atmospheric-oceanic system [74], is one of the key factors influencing the migration direction and distribution patterns of green tides [47]. In addition, the wind-induced Subei Coastal Current, along with residual tidal cycles and tidal movements, also affects the dispersal of green tides [44]. Instances of anomalous eastward transport (see Section 3.1) demonstrate how atypical meteorological and oceanographic conditions can override usual patterns. Hence, while seasonal monsoons and associated currents account for the general northward drift and its interannual variations, transient extreme events and local hydrography are also critical in determining ultimate dispersal pathways.
Among the dynamic factors discussed above, eutrophication has been proposed as the primary factor of extensive green tide outbreaks [10,16]. However, this explanation cannot account for the absence of large-scale floating green tides in other eutrophic regions with Porphyra aquaculture, such as those in Zhejiang and Fujian provinces [24]. While studies have suggested that micropropagules from aquaculture rafts contribute to green tide initiation [72,75], the persistence and even expansion of these outbreaks since the implementation of source control measures in 2019 remain poorly understood [76]. To date, the exact mechanisms driving the recurrence of Ulva prolifera blooms have not been fully determined.

6. Concluding Remarks and Research Perspectives

Green tides have consecutively appeared every summer in the Yellow Sea for the past 16 years. Extensive studies have significantly enhanced our understanding of their spatiotemporal variations, the interannual variability in bloom size, and possible factors driving these fluctuations. However, many questions still remain unanswered.
(1) There are still significant gaps in our understanding of the long-distance movement of Ulva prolifera. Satellite monitoring has identified eastward drift events in 2008, 2009, 2011, 2015, and 2016. Nevertheless, detailed information on these eastward drifts, including their spatial-temporal dynamics, underlying causes, and migration mechanisms, remains unclear. Even for the more common northward movement, no reliable and effective quantitative method currently exists to accurately characterize interannual variations. Additionally, substantial knowledge gaps persist regarding the final landing and decomposition processes of Ulva prolifera.
(2) Estimates of the areal coverage and corresponding biomass of Ulva prolifera show considerable discrepancies. The macroalgae are typically distributed in patches of varying sizes or banded stripes with diverse shapes [15,25,31]. Consequently, the derived distribution patterns and estimated coverage areas vary substantially across remote sensing images with different resolutions. This inconsistency raises the question: which data is reliable? Simultaneous field investigation may be necessary to explore more reliable and universal methods for estimating algae coverage or biomass. Moreover, there is an urgent need for robust automatic macroalgal detection systems that minimize subjective interference. Ongoing research on the spatial distribution of floating Ulva prolifera thickness will enhance the accuracy of biomass estimates in the Yellow Sea.
(3) The dynamic factors outlined above, along with their interactions, contribute to the interannual variability in bloom size, the sudden outbreak in 2007, and the sharp decline in 2017. Although compelling evidence suggests that seaweed aquaculture influences the scale of green tides, other mechanisms driving these fluctuations require further investigation to develop effective control strategies. Therefore, comprehensive, multi-disciplinary studies incorporating field studies, laboratory research, and ecological modeling are essential to deepen our understanding of Ulva biology and physiology in order to clarify the observed patterns.

Author Contributions

Conceptualization, writing—original draft preparation, F.Q. and B.S.; writing—review and editing, L.M. and T.Z.; visualization, funding acquisition, L.M. and T.Z. All authors have read and agreed to the published version of the manuscript.

Funding

This research was funded by the National Natural Science Foundation of China (42406193) and the Shandong Provincial Natural Science Foundation, China (ZR2023MD046; ZR2020QD092).

Institutional Review Board Statement

Not applicable.

Informed Consent Statement

Not applicable.

Data Availability Statement

The raw data supporting the conclusions of this article will be made available by the authors on request.

Conflicts of Interest

The authors declare no conflicts of interest.

References

  1. Smetacek, V.; Zingone, A. Green and golden seaweed tides on the rise. Nature 2013, 504, 84–88. [Google Scholar] [CrossRef]
  2. Ye, N.; Zhang, X.; Mao, Y.; Liang, C.; Xu, D.; Zou, J.; Zhuang, Z.; Wang, Q. ‘Green tides’ are overwhelming the coastline of our blue planet: Taking the world’s largest example. Ecol. Res. 2011, 26, 477–485. [Google Scholar] [CrossRef]
  3. Zhang, Y.; He, P.; Li, H.; Li, G.; Liu, J.; Jiao, F.; Zhang, J.; Huo, Y.; Shi, X.; Su, R.; et al. Ulva prolifera green-tide outbreaks and their environmental impact in the Yellow Sea, China. Natl. Sci. Rev. 2019, 6, 825–838. [Google Scholar] [CrossRef] [PubMed]
  4. Wang, W.; Zhang, G.; Sun, X.; Zhang, F.; Zhang, X. Temporal variability in zooplankton community in the western Yellow Sea and its possible links to green tides. PeerJ 2019, 7, e6641. [Google Scholar] [CrossRef] [PubMed]
  5. Hu, Y.; Liu, C.; Yang, G.; Zhang, H. The response of the carbonate system to a green algal bloom during the post-bloom period in the southern Yellow Sea. Cont. Shelf Res. 2015, 94, 1–7. [Google Scholar] [CrossRef]
  6. Zhang, X.; Song, Y.; Liu, D.; Keesing, J.; Gong, J. Macroalgal blooms favor heterotrophic diazotrophic bacteria in nitrogen-rich and phosphorus-limited coastal surface waters in the Yellow Sea. Estuar. Coast. Shelf Sci. 2015, 163, 75–81. [Google Scholar] [CrossRef]
  7. Xing, Q.; Wu, L.; Tian, L.; Cui, T.; Li, L.; Kong, F.; Gao, X.; Wu, M. Remote sensing of early-stage green tide in the Yellow Sea for floating-macroalgae collecting campaign. Mar. Pollut. Bull. 2018, 133, 150–156. [Google Scholar] [CrossRef]
  8. Liu, D.; Keesing, J.; Xing, Q.; Shi, P. World’s largest macroalgal bloom caused by expansion of seaweed aquaculture in China. Marine Pollution Bulletin. Mar. Pollut. Bull. 2009, 58, 888–895. [Google Scholar] [CrossRef]
  9. Hu, C.; He, M. Origin and Offshore Extent of Floating Algae in Olympic Sailing Area. Trans. Am. Geophys. Union. 2008, 89, 302–303. [Google Scholar] [CrossRef]
  10. Wang, Z.; Xiao, J.; Fan, S.; Li, Y.; Liu, X.; Liu, D. Who made the world’s largest green tide in China?—An integrated study on the initiation and early development of the green tide in Yellow Sea. Limnol. Oceanogr. 2015, 60, 1105–1117. [Google Scholar] [CrossRef]
  11. Lee, J.; Pang, I.; Moon, I.; Ryu, J. On physical factors that controlled the massive green tide occurrence along the southern coast of the Shandong Peninsula in 2008: A numerical study using a particle-tracking experiment. J. Geophys. Res. Ocean. 2011, 116, C12036. [Google Scholar] [CrossRef]
  12. Qiao, F.; Dai, D.; Simpson, J.; Svendsen, H. Banded structure of drifting macroalgae. Mar. Pollut. Bull. 2009, 58, 1792–1795. [Google Scholar] [CrossRef]
  13. Xing, Q.; An, D.; Zheng, X.; Wei, Z.; Wang, X.; Li, L.; Tian, L.; Chen, J. Monitoring seaweed aquaculture in the Yellow Sea with multiple sensors for managing the disaster of macroalgal blooms. Remote Sens. Environ. 2019, 231, 111279. [Google Scholar] [CrossRef]
  14. Jin, S.; Liu, Y.; Sun, C.; Wei, X.; Li, H.; Han, Z. A study of the environmental factors influencing the growth phases of Ulva prolifera in the southern Yellow Sea, China. Mar. Pollut. Bull. 2018, 135, 1016–1025. [Google Scholar] [CrossRef] [PubMed]
  15. Zhou, M.; Liu, D.; Anderson, D.; Valiela, I. Introduction to the Special Issue on green tides in the Yellow Sea. Estuar. Coast. Shelf Sci. 2015, 163, 3–8. [Google Scholar] [CrossRef]
  16. Liu, D.; Keesing, J.K.; He, P.; Wang, Z.; Shi, Y.; Wang, Y. The world’s largest macroalgal bloom in the Yellow Sea, China: Formation and implications. Estuar. Coast. Shelf Sci. 2013, 129, 2–10. [Google Scholar] [CrossRef]
  17. Kim, K.; Shin, J.; Kim, K.Y.; Ryu, J. Long-Term Trend of Green and Golden Tides in the Eastern Yellow Sea. J. Coast. Res. 2019, 90, 317–323. [Google Scholar] [CrossRef]
  18. Xiao, Y.; Zhang, J.; Cui, T.; Gong, J.; Liu, R.; Chen, X.; Liang, X. Remote sensing estimation of the biomass of floating Ulva prolifera and analysis of the main factors driving the interannual variability of the biomass in the Yellow Sea. Mar. Pollut. Bull. 2019, 140, 330–340. [Google Scholar] [CrossRef]
  19. Hu, L.; Hu, C.; Ming-Xia, H.E. Remote estimation of biomass of Ulva prolifera macroalgae in the Yellow Sea. Remote Sens. Environ. 2017, 192, 217–227. [Google Scholar] [CrossRef]
  20. Qi, L.; Hu, C.; Xing, Q.; Shang, S. Long-term trend of Ulva prolifera blooms in the western Yellow Sea. Harmful Algae 2016, 58, 35–44. [Google Scholar] [CrossRef]
  21. Xing, Q.; Hu, C.; Tang, D.; Tian, L.; Tang, S.; Wang, X.; Lou, M.; Gao, X. World’s Largest Macroalgal Blooms Altered Phytoplankton Biomass in Summer in the Yellow Sea: Satellite Observations. Remote Sens. 2015, 7, 12297–12313. [Google Scholar] [CrossRef]
  22. Li, Y.; Geng, H.; Hong, X.; Kong, F.; Yu, R. Strong interannual variation of green tides in the southern Yellow Sea: Crucial factors and implications on management strategies. Mar. Pollut. Bull. 2025, 216, 117989. [Google Scholar] [CrossRef]
  23. Cui, T.; Li, F.; Wei, Y.; Yang, X.; Xiao, Y.; Chen, X.; Liu, R.; Ma, Y.; Zhang, J. Super-resolution optical mapping of floating macroalgae from geostationary orbit. Appl. Opt. 2020, 59, C70–C77. [Google Scholar] [CrossRef] [PubMed]
  24. Shao, K.; Gong, N.; Shen, L.; Han, X.; Wang, Z.; Zhou, K.; Kong, D.; Pan, X.; Cong, P. Why did the world’s largest green tides occur exclusively in the southern Yellow Sea? Mar. Environ. Res. 2024, 200, 106671. [Google Scholar] [CrossRef]
  25. Wang, Z.; Xiao, J.; Yuan, C.; Miao, X.; Fan, S.; Fu, M.; Xia, T.; Zhang, X. The drifting and spreading mechanism of floating Ulva mass in the waterways of Subei shoal, the Yellow Sea of China–Application for abating the world’s largest green tides. Mar. Pollut. Bull. 2023, 190, 114789. [Google Scholar] [CrossRef]
  26. Huo, Y.; Han, H.; Hua, L.; Wei, Z.; Yu, K.; Shi, H.; Kim, J.K.; Yarish, C.; He, P. Tracing the origin of green macroalgal blooms based on the large scale spatio-temporal distribution of Ulva microscopic propagules and settled mature Ulva vegetative thalli in coastal regions of the Yellow Sea, China. Harmful Algae 2016, 59, 91–99. [Google Scholar] [CrossRef] [PubMed]
  27. Huo, Y.; Han, H.; Shi, H.; Wu, H.; Zhang, J.; Yu, K.; Xu, R.; Liu, C.; Zhang, Z.; Liu, K.; et al. Changes to the biomass and species composition of Ulva sp. on Porphyra aquaculture rafts, along the coastal radial sandbank of the Southern Yellow Sea. Mar. Pollut. Bull. 2015, 93, 210–216. [Google Scholar] [CrossRef] [PubMed]
  28. Cui, T.; Liang, X.; Gong, J.; Tong, C.; Xiao, Y.; Liu, R.; Zhang, X.; Zhang, J. Assessing and refining the satellite-derived massive green macro-algal coverage in the Yellow Sea with high resolution images. ISPRS J. Photogramm. 2018, 144, 315–324. [Google Scholar] [CrossRef]
  29. Xing, Q.; Hu, C. Mapping macroalgal blooms in the Yellow Sea and East China Sea using HJ-1 and Landsat data: Application of a virtual baseline reflectance height technique. Remote Sens. Environ. 2016, 178, 113–126. [Google Scholar] [CrossRef]
  30. Cui, T.; Zhang, J.; Sun, L.; Jia, Y.; Zhao, W.; Wang, Z.; Meng, J. Satellite monitoring of massive green macroalgae bloom (GMB): Imaging ability comparison of multi-source data and drifting velocity estimation. Int. J. Remote Sens. 2012, 33, 5513–5527. [Google Scholar] [CrossRef]
  31. Hu, L.; Zeng, K.; Hu, C.; He, M.-X. On the remote estimation of Ulva prolifera areal coverage and biomass. Remote Sens. Environ. 2019, 223, 194–207. [Google Scholar] [CrossRef]
  32. Li, L.; Xing, Q.; Li, X.; Yu, D.; Zhang, J.; Zou, J. Assessment of the Impacts From the World’s Largest Floating Macroalgae Blooms on the Water Clarity at the West Yellow Sea Using MODIS Data (2002–2016). IEEE J. STARS 2018, 11, 1397–1402. [Google Scholar] [CrossRef]
  33. Son, Y.; Min, J.; Ryu, J. Detecting massive green algae (Ulva prolifera) blooms in the Yellow Sea and East China Sea using Geostationary Ocean Color Imager (GOCI) data. Ocean Sci. J. 2012, 47, 359–375. [Google Scholar] [CrossRef]
  34. Shi, W.; Wang, M. Green macroalgae blooms in the Yellow Sea during the spring and summer of 2008. J. Geophys. Res. 2009, 114, C12010. [Google Scholar] [CrossRef]
  35. Garcia, R.; Fearns, P.; Keesing, J.; Liu, D. Quantification of floating macroalgae blooms using the scaled algae index. J. Geophys. Res. Ocean. 2013, 118, 26–42. [Google Scholar] [CrossRef]
  36. Son, Y.; Choi, B.; Kim, Y.; Park, Y. Tracing floating green algae blooms in the Yellow Sea and the East China Sea using GOCI satellite data and Lagrangian transport simulations. Remote Sens. Environ. 2015, 156, 21–33. [Google Scholar] [CrossRef]
  37. Hu, C. A novel ocean color index to detect floating algae in the global oceans. Remote Sens. Environ. 2009, 113, 2118–2129. [Google Scholar] [CrossRef]
  38. Keesing, J.; Liu, D.; Fearns, P.; Garcia, R. Inter- and intra-annual patterns of Ulva prolifera green tides in the Yellow Sea during 2007–2009, their origin and relationship to the expansion of coastal seaweed aquaculture in China. Mar. Pollut. Bull. 2011, 62, 1169–1182. [Google Scholar] [CrossRef]
  39. Xing, Q.; Liu, H.; Li, J.; Hou, Y.; Meng, M.; Liu, C. A Novel Approach of Monitoring Ulva pertusa Green Tide on the Basis of UAV and Deep Learning. Water 2023, 15, 3080. [Google Scholar] [CrossRef]
  40. Qi, L.; Hu, C.; Barnes, B.B.; Lapointe, B.E.; Chen, Y.; Xie, Y.; Wang, M. Climate and Anthropogenic Controls of Seaweed Expansions in the East China Sea and Yellow Sea. Geophys. Res. Lett. 2022, 49, e2022GL098185. [Google Scholar] [CrossRef]
  41. Sun, J.; Liu, K.; Zhang, H.; Fu, J.; Shi, X.; Yao, Z.; Zhao, G.; Sha, Z.; Cui, H.; Wu, J. Dissipation of Ulva prolifera green tides across various spatial and temporal scales and the short-term effects on marine environments. Mar. Environ. Res. 2025, 207, 107082. [Google Scholar] [CrossRef] [PubMed]
  42. Liu, D.; Zhou, M. Green Tides of the Yellow Sea: Massive Free-Floating Blooms of Ulva prolifera. In Global Ecology and Oceanography of Harmful Algal Blooms; Glibert, P.M., Berdalet, E., Burford, M.A., Pitcher, G.C., Zhou, M., Eds.; Springer International Publishing: Cham, Switzerland, 2018; pp. 317–326. [Google Scholar]
  43. Liu, X.; Wang, Z.; Zhang, X. A review of the green tides in the Yellow Sea, China. Mar. Environ. Res. 2016, 119, 189–196. [Google Scholar] [CrossRef] [PubMed]
  44. Bao, M.; Guan, W.; Yang, Y.; Cao, Z.; Chen, Q. Drifting trajectories of green algae in the western Yellow Sea during the spring and summer of 2012. Estuar. Coast. Shelf Sci. 2015, 163, 9–16. [Google Scholar] [CrossRef]
  45. Xu, Q.; Zhang, H.; Ju, L.; Chen, M. Interannual variability of Ulva prolifera blooms in the Yellow Sea. Int. J. Remote Sens. 2014, 35, 4099–4113. [Google Scholar] [CrossRef]
  46. Zhang, G.; Wu, M.; Zhou, M.; Zhao, L. The seasonal dissipation of Ulva prolifera and its effects on environmental factors: Based on remote sensing images and field monitoring data. Geocarto Int. 2022, 37, 860–878. [Google Scholar] [CrossRef]
  47. Cao, Y.; Wu, Y.; Fang, Z.; Cui, X.; Liang, J.; Song, X. Spatiotemporal Patterns and Morphological Characteristics of Ulva prolifera Distribution in the Yellow Sea, China in 2016–2018. Remote Sens. 2019, 11, 445. [Google Scholar] [CrossRef]
  48. Qu, T.; Zhao, X.; Hao, Y.; Zhong, Y.; Guan, C.; Hou, C.; Tang, X.; Wang, Y. Ecological effects of Ulva prolifera green tide on bacterial community structure in Qingdao offshore environment. Chemosphere 2020, 244, 125477. [Google Scholar] [CrossRef]
  49. Min, S.; Oh, H.; Hwang, J.; Suh, Y.; Park, M.; Shin, J.; Kim, W. Tracking the Movement and Distribution of Green Tides on the Yellow Sea in 2015 Based on GOCI and Landsat Images. Korean J. Remote Sens. 2017, 33, 97–109. (In Korean) [Google Scholar] [CrossRef]
  50. Choi, D.; Noh, J.; Ryu, J.; Lee, J.; Jang, P.; Lee, T.; Choi, D. Occurrence of Green Macroalgae (Ulva prolifera) Blooms in the Northern East China Sea in Summer 2008. Ocean Polar Res. 2010, 32, 351–359. (In Korean) [Google Scholar] [CrossRef]
  51. Cao, H.; Han, L. Drift path of green tide and the impact of typhoon “Chan-hom” in the Chinese Yellow Sea based on GOCI images in 2015. Ecol. Inform. 2020, 60, 101156. [Google Scholar] [CrossRef]
  52. Kang, J.; Jang, J.; Kim, J.; Byeon, S.; Kim, S.; Choi, S. Species composition, diversity, and distribution of the genus Ulva along the coast of Jeju Island, Korea based on molecular phylogenetic analysis. PLoS ONE 2019, 14, e219958. [Google Scholar] [CrossRef]
  53. Gao, H.; Su, R.; Zhou, F.; Zhang, C.; Shi, X. Extraction and identification of toxic organic substances from decaying green alga Ulva prolifera. Harmful Algae 2020, 93, 101786. [Google Scholar] [CrossRef] [PubMed]
  54. Geng, H.; Yu, R.; Zhang, Q.; Yan, T.; Kong, F.; Zhou, M. Tracing the settlement region of massive floating green algae in the Yellow Sea. J. Ocean. Limnol. 2019, 37, 1555–1565. [Google Scholar] [CrossRef]
  55. Miao, X.; Xiao, J.; Pang, M.; Zhang, X.; Wang, Z.; Miao, J.; Li, Y. Effect of the large-scale green tide on the species succession of green macroalgal micro-propagules in the coastal waters of Qingdao, China. Mar. Pollut. Bull. 2017, 126, 549–556. [Google Scholar] [CrossRef] [PubMed]
  56. Wang, C.; Yu, R.; Zhou, M.-J. Effects of the decomposing green macroalga Ulva (Enteromorpha) prolifera on the growth of four red-tide species. Harmful Algae 2012, 16, 12–19. [Google Scholar] [CrossRef]
  57. Zheng, L.; Wu, M.; Zhao, J.; Luan, S.; Wang, D.; Jiang, W.; Xue, M.; Liu, J.; Cui, Y. Effects of Ulva prolifera dissipation on the offshore environment based on remote sensing images and field monitoring data. Acta Oceanol. Sin. 2023, 42, 112–120. [Google Scholar] [CrossRef]
  58. An, D. The Spatiotemporal Variation Research of Ulva Prolifera Blooms Dissipation in the Southern Yellow Sea. Ph.D. Dissertation, University of Chinese Academy of Sciences, Beijing, China, 2020. (In Chinese). [Google Scholar]
  59. Wu, L.; Huang, J.; Ding, Y.; Liu, G.; Huang, S.; Gao, S.; Yuan, C.; Xu, J.; Wu, P.; Huang, R.; et al. Analysis on the causes of massive stranding of Yellow Sea green tide on Lianyungang and Rizhao coasts in 2022. J. Oceanol. Limnol. 2024, 42, 816–830. [Google Scholar] [CrossRef]
  60. Li, D.; Gao, Z.; Song, D. Analysis of environmental factors affecting the large-scale long-term sequence of green tide outbreaks in the Yellow Sea. Estuar. Coast. Shelf Sci. 2021, 260, 107504. [Google Scholar] [CrossRef]
  61. Zhang, G.; He, Y.; Niu, L.; Wu, M.; Kaufmann, H.; Liu, J.; Liu, T.; Kong, Q.; Chen, B. Identification of Green Tide Decomposition Regions in the Yellow Sea, China: Based on Time-Series Remote Sensing Data. Remote Sens. 2024, 16, 4794. [Google Scholar] [CrossRef]
  62. Zhang, J.; Shi, J.; Gao, S.; Huo, Y.; Cui, J.; Shen, H.; Liu, G.; He, P. Annual patterns of macroalgal blooms in the Yellow Sea during 2007–2017. PLoS ONE. 2019, 14, e0210460. [Google Scholar] [CrossRef]
  63. Yang, D.; Yuen, K.-V.; Gu, X.; Sun, C.; Gao, L. Influences of environmental factors on the dissipation of green tides in the Yellow Sea, China. Mar. Pollut. Bull. 2023, 189, 114737. [Google Scholar] [CrossRef]
  64. Ministry of Natural Resources of the People’s Republic of China. 2023 Bulletin of China Marine Disaster. 2024. Available online: https://gi.mnr.gov.cn/202404/t20240429_2844013.html (accessed on 15 April 2024).
  65. Zhan, Y.; Qiu, Z.; Wang, Y.; Su, Y.; Li, Y.; Cui, Y.; Qu, S.; Wang, P.; Rong, X. Long-Term Spatiotemporal Characteristics of Ulva prolifera Green Tide and Effects of Environmental Drivers on Its Monitoring by Satellites: A Case Study in the Yellow Sea, China, from 2008 to 2023. J. Mar. Sci. Eng. 2024, 12, 630. [Google Scholar] [CrossRef]
  66. Hu, C.; Qi, L.; Hu, L.; Cui, T.; Xing, Q.; He, M.; Wang, N.; Xiao, Y.; Sun, D.; Lu, Y.; et al. Mapping Ulva prolifera green tides from space: A revisit on algorithm design and data products. Int. J. Appl. Earth Obs. Geoinf. 2023, 116, 103173. [Google Scholar] [CrossRef]
  67. Bermejo, R.; Heesch, S.; Mac Monagail, M.; O’Donnell, M.; Daly, E.; Wilkes, R.J.; Morrison, L. Spatial and temporal variability of biomass and composition of green tides in Ireland. Harmful Algae 2019, 81, 94–105. [Google Scholar] [CrossRef] [PubMed]
  68. Chen, X.; Yu, Z.; Fu, Y.; Dong, M.; Zhang, J.; Yao, Q. Seasonal and interannual variations of nutrients in the Subei Shoal and their implication for the world’s largest green tide. Sci. Total Environ. 2024, 951, 175390. [Google Scholar] [CrossRef] [PubMed]
  69. Cui, J.; Zhang, J.; Huo, Y.; Zhou, L.; Wu, Q.; Chen, L.; Yu, K.; He, P. Adaptability of free-floating green tide algae in the Yellow Sea to variable temperature and light intensity. Mar. Pollut. Bull. 2015, 101, 660–666. [Google Scholar] [CrossRef] [PubMed]
  70. Li, H.; Zhang, C.; Han, X.; Shi, X. Changes in concentrations of oxygen, dissolved nitrogen, phosphate, and silicate in the southern Yellow Sea, 1980–2012: Sources and seaward gradients. Estuar. Coast. Shelf Sci. 2015, 163, 44–55. [Google Scholar] [CrossRef]
  71. Valiela, I.; Mcclelland, J.; Hauxwell, J.; Behr, P.J.; Hersh, D.; Foreman, K. Macroalgal blooms in shallow estuaries: Controls and ecophysiological and ecosystem consequences. Limnol. Oceanogr. 1997, 42, 1105–1118. [Google Scholar] [CrossRef]
  72. Song, W.; Peng, K.; Xiao, J.; Li, Y.; Wang, Z.; Liu, X.; Fu, M.; Fan, S.; Zhu, M.; Li, R. Effects of temperature on the germination of green algae micro-propagules in coastal waters of the Subei Shoal, China. Estuar. Coast. Shelf Sci. 2015, 163, 63–68. [Google Scholar] [CrossRef]
  73. Zhang, J.; Zhao, P.; Huo, Y.; Yu, K.; He, P. The fast expansion of Pyropia aquaculture in “Sansha” regions should be mainly responsible for the Ulva blooms in Yellow Sea. Estuar. Coast. Shelf Sci. 2017, 189, 58–65. [Google Scholar] [CrossRef]
  74. Hu, P.; Liu, Y.; Hou, Y.; Yin, Y. An early forecasting method for the drift path of green tides: A case study in the Yellow Sea, China. Int. J. Appl. Earth Obs. 2018, 71, 121–131. [Google Scholar] [CrossRef]
  75. Cao, J.; Liu, J.; Zhao, S.; Tong, Y.; Li, S.; Xia, Z.; Hu, M.; Sun, Y.; Zhang, J.; He, P. Advances in the research on micropropagules and their role in green tide outbreaks in the Southern Yellow Sea. Mar. Pollut. Bull. 2023, 188, 114710. [Google Scholar] [CrossRef] [PubMed]
  76. Liu, J.; Xia, J.; Zhuang, M.; Zhang, J.; Yu, K.; Zhao, S.; Sun, Y.; Tong, Y.; Xia, L.; Qin, Y.; et al. Controlling the source of green tides in the Yellow Sea: NaClO treatment of Ulva attached on Pyropia aquaculture rafts. Aquaculture 2021, 535, 736378. [Google Scholar] [CrossRef]
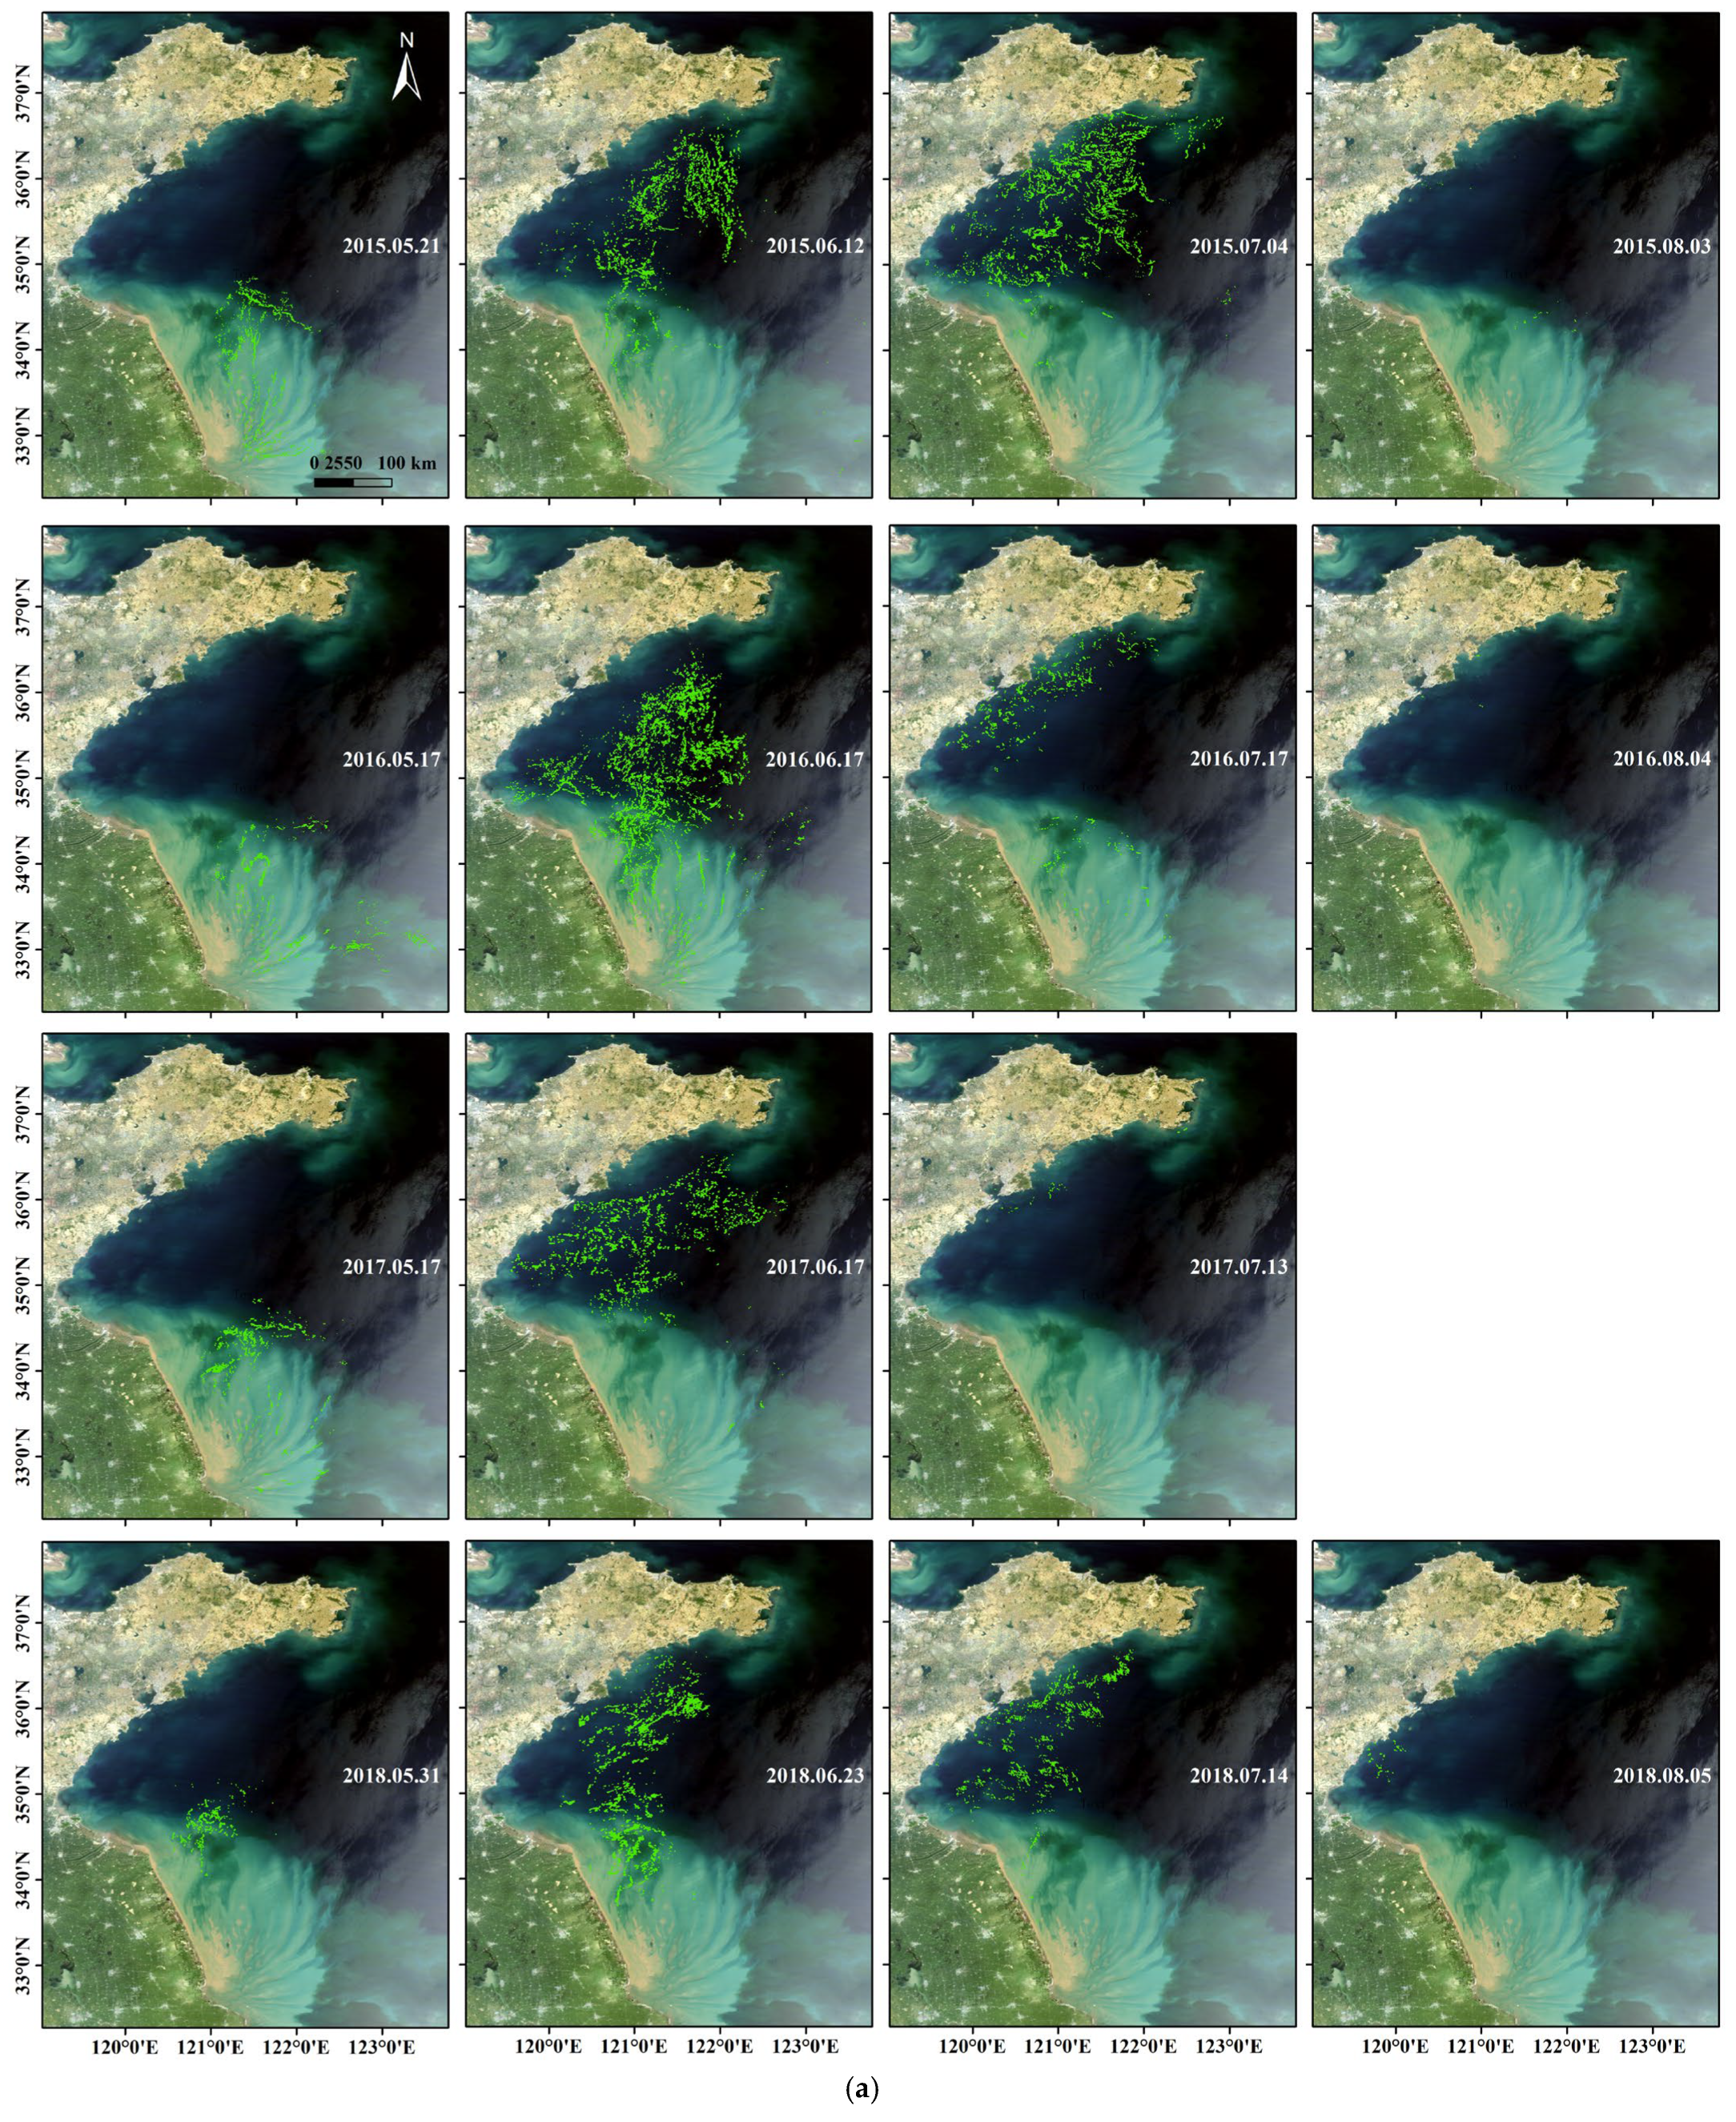
Figure 1. (a) Spatio distribution of Ulva prolifera (patches in green) from May to August (2015–2018). (b) Spatio distribution of Ulva prolifera (patches in green) from May to August (2019–2021).
Diversity 17 00614 g001aDiversity 17 00614 g001b
Figure 2. (a) Migration trajectory of Ulva prolifera in the Yellow Sea from 2008 to 2018. The trajectories are derived from the following sources: 2008–2013 [46], 2014 [48], 2015 [49], and 2016–2018 [47]; (b) migration trajectory of the macroalgal in the Yellow Sea in 2016. Sources for the paths are blue [48], green [49], and red [47].
Diversity 17 00614 g002
Figure 5. MODIS derived total biomass of the macroalgal in the Yellow Sea from 2007 to 2016. MODIS-derived total biomass of the macroalgal in the Yellow Sea from 2007 to 2016. The black stars indicate maximum fresh weight based on a lab-derived FAI-reflectance model [19]; the blue dots with error bars represent FAI-based model estimates [31]; and the red triangles show values derived from an EVI-based biomass model [18].
Diversity 17 00614 g005
Table 1. Remote-sensing monitoring results of the green tides in the Yellow Sea from 2008 to 2021 reported in the Bulletin of China Marine Disaster and the Bulletin of Beihai Bureau Marine Disaster.
YearSatellite Discovery TimeMaximum Distribution Area DataTime of ExtinctionBloom Duration (Days)
2008Mid-May7.12Early September110
2009Mid-May7.02Late August94
2010Late April7.10Mid-August76
2011Late May7.19Late August82
2012Late March6.13Mid-August106
2013Mid-May6.30Mid-August96
2014Mid-May7.14Mid-August95
2015Mid to late May6.19Early August93
2016Early May6.25Early August85
2017Mid-May6.19Mid to late July68
2018Late May6.29Mid-August91
2019Mid to late May6.27Early September119
2020Late May6.15Late July64
2021Mid-May6.26Late August97
Table 2. Maximal bloom day identified in different studies.
StudiesYear
2008200920152016
Qi et al. [20]8 June 15 July 21 June --
Cui et al. [28]25 June 24 June 1 July 25 June
Hu et al. [31]25 June 2 July 21 June 25 June
Xing et al. [13]31 May 22 July 21 June 24 June
Disclaimer/Publisher’s Note: The statements, opinions and data contained in all publications are solely those of the individual author(s) and contributor(s) and not of MDPI and/or the editor(s). MDPI and/or the editor(s) disclaim responsibility for any injury to people or property resulting from any ideas, methods, instructions or products referred to in the content.