Article

Assessing Ecological Restoration of Père David’s Deer Habitat Using Soil Quality Index and Bacterial Community Structure

1
College of Ecology and Environment, Nanjing Forestry University, Nanjing 210037, China
2
Co-Innovation Center for Sustainable Forestry in Southern China, Nanjing 210037, China
3
Yancheng Wetland National Nature Reserve, Rare Birds, Yancheng 224333, China
4
Dafeng Milu National Nature Reserve, Yancheng 224136, China
5
Institute of Botany, Jiangsu Province and Chinese Academy of Sciences, Nanjing 210014, China
6
Department of Natural Resources and Environmental Sciences, Alabama A&M University, Huntsville, AL 35762, USA
*
Author to whom correspondence should be addressed.
Diversity 2025, 17(9), 594; https://doi.org/10.3390/d17090594
Submission received: 22 July 2025 / Revised: 21 August 2025 / Accepted: 21 August 2025 / Published: 24 August 2025
(This article belongs to the Section Microbial Diversity and Culture Collections)

Abstract

Although significant progress has been made in the conservation of Père David’s deer (Elaphurus davidianus) populations, rapid population growth in coastal wetlands has caused severe habitat degradation. This highlights the urgent challenge of balancing ungulate population dynamics with wetland restoration efforts, particularly considering the limited data available on post-disturbance ecosystem recovery in these environments. In this study, we evaluated soil quality and bacterial community dynamics at an abandoned feeding site and a nearby control site within the Dafeng Milu National Nature Reserve during 2020–2021. The goal was to provide a theoretical basis for the ecological restoration of Père David’s deer habitat in coastal wetlands. The main findings are as follows: among the measured indicators, bulk density (BD), soil water content (SWC), sodium (Na+), total carbon (TC), total nitrogen (TN), total phosphorus (TP), available potassium (AK), microbial biomass nitrogen (MBN), and the Chao index were selected to form the minimum data set (MDS) for calculating the soil quality index (SQI), effectively reflecting the actual condition of soil quality. Overall, the SQI at the feeding site was lower than that of the control site. Based on the composition of bacterial communities and the functional prediction analysis of bacterial communities in the FAPROTAX database, it is shown that feeding sites are experiencing sustained soil carbon loss, which is clearly caused by the gathering of Père David’s deer. Co-occurring network analyses demonstrated the structure of the bacterial community at the feeding site was decomplexed, and with a lower intensity than the control. In RDA, Na+ is the main soil property that affects bacterial communities. These findings suggest that the control of soil salinity is a primary consideration in the development of Père David’s deer habitat restoration programmes, followed by addressing nitrogen supplementation and carbon sequestration.

1. Introduction

The coastal wetland ecosystem, a transitional zone between land and sea [1], plays a crucial role in water purification, climate regulation, biodiversity maintenance [2], and material cycling [3,4]. However, they are increasingly threatened by climate change, industrial emissions, land reclamation, and biological invasions, which have led to the progressive degradation of these ecosystems [5,6,7,8]. Herbivorous introduced species such as Père David’s deer (Elaphurus davidianus) can intensify the external pressure on coastal wetlands and exacerbate the degree of ecological degradation. A prominent example is the Jiangsu Dafeng Milu National Nature Reserve, which is located in the coastal wetland in the eastern part of China. Since the reintroduction of 39 Père David’s deer from the UK in 1986, their population has surged to 8216 in 2024, becoming the region with the largest Père David’s deer population in the world [9]. This exponential growth has outpaced the capacity of native vegetation to meet the deer’s foraging needs [10], necessitating the use of artificial feeding. However, the prolonged congregation of deer at feeding sites has led to soil compaction, vegetation degradation, and increased salinization [11]. To ensure the long-term sustainability of Père David’s deer populations, effective habitat restoration strategies are essential, along with knowledge of current soil conditions in the habitat.
As herbivorous ungulates, Père David’s deer influence their habitat through behaviors such as trampling, foraging, resting, and defecation, similar to other grazers [12]. Accordingly, assessments of soil quality must incorporate both physical and chemical soil properties, a practice widely applied in studies examining the effects of grazing-induced soil disturbances [13,14,15]. Research has demonstrated that soil microbial communities play vital roles in promoting the material cycle in maintaining soil ecological functions [16]. Due to their sensitivity to environmental changes, these communities can serve as reliable bioindicators of soil quality [17]. Notably, studies have shown that the input of dung from grazing animals tends to have a stronger influence on bacterial populations than on fungal communities [18]. For example, Ma et al. [19] found that even low-intensity grazing can cause significant shifts in bacterial functional genes, regardless of changes in community composition. Thus, integrating bacterial diversity and functional profiling into soil quality assessments can enhance the precision and reliability of such evaluations.
Soil quality encompasses the physical, chemical, and biological attributes of soil. The Soil Quality Index (SQI) offers a composite and visual representation of fertility, environmental condition, and overall soil health [20]. To ensure the sensitivity, representativeness, independence, and practical utility of the indicators as well as the simplicity of calculation in SQI assessments, the minimum data set (MDS) approach is commonly employed [21]. Given the wide range of units and scales across soil indicators, data normalization is essential for meaningful comparisons. Both linear and nonlinear normalization methods are used. While linear methods may involve subjective thresholds that can introduce bias [22], into SQI values derived from the MDS—potentially deviating from those based on the total data set (TDS)—nonlinear methods reduce this risk. For instance, Yu et al. [23] demonstrated that nonlinear scoring yielded more robust assessments of soil quality compared to linear methods. Determining the appropriate weights for MDS indicators is another critical area of research. These weights can be assigned through methods such as synchronizing outputs during MDS selection [24] or using data entropy [25]. The weights of the indicators derived from the entropy calculation based on the data are more responsive to the variability of the data, with more objective calculations [26]. This method is known as the entropy method and has been used in studies of soil quality, with a high degree of accuracy. Geng et al. [26], in a study in the Taihang Mountains, found that entropy-based weighting produced SQI values that closely reflected actual soil conditions.
Although Père David’s deer have conservation significance, the ecological consequences of their introduction—especially regarding soil systems—remain poorly understood. Most previous research has focused on behavior and physiology [27,28,29,30], with limited attention to belowground impacts such as changes in soil quality, as well as microbial diversity and function. Recognizing the degradation of habitat soils due to rapid deer population growth, the management team at the Dafeng Milu National Nature Reserve has adopted the strategy of periodically relocating feeding stations. However, due to constraints related to topography and space, as well as the logistical need for vehicle access, feeding sites are limited to areas near the seawall. Pursuing a long-term strategy of rotating feeding sites without assessing soil recovery at abandoned sites would be unsustainable. Therefore, further investigation is needed to determine whether such rotation effectively mitigates soil degradation. This study, in particular, investigates the influence of Père David’s deer on soil quality index and bacterial communities in the coastal wetland in eastern China. Specifically, we examine how the presence of deer affected soil quality, and bacterial community composition and function. Through this work, we aim to enrich the theoretical basis for ecological restoration of Père David’s deer habitat and offer insights into the broader ecological impacts of introducing large herbivores into sensitive wetland habitats.

2. Materials and Methods

2.1. Study Area

The study area was conducted in the Jiangsu Dafeng Milu National Nature Reserve, China (hereafter referred to as the reserve), located at 32°59′–33°03′ N and 120°47′–120°53′ E, covering a total area of 2677 ha (Figure 1). The reserve lies in a monsoon climate zone, with hot, rainy summers and cold, dry winters [10]. Mean annual temperatures range from 13.7 to 14.5 °C, and annual precipitation averages at 980–1100 mm, most of which occurs in summer under the influence of typhoons. The area receives 2325.4 h of annual solar radiation and has a frost-free period of approximately 299 days. Topography is generally flat, with an average elevation of 2 m [10] and consists of sandy, alkaline soil. Herbaceous species include Spartina alterniflora, Cynodon dactylon, Imperata cylindrica, and Suaeda salsa, which grow toward the seashore and coastal dikes. The reserve’s core zone is divided into Core Areas I, II, and III. Core I serves as an intensively managed captive zone for Père David’s deer with significant human disturbance; Core II represents a semi-captive enclosure with moderate human intervention; Core III consists of natural coastal mudflats functioning as an undisturbed wild grazing habitat. A seawall is situated between Core II and III and forms a buffer zone distributed across Core III. It should be noted that the seawall road is in a closed state, strictly restricting vehicles from entering. The abandoned feeding site and the control area selected for this study were both located in Core Area III.
Until the autumn of 2020, there were three feeding sites in Core III, which are situated 5 m below the seawall, arranged from north to south. Among these, the first and second feeding sites remained operational. The third feeding site was in use for more than three years. The first feeding site was used biannually (spring and autumn) from its establishment until the spring of 2020, after which it was transitioned to year-round operation. The second feeding site was officially opened in autumn 2020, coinciding with the discontinuation of the third, and has since operated year-round. Feeding frequency at these sites is once daily in spring, summer, and autumn, and twice daily in winter.

2.2. Experimental Design

Père David’s deer congregate near artificial feeding troughs in the reserve, where food is readily available. We chose the third feeding site as the location where the feeding site samples were collected. Control samples originated from an area 2.5 km from the third feeding site, characterized by long-term S. alterniflora invasion (>30 years) and absence of detectable Père David’s deer activity. Both sites were more than 10 km from roads or human structures to minimize anthropogenic edge effects and have similar hydrological conditions. The basic information of the sampling sites is shown in Table 1. Soil sampling in Core III was carried out four times—in October 2020, January 2021, March 2021, and July 2021. The first sampling took place the day after the third feeding site was abandoned, and all subsequent sampling at the feeding site and control area were conducted at the same location separately. All samples are secured at or near the central region of the area, prioritizing safety. A total of 120 soil samples were collected across four sampling sessions, with 15 replicates obtained per site during each session.
Three 10 × 10 m sampling plots were established, each spaced 150–200 m apart and set up in the feeding site and control area. Within each plot, five 1 × 1 m subplots were positioned at the four corners and the center. Using this five-point sampling method, soil from a depth of 0–20 cm was collected after removing visible plant roots and stones [31] after removing visible plant roots and stones. Samples from the feeding site were labeled “Fed”, and those from the control area were labeled “Control”. Each soil sample was divided into two equal portions: one air-dried in a cool, ventilated environment for physicochemical analyses, and the other stored at 4 °C for microbial biomass carbon (MBC) and microbial biomass nitrogen (MBN) determination. Samples for bacterial community analysis were placed in a dry ice container immediately upon collection and sent to Shanghai Majorbio Bio-Pharm Technology Co., Ltd. (Shanghai, China).

2.3. Determination of Soil Factors

Soil bulk density (BD) was determined using the cutting ring method, and soil water content (SWC) was measured by oven-drying at 105 °C to constant weight [32]. Chemical analyses included the following: pH, measured using a pH meter (STARTER3100, OHAUS, Parsippany, NJ, USA) with a water-to-soil ratio of 5:1 [33]; sodium (Na+) concentration, determined by flame photometry (BWB-XP, Blended Wing Body, Buckinghamshire, Marlow, UK) [34]; soil organic carbon (SOC), determined by the H2SO4–K2Cr2O7 oxidation–external heating method [35]; and total carbon (TC) and total nitrogen (TN), measured using an elemental analyzer (PE-2400, PerkinElmer, Waltham, MA, USA) [36]. Available nitrogen (AN) was determined using the alkaline diffusion method [33]. Available phosphorus (AP) was extracted with 0.5 mol L−1 NaHCO3 and measured by Mo–Sb colorimetry (Cary 100, Agilent, Santa Clara, CA, USA) [33]. Total phosphorus (TP) and total potassium (TK) were extracted using the NaOH melting method, with TP determined by UV spectrophotometry (Cary 100, Agilent, Santa Clara, CA, USA) and TK by flame photometry (BWB-XP, Blended Wing Body, Buckinghamshire, Marlow, UK) [37]. Available potassium (AK) was measured by 1 mol L−1 NH4OAc extraction and flame photometry (BWB-XP, Blended Wing Body, Buckinghamshire, Marlow, UK) [37]. Microbial biomass carbon and nitrogen were determined via chloroform fumigation–extraction and analyzed with a TOC analyzer (TOC-L, Shimadzu, Kyoto, Japan) [38].

2.4. Soil Bacterial Community DNA Extraction, Amplification, and Sequencing

The total DNA of the samples was extracted using the FastDNA® SPIN Kit for Soil (FastDNA® SPIN Kit for Soil, Norcross, MP, USA). The DNA concentration and purity were assessed with a NanoDrop2000 spectrophotometer (Thermo Fisher Scientific, Waltham, MA, USA), and the quality of extracted DNA was verified by 1% agarose gel electrophoresis. The PCR primers were 338F (5′-ACTCCTACGGGGAGGCAGCAG-3′) and 806R (5′-GGGGAGGCAGCAG-3′) [39], while the PCR amplification system was 20 μL: 5×FastPfu Buffer 4 μL; 2.5 mM dNTPs 2 μL; forward primer (5 μM) 0.8 μL; reverse primer (5 μM) 0.8 μL; Fast Pfu polymerase 0.4 μL; BSA 0.2 μL; Template DNA 10 ng. The amplification procedure was as follows: predenaturation at 95 °C for 3 min, 27 cycles (denaturation at 95 °C for 30 s, annealing at 55 °C for 30 s, elongation at 72 °C for 45 s), a final elongation at 72 °C for 10 min, and termination at 10 °C. The PCR instrument used was an ABI GeneAmp® 9700 (Thermo Fisher Scientific, Waltham, MA, USA). The PCR products were detected by agarose gel electrophoresis (2%), and the bands with a primary band of 500–750 bp were selected and analyzed using an AxyPrepDNA gel recovery kit (AXYPrepDNA, Corning, NY, USA). Quantification was performed using QuantiFluor™-ST (Promega, Madison, WI, USA). Purified amplified fragments were used to construct PE 2 × 300 libraries according to the Illumina MiSeq Platform (Illumina, San Diego, CA, USA) standard procedure. The raw data were uploaded to the NCBI database using the Illumina Miseq PE300 platform. The raw sequenced sequences were quality-controlled by fastp (version 0.19.6) software and spliced by FLASH software (version 1.2.11).

2.5. Data Processing and Analysis

2.5.1. Significance Analysis

Data were organized in Microsoft Excel 2016, and statistical analyses were performed using SPSS 25.0. For data meeting normality and homogeneity of variance assumptions (verified by Kolmogorov–Smirnov test (K-S test)), one-way ANOVA was applied, and Least Significant Difference (LSD) was used for post hoc test. Nonparametric tests (verified by Mann–Whitney test (M-W test)) were used for non-normal data. All tests for differences in data were conducted at p = 0.05. Statistical significance thresholds were p < 0.05 (significant) and p > 0.05 (not significant). Figures were produced using Origin 2018.

2.5.2. Minimum Data Set Filtering

Principal component analysis (PCA) in SPSS 25.0 was used to identify indicators for the minimum data set (MDS). The absolute value of 0.5 was used as the cutoff to divide the indicators into groups based on the loadings they had on each primary component [22,40]. The group with the highest loading value receives indicators whose absolute loading value on each primary component is less than 0.5. Each indicator’s Norm value within each group was calculated independently (Equation (1)):
N i n = i = 1 n ( u i n u i n ) λ n
where N i n is the cumulative factor loading (Norm value) of the indicator i across all n principal components, n is the number of principal components with eigenvalue ≥ 1, u i n is the factor loading of the indicator i , and λ n is the eigenvalue of the nth principal component; the indicator with the highest Norm value within 10% of each group is selected to be included in the minimum data set.
Combined with the correlation between the indicators, the indicators entering the minimum data set were streamlined again; if two indicators were highly correlated, the indicator with a lower Norm value was excluded; if the correlation between two indicators was low, the two low-correlation indicators were both retained.

2.5.3. Dimensionless Data

Nonlinearity (Equation (2)) was used to render the soil quality evaluation indicators dimensionless, transforming the data into scores ranging from 0 to 1:
S N L j i = 1 1 + x x 0 b
where S N L j i is the dimensionless value of the indicator i in sample site j ; x is the measured value of the indicator i ; x 0 is the measured average value of the indicator i ; the value of b is set to either 2.5 or −2.5, with −2.5 assigned when higher values indicate better performance of the indicator, and 2.5 when lower values are preferable [23].

2.5.4. Indicator Weights

The Entropy Method [26] (Equations (3) and (4)) was chosen to calculate the weights of the dimensionless data (Equation (5)):
P j i = S N L j i j = 1 n S N L j i
e i = k j = 1 n P j i ln P j i
w i = 1 e i i = 1 m 1 e i
where P j i is the weight of the indicator i in sample site j ; S N L j i is the dimensionless value of the indicator i in sample site j ; e i is the entropy of the indicator; k = 1/ln(n); n is the number of sample sites; w i is the weight of the i th indicator; m is the number of indicators.

2.5.5. Calculation of the Soil Quality Index

The soil quality index was used to quantitatively evaluate soil quality in the study area. The calculation results in Section 2.5.4 were used as the weights of each index. The weighted sum (Equation (6)) of the dimensionless processed data and the weights of each indicator were used to obtain the soil quality index at each sample point:
S Q I = i = 1 n w i × S N L j i
where SQI is the soil quality index; w i is the weight of the i th indicator, (derived from Equations (3)–(5)), and S N L j i is the result of the dimensionless quantification of the indicator i in sample site j (derived from Equation (2)).

2.6. Analysis of Bacterial Community Data

Shannon and Chao indices were selected to reflect the diversity of soil bacterial communities. Group differences were statistically analyzed using the following procedures: For data satisfying the assumptions of normality and homogeneity of variance (confirmed by the K-S test), one-way ANOVA was performed, followed by post hoc testing using the Tukey–Kramer test. Nonparametric tests (verified by M-W test) were used for non-normal data. All tests for differences in data were conducted at p = 0.05. AVD (average variation degree) was used to characterize the stability of bacterial communities. The above index analyses were performed in mothur (version v.1.30.2, https://mothur.org/wiki/calculators/, accessed on 9 May 2022) with 97% operational taxonomic units (OTUs) similarity level. Based on the results of taxonomic analyses, community composition at the soil bacterial phylum level was mapped using R (version 3.3.1). The functions of soil bacterial communities in the feeding area and control were predicted using the FAPROTAX database. The co-occurring network analyses and graphing were performed in Networkx 1.11 and Gephi 0.10.1. The redundancy analysis (RDA) analysis and graphing were performed in the vegan package of R (version 2.4.3). All bacterial community analyses were carried out using the online platform provided by Shanghai Majorbio Bio-Pharm Technology Co., Ltd.

3. Results

3.1. Soil Properties

Table 2 presents the results of soil property measurements and the significant differences between the feeding site and the control. The statistical significance testing was based on 15 replicate samples collected per sampling point per season. Except for winter, bulk density (BD) and pH were higher at the feeding site, whereas soil water content (SWC) was lower. For all seasons, the feeding site showed lower values for both available and total forms of carbon, nitrogen, phosphorus, and potassium compared with the control. The exception were available nitrogen (AN) in winter, available phosphorus (AP) in winter, and total phosphorus (TP) in spring, which were higher at the feeding site, although the difference was not statistically significant (p > 0.05).
Regarding microbial biomass, microbial biomass carbon (MBC) at the feeding site was significantly higher than in the control during autumn (p < 0.01). Microbial biomass nitrogen (MBN) also differed significantly between the two sites in autumn and winter, with higher values in the feeding site (p < 0.01). Overall, these results indicate substantial differences in soil properties between the feeding and control sites, with greater seasonal variability observed at the feeding site.

3.2. Soil Quality Index

3.2.1. Minimum Data Set and Indicator Weight Construction

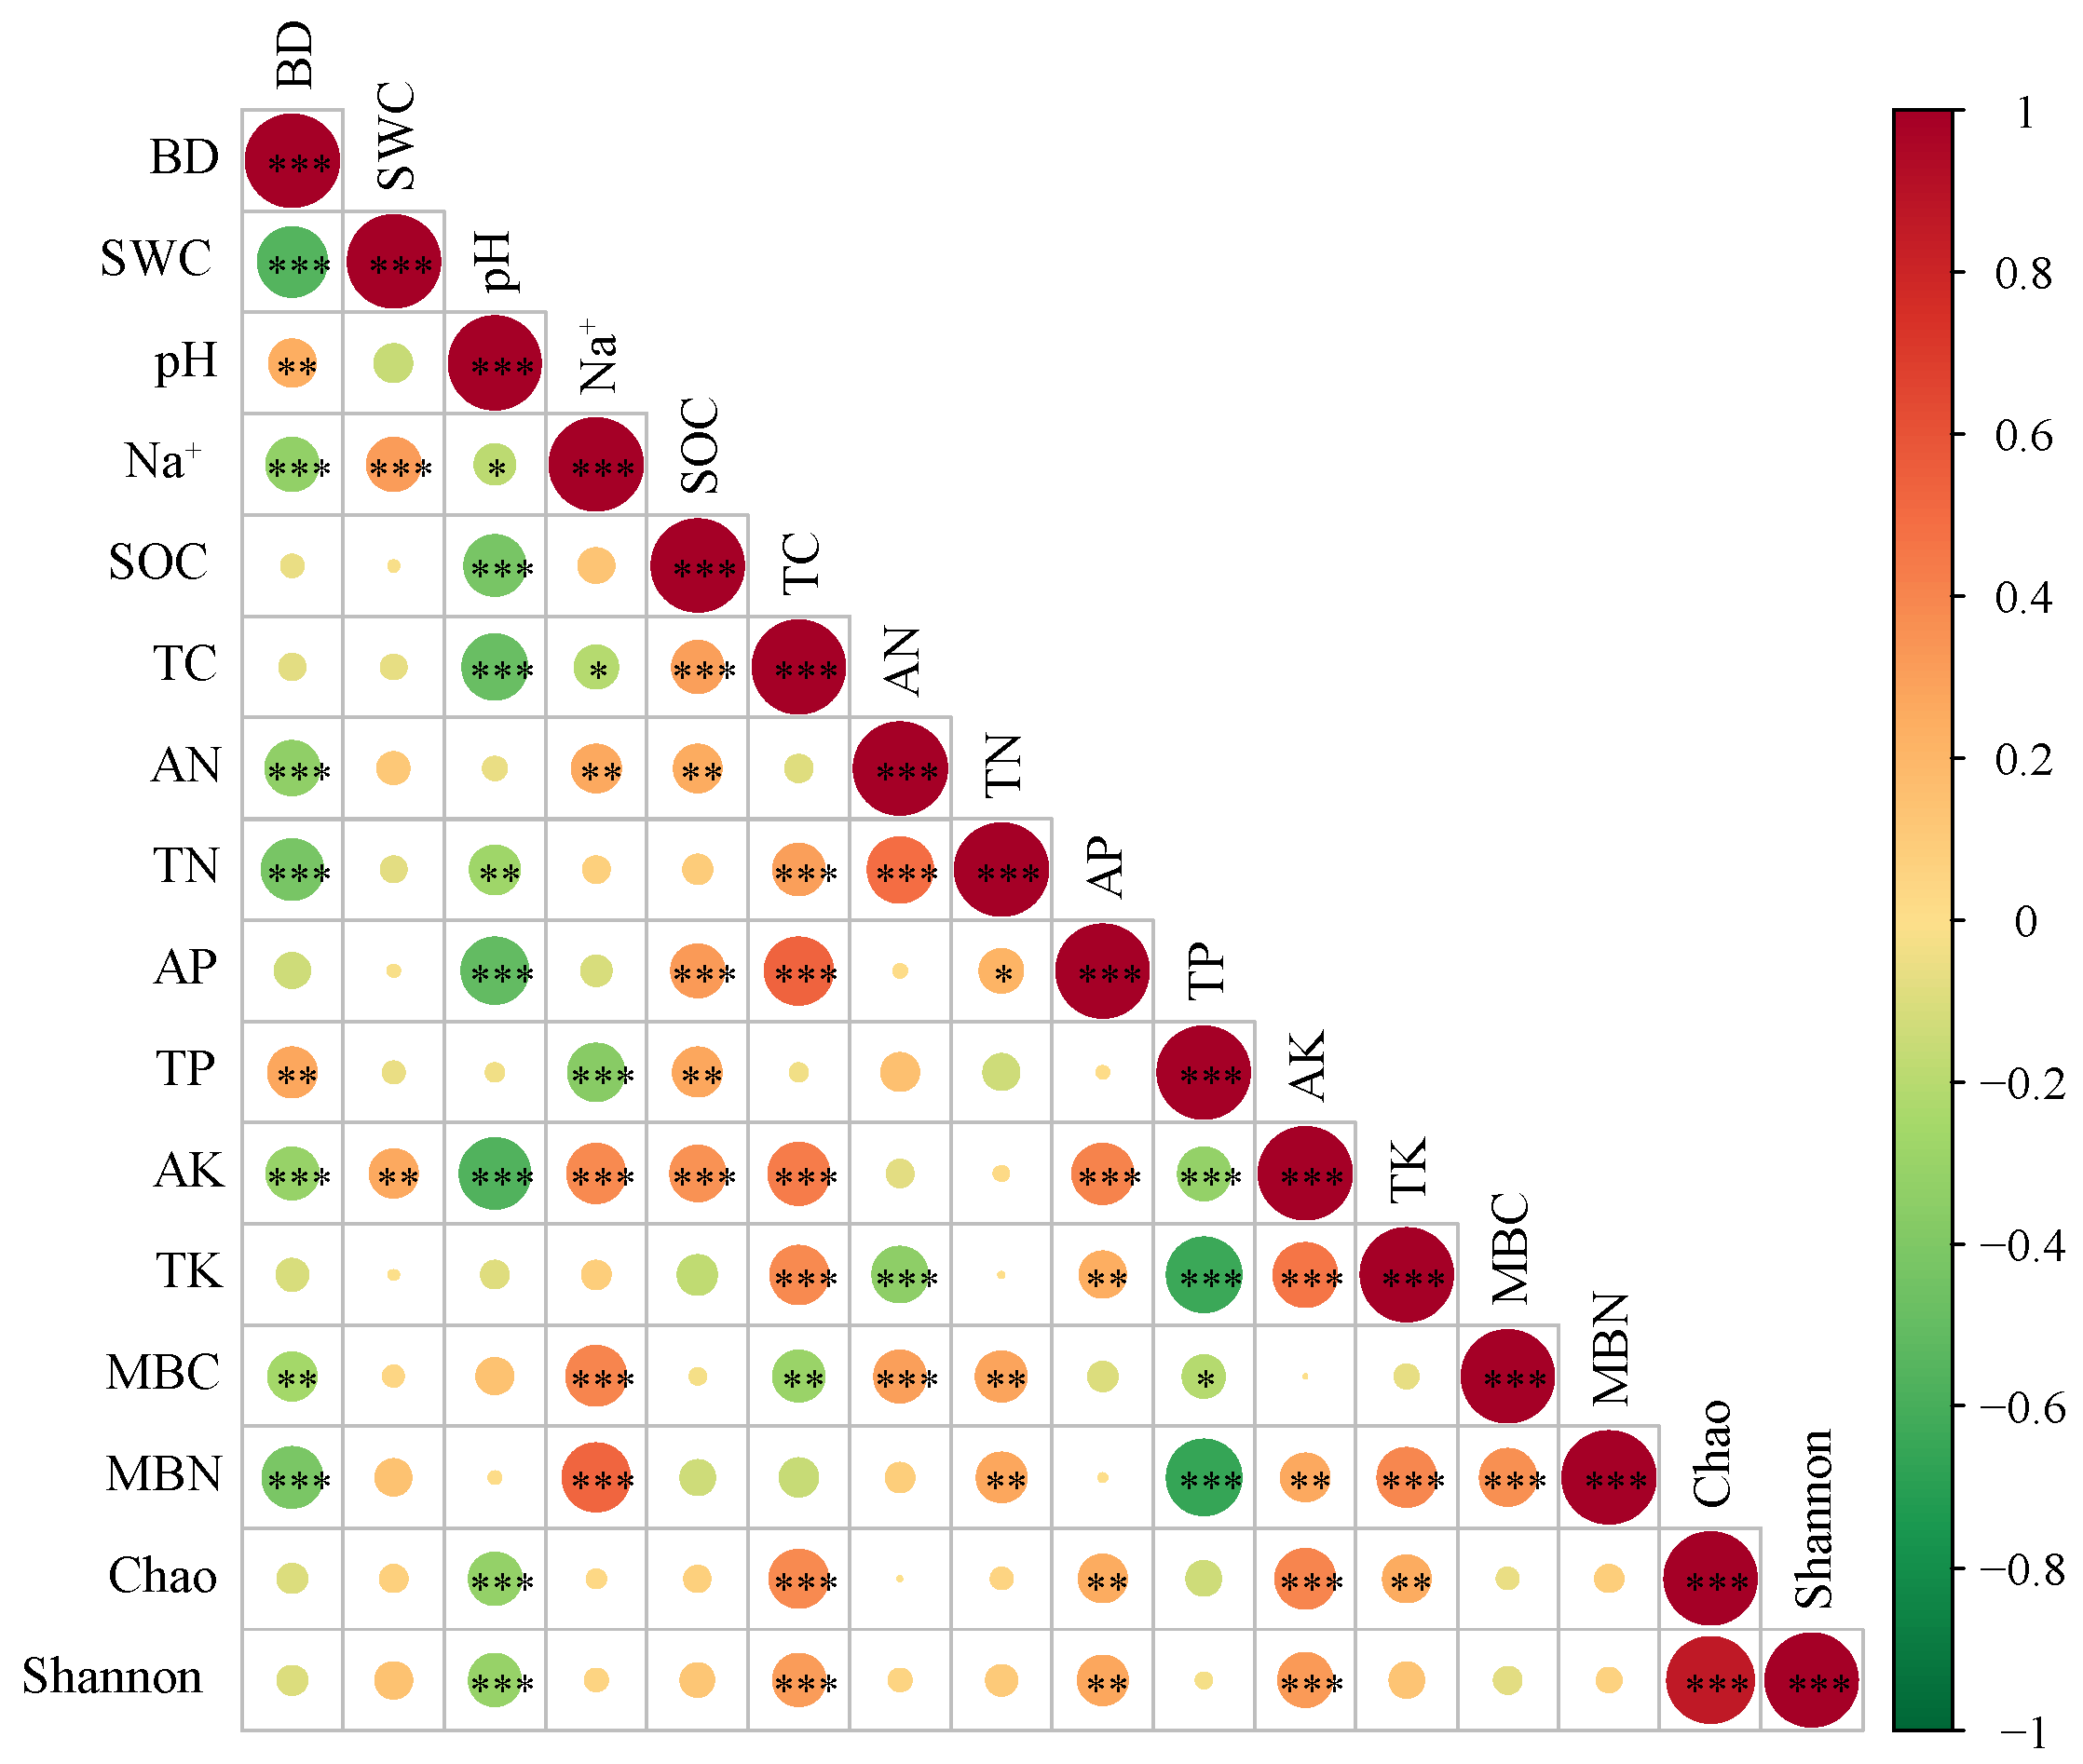
PCA of the assessed soil property indices yielded a Kaiser–Meyer–Olkin (KMO) value of 0.587. Six principal components were selected (Table 3), collectively explaining 77.56% of the total variance. Table 3 also presents the selection of the minimum data set (MDS) and the corresponding indicator weights. Based on Norm’s score, BD, SWC, Na+, TC, TN, TP, AK, MBN, and Chao were included in the MDS. Notably, an absolute correlation coefficient greater than 0.4 was considered to indicate significant correlation, as shown in Figure 2.
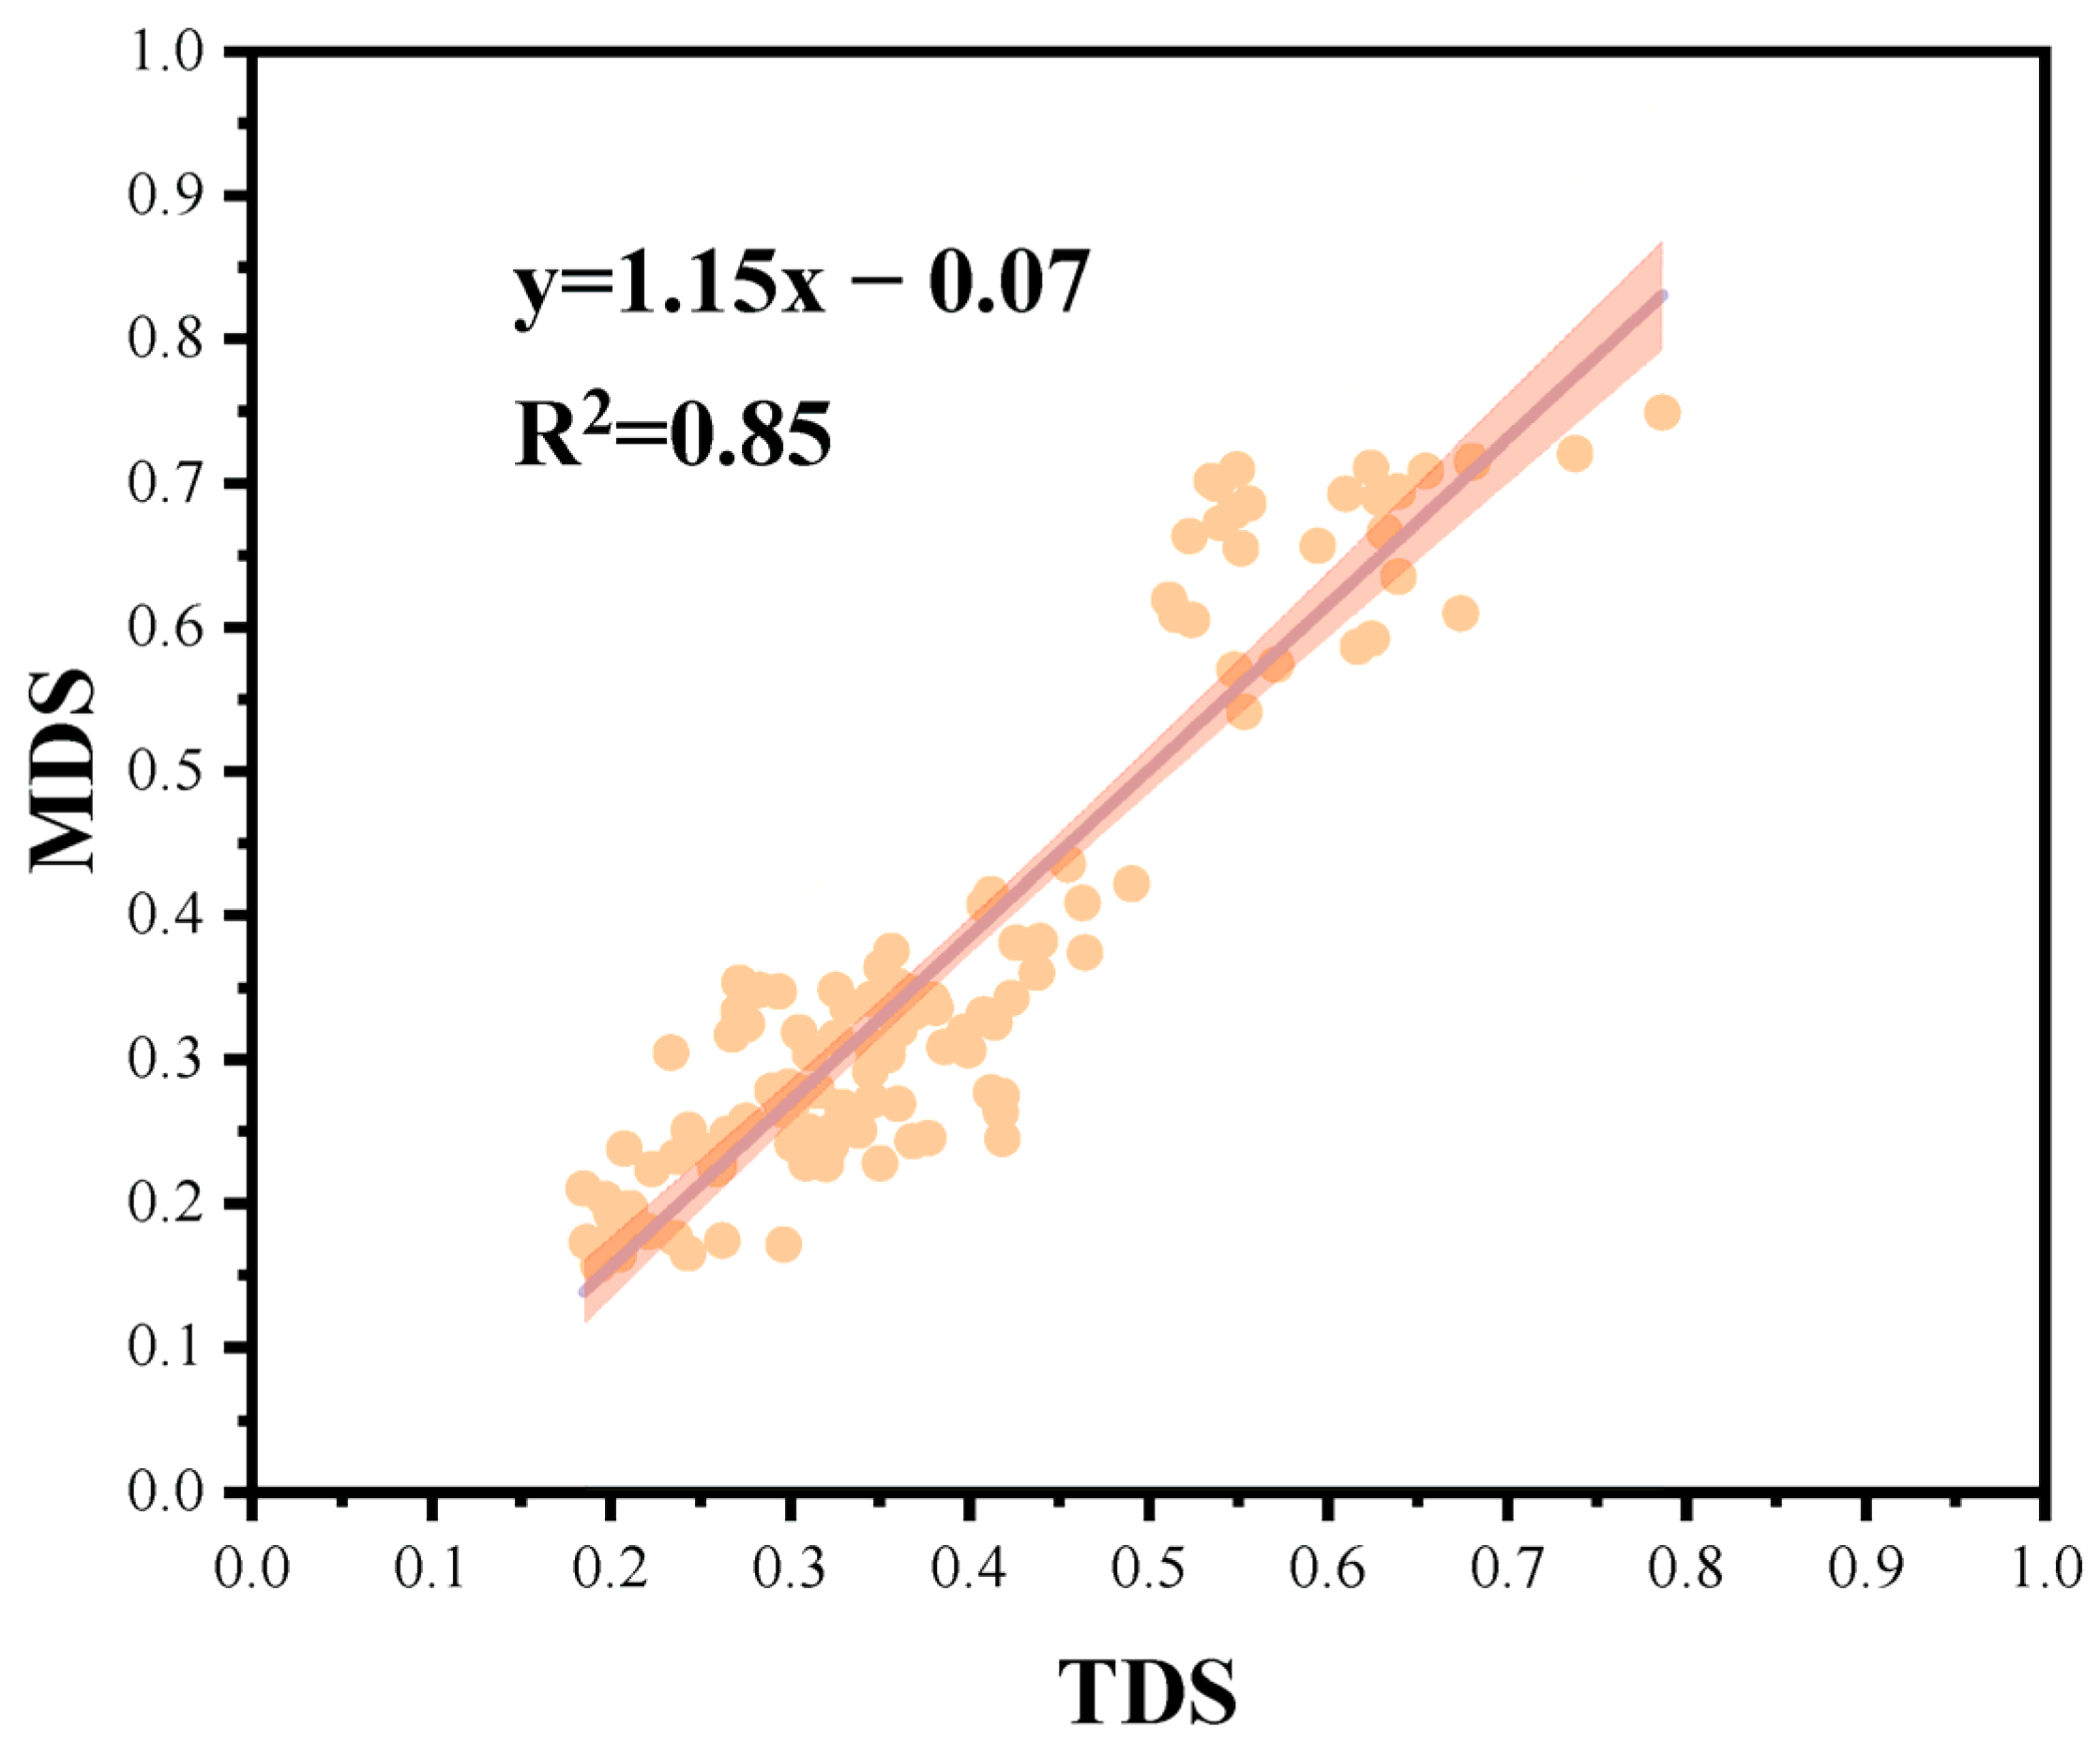
The soil quality index was calculated for each seasonal sampling point using Equation (6), based on both the MDS and the total data set (TDS). Linear fitting results (Figure 3) show that the MDS-based index exhibited a strong correlation with the TDS-based index, indicating that the MDS is sufficient for representing soil quality at the study sites.

3.2.2. Soil Quality Index in Different Seasons

Table 4 displays seasonal soil quality means calculated from 15 replicate samples per site per season. The soil quality index was highest in winter, followed by spring, summer, and lowest in autumn. In all seasons except winter, the feeding site had lower soil quality index values than the control, with significant differences observed in autumn and spring (p < 0.05).
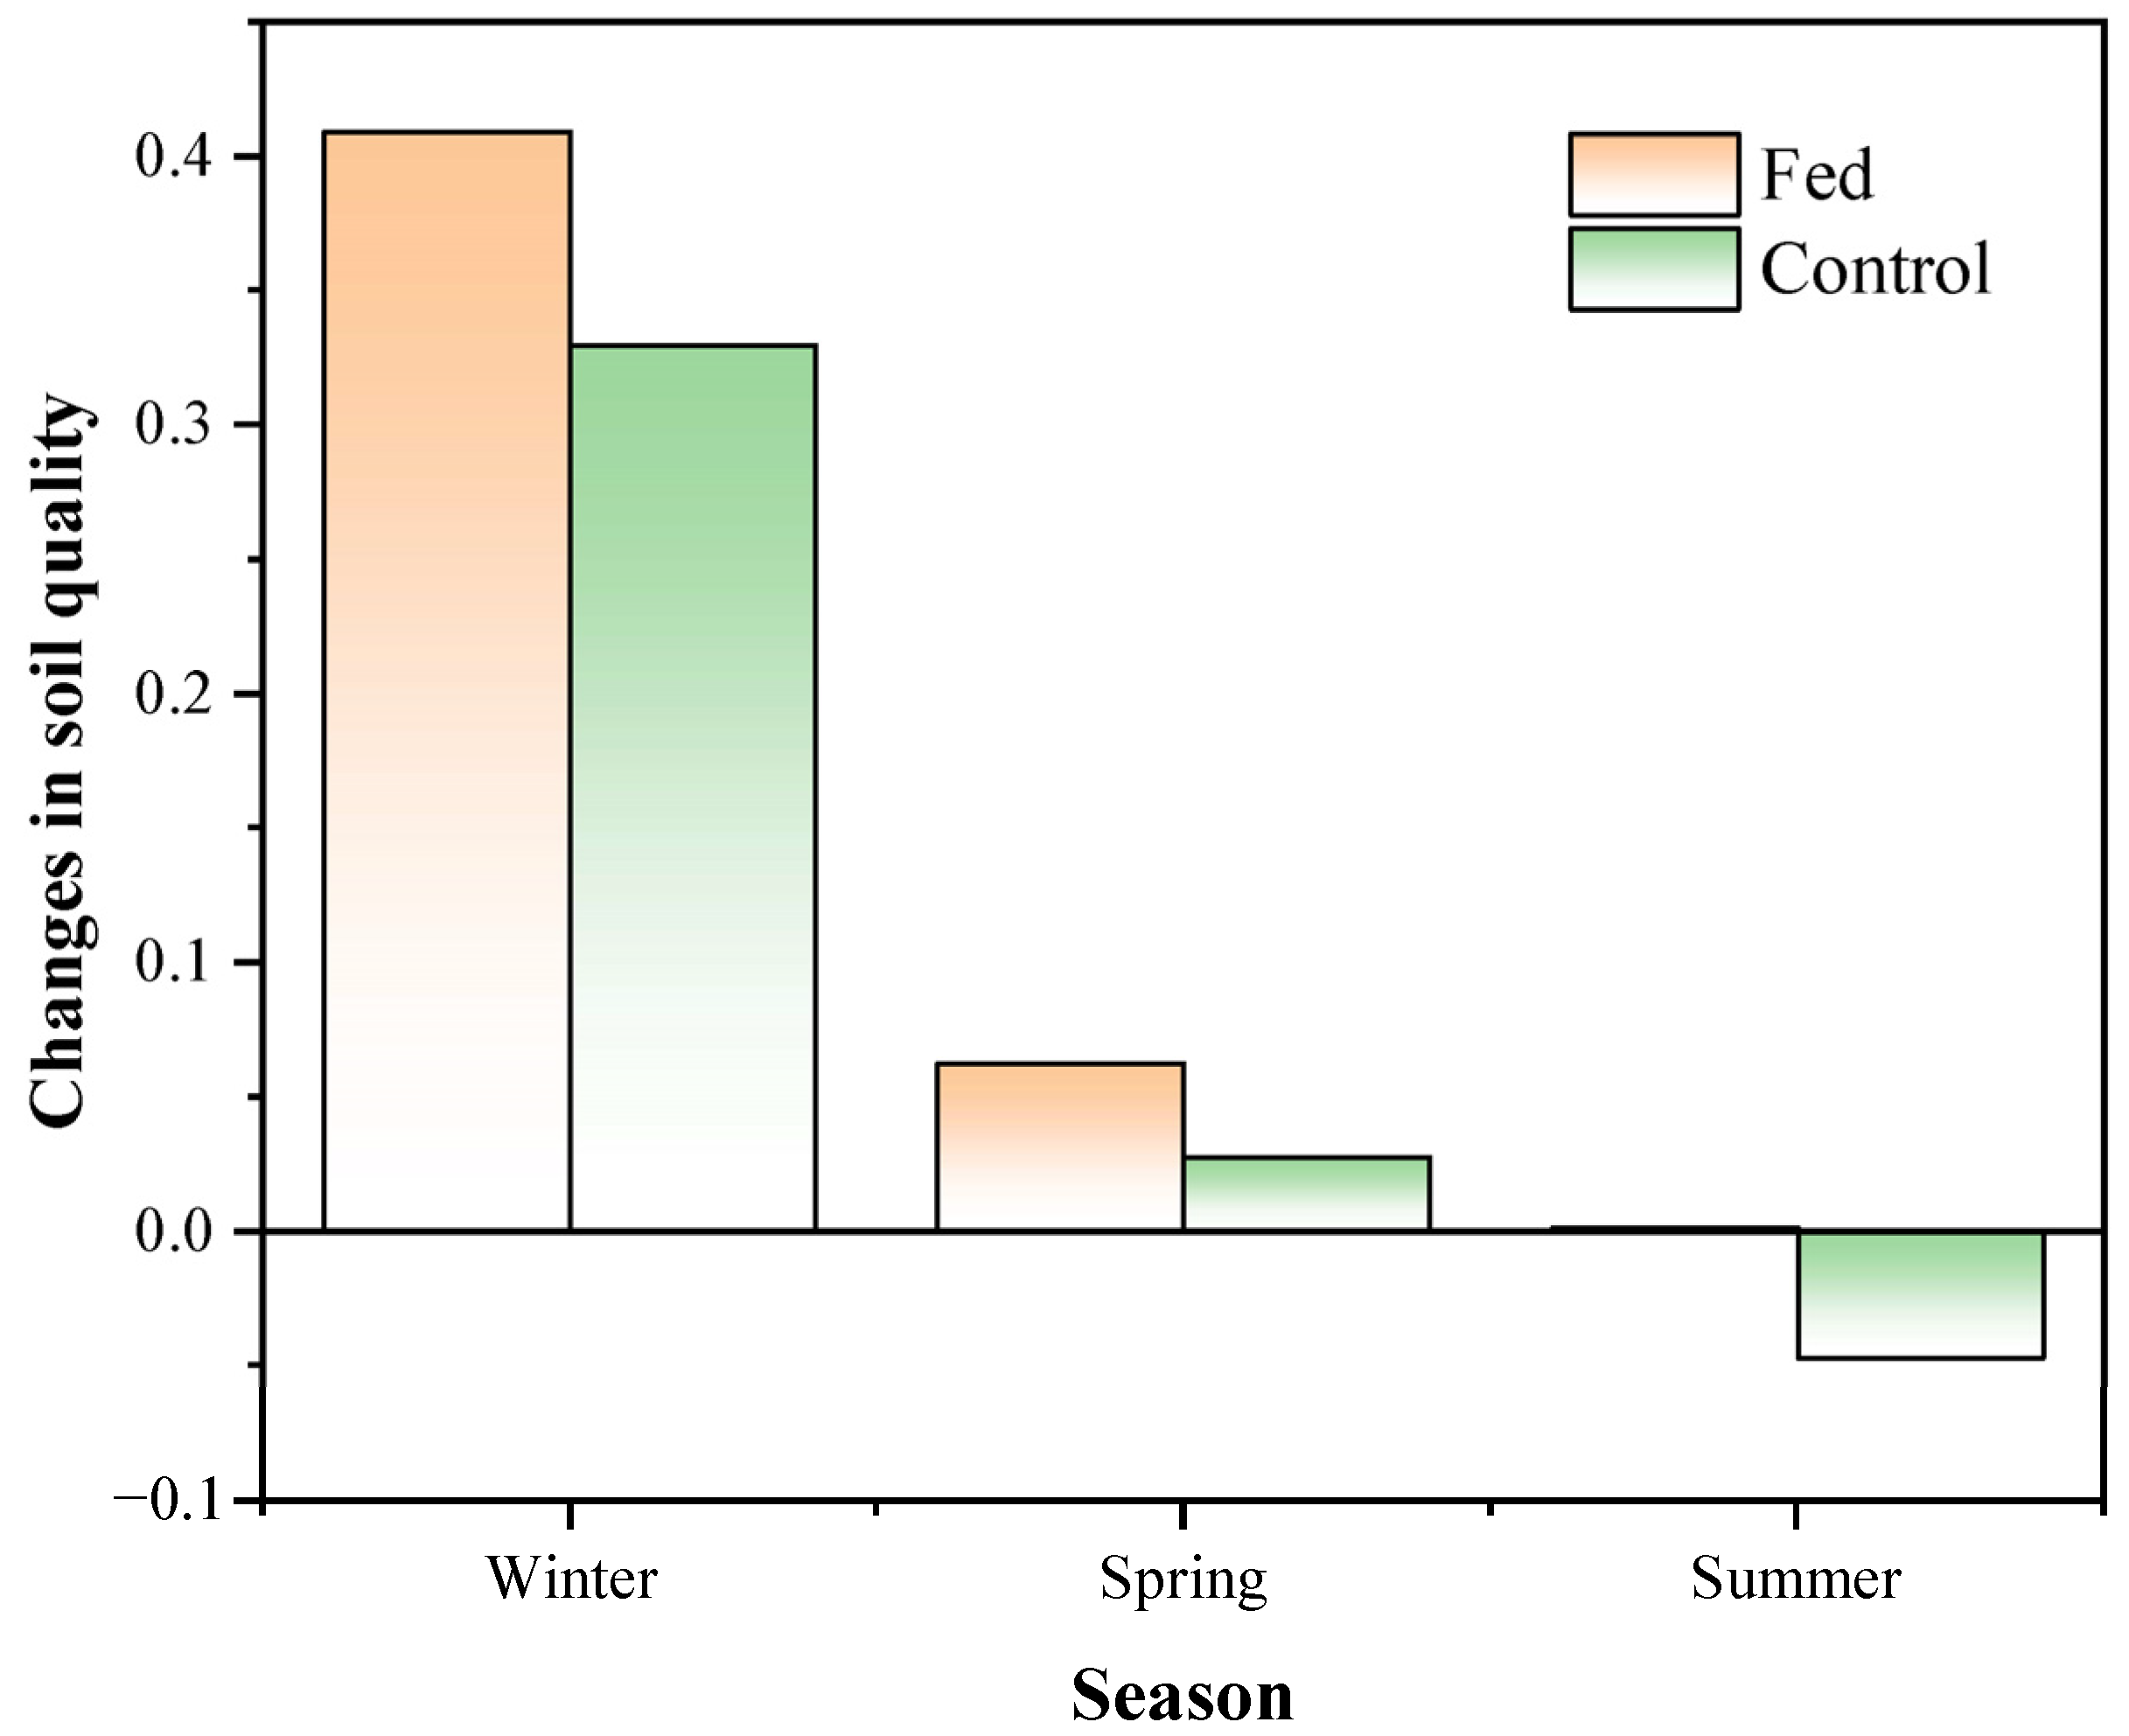
Using autumn values as a baseline, seasonal changes in soil quality were calculated, in order to clarify the changes in soil quality indices between feeding site and the control over time, with the result shown in Figure 4. From winter onwards, changes at the feeding site consistently exceeded those at the control; however, the magnitude of these positive changes decreased steadily with each season. By summer, soil quality at the feeding site had returned to approximately autumn levels.

3.3. Soil Bacterial Community

3.3.1. Bacterial Community Diversity

Seasonal diversity indices for soil bacterial communities are summarized in Table 5. In autumn, only the Shannon index differed significantly (p < 0.05), with a lower value at the feeding site. Chao and Shannon indices were significantly lower at the feeding site than at the control during winter, spring, and summer (p < 0.01). The average variation degree (AVD) was consistently lower at the feeding site in all seasons, indicating greater bacterial community stability there, as lower AVD values correspond to higher stability. Thus, although bacterial diversity and species richness were reduced at the feeding site, the bacterial communities exhibited greater stability compared with the control.

3.3.2. Bacterial Community Structure

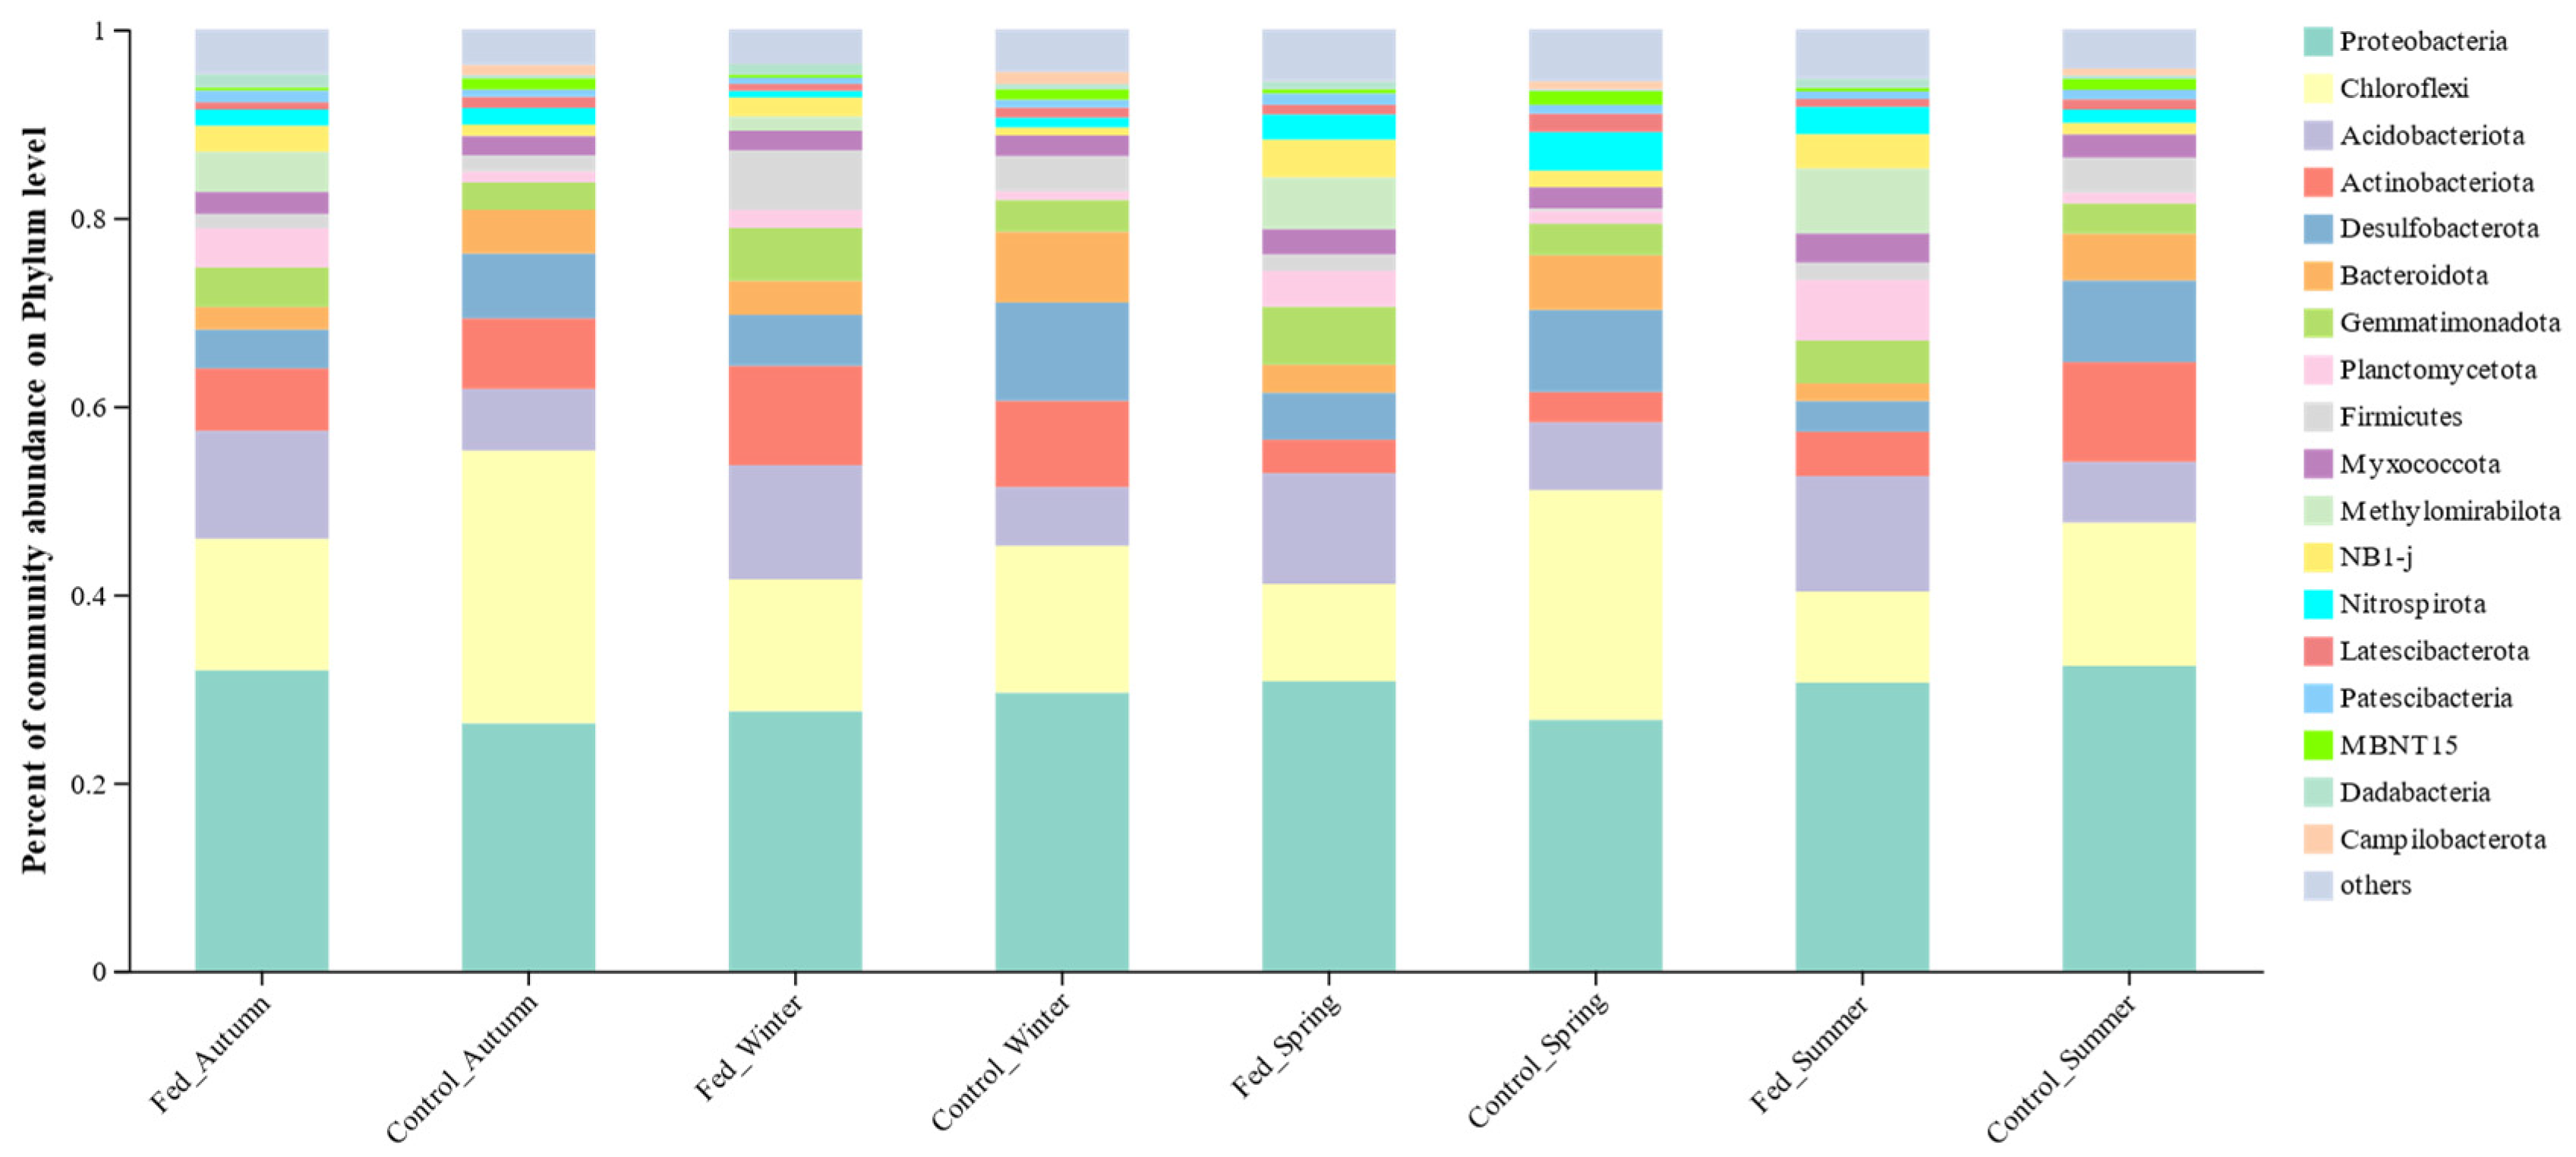
The composition of soil bacterial communities is shown in Figure 5. Across all seasons, the dominant phyla were Proteobacteria, Chloroflexi, Acidobacteriota, Actinobacteriota, and Desulfobacterota, together accounting for over 50% of relative abundance. In autumn and spring, Proteobacteria were more abundant at the feeding site by 5.62% and 4.07%, respectively. In winter and summer, Proteobacteria abundance was similar between sites. Actinobacteriota were more abundant in the control than the feeding site in autumn and summer, with minimal differences in winter and spring. Chloroflexi and Desulfobacterota were consistently less abundant at the feeding site, whereas Acidobacteriota were more abundant there.

3.3.3. Bacterial Community Function

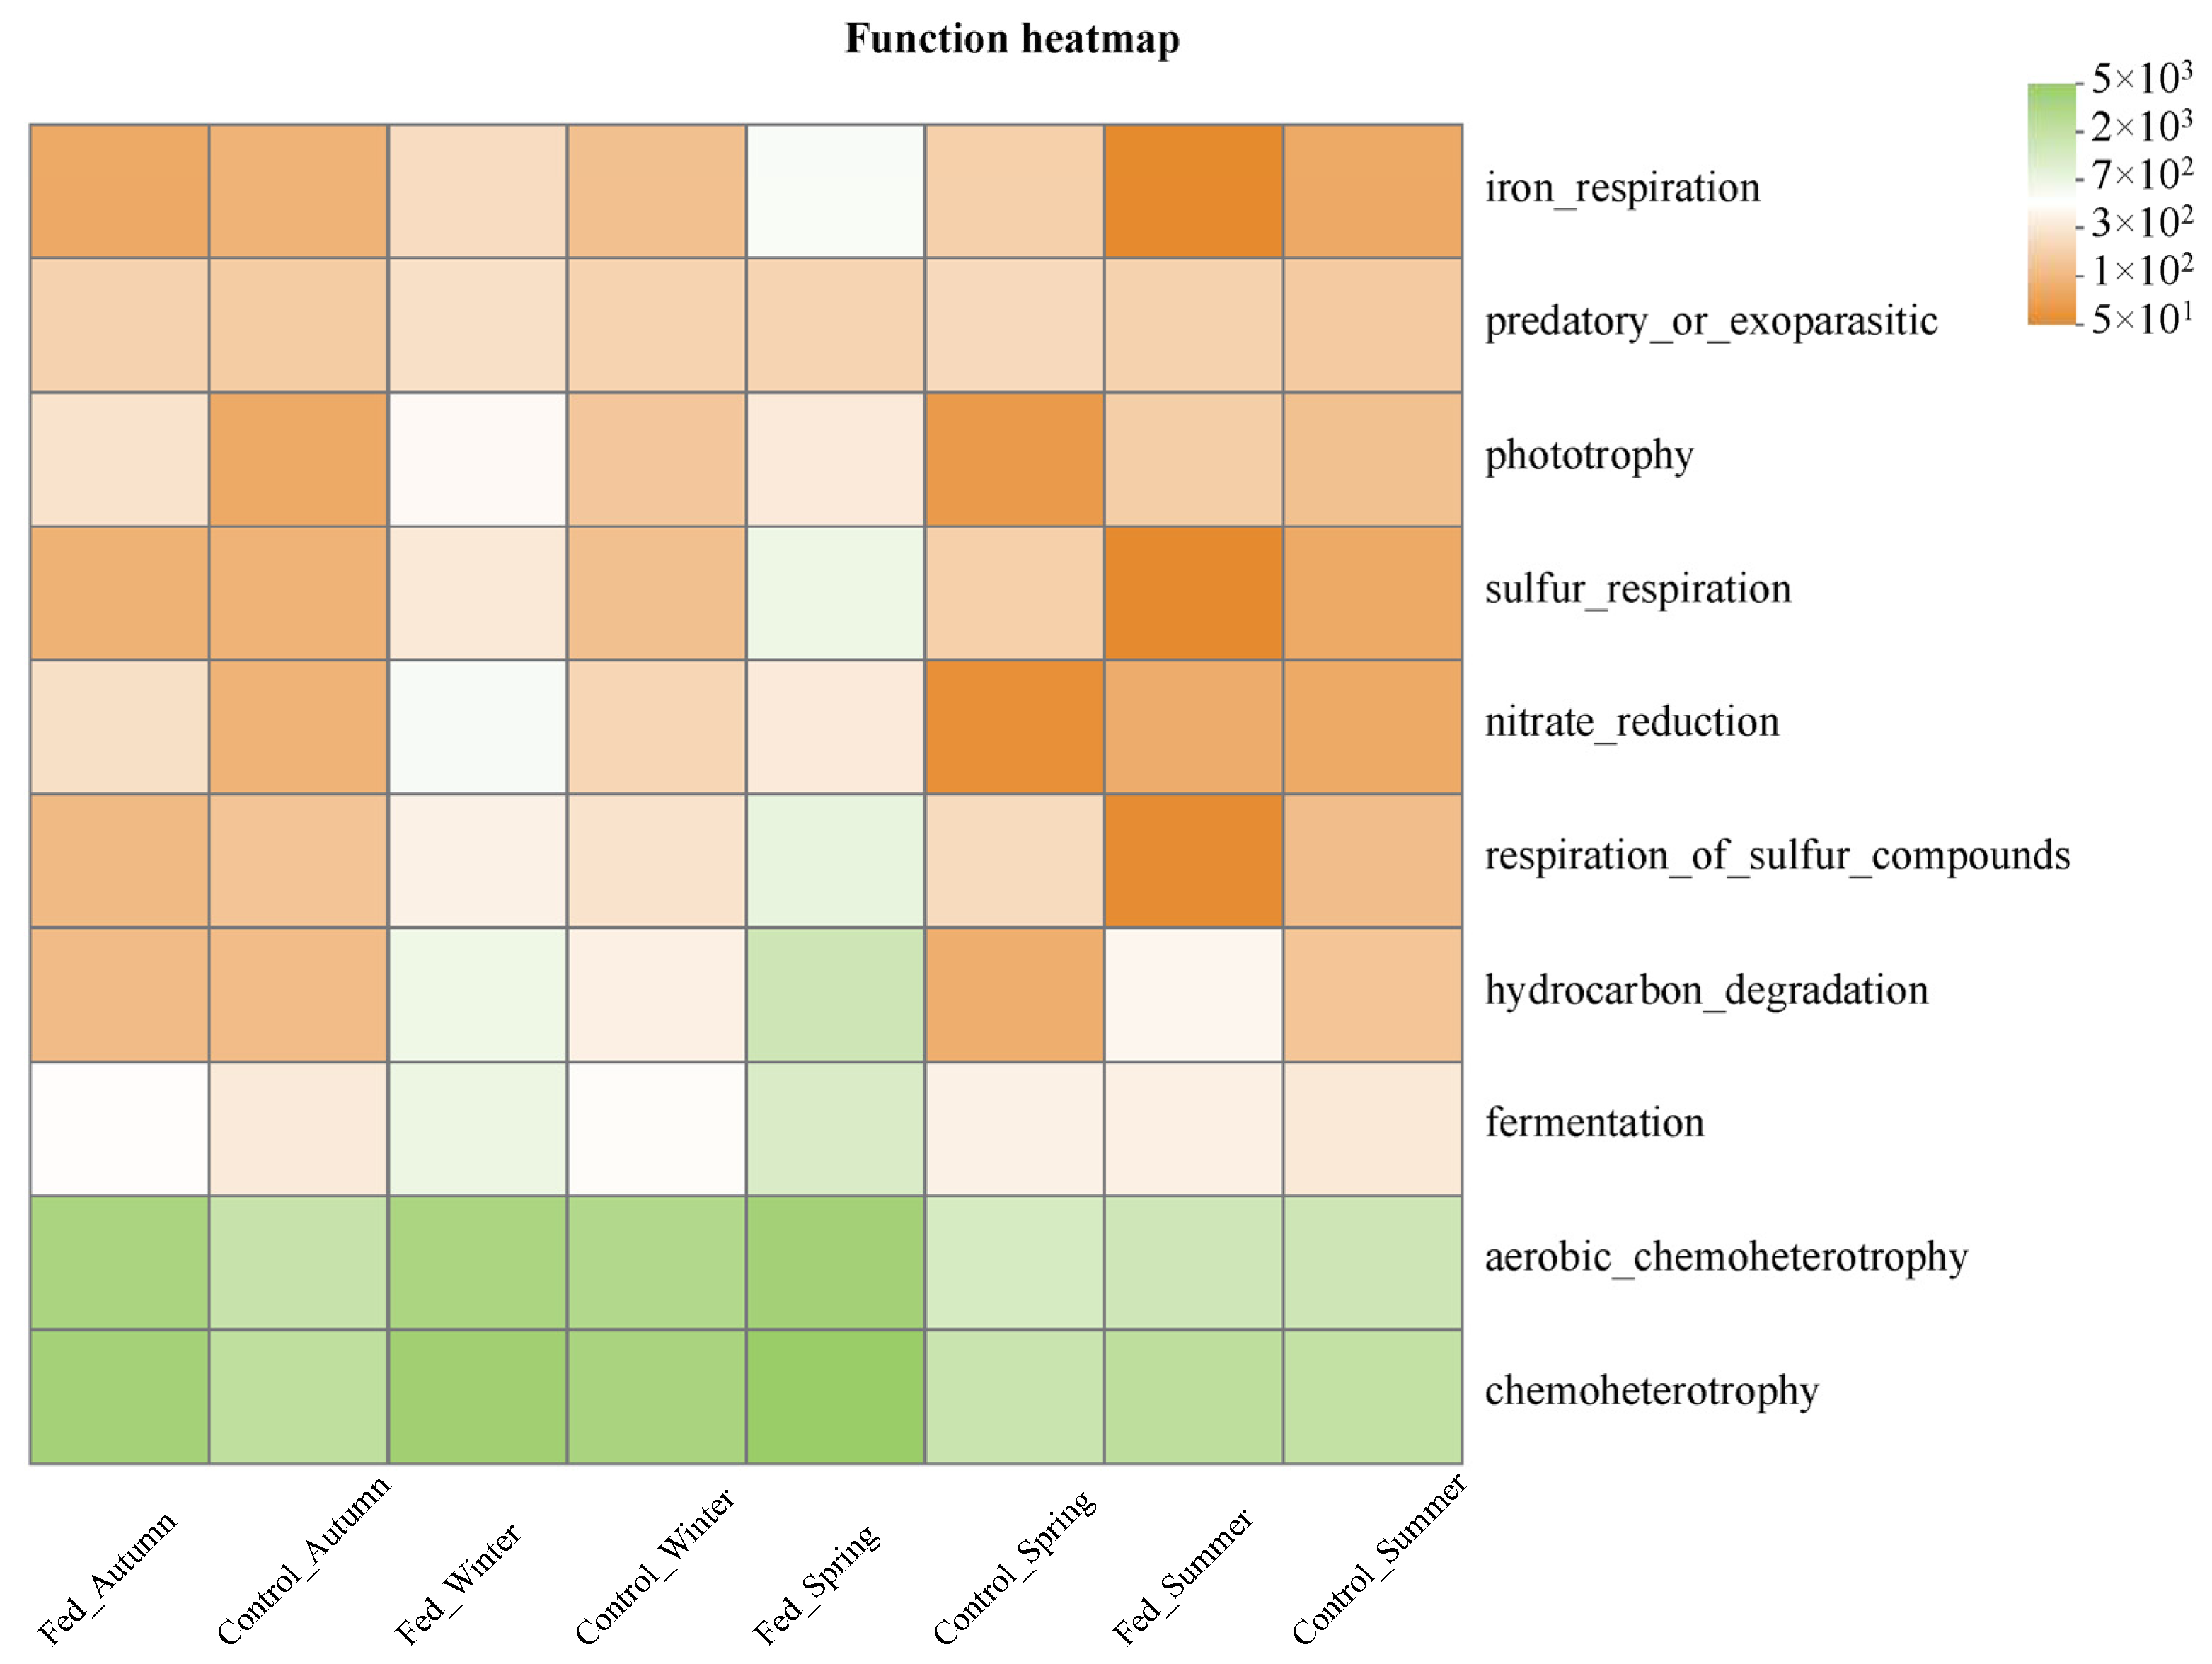
Predicted bacterial functions, based on the FAPROTAX database, are shown in Figure 6. Among the ten most abundant functions, chemoheterotrophy and aerobic chemoheterotrophy ranked first and second, respectively. In autumn, their abundance at the feeding site began to exceed that at the control, with the difference decreasing over time. Fermentation abundance was consistently higher at the feeding site. As sampling progressed, the abundance of hydrocarbon degradation increased within the fed, with the difference from the control area reaching its peak in spring and remaining higher in summer than in autumn. Nitrate reduction was generally higher at the feeding site, although the difference diminished over time.

3.3.4. Bacterial Community Co-Occurring Network

Co-occurrence network analysis at the OTU level (Figure 7, Table 6) revealed that positive correlations dominated in both feeding and control sites, suggesting cooperative bacterial interactions. In the feeding site, average degree and edge number peaked in winter before declining, while average path length was shortest in winter and increased over time. This pattern indicates reduced bacterial interaction strength and community complexity after abandonment of the feeding site.
In the control, average degree and edge number also declined, with path length increasing over time. In autumn, the feeding site showed lower average degree, clustering coefficient, and modularity index, but higher path length compared with the control, indicating a simpler community structure due to deer activity. By summer, the feeding site exhibited a higher degree and clustering coefficient, as well as a shorter path length, suggesting increased network complexity compared with the control.

3.4. Soil Property and Bacterial Community

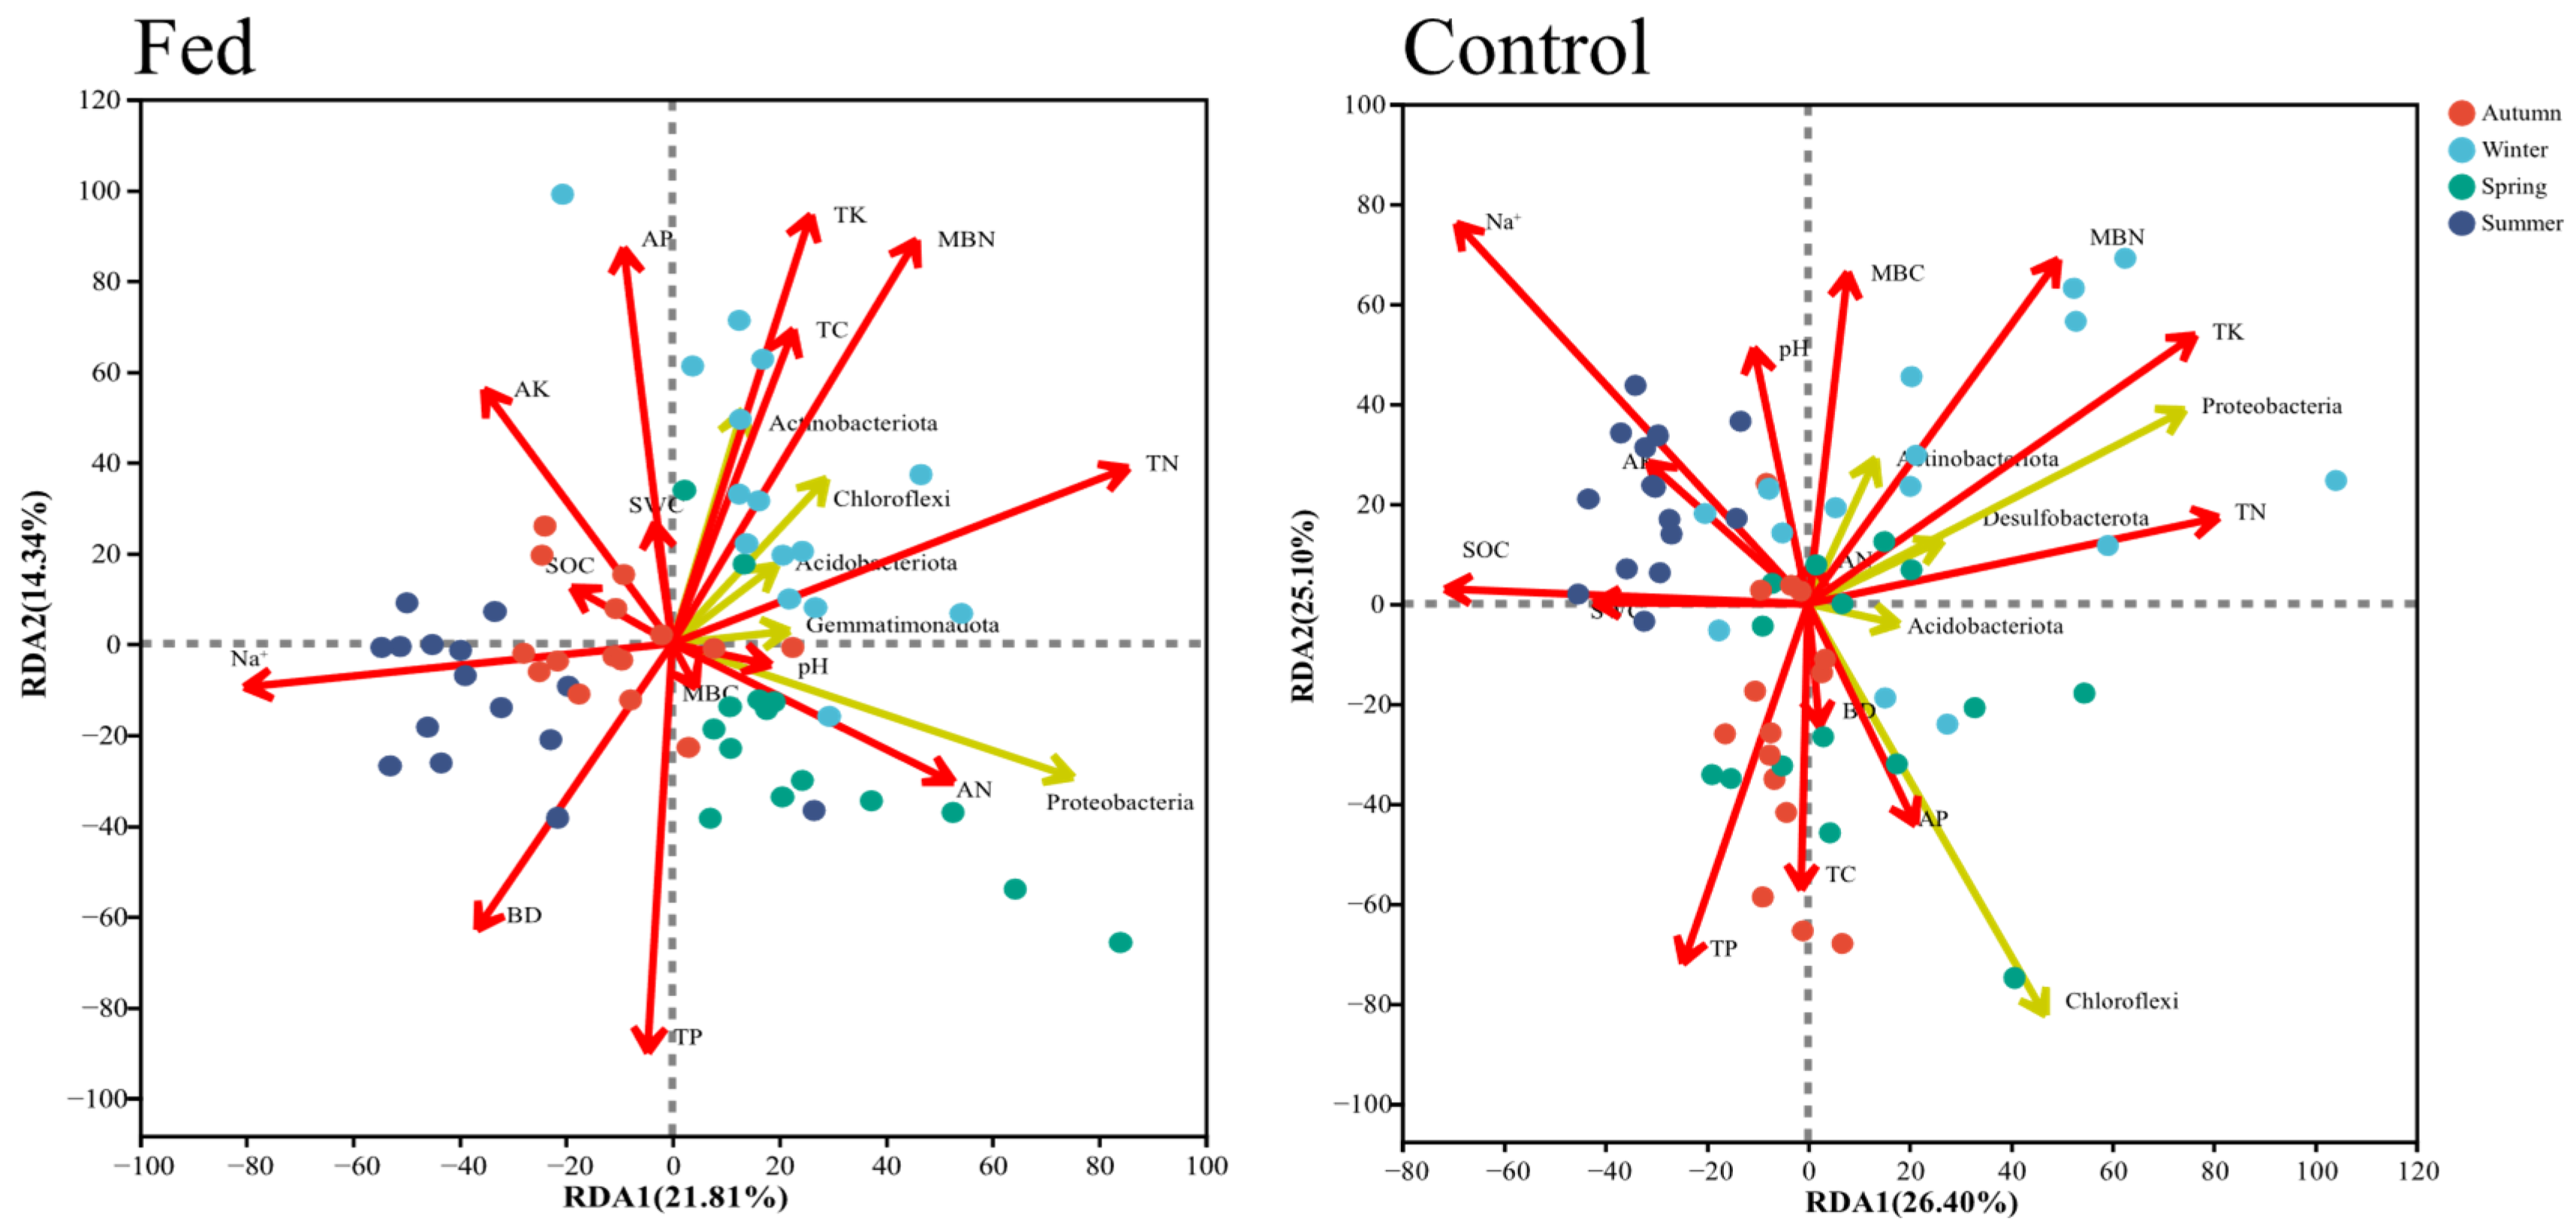
RDA analyses of the soil bacterial community and soil properties at the feeding site and control area are presented in Figure 8. To avoid covariance among the indicators, 16 environmental factors were selected based on the variance inflation factor (VIF < 10) (Table 7). The results showed that all 16 environmental factors had a VIF < 10; thus, they were included in the RDA analysis. The soil bacterial community was most affected by Na+ concentration. At the feeding site, Na+, TN, TP, TK, and MBN had the most significant influence on the soil bacterial community. Na+ was negatively correlated to the top five dominant phyla in terms of relative abundance, while TN and MBN were positively correlated with each dominant phylum. In the control, Na+, SOC, TK, TN, and MBN were most influential, with Na+ negatively correlating with the communities of Proteobacteria, Chloroflexi, Acidobacteriota, and Desulfobacterota.

4. Discussion

4.1. The Cluster of Père David’s Deer at Feeding Site Exerts Negative Effects on Soil Properties

As shown in Table 2, Père David’s deer clustering at feeding site correlates with declines in soil properties. Our measurements showing increased soil bulk density at feeding site corroborate the trampling-induced compaction patterns reported by Zhao et al. [41] in grazing systems. However, this increase did not reach statistical significance (p > 0.05), likely reflecting the unique soil properties of our coastal wetland soils. The study area’s sandy soils exhibit low aggregation, weak structure, and poor stability [42], which may weaken compaction effects in areas with high deer clustering and trampling. Nonetheless, trampling still triggered a degradation cascade: reduced infiltration led to moisture loss (−6.67% to 20%), while decreased leaching exacerbated salt accumulation—mirroring the disturbance trajectory observed by Zhao et al. [41] in overgrazed systems. However, as the sampling period progressed, we found that soil Na+ concentrations at the feeding sites were still increasing and were five times higher in summer than in autumn. There is a possible explanation for this: the loss of plant cover due to Père David’s deer activity enhances surface heating and water evapotranspiration, promoting upward salt movement via capillary action [43].
Primary productivity is crucial for regional soil carbon inputs [44]. This study found that soil organic and total carbon content at the feeding site were lower than in control areas, primarily due to the lack of plant-derived carbon inputs, leading to reduced soil carbon accumulation. Previous studies have demonstrated that intensive grazing history leads to enhanced soil denitrification and nitrogen depletion [45], primarily due to livestock trampling-induced soil compaction. These findings align well with our experimental results presented in Table 2. Furthermore, the observed divergence in soil carbon content between treatments was enhanced by the control site conditions, where invasive colonization and litter decomposition of S. alterniflora contributed to elevated soil carbon accumulation [46].

4.2. Microbial and Soil Nutrient Indicators as Key Factors in Soil Quality Assessment

In this study, PCA was used to screen the minimum data set (MDS) of soil quality indicators and eliminate redundancy. From 16 measured soil properties, 9 indicators were ultimately selected for soil quality assessment: bulk density (BD), soil water content (SWC), sodium (Na+), total carbon (TC), total nitrogen (TN), total phosphorus (TP), available potassium (AK), microbial biomass nitrogen (MBN), and Chao index. These indicators encompass soil physical, chemical, and biological attributes, aligning with the findings of Samaei et al. [16], suggesting they provide a comprehensive profile of the soil quality status in the reserve (Figure 3).
The indicator weights in Table 3 highlight MBN as the most influential factor in soil quality. This result is partially consistent with the findings of karst pasture [47], Texas High Plains [48], and Kenya [49], but this study confirms the priority of MBN in soil quality assessment at the digital level. The significant contribution of MBN to soil quality likely derives from its central role in biogeochemical cycling as a key indicator of microbial community activity, with elevated MBN levels corresponding to enhanced rates of organic matter decomposition and nutrient turnover [47,50]. Furthermore, related research demonstrated that MBN serves as a dynamic nitrogen pool [51] that directly facilitates plant nitrogen acquisition through microbial-mediated processes such as ammonium release from cellular residues, thereby supporting primary productivity in corresponding ecosystems [52,53]. This provides a suggestion for subsequent research that when formulating a habitat restoration plan for Père David’s deer, it is necessary to increase the nitrogen pool in the restoration site through certain means, such as replanting suitable nitrogen fixing grass, etc., to improve the soil quality level.
The results in Figure 4 and Table 4 reveal a remarkable and unusual increase in soil quality during winter, and according to the AVD indices in Table 5, the stability of the soil bacterial community decreased in winter compared to autumn. Additionally, the MBN at the feeding site reached its maximum in winter (Table 2). The results presented above demonstrate that external factors strongly disturbed the soil bacterial community during this season. We attribute this change primarily to an extreme cold wave during the winter sampling period, when the average minimum temperature in the reserve dropped to –10 °C for an extended duration. Low winter temperatures strongly influence bacterial life-history strategies [54]. As residual feed and related materials from autumn decomposes in early winter, resource availability rises, favoring Y-strategy bacterial taxa that can rapidly increase in biomass [54]. This is reflected in elevated MBC and MBN levels observed in both the feeding and control sites compared to autumn. Since MBN carries the highest weight in soil quality calculations, its winter increase largely explains the corresponding rise in soil quality during this period.
The inclusion of both TN and TP in the MDS is reasonable and they occupy the top 2 and 3 weights in soil quality calculations, respectively. As it has been confirmed by research that in areas disturbed by grazing animals over a long period of time, nutrients such as N and P are imported into the soil due to the legacy of excreta [55,56] and accompanying high soil bulk density, or soil compactness. This also reaffirms that the MDS screened in this article is scientifically logical and can be used for soil quality studies in the reserve. However, the control area has a wide area of S. alterniflora, which has been shown in the literature that will cause a large increase in soil nitrogen at the invaded site [57,58], which completely covers the differences in nitrogen inputs caused by Père David’s deer trampling and excreta legacy and resulted in higher soil quality in the control than at the feeding site in almost every season.

4.3. Bacterial Community Analysis Indicates Ongoing Carbon Loss

The feeding site was grazed and trampled intensively by Père David’s deer until its abandonment in autumn 2020, leaving the soil completely bare. Previous studies have shown that high grazing intensity reduces vegetation cover and alters plant community structure [59,60]. Changes in aboveground vegetation, in turn, affect soil microbial communities [61]. This aligns with our findings, which revealed that bacterial community diversity was lower at the feeding site compared to the control.
In line with Olivera et al. [62], the dominant bacterial phylum remained constant over time, with no change in species composition. Proteobacteria, the most abundant phylum in the reserve (Figure 5), thrived at the feeding site, likely due to its high growth rate in environments with elevated carbon mineralization rates [63,64]. This may be linked to the decomposition of residual deer excreta, which enriched soil nutrients [56]. Chloroflexi, the second-most abundant phylum, participates in nutrient cycling and tolerates nutrient-poor environments [65]. Its relative abundance at the feeding site declined over the study period, corresponding with an increasing trend in soil nutrient content (Table 2). Notably, the relative abundance of Chloroflexi was higher in the control area, likely due to the long history of invasion by S. alterniflora. As an invasive species, S. alterniflora has a high capacity for resource capture [66], which may lead to nutrient depletion over time, creating more nutrient-limited conditions than at the feeding site.
Chemoheterotrophy and aerobic chemoheterotrophy were the dominant bacterial functional groups at both sites, with higher relative abundance at the feeding site (Figure 6). Dong et al. [67] reported that the abundance of these two functional types is often enriched in carbon-deprived environments. Given the relative abundance and dominance of Proteobacteria and Chloroflexi shown in Figure 5, it can be hypothesized that soil carbon is in a state of continued consumption in the reserve. This is unfavorable for the ecological recovery of the reserve. Coupled with the fact that the reserve is located in the coastal wetland, which is theoretically an important carbon sink [68], the long-term state of carbon loss may lead to a significant weakening of its carbon sink function, or even its transformation into a carbon source. This transformation will not only weaken the role of the coastal wetland in climate change mitigation but may also further affect the restoration potential of the wetland vegetation by altering soil physicochemical properties (e.g., acidification, nutrient loss). Especially in the context of sea level rise and increasing salinization, the decline in carbon storage capacity may accelerate the ecological degradation of coastal wetlands, creating a vicious cycle of “carbon loss–habitat degradation”.

4.4. Regional Recovery Requires Human Intervention

The results of this article suggest that soil quality at the feeding site was consistently lower than the control area during the sampling period (Table 4). This is consistent with the results of studies on soil quality as influenced by grazing on the Tibetan Plateau and in the arid grasslands of north-west China [13,45]. This suggests that the negative impacts of grazing on the soil persisted and were not mitigated in any way since the year that the feeding site was abandoned. This is in contrast to most studies of grazing removal on pasture restoration, the positive changes in soil physical and chemical indicators after the removal of the grazing animals, as well as greater improvement in aboveground vegetation [69,70]. However, as a natural recovery strategy, this case required over five years to demonstrate effects. Wang et al. [71] showed that with artificial replanting and fertilization, even pastures with a long history of grazing can effectively restore their soil nutrients within one year, especially soil organic carbon, total nitrogen, and total phosphorus. This is a great inspiration for our study because it is feasible to enhance the soil quality of the feeding site for a short period of time to improve the habitat suitability of Père David’s deer by replanting their favorite plants.
Network analysis of bacterial communities showed that intense deer aggregation increased connectivity between network modules, resulting in greater complexity. Over time after abandonment, module connectivity decreased. This partially aligns with Hu et al. [72], who found that bacterial community assembly patterns became more random after grazing ceased, with prolonged removal reducing stability—potentially impairing soil nutrient cycling. Moreover, in conjunction with Zhang et al.’s [73] conclusion, this development of decomplexification of the soil bacterial community co-occurring network, which takes place after the cessation of grazing activities, was due to the input of litter. In our study, bacterial network complexity at the feeding site showed a slight downward trend compared to the control (Figure 7; Table 6). This is likely because the feeding sites, after prolonged feeding, were left completely bare, whereas the control was vegetated with S. alterniflora. Without active replanting, recovery of soil bacterial community function—and thus soil quality—may be slow, and full restoration to pre-disturbance levels is unlikely in the short term.
In the present study, soil bacterial communities were primarily influenced by Na+, and were negatively correlated to the top five dominant phyla (Figure 8), aligning with the findings in the Yellow River Delta [74]. Na+ plays a significant role as a filter in the assembly of bacterial communities in saline soils [75] and directly affects bacterial growth [76]. Based on our preliminary analyses, soil quality restoration at abandoned feeding sites should prioritize two key objectives: improving soil nitrogen pools and enhancing microbial activity. However, findings of this section indicate that controlling soil salinity within these sites must be addressed first, as excessive salinity negatively affects bacterial communities and compromises the overall effectiveness of ecological restoration efforts.

4.5. Limitations of the Study

Given the more than 30-year invasion history of S. alterniflora in the control area and its documented ecological impacts, our results may overestimate the negative effects of Père David’s deer clusters on soil nutrients and quality indices. This limitation is compounded by the reserve’s early prioritization of Père David’s deer disease surveillance, which resulted in insufficient baseline soil monitoring. Furthermore, the half-complete colonization of Core III by S. alterniflora over decades and the exponential growth of the population of Père David’s deer precluded the use of traditional control sites. Consequently, the absence of pre-invasion soil indices data and the lack of control sample sites in the traditional sense compelled us to select areas covered by S. alterniflora as a no-treatment control and employ a space-for-time substitution approach in our sampling methodology. This would be distorting treatment comparisons and limiting the usability of the results of this study on rangelands, which are without invasive species. To better assess the invasive role of S. alterniflora, future studies could evaluate soil quality or nutrient differences between grazed and no-grazing enclosures in invaded versus uninvaded sites, clarifying its amplification of Père David’s deer-induced soil nutrient losses, and enriching the results of this study.
Consequently, our findings have narrow ecological generalizability: they apply specifically to coastal wetland systems that have invasive plants, not native to the coastal wetland ecosystem. For example, in rangeland ecosystems devoid of invasive species (e.g., S. alterniflora), conclusions based on the research methodology described in this study will be subject to considerable variation. Restoration practitioners should therefore view our conclusions as context-dependent—relevant only where similar invasion legacies and landscape histories exist. Collectively, these limitations necessitate caution when extrapolating our results to non-invaded systems or inferring restoration strategies for pristine habitats.

5. Conclusions

This study demonstrates that soil quality in the reserve is largely governed by microbial biomass nitrogen. Comparative analyses showed that areas with a long history of feeding exhibited significantly lower soil quality than the control site. Shifts in bacterial community structure and functional profiles provide strong evidence of soil carbon loss driven by sustained herbivory pressure, with limited potential for short-term recovery. Although a reduction in bacterial community complexity was observed across all sites during the sampling period, the weaker response in previously grazed areas indicates enduring ecological legacies from Père David’s deer congregation. The dominance of carbon-mineralizing functional taxa further supports the conclusion that the reserve’s soils remain in a state of carbon loss. The RDA analysis results show that the bacterial community in this area is most affected by Na+. These seasonal patterns suggest that regional restoration will still require active human intervention and a focus on soil salt content management, addressing nitrogen supplementation and carbon sequestration, to improve the ecological restoration effects in Père David’s deer habitat.

Author Contributions

Y.Z.: Conceptualization, Investigation, Methodology, Data curation, Visualization, Writing—original draft. Y.A.: Data curation, Investigation, Methodology, Supervision. L.W.: Supervision. J.X.: Supervision. K.N.: Writing—review and editing. Y.W.: Conceptualization, Methodology, Supervision, Writing—review and editing, Project administration. All authors have read and agreed to the published version of the manuscript.

Funding

This research was funded by Jiangsu Science and Technology Project No. BE2022306, the National Key Research and Development Program of China No. 2016YFC0502704, and the Postgraduate Research & Practice Innovation Program of Jiangsu Province No. KYCX24_1353.

Institutional Review Board Statement

Not applicable.

Data Availability Statement

According to the relevant requirements of Jiangsu Dafeng Milu National Nature Reserve, China, the data involved in this article is kept confidential.

Acknowledgments

We thank the staff of the Dafeng National Nature Reserve for their support and for granting access to the study site. We are also grateful to the anonymous reviewers for their valuable comments, constructive suggestions, and editorial assistance, all of which have greatly improved this paper.

Conflicts of Interest

The authors declare that the research was conducted in the absence of any commercial or financial relationships that could be construed as a potential conflict of interest.

References

  1. Chen, H.Y.; Li, D.L.; Chen, Y.N.; Zhao, Z.Z. Spatial-Temporal Evolution Monitoring and Ecological Risk Assessment of Coastal Wetlands on Hainan Island, China. Remote Sens. 2023, 15, 1035. [Google Scholar] [CrossRef]
  2. Lin, Y.H.; Chen, Q.M.; Huang, F.M.; Xue, X.Z.; Zhang, Y. Identifying ecological risk and cost-benefit value for supporting habitat restoration: A case study from Sansha Bay, southeast China. Ecol. Process 2023, 12, 20. [Google Scholar] [CrossRef]
  3. Hong, Y.; Zhang, L.H.; Yang, P.; Tong, C.; Lin, Y.X.; Lai, D.Y.F.; Yang, H.; Tian, Y.L.; Zhu, W.Y.; Tang, K.W. Responses of coastal sediment organic and inorganic carbon to habitat modification across a wide latitudinal range in southeastern China. Catena 2023, 225, 107034. [Google Scholar] [CrossRef]
  4. Zhang, T.; Song, B.; Han, G.X.; Zhao, H.L.; Hu, Q.L.; Zhao, Y.; Liu, H.J. Effects of coastal wetland reclamation on soil organic carbon, total nitrogen, and total phosphorus in China: A meta-analysis. Land Degrad. Dev. 2023, 34, 3340–3349. [Google Scholar] [CrossRef]
  5. Margriter, S.C.; Bruland, G.L.; Kudray, G.M.; Lepczyk, C.A. Using indicators of land-use development intensity to assess the condition of coastal wetlands in Hawai’i. Landscape Ecol. 2014, 29, 517–528. [Google Scholar] [CrossRef]
  6. Antizar-Ladislao, B.; Mondal, P.; Mitra, S.; Sarkar, S.K. Assessment of trace metal contamination level and toxicity in sediments from coastal regions of West Bengal, eastern part of India. Mar. Pollut. Bull. 2015, 101, 886–894. [Google Scholar] [CrossRef] [PubMed]
  7. Grillo-Avila, D.; Antón-Pardo, M.; Armengol, J.; Puche, E.; Carballeira, R.; Moratalla-López, J.; Palacios-Abella, J.F.; López, I.; Minaglia, M.C.C.; Amador, P.; et al. Effects of the herbicide bentazone on the structure of plankton and benthic communities representative of Mediterranean coastal wetlands: A mesocosm experiment. Hydrobiologia 2025, 852, 2709–2728. [Google Scholar] [CrossRef]
  8. Ni, X.; Zhao, G.M.; Ye, S.Y.; Li, G.X.; Yuan, H.M.; He, L.; Su, D.P.; Ding, X.G.; Xie, L.J.; Pei, S.F.; et al. Spatial distribution and sources of heavy metals in the sediment and soils of the Yancheng coastal ecosystem and associated ecological risks. Environ. Sci. Pollut. Res. 2023, 30, 18843–18860. [Google Scholar] [CrossRef] [PubMed]
  9. Zhang, S.M.; Li, C.; Li, Y.P.; Chen, Q.; Hu, D.F.; Cheng, Z.B.; Wang, X.; Shan, Y.F.; Bai, J.D.; Liu, G. Genetic Differentiation of Reintroduced Pere David’s Deer (Elaphurus davidianus) Based on Population Genomics Analysis. Front. Genet. 2021, 12, 705337. [Google Scholar] [CrossRef]
  10. Zhu, Y.; Wu, Y.B.; An, Y.T. Effects of David Deer Grazing on Soil Bacterial and Fungal Communities in an Eastern Coastal Wetland of China. Diversity 2022, 14, 976. [Google Scholar] [CrossRef]
  11. An, Y.T.; Liu, B.; Wang, L.B.; Xie, S.B.; Xue, D.D.; Wu, Y.B. Effects of Père David deer (Elaphurus davidianus) grazing on soil physicochemical properties. Acta Ecol. Sin. 2020, 40, 3571–3578. [Google Scholar]
  12. Bogunovic, I.; Kljak, K.; Dugan, I.; Grbesa, D.; Telak, L.J.; Duvnjak, M.; Kisic, I.; Solomun, M.K.; Pereira, P. Grassland Management Impact on Soil Degradation and Herbage Nutritional Value in a Temperate Humid Environment. Agriculture 2022, 12, 7–921. [Google Scholar] [CrossRef]
  13. Liu, L.K.; Zhao, G.J.; An, Z.F.; Mu, X.M.; Jiao, J.Y.; An, S.S.; Tian, P. Effect of grazing intensity on alpine meadow soil quality in the eastern Qinghai-Tibet Plateau, China. Ecol. Indic. 2022, 141, 109111. [Google Scholar] [CrossRef]
  14. Valani, G.P.; Martini, A.F.; Pezzopane, J.R.M.; Bernardi, A.C.D.C.; Cooper, M. Soil physical quality in the topsoil of integrated and non-integrated grazing systems in a Brazilian Ferralsol. Soil. Tillage Res. 2022, 220, 105357. [Google Scholar] [CrossRef]
  15. Rezaei, S.A.; Gilkes, R.J.; Andrews, S.S.; Arzani, H. Soil quality assessment in semiarid rangeland in Iran. Soil. Use Manag. 2005, 21, 402–409. [Google Scholar] [CrossRef]
  16. Samaei, F.; Emami, H.; Lakzian, A. Assessing soil quality of pasture and agriculture land uses in Shandiz county, northwestern Iran. Ecol. Indic. 2022, 139, 108974. [Google Scholar] [CrossRef]
  17. Fierer, N.; Wood, S.A.; de Mesquita, C.P.B. How Microbes Can, and Cannot, Be Used to Assess Soil Health. Soil. Biol. Biochem. 2021, 153, 108111. [Google Scholar] [CrossRef]
  18. Singh, B.K.; Nunan, N.; Millard, P. Response of fungal, bacterial and ureolytic communities to synthetic sheep urine deposition in a grassland soil. FEMS Microbiol. Ecol. 2009, 70, 109–117. [Google Scholar] [CrossRef]
  19. Ma, X.Y.; Zhang, Q.T.; Zheng, M.M.; Gao, Y.; Yuan, T.; Hale, L.; Van Nostrand, J.D.; Zhou, J.Z.; Wan, S.Q.; Yang, Y.F. Microbial functional traits are sensitive indicators of mild disturbance by lamb grazing. ISME J. 2019, 13, 1370–1373. [Google Scholar] [CrossRef]
  20. Mahajan, G.; Das, B.; Morajkar, S.; Desai, A.; Murgaokar, D.; Kulkarni, R.; Sale, R.; Patel, K. Soil quality assessment of coastal salt-affected acid soils of India. Environ. Sci. Pollut. Res. 2020, 27, 26221–26238. [Google Scholar] [CrossRef]
  21. Armenise, E.; Redmile-Gordon, M.A.; Stellacci, A.M.; Ciccarese, A.; Rubino, P. Developing a soil quality index to compare soil fitness for agricultural use under different managements in the Mediterranean environment. Soil. Tillage Res. 2013, 130, 91–98. [Google Scholar] [CrossRef]
  22. Teng, L.D.; Jiang, G.H.; Ding, Z.L.; Wang, Y.; Liang, T.B.; Zhang, J.Z.; Dai, H.X.; Cao, F.B. Evaluation of tobacco-planting soil quality using multiple distinct scoring methods and soil quality indices. J. Clean. Prod. 2024, 441, 140883. [Google Scholar] [CrossRef]
  23. Yu, P.J.; Han, D.L.; Liu, S.W.; Wen, X.; Huang, Y.X.; Jia, H.T. Soil quality assessment under different land uses in an alpine grassland. Catena 2018, 171, 280–287. [Google Scholar] [CrossRef]
  24. Vasu, D.; Singh, S.K.; Ray, S.K.; Duraisami, V.P.; Tiwary, P.; Chandran, P.; Nimkar, A.M.; Anantwar, S.G. Soil Quality Index (SQI) as a Tool to Evaluate Crop Productivity in Semi-arid Deccan Plateau, India. Geoderma 2016, 282, 70–79. [Google Scholar] [CrossRef]
  25. Wang, B.; Zhang, F.W.; Chen, L.; Cheng, Y.P. Comprehensive assessment on quality of soil and water resources of Heilonggang area by entropy weights. Bull. Soil. Water Conserv. 2012, 6, 268–272. [Google Scholar]
  26. Geng, S.B.; Shi, P.L.; Zong, N.; Zhu, W.R. Using Soil Survey Database to Assess Soil Quality in the Heterogeneous Taihang Mountains, North China. Sustainability 2018, 10, 3443. [Google Scholar] [CrossRef]
  27. Yuan, B.D.; Xie, S.B.; Liu, B.; Xue, D.D.; Sun, D.M. Differential movement pattern of Pere David’s deer associated with the temporal rhythm using GPS collar fix. Glob. Ecol. Conserv. 2019, 18, e00641. [Google Scholar] [CrossRef]
  28. Zha, J.J.; Wu, Y.B.; An, Y.T. Diet analysis of Père David’s deer (Elaphurus davidianus) based on stable isotope analysis. Wildlife Biol. 2024, 2024, e01136. [Google Scholar] [CrossRef]
  29. Zhang, Z.; Wang, X.; Li, S.Y.; Fu, Y.H.; Li, Y.; Nawaz, S.; Chen, J.; Yang, G.X.; Li, J.K.; Shi, D.L. Isolation of a Virulent Clostridium perfringens Strain from Elaphurus davidianus and Characterization by Whole-Genome Sequence Analysis. Curr. Issues Mol. Biol. 2024, 46, 7169–7186. [Google Scholar] [CrossRef]
  30. Mo, Q.Y.; Yao, H.Y.; Wu, H.; Zhao, D.P. Impact of Environmental Food Intake on the Gut Microbiota of Endangered Père David’s Deer: Primary Evidence for Population Reintroduction. Animals 2024, 14, 728. [Google Scholar] [CrossRef]
  31. Raiesi, F. A minimum data set and soil quality index to quantify the effect of land use conversion on soil quality and degradation in native rangelands of upland arid and semiarid regions. Ecol. Indic. 2017, 75, 307–320. [Google Scholar] [CrossRef]
  32. Vaieretti, M.V.; Cingolani, A.M.; Harguindeguy, N.P.; Cabido, M. Effects of differential grazing on decomposition rate and nitrogen availability in a productive mountain grassland. Plant Soil. 2013, 371, 675–691. [Google Scholar] [CrossRef]
  33. Yu, P.J.; Liu, S.W.; Zhang, L.; Li, Q.; Zhou, D.W. Selecting the minimum data set and quantitative soil quality indexing of alkaline soils under different land uses in northeastern China. Sci. Total Environ. 2018, 616–617, 564–571. [Google Scholar] [CrossRef]
  34. Ekosse, G.I.E.; Fouche, P.S. Multivariate analysis and spatial distribution of selected cations in soils within the proximity of an abandoned manganese mine, Kgwakgwe, Botswana. Fresen Environ. Bull. 2007, 16, 261–271. [Google Scholar]
  35. Zhang, M.; Song, R.Q.; Zhang, R.X.; An, X.L.; Chu, G.X. The pattern of soil microbe metabolic limitation was altered by the increased sheep grazing intensity in two contrasting grasslands: Implications for grassland management in semiarid regions. Land Degrad. Dev. 2023, 34, 72–83. [Google Scholar] [CrossRef]
  36. Ruzek, L.; Ruzková, M.; Vorísek, K.; Kubát, J.; Friedlová, M.; Mikanová, O. Chemical and microbiological characterization of Cambisols, Luvisols and Stagnosols. Plant Soil. Environ. 2009, 55, 231–237. [Google Scholar] [CrossRef]
  37. Lu, R.K. Analytical Methods for Soil and Agricultural Chemistry; China Agricultural Science and Technology Press: Beijing, China, 2000. [Google Scholar]
  38. Fu, G.; Shen, Z.X.; Zhang, X.Z.; Zhou, Y.T. Response of soil microbial biomass to short-term experimental warming in alpine meadow on the Tibetan Plateau. Appl. Soil. Ecol. 2012, 61, 158–160. [Google Scholar] [CrossRef]
  39. Xu, N.; Tan, G.C.; Wang, H.Y.; Gai, X.P. Effect of biochar additions to soil on nitrogen leaching, microbial biomass and bacterial community structure. Eur. J. Soil. Biol. 2016, 74, 1–8. [Google Scholar] [CrossRef]
  40. Karkaj, E.S.; Sepehry, A.; Barani, H.; Motamedi, J.; Shahbazi, F. Establishing a Suitable Soil Quality Index for Semi-arid Rangeland Ecosystems in Northwest of Iran. J. Soil. Sci. Plant Nutr. 2019, 19, 648–658. [Google Scholar] [CrossRef]
  41. Zhao, Y.; Peth, S.; Krümmelbein, J.; Horn, R.; Wang, Z.Y.; Steffens, M.; Hoffmann, C.; Peng, X.H. Spatial variability of soil properties affected by grazing intensity in Inner Mongolia grassland. Ecol. Model. 2007, 205, 241–254. [Google Scholar] [CrossRef]
  42. Gao, Y.Z.; Han, X.G.; Wang, S.P. The effects of grazing on grassland soils. Acta Ecol. Sin. 2004, 24, 790–797. [Google Scholar]
  43. Yu, O.T.; Chmura, G.L. Soil carbon may be maintained under grazing in a St Lawrence Estuary tidal marsh. Environ. Conserv. 2009, 36, 312–320. [Google Scholar] [CrossRef]
  44. Li, J.W.; Wang, K.B.; Shangguan, Z.P.; Deng, L. Coupling and decoupling of soil carbon, nitrogen and phosphorus stocks following grazing exclusion in temperate grasslands. Catena 2022, 211, 106003. [Google Scholar] [CrossRef]
  45. Lu, Q.; Ma, H.B.; Zhou, Y.; Liu, J.D.; Shen, Y. Restoration of soil quality of degraded grassland can be accelerated by reseeding in an arid area of Northwest China. Front. Plant Sci. 2023, 14, 1101295. [Google Scholar] [CrossRef]
  46. Wang, L.; Li, Y.; Hei, J.; Wang, W.Q.; Sardans, J.; Zhang, Z.H.; Zeng, F.J.; Ge, M.Q.; Liao, Y.Y.; Fang, Y.Y.; et al. Impacts of Spartina alterniflora invasion on soil carbon components of particulate and mineral-associated organic matter and soil organic matter mineralization in estuarine wetlands. Appl. Soil. Ecol. 2025, 206, 105857. [Google Scholar] [CrossRef]
  47. Qin, W.F.; Zhao, X.C.; Yang, F.; Chen, J.H.; Mo, Q.S.; Cui, S.; Chen, C.; He, S.J.; Li, Z. Impact of fertilization and grazing on soil N and enzyme activities in a karst pasture ecosystem. Geoderma 2023, 437, 116578. [Google Scholar] [CrossRef]
  48. Bhandari, K.B.; West, C.P.; Acosta-Martinez, V. Assessing the role of interseeding alfalfa into grass on improving pasture soil health in semi-arid Texas High Plains. Appl. Soil. Ecol. 2020, 147, 103399. [Google Scholar] [CrossRef]
  49. Oduor, C.O.; Karanja, N.K.; Onwonga, R.N.; Mureithi, S.M.; Pelster, D.; Nyberg, G. Enhancing soil organic carbon, particulate organic carbon and microbial biomass in semi-arid rangeland using pasture enclosures. BMC Ecol. 2018, 18, 45. [Google Scholar] [CrossRef]
  50. Mao, L.; Tang, L.L.; Ye, S.M.; Wang, S.Q. Soil organic C and total N as well as microbial biomass C and N affect aggregate stability in a chronosequence of Chinese fir plantations. Eur. J. Soil. Biol. 2021, 106, 103347. [Google Scholar] [CrossRef]
  51. Zhang, J.; Zhao, Y.S.; Xin, Y. Changes in and evaluation of surface soil quality in Populus × xiaohei shelterbelts in midwestern Heilongjiang province, China. J. For. Res. 2021, 32, 1221–1233. [Google Scholar] [CrossRef]
  52. Xie, M.Z.; Zhao, L.; Wu, X.D.; Tian, L.M.; Yue, G.Y.; Zhou, H.Y.; Wu, Z.M. Seasonal variations of nitrogen in permafrost-affected soils of the Qinghai-Tibetan Plateau. Catena 2020, 195, 104793. [Google Scholar] [CrossRef]
  53. Li, H.T.; Wang, L.; Peng, Y.; Zhang, S.W.; Lv, S.Q.; Li, J.; Abdo, A.I.; Zhou, C.J.; Wang, L.Q. Film mulching, residue retention and N fertilization affect ammonia volatilization through soil labile N and C pools. Agr. Ecosyst. Environ. 2021, 308, 107272. [Google Scholar] [CrossRef]
  54. Yin, S.; Wang, C.K.; Abalos, D.; Guo, Y.; Pang, X.S.; Tan, C.Q.; Zhou, Z.H. Seasonal response of soil microbial community structure and life history strategies to winter snow cover change in a temperate forest. Sci. Total Environ. 2024, 949, 175066. [Google Scholar] [CrossRef] [PubMed]
  55. Isabel, P.C.M.; Francisco, G.S.; Consolación, W.B.; Antonio, G.M.F.; Ramón, L.S.F.; Eva, R.; Luis, M.O.J.; Manuela, A.A. Application of Soil Multiparametric Indices to Assess Impacts of Grazing in Mediterranean Forests. Land 2024, 13, 411. [Google Scholar] [CrossRef]
  56. Yoshitake, S.; Soutome, H.; Koizumi, H. Deposition and decomposition of cattle dung and its impact on soil properties and plant growth in a cool temperate pasture. Ecol. Res. 2014, 29, 673–684. [Google Scholar] [CrossRef]
  57. Mozdzer, T.J.; Kirwan, M.; McGlathery, K.J.; Zieman, J.C. Nitrogen uptake by the shoots of smooth cordgrass Spartina alterniflora. Mar. Ecol-Prog. Ser. 2011, 433, 42–52. [Google Scholar] [CrossRef]
  58. Lin, X.; Yang, Y.L.; Yang, P.; Hong, Y.; Zhang, L.H.; Tong, C.; Lai, D.Y.F.; Lin, Y.X.; Tan, L.S.; Tian, Y.L.; et al. Soil organic nitrogen content and composition in different wetland habitat types along the south-east coast of China. Catena 2023, 232, 107457. [Google Scholar] [CrossRef]
  59. Fischer, M.; Wipf, S. Effect of low-intensity grazing on the species-rich vegetation of traditionally mown subalpine meadows. Biol. Conserv. 2002, 104, 1–11. [Google Scholar] [CrossRef]
  60. Jordan, S.E.; Palmquist, K.A.; Burke, I.C.; Lauenroth, W.K. Small effects of livestock grazing intensification on diversity, abundance, and composition in a dryland plant community. Ecol. Appl. 2022, 32, e2693. [Google Scholar] [CrossRef]
  61. Cui, H.W.; Liu, Z.Y.; Chen, J.W.; Wang, J.J.; Song, H.X.; Gao, H.N.; Chen, S.Y.; Wang, Y.J.; Liu, K.; Xiao, S.; et al. Grazing induces positive direct effect of shrubs on nematode diversity but suppresses indirect effects through microbial pathways. Plant Soil. 2024, 500, 681–695. [Google Scholar] [CrossRef]
  62. Olivera, N.L.; Prieto, L.; Bertiller, M.B.; Ferrero, M.A. Sheep grazing and soil bacterial diversity in shrublands of the Patagonian Monte, Argentina. J. Arid. Environ. 2016, 125, 16–20. [Google Scholar] [CrossRef]
  63. Fierer, N.; Bradford, M.A.; Jackson, R.B. Toward an ecological classification of soil bacteria. Ecology 2007, 88, 1354–1364. [Google Scholar] [CrossRef] [PubMed]
  64. Zheng, X.Z.; Lin, C.; Guo, B.L.; Yu, J.H.; Ding, H.; Peng, S.Y.; Sveen, T.R.; Zhang, Y.S. Effects of re-vegetation restoration on soil bacterial community structure in degraded land in subtropical China. Eur. J. Soil. Biol. 2020, 98, 103184. [Google Scholar] [CrossRef]
  65. Li, T.F.; Wang, Y.Y.; Kamran, M.; Chen, X.Y.; Tan, H.; Long, M.X. Effects of Grass Inter-Planting on Soil Nutrients, Enzyme Activity, and Bacterial Community Diversity in an Apple Orchard. Front. Plant Sci. 2022, 13, 901143. [Google Scholar] [CrossRef]
  66. Muench, A.; Elsey-Quirk, T. Competitive reversal between plant species is driven by species-specific tolerance to flooding stress and nutrient acquisition during early marsh succession. J. Appl. Ecol. 2019, 56, 2115–2247. [Google Scholar] [CrossRef]
  67. Dong, H.Y.; Tian, Y.L.; Lu, J.J.; Zhao, J.; Tong, Y.B.; Niu, J.F. Bioaugmented biological contact oxidation reactor for treating simulated textile dyeing wastewater. Bioresour. Technol. 2024, 404, 130916. [Google Scholar] [CrossRef]
  68. Li, J.Q.; Jiang, M.K.; Pei, J.M.; Fang, C.M.; Li, B.; Nie, M. Convergence of carbon sink magnitude and water table depth in global wetlands. Ecol. Lett. 2023, 26, 797–804. [Google Scholar] [CrossRef]
  69. Shang, Z.H.; Cao, J.J.; Guo, R.Y.; Henkin, Z.; Ding, L.M.; Long, R.J.; Deng, B. Effect of Enclosure on Soil Carbon, Nitrogen and Phosphorus of Alpine Desert Rangeland. Land Degrad. Dev. 2017, 28, 1166–1177. [Google Scholar] [CrossRef]
  70. Li, Y.R.; Hu, S.J.; Lang, S.X.; Pu, Y.L.; Zhang, S.R.; Li, T.; Xu, X.X.; Jia, Y.X.; Wang, G.Y.; Yuan, D.G.; et al. Soil quality and ecological benefits assessment of alpine desertified grassland following different ecological restoration measures. Front. Plant Sci. 2023, 14, 1283457. [Google Scholar] [CrossRef]
  71. Wang, Y.; Wang, Z.C.; Kang, Y.K.; Zhang, Z.M.; Bao, D.H.; Sun, X.M.; Su, J.H. Assessing the win-win situation of forage production and soil organic carbon through a short-term active restoration strategy in alpine grasslands. Front. Plant Sci. 2024, 14, 1290808. [Google Scholar] [CrossRef]
  72. Hu, Y.G.; Liu, W.J.; Chang, J.C.; Fan, Y.X.; Hou, S.P.; Zhang, Z.H.; Su, X.; Bahram, M.; Wang, S.P. Grazing exclusion-induced alterations of soil microbial biogeographic pattern and co-occurrence network across a Tibetan elevation gradient. Agr. Ecosyst. Environ. 2024, 376, 109231. [Google Scholar] [CrossRef]
  73. Zhang, C.; Liu, G.B.; Song, Z.L.; Wang, J.; Guo, L. Interactions of soil bacteria and fungi with plants during long-term grazing exclusion in semiarid grasslands. Soil. Biol. Biochem. 2018, 124, 47–58. [Google Scholar] [CrossRef]
  74. Li, Y.; Kang, E.Z.; Song, B.; Wang, J.S.; Zhang, X.D.; Wang, J.Z.; Li, M.; Yan, L.; Yan, Z.Q.; Zhang, K.R.; et al. Soil salinity and nutrients availability drive patterns in bacterial community and diversity along succession gradient in the Yellow River Delta. Estuar. Coast. Shelf Sci. 2021, 262, 107621. [Google Scholar] [CrossRef]
  75. Li, Y.; Wang, J.; Li, E.; Yang, X.D.; Yang, J.J. Shifts in Microbial Community Structure and Co-occurrence Network along a Wide Soil Salinity Gradient. Microorganisms 2024, 12, 1268. [Google Scholar] [CrossRef] [PubMed]
  76. Rath, K.M.; Murphy, D.N.; Rousk, J. The microbial community size, structure, and process rates along natural gradients of soil salinity. Soil. Biol. Biochem. 2019, 138, 107607. [Google Scholar] [CrossRef]
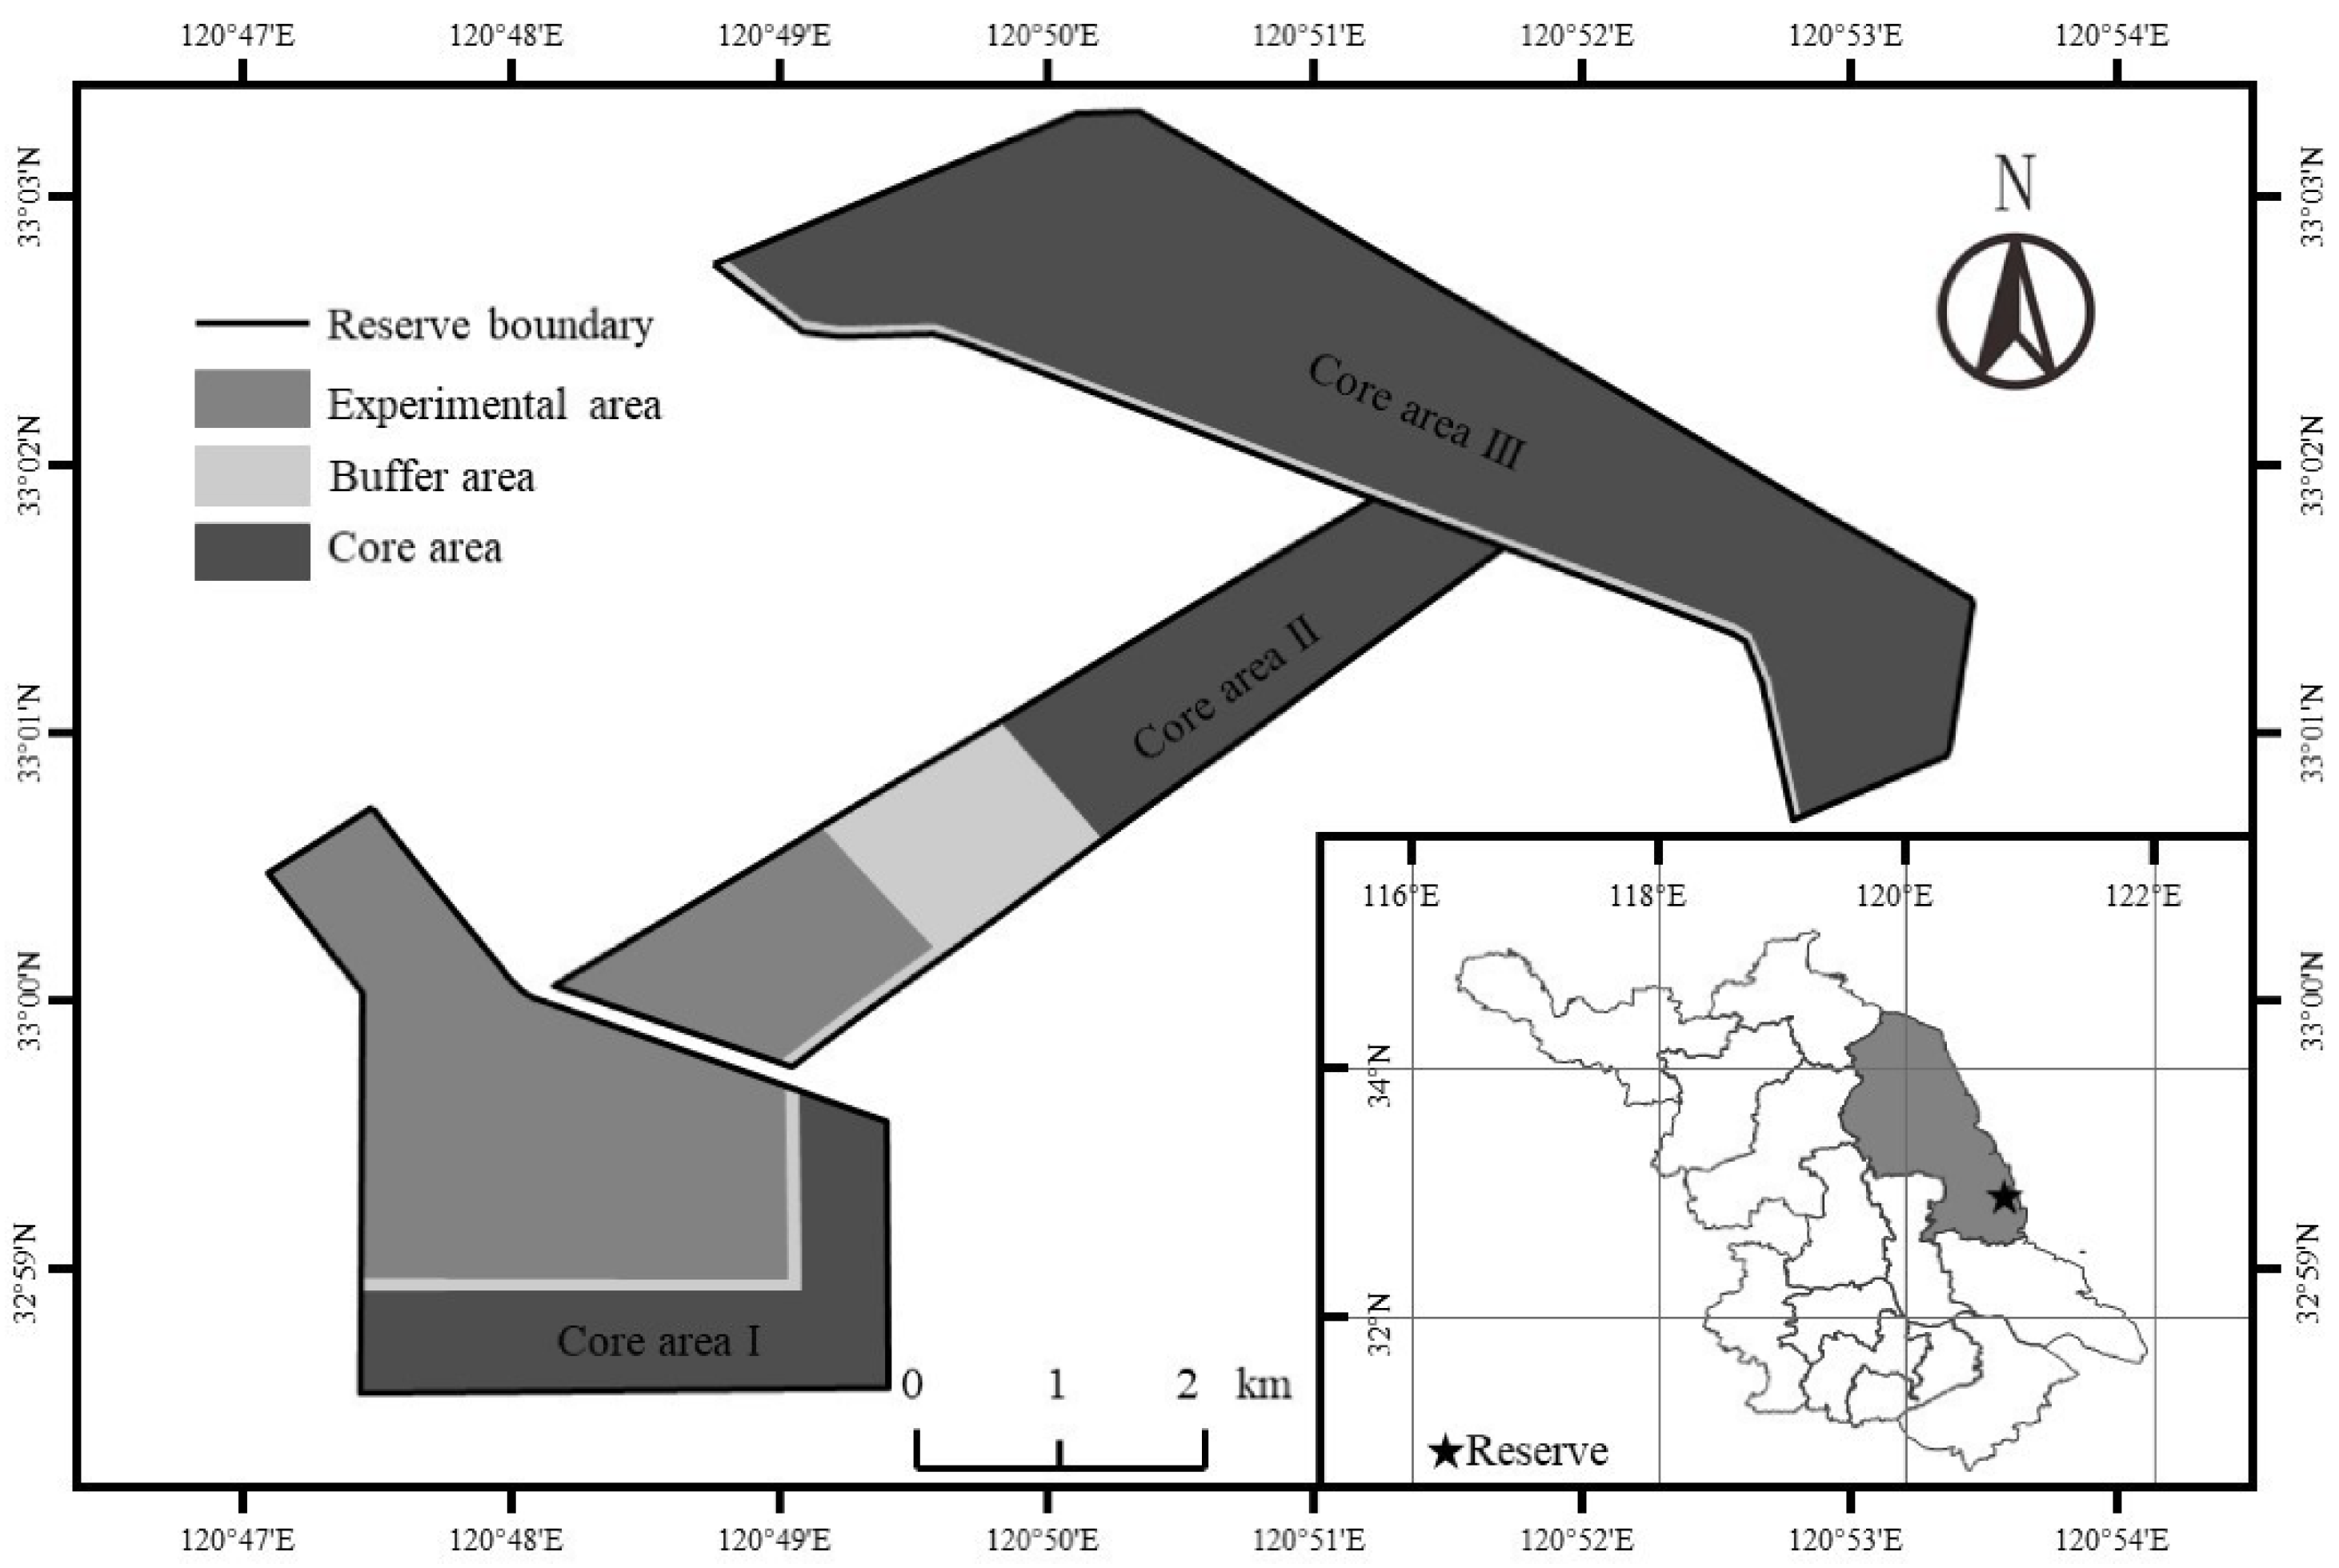
Figure 1. Location map of the study site.
Diversity 17 00594 g001
Figure 2. Soil property correlation thermogram. Note: The colors and sizes of different circles represent the magnitude of correlation. Where *** represents a significant difference between indexes at the p < 0.001 level, ** represents a significant difference between indexes at the p < 0.01 level, and * represents a significant difference between indexes at the p < 0.05 level. BD: bulk density, SWC: soil water content, pH: hydrogen ion concentration, Na+: sodium ion concentration, SOC: soil organic carbon, TC: total carbon, AN: available nitrogen TN: total nitrogen, AP: available phosphorus, TP: total phosphorus, AK: available potassium, TK: total potassium, MBC: microbial biomass carbon, MBN: microbial biomass nitrogen, Chao and Shannon: alpha diversity index of soil bacterial community.
Diversity 17 00594 g002
Figure 3. Fitting results of different data sets. Note: Autumn: October 2020, winter: January 2021, spring: March 2021, and summer: July 2021.
Diversity 17 00594 g003
Figure 4. The variability in different seasons. Note: Winter: January 2021; spring: March 2021; summer: July 2021.
Diversity 17 00594 g004
Figure 5. Composition of soil bacterial communities in different seasons. Note: Autumn: October 2020, winter: January 2021, spring: March 2021, and summer: July 2021.
Diversity 17 00594 g005
Figure 6. Bacterial community functions predicted by FAPROTAX. Note: Autumn: October 2020, winter: January 2021, spring: March 2021, and summer: July 2021.
Diversity 17 00594 g006
Figure 7. Soil bacterial community co-occurring network in the fed and control samples. Note: Autumn: October 2020, winter: January 2021, spring: March 2021, and summer: July 2021.
Diversity 17 00594 g007aDiversity 17 00594 g007b
Figure 8. RDA analysis of soil environmental indicators and bacterial community. Note: different coloured circles represent samples from the fed and control samples from different seasons, yellow arrows represent the top 5 bacterial phyla in terms of relative abundance in the bacterial community, and red arrows represent indicators of soil properties used for RDA analysis. BD: bulk density, SWC: soil water content, pH: hydrogen ion concentration, Na+: sodium ion concentration, SOC: soil organic carbon, TC: total carbon, AN: available nitrogen TN: total nitrogen, AP: available phosphorus, TP: total phosphorus, AK: available potassium, TK: total potassium, MBC: microbial biomass carbon, MBN: microbial biomass nitrogen, Chao and Shannon: alpha diversity index of soil bacterial community.
Diversity 17 00594 g008
Table 1. Basic information on sampling sites.
Sampling SitesHoofprint Density/
pcs/m2
Fecal Legacy/
Pellets/m2
Vegetation
Cover Rate/%
Dominant
Plant
Fed67~8999~1090--
Control3~10080~100Spartina
alterniflora
Note: Fed represents abandoned feeding sites and control represents control areas with no signs of Père David’s deer activity.
Table 2. Indicators of physical, chemical, and biological properties of soils (n = 15).
AutumnWinterSpringSummer
FedControlFedControlFedControlFedControl
BD/g∙cm−31.70 ± 0.10 a1.64 ± 0.15 a1.37 ± 0.12 a1.42 ± 0.27 a1.63 ± 0.15 a1.49 ± 0.20 b1.58 ± 0.09 A1.45 ± 0.10 B
SWC0.14 ± 0.03 a0.15 ± 0.05 a0.21 ± 0.13 a0.13 ± 0.04 b0.12 ± 0.03 a0.15 ± 0.05 a0.18 ± 0.06 a0.20 ± 0.01 a
pH9.29 ± 0.12 A8.82 ± 0.11 B9.08 ± 0.15 A8.82 ± 0.10 B9.21 ± 0.17 A8.83 ± 0.07 B9.00 ± 0.16 a8.89 ± 0.09 b
Na+/g∙kg−10.27 ± 0.14 a0.29 ± 0.03 a0.55 ± 0.13 a0.58 ± 0.05 a0.32 ± 0.03 a0.31 ± 0.15 a1.38 ± 0.27 a1.40 ± 0.10 a
SOC/g∙kg−12.21 ± 0.76 B7.16 ± 2.72 A3.23 ± 4.18 a5.28 ± 5.31 a3.55 ± 0.76 B5.68 ± 1.37 A4.51 ± 3.63 B10.01 ± 3.80 A
TC/g∙kg−114.06 ± 2.89 B50.63 ± 18.60 A17.20 ± 6.16 a20.05 ± 3.68 a12.99 ± 0.69 B18.85 ± 4.55 A12.56 ± 0.69 B14.62 ± 1.05 A
AN/mg∙kg−126.27 ± 16.61 B43.98 ± 8.74 A81.81 ± 35.71 a65.38 ± 16.59 a114.48 ± 67.38 a155.76 ± 84.50 a72.46 ± 24.37 b93.37 ± 24.03 a
TN/g∙kg−10.21 ± 0.03 B0.70 ± 0.26 A2.53 ± 0.68 a2.72 ± 0.39 a2.19 ± 0.11 B2.59 ± 0.36 A0.81 ± 0.13 B1.06 ± 0.18 A
AP/mg∙kg−15.79 ± 1.94 B16.38 ± 6.10 A13.18 ± 14.03 a13.00 ± 4.36 a5.23 ± 0.91 B10.88 ± 4.94 A6.08 ± 2.24 a8.96 ± 5.61 a
TP/g∙kg−11.33 ± 0.37 B1.85 ± 0.27 A0.17 ± 0.14 B0.46 ± 0.22 A2.17 ± 0.50 a2.15 ± 0.65 a1.42 ± 0.24 a1.52 ± 0.26 a
AK/mg∙kg−1284.28 ± 40.65 B448.23 ± 52.91 A391.87 ± 63.30 a455.93 ± 106.77 a213.16 ± 21.94 B305.65 ± 51.85 A362.90 ± 56.00 B502.90 ± 137.22 A
TK/g∙kg−17.36 ± 0.61 b7.81 ± 0.28 a14.55 ± 4.76 a16.23 ± 8.05 a2.94 ± 0.71 a3.10 ± 0.26 a4.70 ± 0.46 a5.04 ± 0.57 a
MBC/mg∙kg−126.07 ± 10.66 A10.16 ± 3.05 B39.17 ± 14.32 a40.99 ± 12.50 a37.75 ± 17.04 a36.27 ± 24.62 a40.83 ± 19.51 a41.47 ± 10.99 a
MBN/mg∙kg−19.20 ± 3.95 A1.23 ± 0.45 B162.32 ± 79.74 A65.64 ± 19.51 B6.94 ± 3.90 a5.06 ± 4.25 a17.12 ± 7.82 a16.71 ± 5.42 a
Note: The method for testing significant differences in data is as follows: For data meeting normality and homogeneity of variance assumptions (verified by Kolmogorov–Smirnov test (K-S test)), one-way ANOVA was applied, and Least Significant Difference (LSD) was used for post hoc test. Nonparametric tests (verified by the Mann–Whitney test (M-W test)) were used for non-normal data. All tests for differences in data were conducted at p = 0.05. Data in the table are expressed as mean ± standard deviation. Different uppercase letters denote highly significant differences (p < 0.01), different lowercase letters denote significant differences (p < 0.05), and the same lowercase letters indicate non-significant differences (p > 0.05). BD: bulk density, SWC: soil water content, pH: hydrogen ion concentration, Na+: sodium ion concentration, SOC: soil organic carbon, TC: total carbon, AN: available nitrogen, TN: total nitrogen, AP: available phosphorus, TP: total phosphorus, AK: available potassium, TK: total potassium, MBC: microbial biomass carbon, MBN: microbial biomass nitrogen.
Table 3. Soil quality minimum data set screening and indexes weighting.
GroupNormFactorsWeight
123456TDSMDS
AK11.530.7240.2810.062−0.2940.280.1180.020.04
TP11.51−0.5710.5450.2830.3150.027−0.1650.080.13
TK11.460.602−0.347−0.488−0.048−0.0820.230.08
BD11.39−0.5860.347−0.323−0.1180.0630.40.0040.01
pH11.38−0.598−0.448−0.128−0.16−0.1810.0180.0001
AP11.240.5340.195−0.2560.3350.261−0.1030.08
MBN21.490.503−0.682−0.2010.0240.113−0.0990.270.45
TC21.350.2810.596−0.4890.1760.162−0.210.040.06
Na+31.270.2390.0120.643−0.510.3090.1370.050.08
MBC31.130.111−0.4680.4840.0420.0830.4120.06
TN41.360.378−0.4170.0480.717−0.0520.0850.100.16
AN41.16−0.051−0.0430.5410.664−0.1140.0080.08
Chao51.460.5580.3440.104−0.127−0.6690.1740.020.03
Shannon51.430.4730.470.169−0.019−0.640.0980.0009
SOC51.250.3380.4670.2360.1710.5080.2170.10
SWC61.180.316−0.1370.331−0.26−0.05−0.750.030.04
Characteristic value 3.4962.6481.9351.71.4661.164
Variance contribution rate 21.8516.55112.09510.6269.1617.272
Cumulative variance contribution rate/% 21.8538.40150.49661.12270.28377.555
Note: BD: bulk density, SWC: soil water content, pH: hydrogen ion concentration, Na+: sodium ion concentration, SOC: soil organic carbon, TC: total carbon, AN: available nitrogen, TN: total nitrogen, AP: available phosphorus, TP: total phosphorus, AK: available potassium, TK: total potassium, MBC: microbial biomass carbon, MBN: microbial biomass nitrogen, Chao and Shannon: alpha diversity index of soil bacterial community.
Table 4. Soil quality index in various seasons (n = 15).
SeasonFedControl
Autumn0.23 ± 0.04 b0.32 ± 0.03 a
Winter0.64 ± 0.15 a0.65 ± 0.04 a
Spring0.29 ± 0.02 b0.35 ± 0.05 a
Summer0.23 ± 0.06 a0.27 ± 0.06 a
Note: Autumn: October 2020; winter: January 2021; spring: March 2021; summer: July 2021. The method for testing significant differences in data is as follows: For data meeting normality and homogeneity of variance assumptions (verified by K-S test), one-way ANOVA was applied and LSD was used for post hoc test. Nonparametric tests (verified by M-W test were used for non-normal data. All tests for differences in data were conducted at p = 0.05. Different lowercase letters indicate significant differences (p < 0.05); same lowercase letters indicate non-significant differences (p > 0.05).
Table 5. Diversity and stability of soil bacterial communities in different seasons (n = 15).
SeasonsSampleChaoShannonAVD
AutumnFed3888.07 ± 834.01a6.21 ± 0.37 b0.698
Control4465.60 ± 831.85a6.49 ± 0.24 a0.749
WinterFed3672.31 ± 745.04 A6.08 ± 0.43 A0.720
Control5074.16 ± 729.06 B6.64 ± 0.20 B0.724
SpringFed2656.05 ± 905.97 B6.04 ± 0.37 B0.702
Control4297.01 ± 716.76 A6.42 ± 0.30 A0.720
SummerFed3618.52 ± 523.55 B6.13 ± 0.30 B0.701
Control4713.66 ± 651.70 A6.63 ± 0.25 A0.761
Note: Group differences were statistically analyzed using the following procedures: For data satisfying the assumptions of normality and homogeneity of variance (confirmed by the K-S test), one-way ANOVA was performed, followed by post hoc testing using the Tukey–Kramer test. Nonparametric tests (verified by M-W test) were used for non-normal data. All tests for differences in data were conducted at p = 0.05. Data in the table are mean ± standard deviation; lowercase letters denote significant differences (p < 0.05), uppercase letters denote highly significant differences (p < 0.01), and same letter indicate no significant difference (p > 0.05).
Table 6. Major topological properties of soil bacterial community co-occurring network in the fed and control samples.
SamplesSeasonsAverage DegreeAverage Clustering CoefficientModularity IndexAverage Path
Length
NodesEdgesPositive
Edges/%
Negative
Edges/%
FedAutumn62.1330.5090.2381.912300932062.337.7
Winter180.2210.8130.1041.41429926,94354.3145.69
Spring58.0930.5160.2861.951300871464.4835.52
Summer53.340.4850.2381.986300800163.0936.91
ControlAutumn64.7270.5220.2681.854300970959.3940.61
Winter56.4330.5110.2851.931300846575.3324.67
Spring56.6130.4910.2981.907300849263.0536.95
Summer50.280.4710.2841.972300754267.7132.29
Table 7. VIF (variance inflation factor analysis) of soil property.
Soil Property Indicators
BDSWCpHNa+SOCTCANTNAPTPAKTKMBCMBN
VIF2.553.271.6174.0571.823.182.204.311.564.5372.062.061.975.09
Note: VIF: variance inflation factor, BD: bulk density, SWC: soil water content, pH: hydrogen ion concentration, Na+: sodium ion concentration, SOC: soil organic carbon, TC: total carbon, AN: available nitrogen TN: total nitrogen, AP: available phosphorus, TP: total phosphorus, AK: available potassium, TK: total potassium, MBC: microbial biomass carbon, MBN: microbial biomass nitrogen, Chao and Shannon: alpha diversity index of soil bacterial community.
Disclaimer/Publisher’s Note: The statements, opinions and data contained in all publications are solely those of the individual author(s) and contributor(s) and not of MDPI and/or the editor(s). MDPI and/or the editor(s) disclaim responsibility for any injury to people or property resulting from any ideas, methods, instructions or products referred to in the content.