Article

Unraveling Elevation-Driven Variations in Forest Structure and Composition in Western Nepal

1
College of Natural Resource Management (CNRM), Faculty of Forestry, Agriculture and Forestry University, Katari 56310, Nepal
2
College of Economics and Management, Northwest Agriculture and Forestry University, Xianyang 712100, China
3
Institute for Life Sciences and the Environment, University of Southern Queensland, Toowoomba, QLD 4350, Australia
*
Authors to whom correspondence should be addressed.
Diversity 2025, 17(8), 588; https://doi.org/10.3390/d17080588 (registering DOI)
Submission received: 20 June 2025 / Revised: 18 August 2025 / Accepted: 18 August 2025 / Published: 20 August 2025
(This article belongs to the Special Issue Canopy Ecology—Biodiversity, Functions, and Conservation)

Abstract

Understanding how elevation influences forest structure and species composition is crucial for effective conservation in mountainous regions like Nepal, where ecosystems change dramatically over short distances. This study assessed forest dynamics along an elevational gradient (600–3200 m) in Nepal’s mid-hills, incorporating elevational zonation (Tropical, Subtropical, Lower Temperate, and Upper Temperate) and aspect-driven variations. We established 27 square plots (20 × 20 m) at 100 m elevation intervals along a trekking route from Tallo Dungeshwor near the Karnali River to Mahabu Lek, recording all tree species with a diameter at breast height (DBH) ≥ 5 cm. Tree density across the elevational gradient ranged from 250 to 800 trees/ha. Basal area varied between 7.46 and 82.43 m2/ha, while mean tree height ranged from 6.89 to 16.62 m. Species diversity was assessed using the Shannon diversity index, and species dominance was evaluated through the Importance Value Index (IVI). Diversity peaked at mid-elevations, with Shorea robusta and Quercus semicarpifolia identified as dominant species. While minor variations occurred across topographic aspects, statistical analysis confirmed elevation as the dominant driver of forest structure and composition. Correlation analysis revealed a significant positive relationship between elevation and Simpson’s diversity index (r = 0.45, p < 0.05), indicating increased dominance diversity at higher elevations. These findings highlight the critical role of elevation and aspect in shaping forest ecosystems and offer valuable baseline data for climate-resilient management. We recommend conservation planning that is sensitive to topographic gradients, integrates long-term, climate-adaptive monitoring, and engages local communities to anticipate ecological shifts and address mounting anthropogenic pressures in vulnerable montane zones.

1. Introduction

A comprehensive understanding of plant species diversity, composition, and structure is a cornerstone of sustainable forest management in diverse ecosystems [1,2]. In the Himalayan region, regional variations in species composition are primarily driven by elevation and climatic conditions [3,4]. The structure of Himalayan forests significantly influences ecosystem services and is believed to be shifting over time [5,6]. Forest structure and diversity also shape canopy communities [7]. Nepal, with its exceptional elevational range from 60 to 8848 m within a span of just 200–250 km and rich ecosystem diversity, presents a unique natural laboratory for studying forest structure, species diversity, and soil dynamics [8]. Nepal’s unique physiographic and climatic diversity, compressed within a narrow latitudinal span, offers a microcosm of global biodiversity patterns [9].
Forests cover approximately 5.96 million hectares, accounting for 40.36% of Nepal’s total area, with Other Wooded Land (OWL) covering an additional 0.65 million hectares (4.38%). Together, forest and OWL constitute 44.74% of the national land area. Of the total forest area, 82.68% lies outside protected areas and 17.32% within protected zones [10,11]. Biodiversity along elevational gradients often peaks at intermediate elevations for many taxa, while other groups display unique patterns [12,13]. These patterns are shaped by a combination of topography, climate, soil conditions, habitat heterogeneity, evolutionary history, and anthropogenic impacts [14,15]. Environmental variables such as temperature, precipitation, and light, along with disturbances like overgrazing, forest fires, and logging, influence forest community composition and structure [16,17]. Studies on trees outside forests in Nepal’s mid-hills further emphasize the importance of understanding diversity and carbon dynamics in non-traditional forest areas [18,19]. Forest trees remain the dominant structural and functional components of these ecosystems [20,21]. Importantly, anthropogenic activities, especially in lower-elevation zones, also significantly shape tree diversity, either by altering habitat conditions or through selective species removal, and must be considered alongside natural environmental gradients [19,22].
Identifying plant communities provides crucial insights into vegetation structure, habitat, niche, and interspecies interactions [23]. Understanding vegetation and species diversity patterns is essential for effective conservation and has long been a focus of ecological research [24]. In the western Himalaya, changes in forest composition are especially evident in lower and upper elevation zones, underscoring the need for accurate measurements [25,26]. Elevation gradients at low latitudes are particularly effective for studying species density trends due to their broad climatic variation [27]. Structural and functional analysis of plant communities enhances our understanding of how vegetation morphology relates to environmental conditions [28]. Elevational biodiversity patterns have been a central debate among biogeographers and conservationists [29], and yet the structure and distribution of Himalayan forest communities have historically received limited attention [30]. The region’s ecological complexity results in highly heterogeneous vegetation and species distribution patterns [31], influenced by topography, soil, climate, and geographic location [32]. In the Western Himalaya, plant species richness is largely determined by climatic, physiographic, and human factors [33]. A distinct biodiversity peak has been observed in the subalpine zone (2800–3600 m), particularly between 3000 and 3200 m [34]. While species richness typically declines with elevation [35], hump-shaped and plateau patterns have been observed in Nepal’s Himalaya [36]. The climate hypothesis links species richness to temperature and water availability [37]. Rising temperatures may drive upward migration of vegetation [38], while forest compositional changes provide direct indicators of ecological threats along elevational gradients [39]. Carbon and biodiversity interactions along these gradients are particularly relevant under Reducing Emissions from Deforestation and Forest Degradation (REDD+) mechanisms [40,41,42]. Habitat fragmentation, overexploitation, invasive species, and climate change disrupt forest community structures and serve as predictors of future ecological shifts [43].
Tree species diversity, size class distribution, stem density, and basal area are critical indicators of forest ecosystem structure and health [16]. These parameters inform conservation strategies and serve as essential tools in forest protection and restoration [44]. Size class distribution, in particular, reflects forest dynamics and regeneration potential [45,46,47]. Distribution patterns of vegetation along elevation gradients are governed by temperature, humidity, and solar radiation [48], while climate change is causing upward shifts in species distributions and altering ecological interactions [49]. Microclimatic variations due to slope, aspect, and exposure further modulate these patterns. Recent studies have also linked topography and species diversity with carbon density in community-managed forests [50,51,52].
Baseline data on plant diversity in specific forests is vital for biodiversity conservation and management [53]. Although several studies have focused on lowland forests, high-altitude forests remain under-researched [54]. Species diversity serves as a fundamental index in ecological communities [55]. Findings from Nepal’s leasehold forestry system show potential synergies between carbon and biodiversity restoration, which should inform management strategies [56,57]. Therefore, this study aims to comprehensively assess and provide baseline information on the composition, structure, and dynamics of tree species along an altitudinal gradient in the western mid-hill region of Nepal. It offers three major contributions: (1) provision of rare baseline data across an elevational gradient in an under-studied region, (2) integration of topographic, climatic, and anthropogenic drivers to explain biodiversity patterns, and (3) support for elevation-based forest management strategies critical for climate adaptation and ecosystem conservation, including potential synergies between carbon management (REDD+) and biodiversity protection.
This study uniquely integrates fine-scale elevational zonation with aspect-driven microclimatic variation to assess forest dynamics in a climatically and topographically complex Himalayan region. By using systematically spaced plots along a continuous altitudinal transect, it captures nuanced structural and compositional shifts often overlooked in fragmented studies. The incorporation of both ecological indicators (e.g., basal area, diversity indices, IVI) and anthropogenic context provides a holistic understanding of forest resilience. This approach enables more precise, elevation-sensitive conservation planning and contributes novel empirical evidence from an underrepresented altitudinal band in the western mid-hills of Nepal.

2. Materials and Methods

2.1. Study Area

This study was conducted in the Dailekh district of Karnali Province, Nepal (Figure 1). Dailekh is a high-altitude hilly district located between 28°35′00″ N and 29°08′00″ N latitudes and 81°25′00″ E and 81°53′00″ E longitudes. The district exhibits a remarkable elevational gradient, ranging from 544 m at Tallo Dungeswor near the Karnali River to 4168 m at Mahabu Lek on the border with Kalikot District. This steep elevational variation within a short horizontal distance makes Dailekh an ideal natural laboratory for studying elevation-driven ecological dynamics, aligning with this study’s objective to unravel how forest structure and composition vary across altitudinal zones. The country’s forests, covering 40.36% of its land area, transition from tropical to alpine ecosystems within 200–250 km, providing a rare opportunity to study ecological gradients at a manageable scale. The mid-hill region, where Dailekh is situated, is particularly significant as it represents a biodiversity hotspot and a critical zone for ecosystem services, including carbon sequestration, water regulation, and livelihood support for local communities. The study area’s forests are characterized by distinct vegetation types: subtropical deciduous broad-leaved hardwood forests at lower elevations, temperate mixed deciduous and coniferous forests at mid-elevations, and high-altitude coniferous forests and shrubs at upper elevations. Dominant species such as Shorea robusta and Dalbergia sissoo at lower elevations and Quercus semicarpifolia and Rhododendron spp. at higher elevations reflect the strong influence of elevation on species distribution. During field observation, human and livestock-related disturbances such as grazing and selective logging were more pronounced at lower elevations (<1000 m), where accessibility is higher. In contrast, upper elevation plots experienced relatively minimal human interference. Although not quantitatively assessed, this variation in anthropogenic pressure is noted as a relevant contextual factor.
The selection of Dailekh was further justified by its representation of Nepal’s community forestry model, where local stewardship plays a pivotal role in forest management. That aligns with this study’s broader aim to inform conservation strategies under REDD+ and nature-based solutions (NbSs). Additionally, the area’s limited anthropogenic disturbance at higher elevations and varying degrees of human impact at lower elevations provide a gradient to assess both natural and anthropogenic influences on forest dynamics. This study’s focus on the region thus addresses a critical gap in understanding mid-hill forests, which are under-researched compared to Nepal’s lowland Terai and high-altitude protected areas. By leveraging that elevational gradient, this study contributes to global ecological theories on biodiversity patterns while offering locally relevant insights for adaptive forest management in a changing climate (Table A3).

2.2. Sampling Design

A systematic sampling design was employed to select sampling plots along the elevation gradient. At elevations of 600 m and 3200 m, sampling plots were surveyed using squares at each altitude increase of 100 m. Square-shaped sampling plots (20 × 20 m) were established at every 100 m elevation interval between 600 m and 3200 m. One plot was laid per elevation band, and all trees with a diameter at breast height (DBH) ≥ 5 cm were recorded in each plot. The sampling square plots were identified using a Geographic Positioning System (elevation, latitude, and longitude; as suggested by [58,59]). In total, 27 sampling plots for trees (≥5 cm diameter at breast height, i.e., DBH) were established. The elevation gradient was based on the trekking trail from Tallo Dungeswor near the Karnali River to the Mahabu Lek section. To minimize human impact on the forest, plots were established at least 100 m from the trekking trails. All tree species, along with their respective DBH and height, were present in each sampling plot. Height was assessed using the Sunto Clinometer, as detailed by [60].

2.3. Data Analysis

2.3.1. Structure of Forest Stands

Three structural features, diameter size class distribution, basal area, and mean height, have been used to describe the structure of forests along the elevational gradient. In each sampling plot, trees have been classified into three diameter categories (<10, 10–29.9, and ≥30 cm). The total basal area for every elevation and the mean height for each sampling plot have been established.

2.3.2. Species Composition

In this study, species diversity was quantified using Shannon’s diversity index (H′) and Simpson’s diversity index (D), which account for both species richness and relative abundance (heterogeneity), while Pielou’s evenness index (J′) was used to assess the evenness of species distribution within plots. These indices were calculated individually for each of the 27 sample plots to represent plot-level diversity and evenness, rather than species richness alone. In contrast, structural and compositional attributes such as Density (Dn), Relative Density (RDn), Frequency (F), Relative Frequency (RF), Dominance (Do), Relative Dominance (RDo), and the Importance Value Index (IVI) were calculated separately for each sample plot based on the species’ relative frequency, relative density, and relative dominance within that plot to evaluate species importance and structural dominance across the entire elevational gradient.
Species-wise, frequency, density, and dominance values were computed using the methods of [61]. The Importance Value Index (IVI) of a species is calculated by summing its Relative Density (RDn), Relative Frequency (RF), and Relative Dominance (RDo) or Relative Basal Area (RBA).
Density   ( Dn ) = T o t a l   n o .   o f   i n d i v i d u a l s   o f   a   s p e c i e s   f o u n d T o t a l   a r e a   e x a m i n e d × 10,000
Relative density of species A (RDn) = N o .   o f   i n d i v i d u a l s   o f   s p e c i e s   A T o t a l   n o .   o f   i n d i v i d u a l s   o f   a l l   s p e c i e s × 100
where D = density (trees per hectare); area sampled is in square meters; 10,000 converts to per hectare; and RD = relative density (%).
Relative Frequency (RF)
Frequency   ( %   of   plots ) = ( F ) = N o .   o f   q u a d r a t s   i n   w h i c h   s p e c i e s   o c c u r s   T o t a l   n o .     o f   q u a d r a t s   e x a m i n e d   × 100
Relative   Frequency   of   species   A   ( RF ) = F r e q u e n c y   o f   s p e c i e s   A S u m   o f   f r e q u e n c y   v a l u e s   o f   a l l   s p e c i e s × 100
Relative Basal Area (RBA) or Relative Dominance (RDo)
Dominance = ( Do ) = π ( d b h ) ^ 2 4
Relative   dominance = ( RDo ) = B a s a l   a r e a   o f   a   s p e c i e s T o t a l   b a s a l   a r e a   o f   a l l   s p e c i e s × 100
Abundance and Relative Abundance
Abundance = T o t a l   n u m b e r   o f   i n d i v i d u a l s   o f   t h e   s p e c i e s T o t a l   n u m b e r   o f   p l o t s   i n   w h i c h   t h e   s p e c i e s   o c c u r
Relative   abundance = A b u n d a n c e   o f   s p e c i e s   A   T o t a l   a b u n d a n c e   × 100
Important Value Index (IVI)
The Importance Value Index showed each species’ dominance and ecological success within a community. It was expressed as follows:
IVI = Relative Density (RDn) + Relative Frequency (RF) + Relative Basal Area (RBA) or Relative Dominance

2.3.3. Diversity of Tree Species

Simpson’s diversity index (Equation (10)) represents one of the most significant and reliable diversity measures available. The index was determined based on the ratio of species i to the total number of species (pi) [62].
D = 1 i = 1 s n i . ( n i 1 )     N . ( N 1 )  
where ni is the number of individuals in the species i, s is the number of species, and N refers total individuals (species).
Similarly, Shannon’s index is calculated from the equation:
H = i s   p i   . l o g p i ,     i . e . ,   ( Pi = ni / N )
where pi is the proportional abundance of species i, and s is the number of species.
As a heterogeneity measure, the Shannon index takes the degree of evenness in species and abundance into account. Evenness E was calculated as the proportion of observed and maximal diversity [63]:
E = H   H m a x
where E = evenness (range 0–1), H is Shannon’s index, and Hmax = (ln s) = maximum possible diversity (s is the number of species).

2.3.4. Statistical Analysis

Data analysis was performed using Microsoft Excel 2013 (Microsoft Corporation, Redmond, WA, USA, 2013), R statistical software (v4.3.2), and PAST statistical software (PAST v4.13; available at: https://www.nhm.uio.no/english/research/resources/past/ accessed on 17 August 2025. Microsoft Excel was also used to prepare graphs and tables and for data interpretation. Additionally, Pearson’s product–moment correlation was initially conducted to assess the linear relationship between elevation and diversity indices (Shannon, Simpson, and evenness). To complement this, we also performed Spearman’s rank correlation, a non-parametric alternative that evaluates monotonic relationships without assuming normality or linearity. To evaluate aspect effects on diversity indices (IVI, Shannon H’, and evenness), we performed Kruskal–Wallis non-parametric ANOVA followed by Dunn’s post hoc tests with Bonferroni adjustment. Aspect categories (N, E, S, SE, SW) served as grouping variables for these analyses.

3. Results

3.1. Structure of Forest Stands

3.1.1. Species Composition

A total of 504 individuals were recorded across 27 sample plots positioned at 100 m intervals along an elevational gradient from 600 m to 3200 m (mean elevation: 1900 ± 750 m). A total of 35 tree species belonging to 21 families and 29 genera were recorded. Fabaceae was the largest family with four genera. Similarly, Ericaceae, Lamiaceae, Pinaceae, Fagaceae, and Rosaceae were each represented by two genera. The remaining families were monotypic, represented by a single genus. Shorea robusta was the dominant tree species in the study area, with a density of 127 trees/ha, indicating the highest density among recorded species. Additionally, species Alnus nepalensis, with a density of 40 trees ha−1, was the second most frequent species.
The maximum relative density was recorded for Shorea robusta (27.18%) and minimum for Ficus nerifolia, Prunus cerasoides, Bauhinia variegate, and Premna longifolia, which was 0.20%. Meanwhile, the relative frequency was at its maximum for Alnus nepalensis (9.59%) and minimum (0.68%) for Quercus acutissima, Daphniphylum himalainsis, Premna longifolia, Garuga pinnata, Bauhinia variegata, Pogosteman benghalensis, Prunus cerasoides, Albizzia lebbeck, and Ficus neriifolia. And the maximum relative basal area was 26.80% for Quercus semicarpifolia, while the minimum was 0.02% for Bauhinia variegata. The relative abundance for Shorea robusta was the maximum, which was 13.81%, and the minimum was 0.91% for Tsuga dumosa, Premna longifolia, Bauhinia variegata, Prunus cerasoides, Ficus semicordata, and Ficus nerifolia (Table A1).

3.1.2. Basal Area/Density

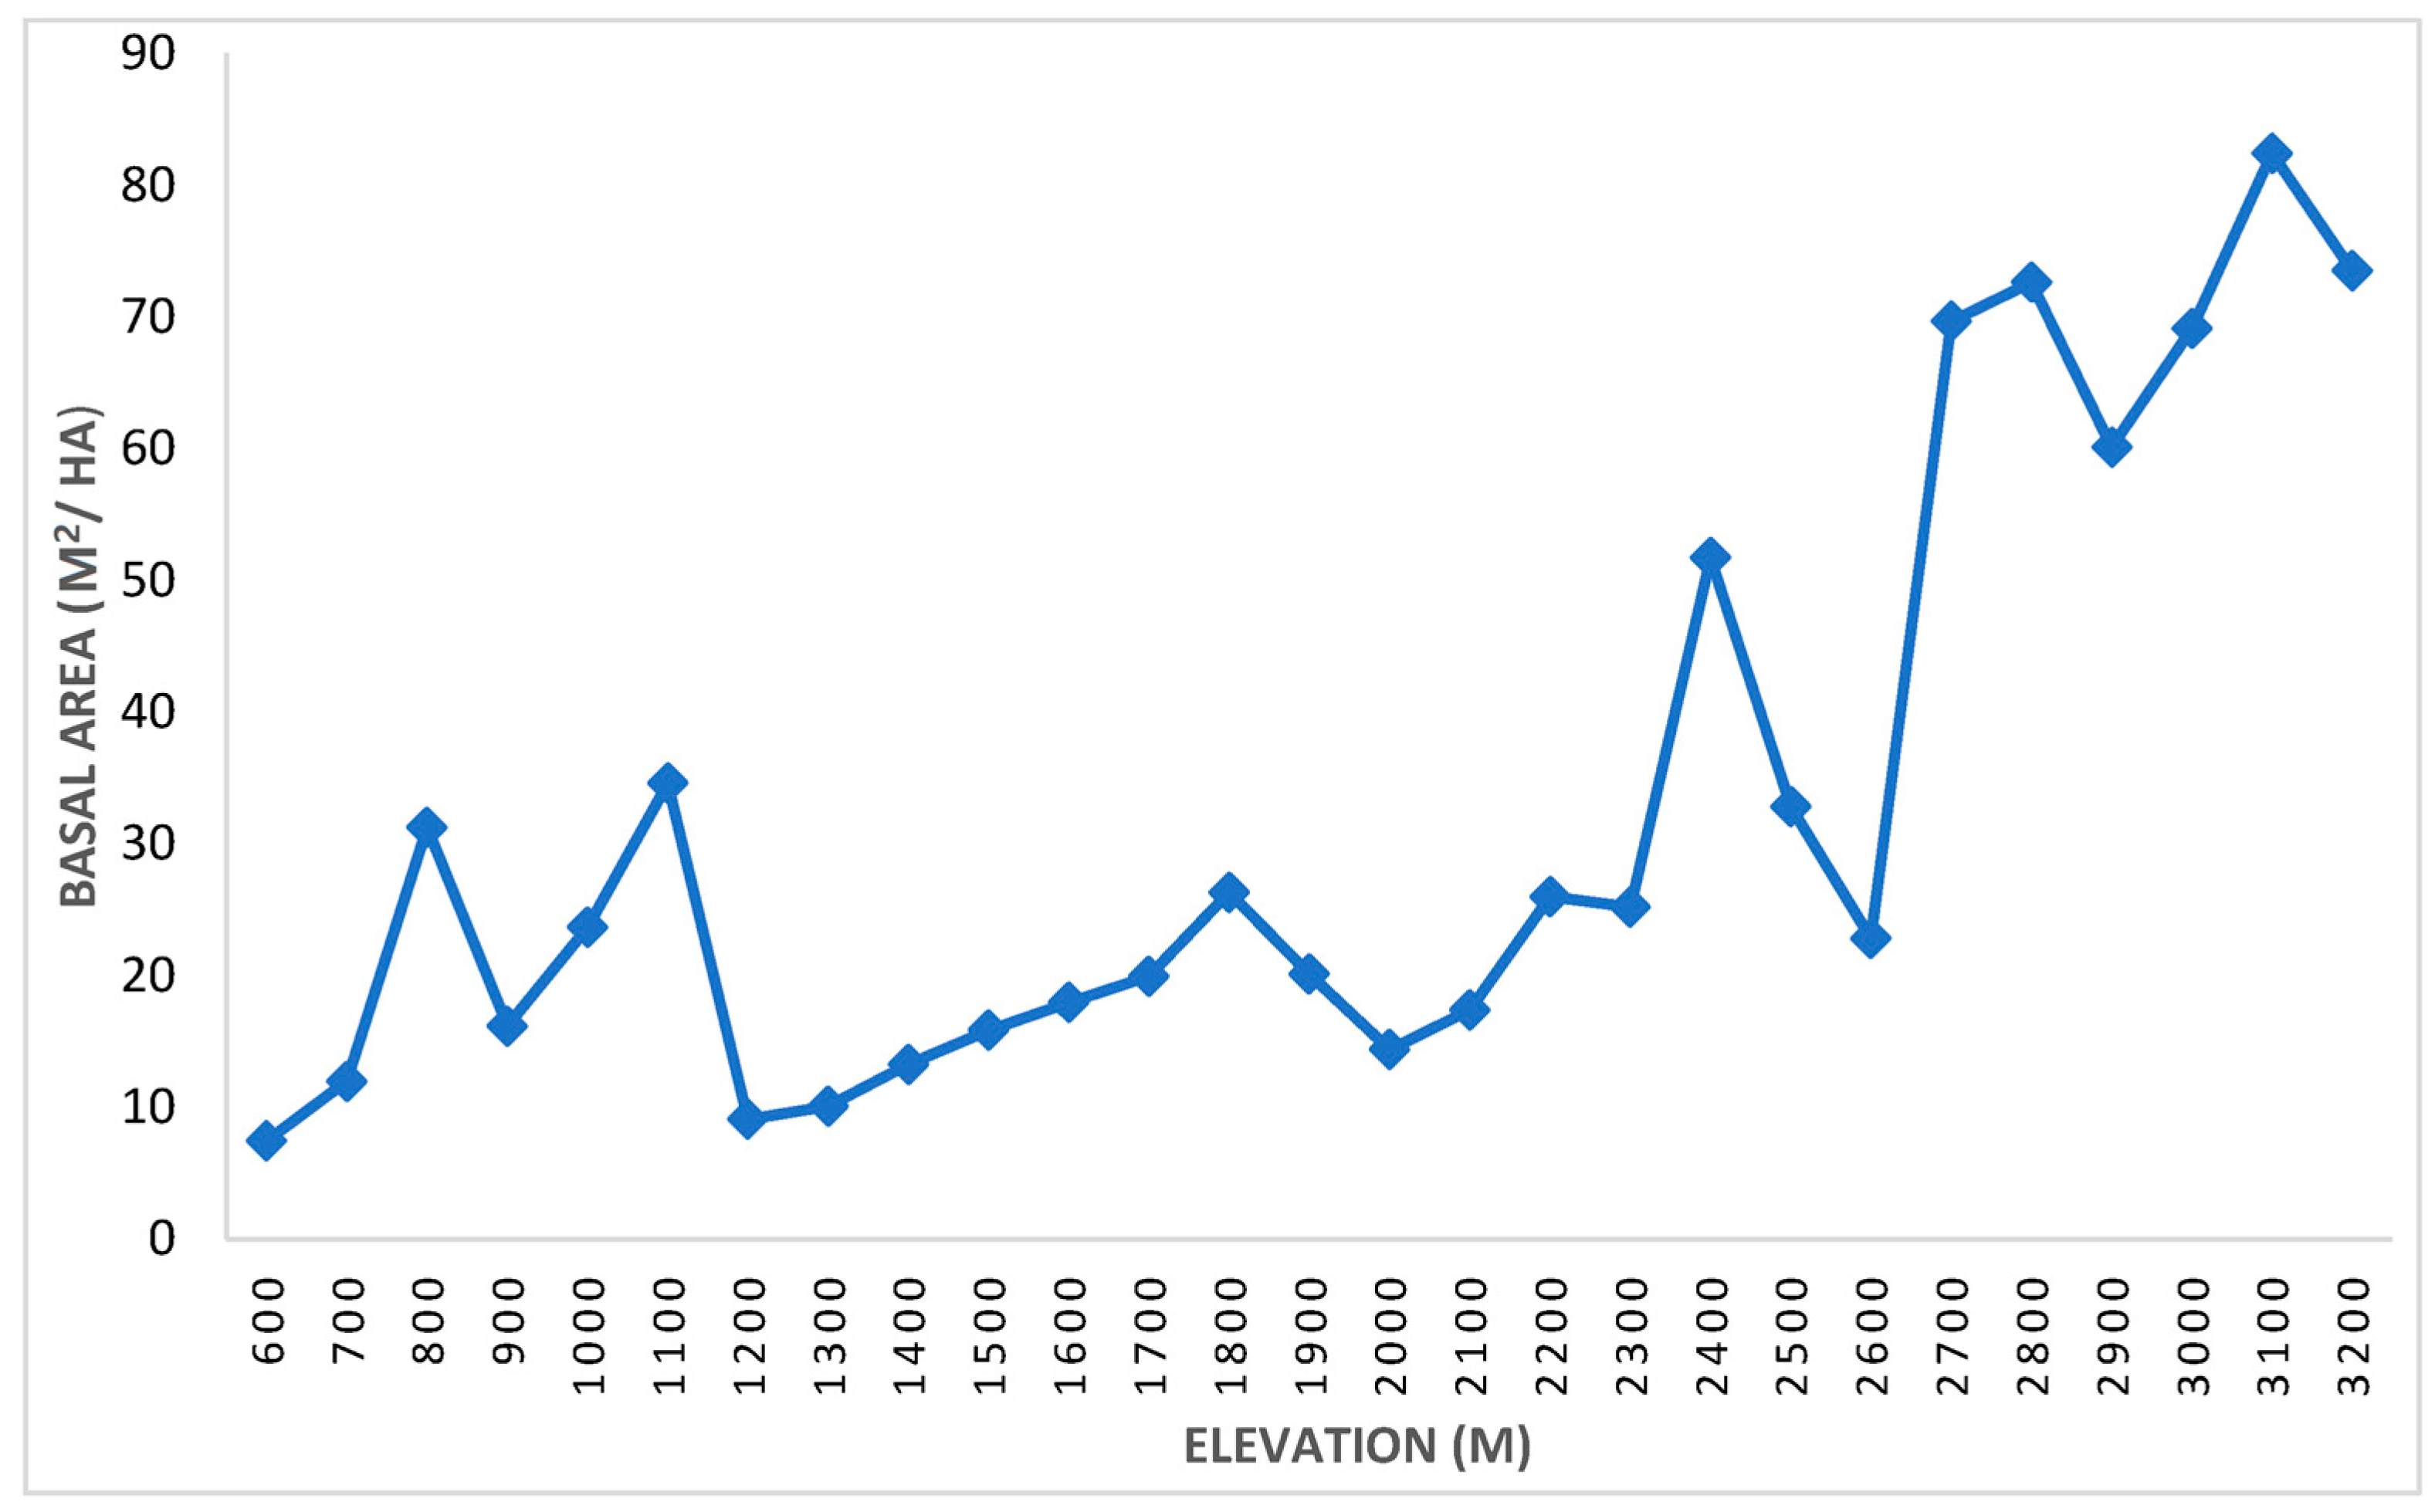
The average basal area per plot was 32.43 m2/ha. The maximum basal area of 82.43 m2/ha was recorded at a 3100 m elevation and the minimum 7.46 m2/ha was at a 600 m elevation. From this, we can conclude that the size of trees found at a higher elevation is comparatively greater than that of a lower elevation. Additionally, a higher density, i.e., 29.63 m2/ha, was found at a 1300 m elevation, while the lowest density of 9.26 m2/ha was at 2600 m (Figure 2). The basal area peaked at 3100 m (82.43 m2/ha); however, a secondary peak was found to be notable at an elevation of 2400 m, which was 61.2 m2/ha (Table 1). This elevation corresponds to the upper temperate zone (2500–3000 m), dominated by Quercus semicarpifolia and Pinus wallichiana. Similarly, southwestern aspects at 2400 m exhibited a higher IVI (16.63). This might be due to favorable solar exposure and soil moisture retention, promoting dense, large-diameter trees.
Tree density across the elevational gradient ranged from 250 to 800 trees/ha. Basal area varied between 7.46 and 82.43 m2/ha, while mean tree height ranged from 6.89 to 16.62 m.

3.1.3. Distribution of Diameter Class

The maximum number of trees with a diameter class of <10 cm was 15 tree individuals at an elevation 1300 m, the maximum number of trees with a diameter class of 10–<30 cm was 19 individuals at an elevation of 700 m, and the maximum number of trees with a diameter class of ≥30 cm was 14 individuals at a 2700 m elevation. There was no presence of individuals in the diameter class of <10 cm at an elevation of 600 m and from 2600 m to 3200 m, there were no individuals in the diameter class of 10–<30 cm at elevations between 2900 m and 3200 m, and there were no individuals in the diameter class of ≥30 cm at elevations of 600 m, 1200 m, 1300 m, and 1400 m. The absence of small trees at 2600–3200 m suggests limited regeneration in high-elevation zones (Table 2).
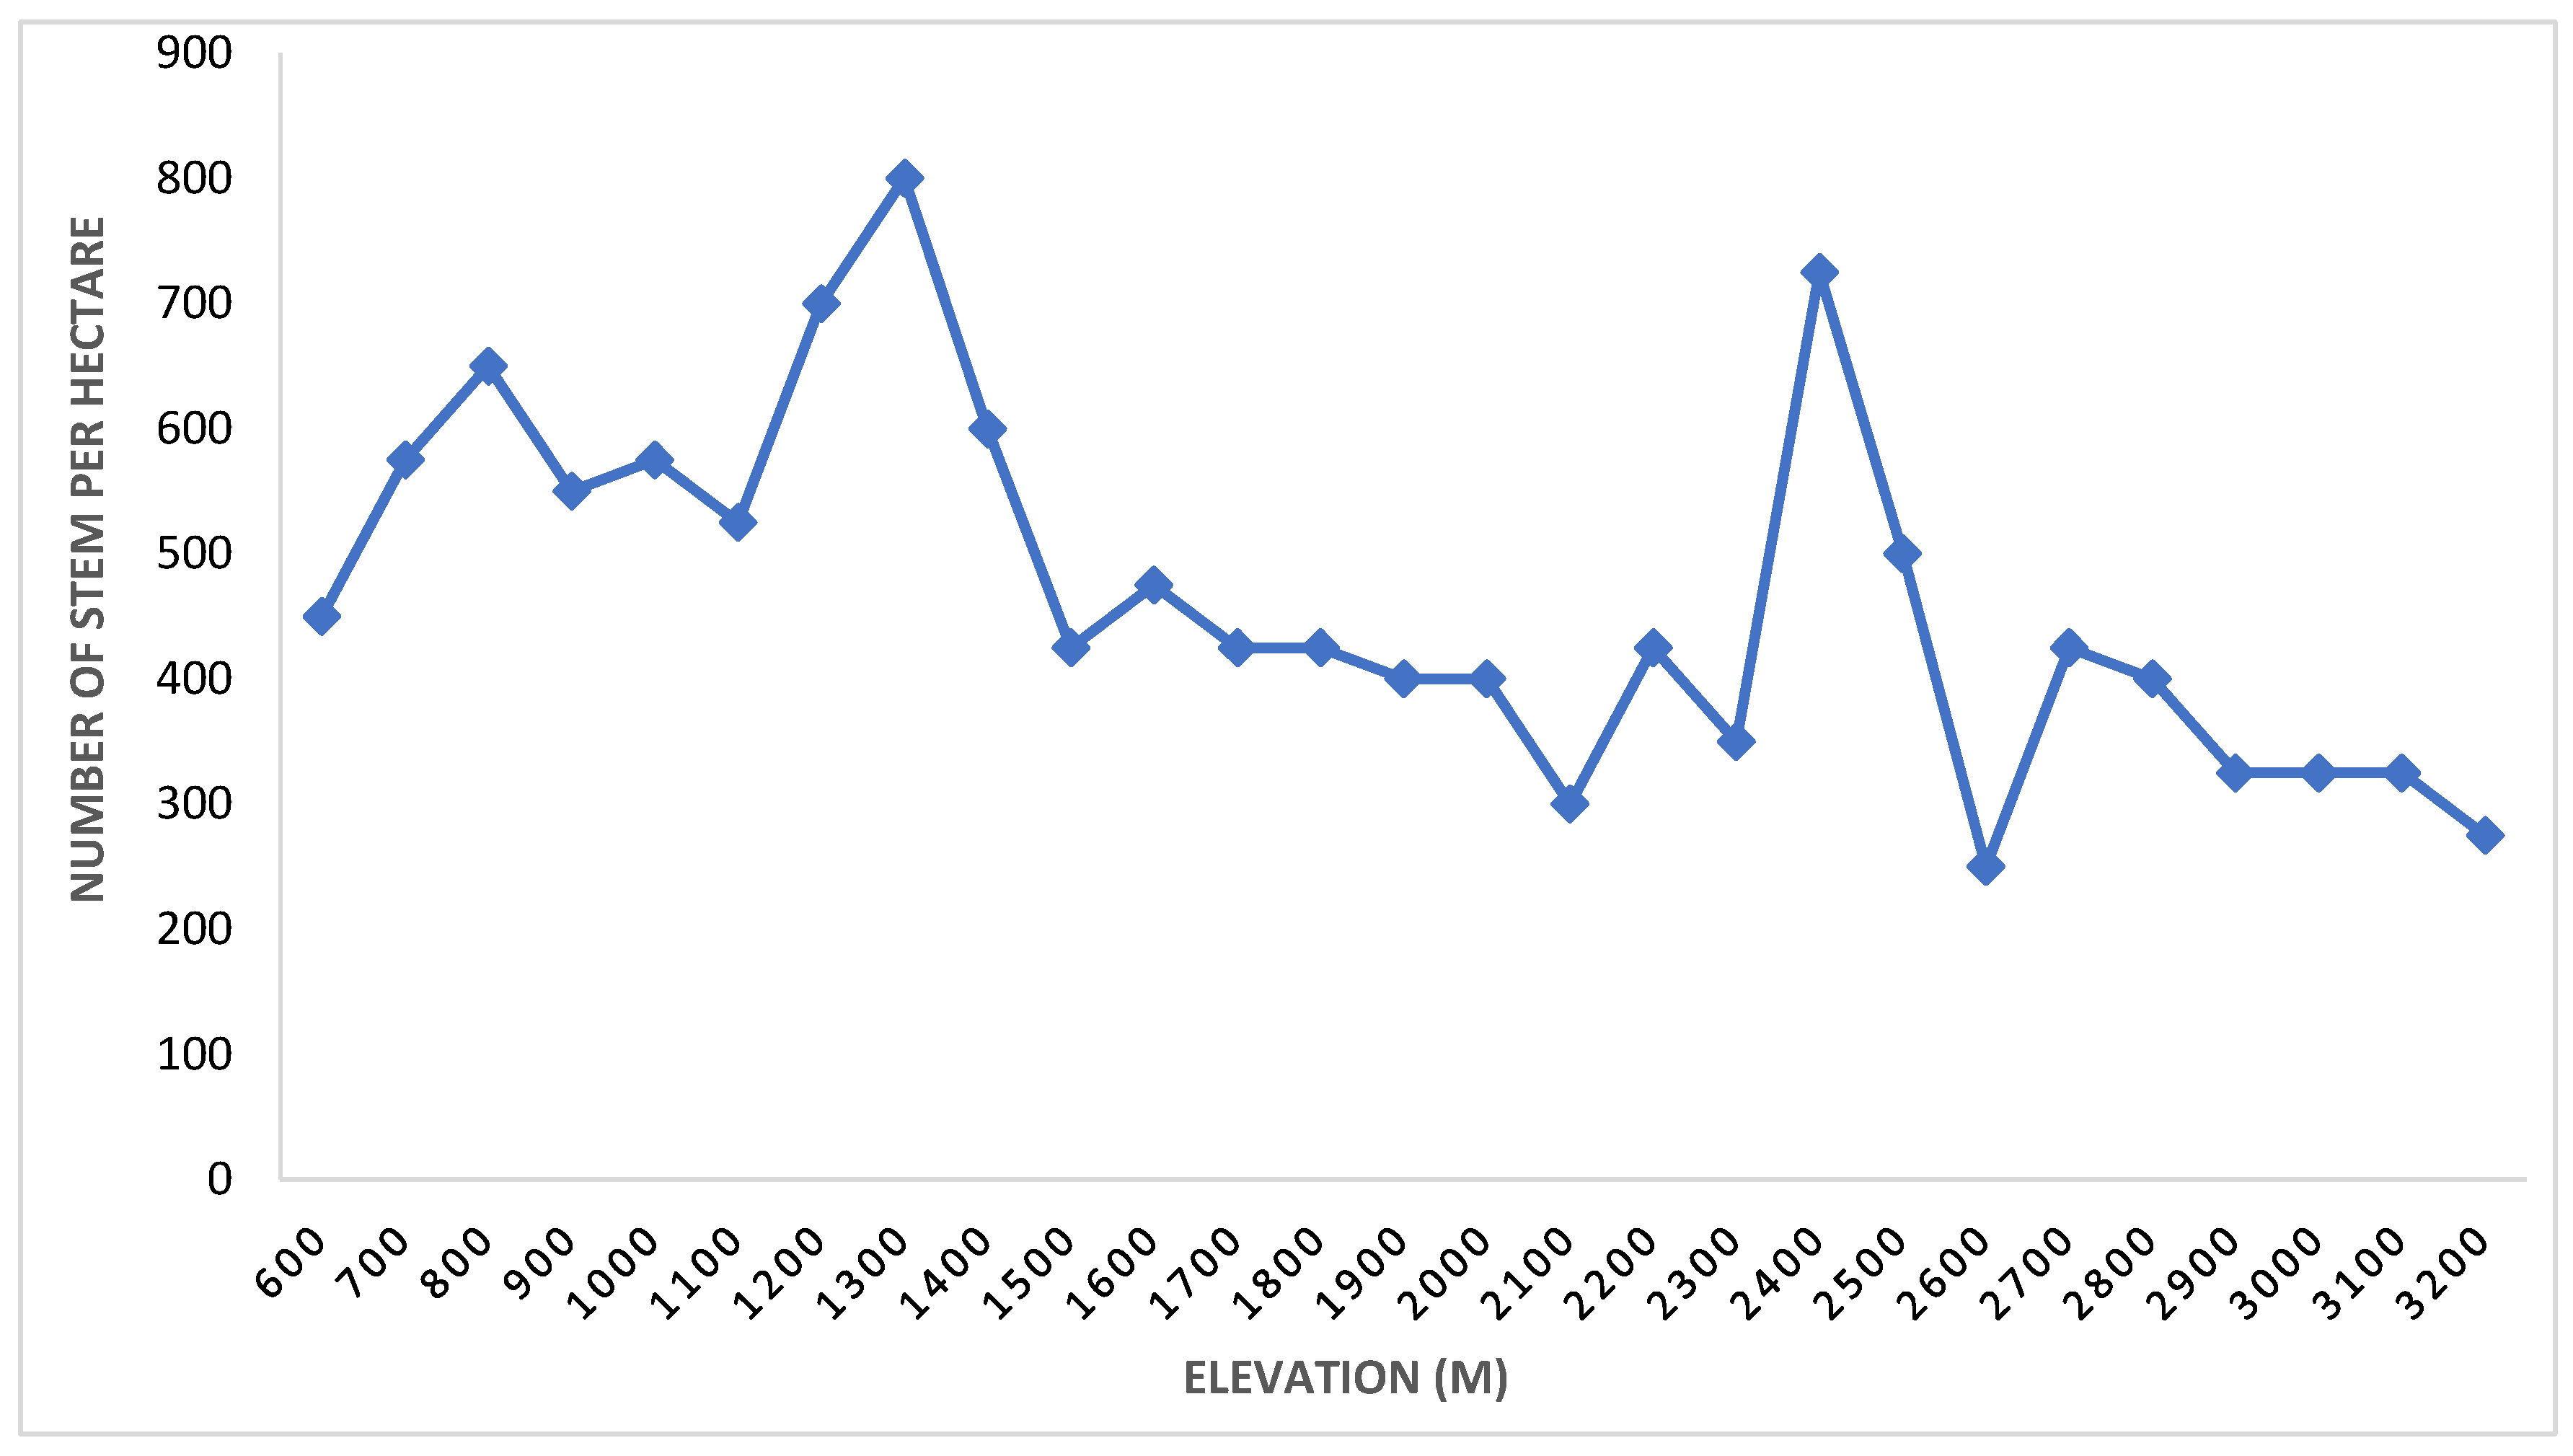
Within the sampling plots, the total number of stems (≥5 cm DBH) inventoried per plot fluctuated from 250 trees/ha at 2600 masl to 800 trees/ha at 1300 masl. The number of stems was highly fluctuating among the plots with elevation. The fluctuation in different elevations is shown below (Figure 3).

3.1.4. Mean Height

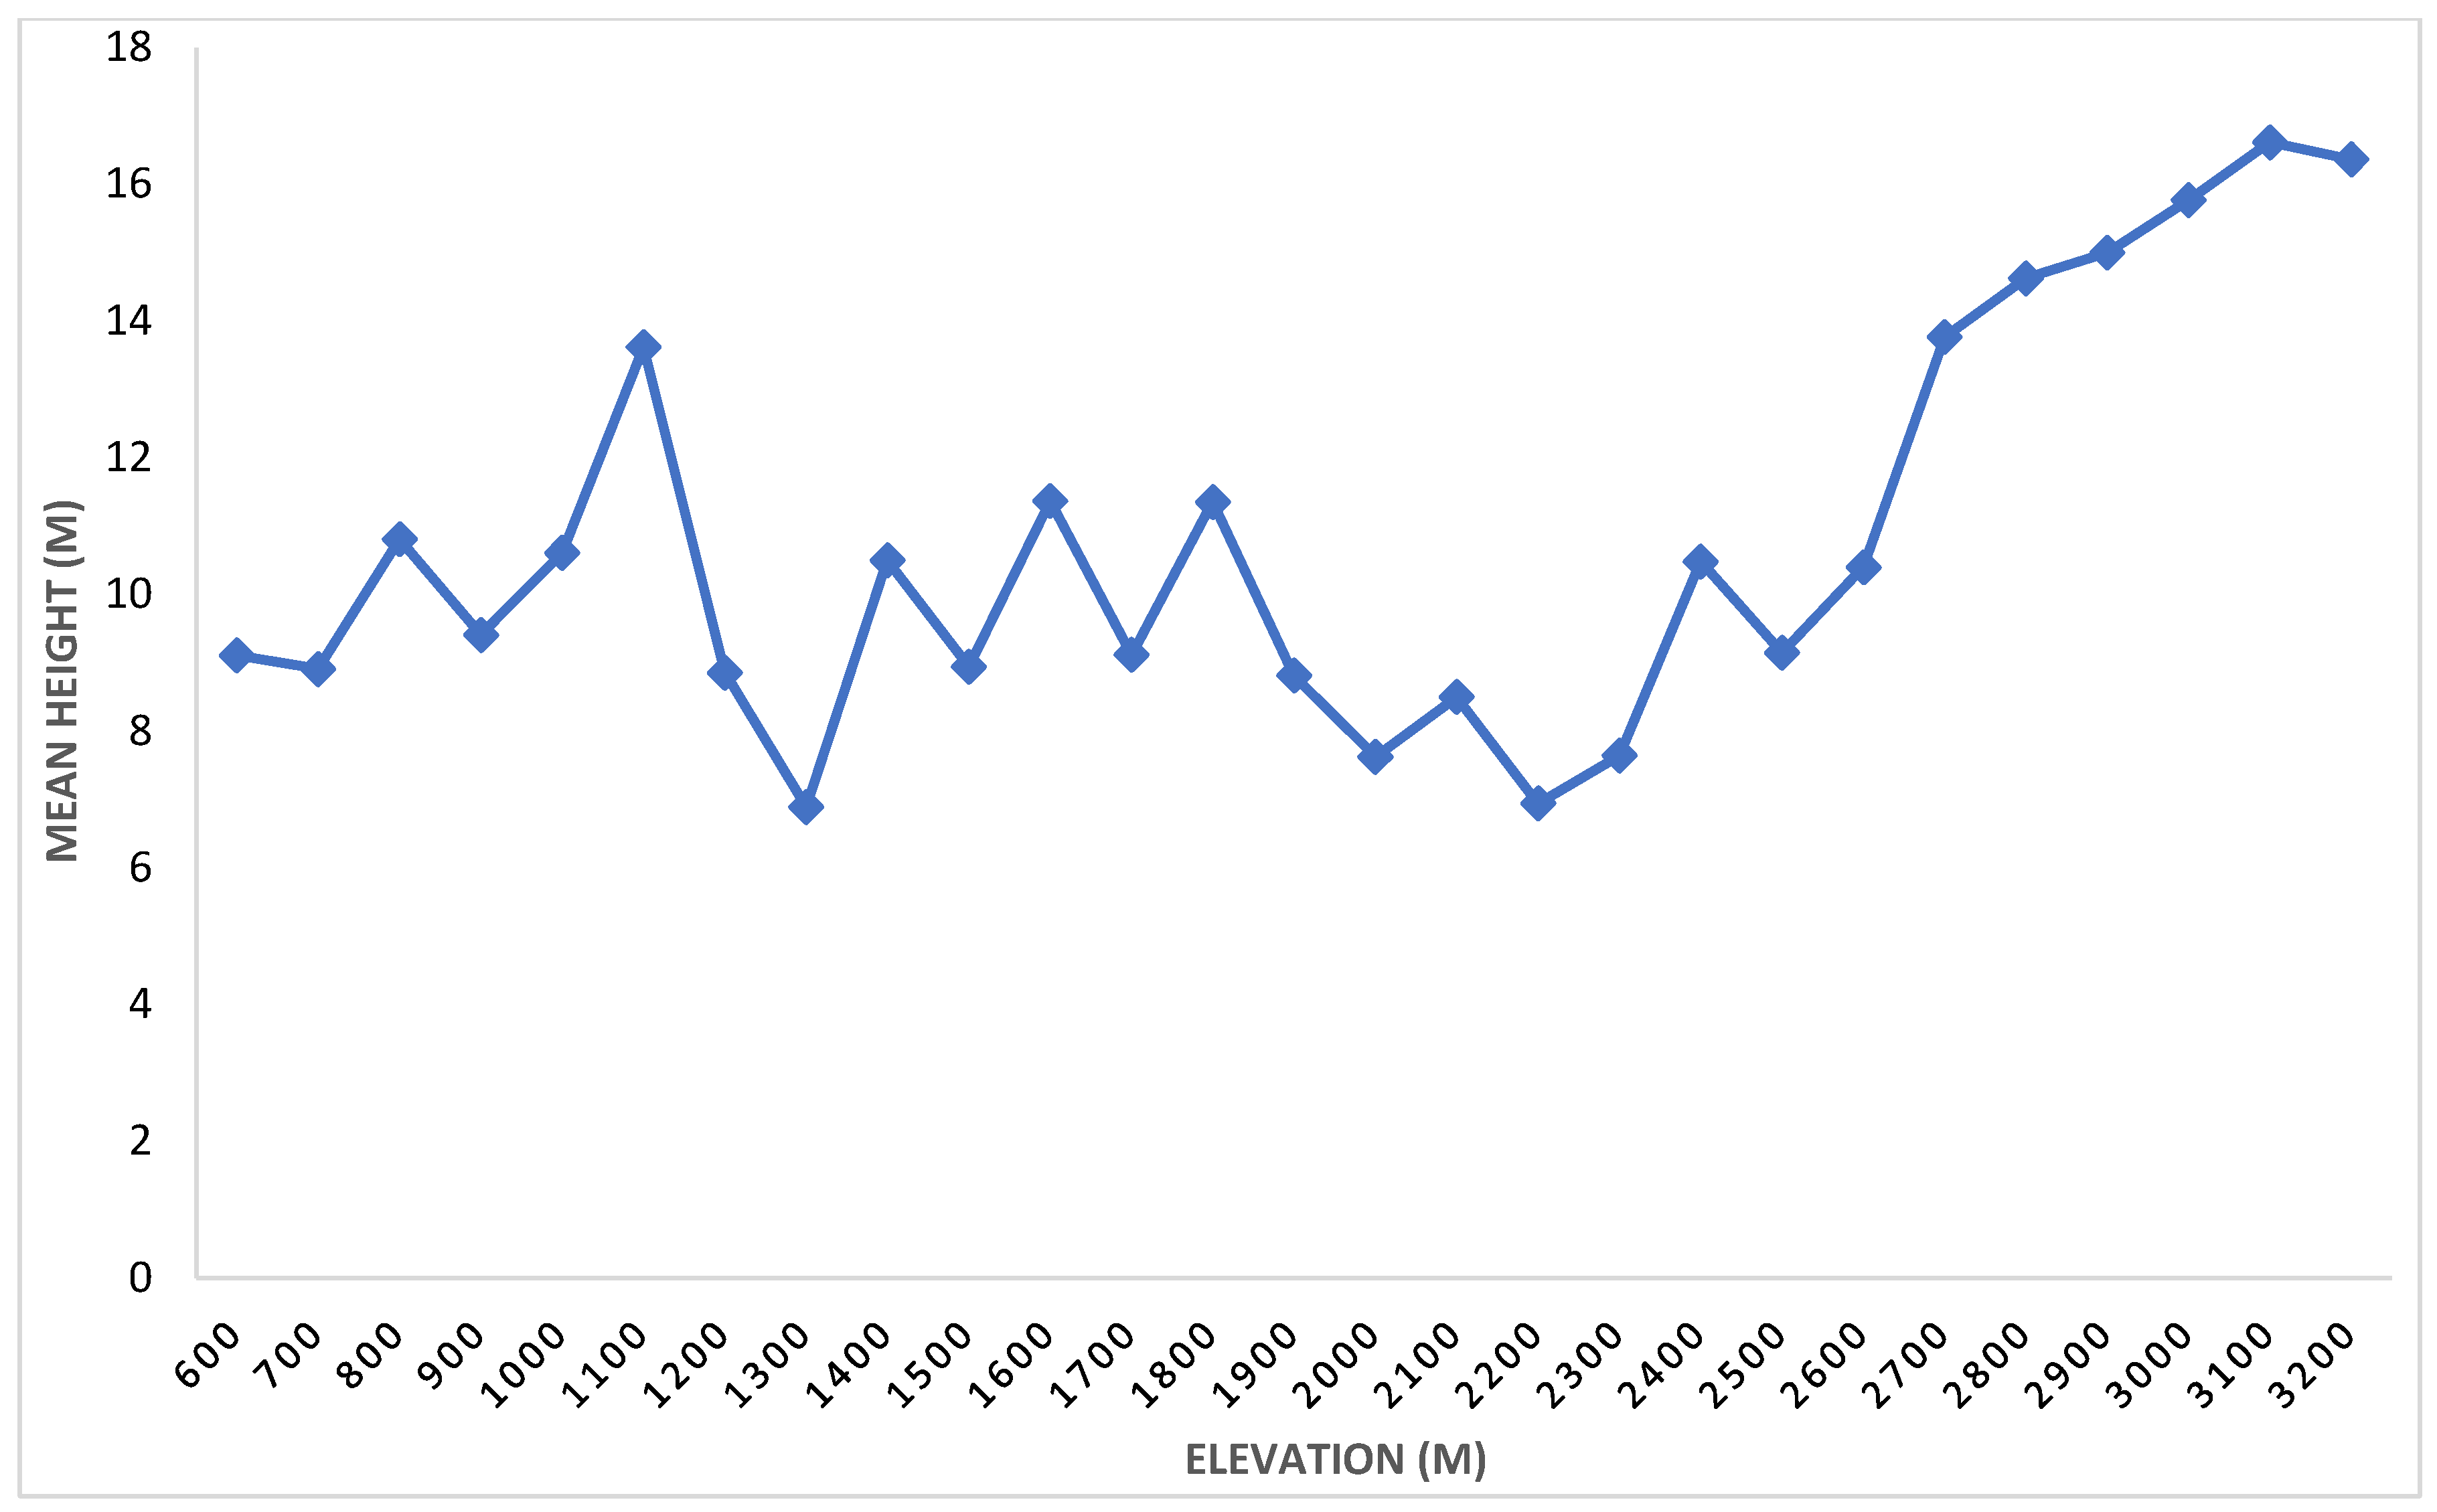
In this study, the maximum mean height was 16.62 m, followed by 16.36 m at elevations of 3100 m and 3200 m, respectively. And the minimum mean height was 6.89 m at an elevation of 1300 m. This shows that the height of trees at higher elevations is comparatively greater than that at lower elevations (Figure 4).

3.2. Importance Value Index (IVI)

The Importance Value Index (IVI) was calculated by summing the relative density, relative basal area, and relative frequency. The dominant tree species in study area were Shorea robusta (44.67) and Quercus semicarpifolia (39.62) based on the IVI, while Bauhinia variegata (0.90) and Prunus cerasoides (0.93) had the lowest IVI in study area, respectively (Table A1). Topographic aspect was found to influence the species composition, forest structure, and diversity.
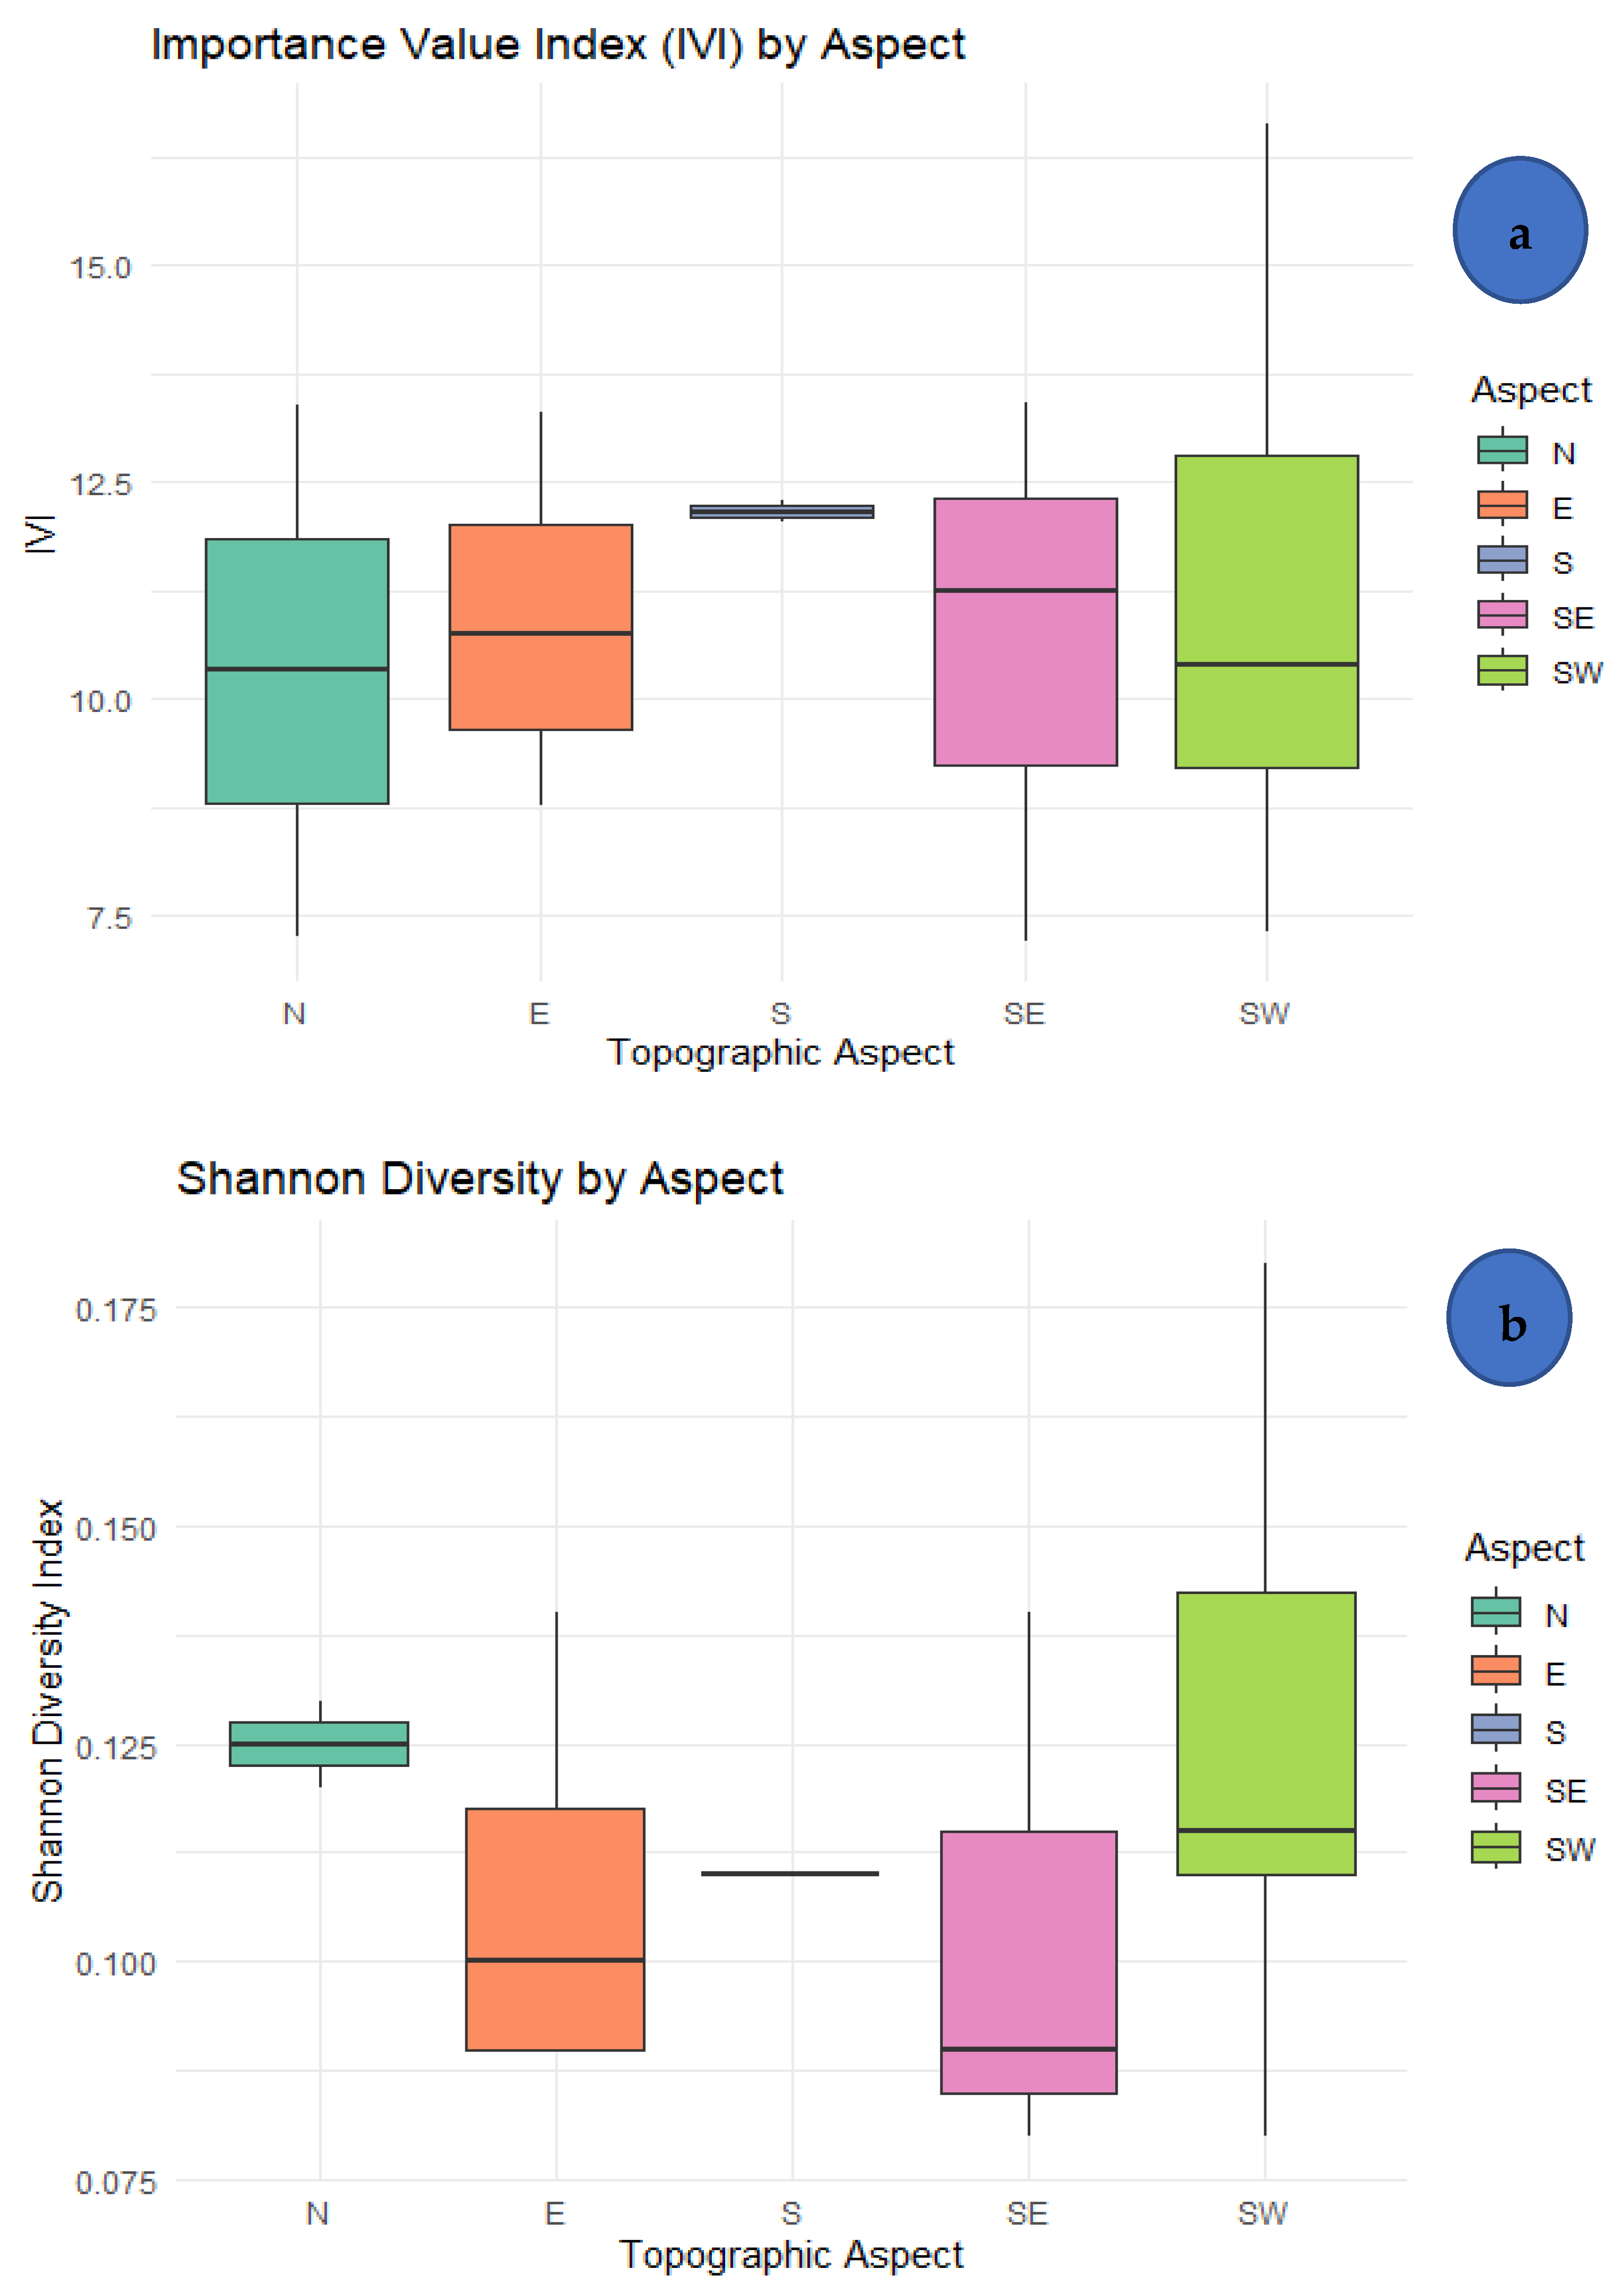
Kruskal–Wallis tests revealed no significant differences in IVI across aspects (H = 0.0002, df = 4, p = 0.999). Although descriptive patterns suggested higher IVI values on southwestern aspects (Figure 5a), these variations were not statistically significant. Elevation remained the dominant driver of IVI variation, with no evidence supporting aspect-mediated differences.

3.3. Diversity of Tree Species

Tree species diversity was calculated for the different elevations separately. The values of the Shannon index, Simpson index, and evenness index showed variations among the different elevation zones (Table A2). The Shannon index, which measures diversity in categorical data, ranged from 0.00 to 2.15. The peak value in the elevation zone centered at 1500 masl. The Simpson index, which measures the probability that two randomly selected individuals from a sample will belong to the same species, ranged from 0.00 to 0.87. The elevation zone between 1500 and 1700 masl exhibited the maximum value of 0.87, while the elevation zone between 800 and 1200 masl constituted the least value. There was no distinct trend for this index with increasing altitude. The evenness index, which measures the degree of equal distribution of individuals within the whole species pool, ranged from 0.60 to 1.00. The elevation zone between 800 and 1200 masl exhibited the maximum value of 1.00, while the elevation zone between 900 and 1000 masl constituted the least value of 0.60. The overall Simpson index was 0.9596, Shannon index was 3.252, and evenness was 0.9574.
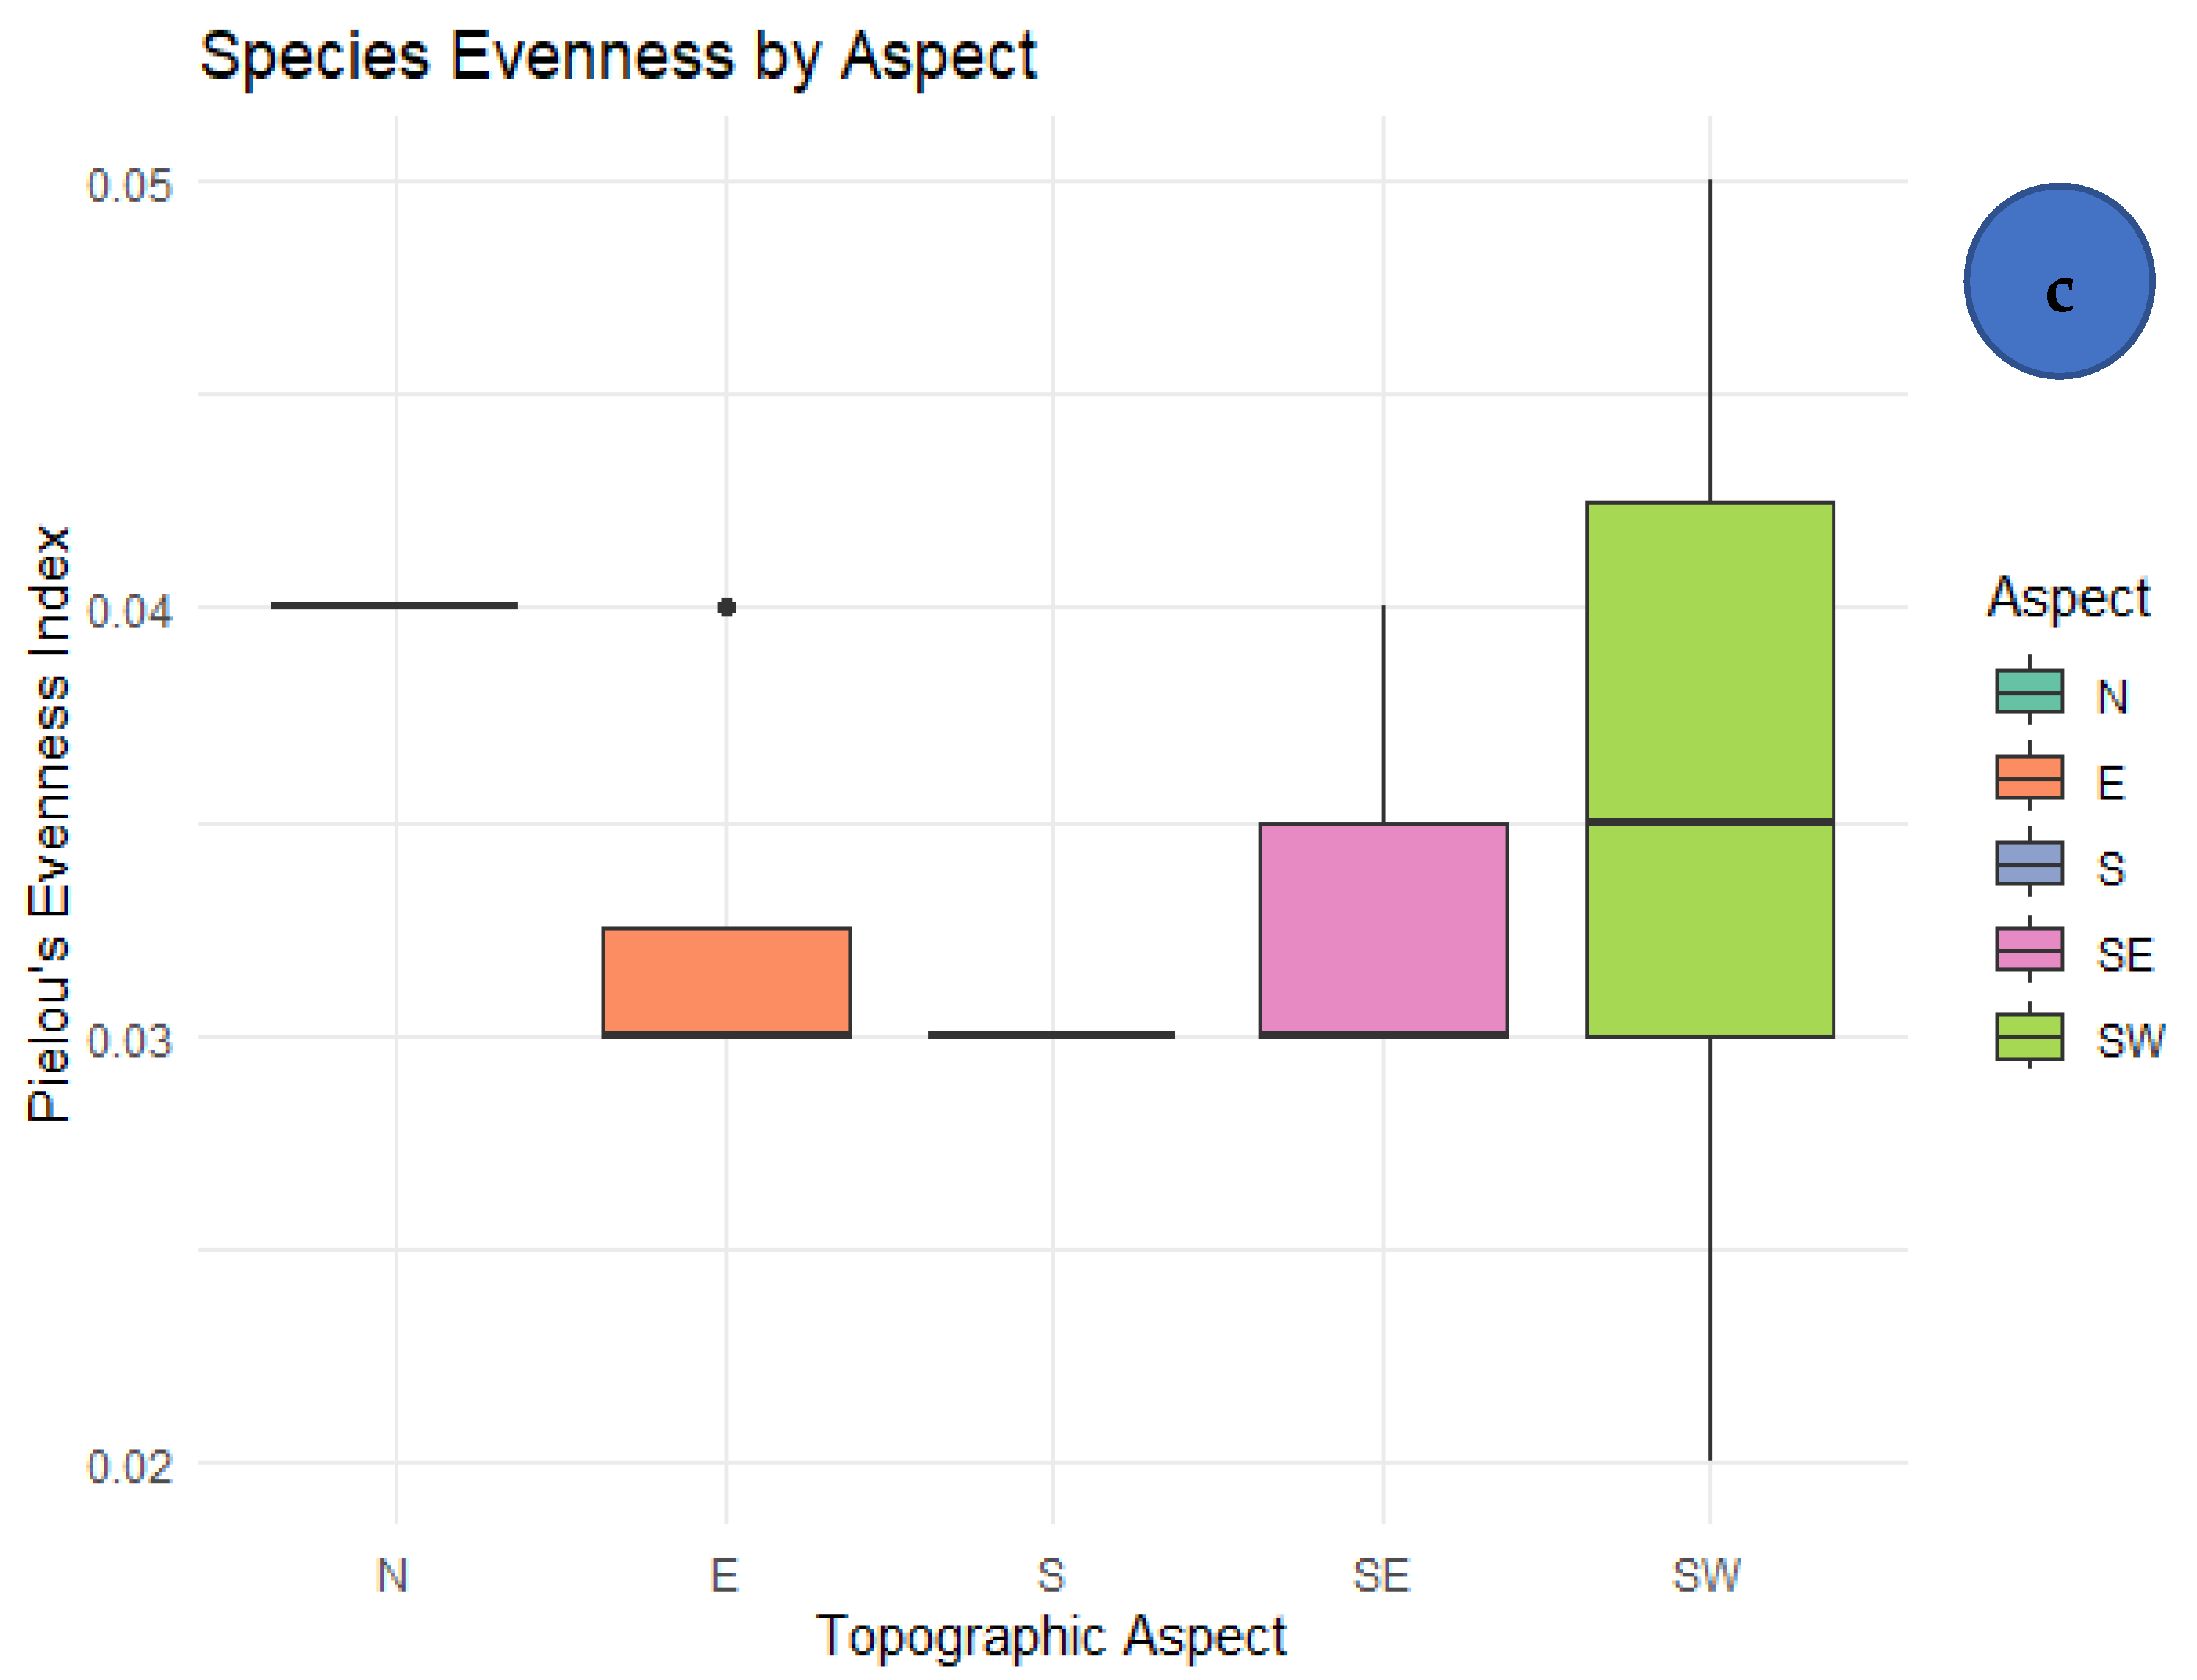
Statistical analysis confirmed no significant aspect effects on Shannon diversity (H = 0.0002, df = 4, p = 0.999) or evenness (H = 0.0002, df = 4, p = 0.999). Boxplot visualizations (Figure 5b,c) demonstrate similar distributions across aspects, indicating that topographic aspect did not significantly modulate diversity patterns in this system.

3.4. Correlation Between Elevation and Diversity Indices

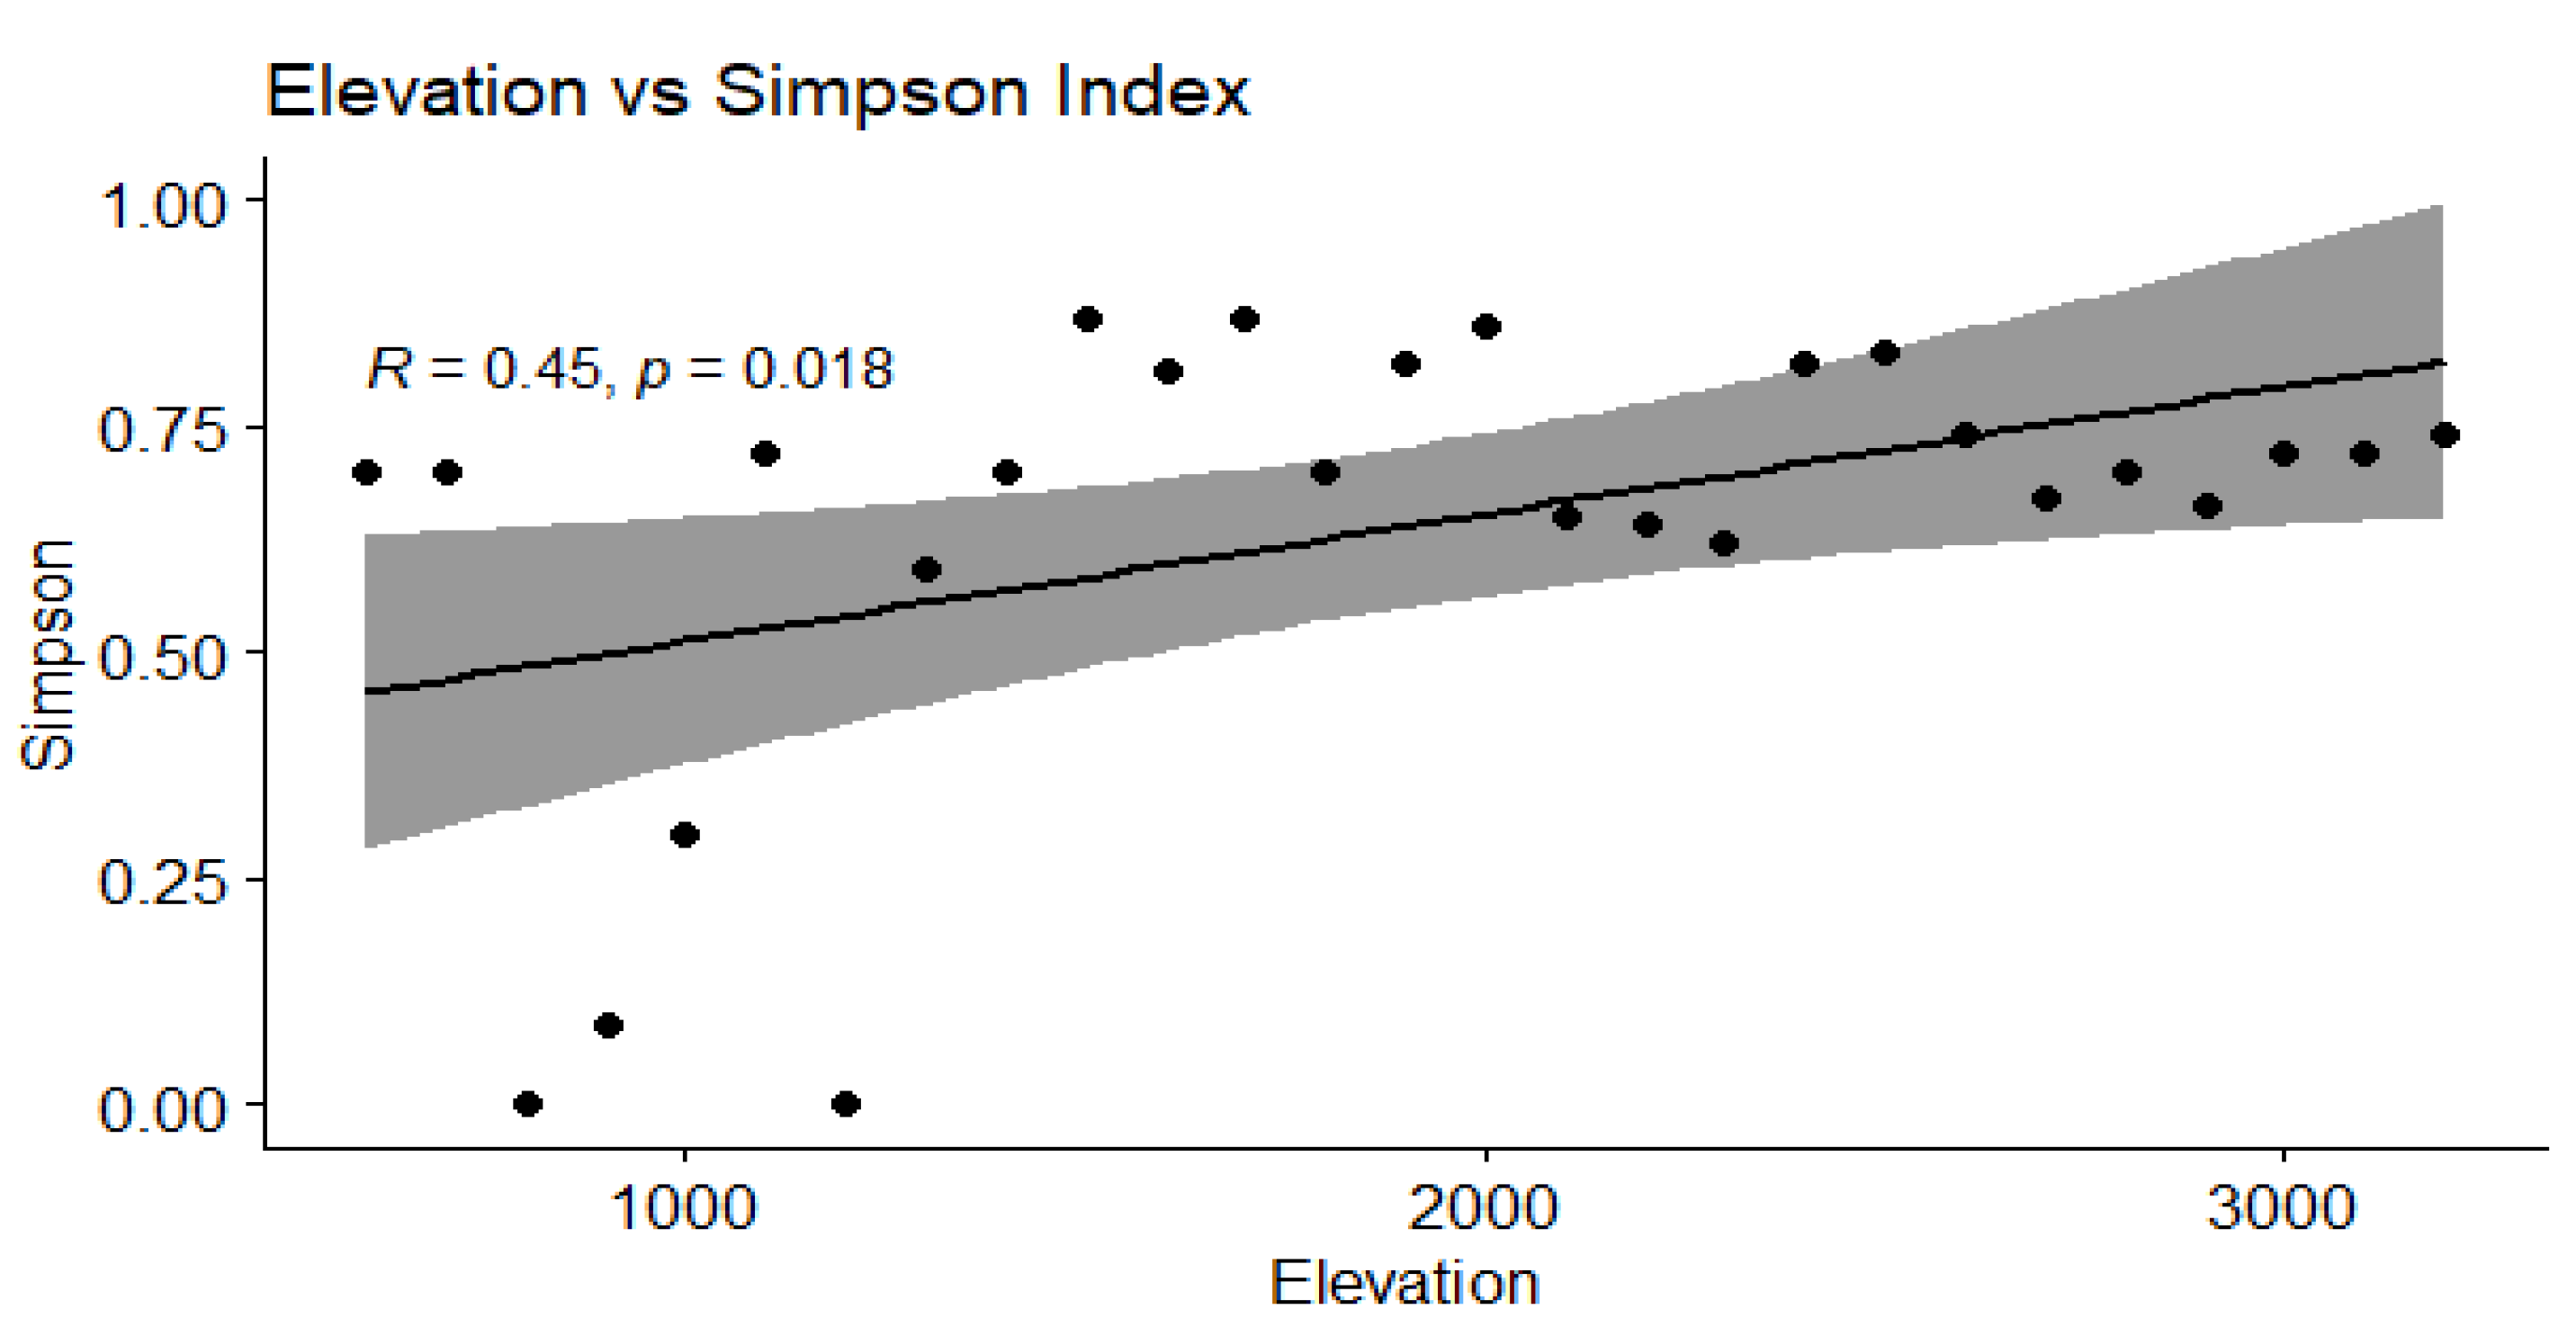
The relationship between elevation and diversity indices was assessed using both Pearson and Spearman correlation tests. Pearson correlation revealed a significant positive association between elevation and Simpson’s diversity index (r = 0.45, p = 0.018), suggesting increased dominance diversity at higher elevations (Figure 6).
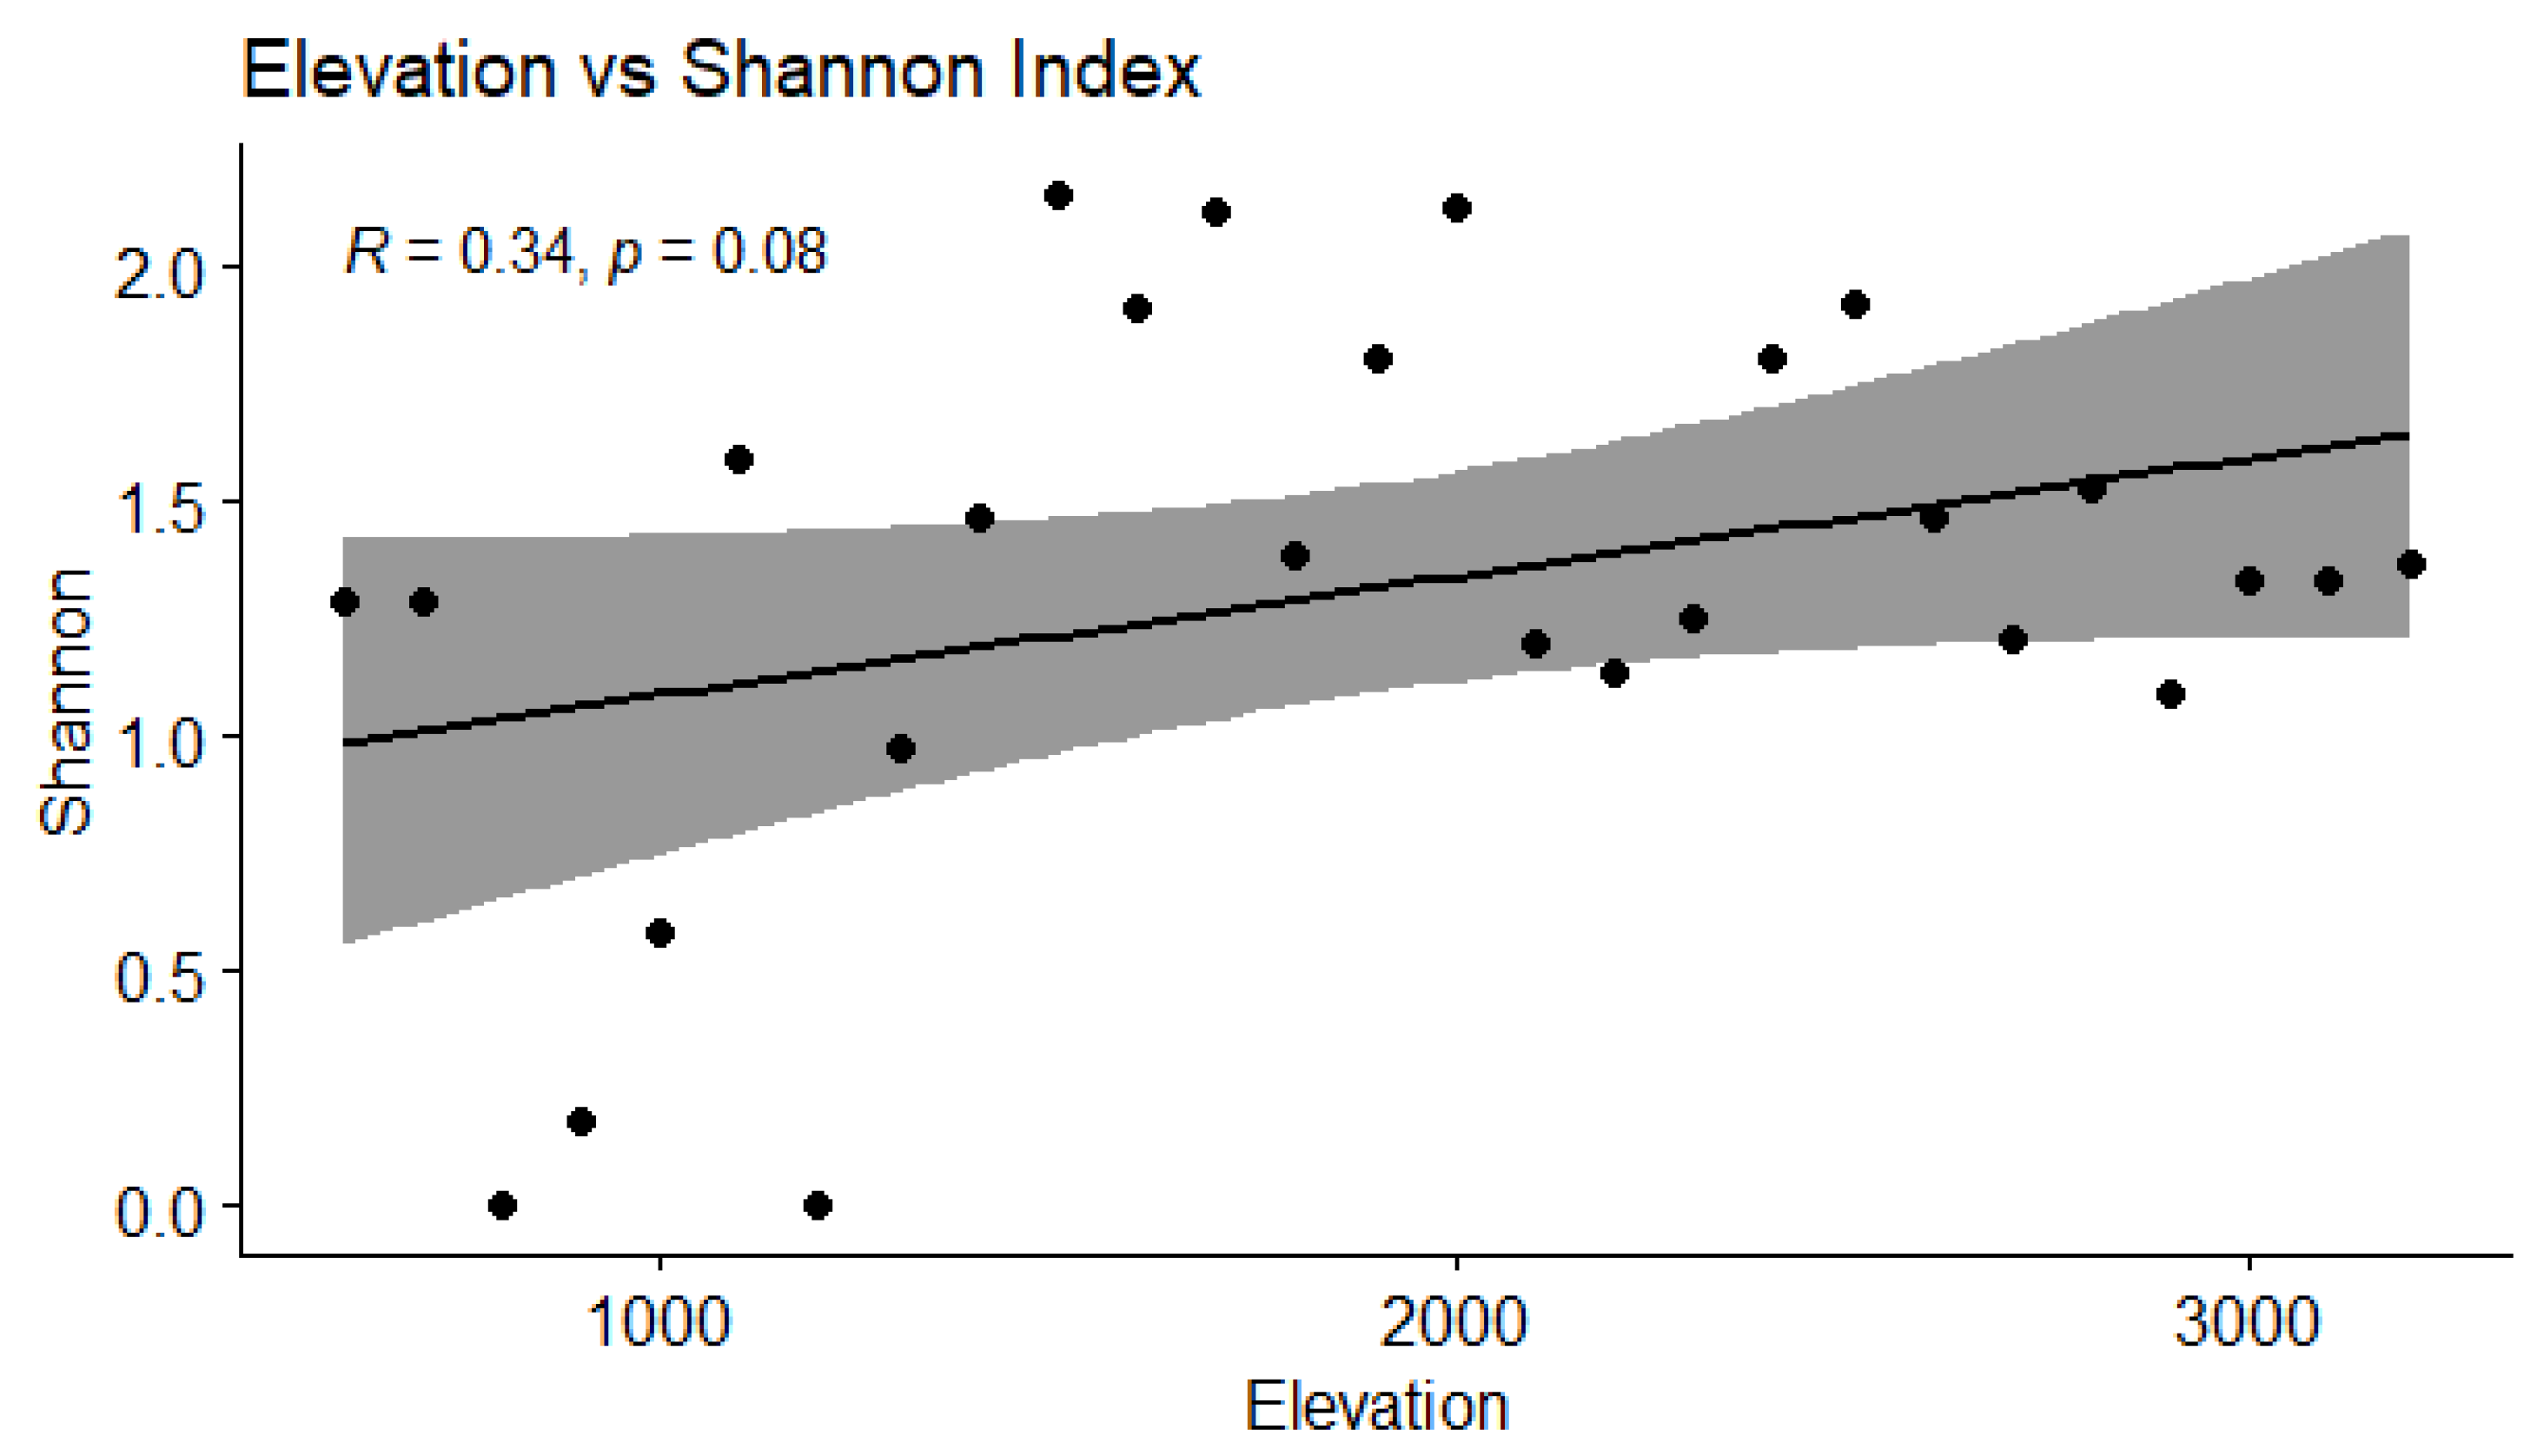
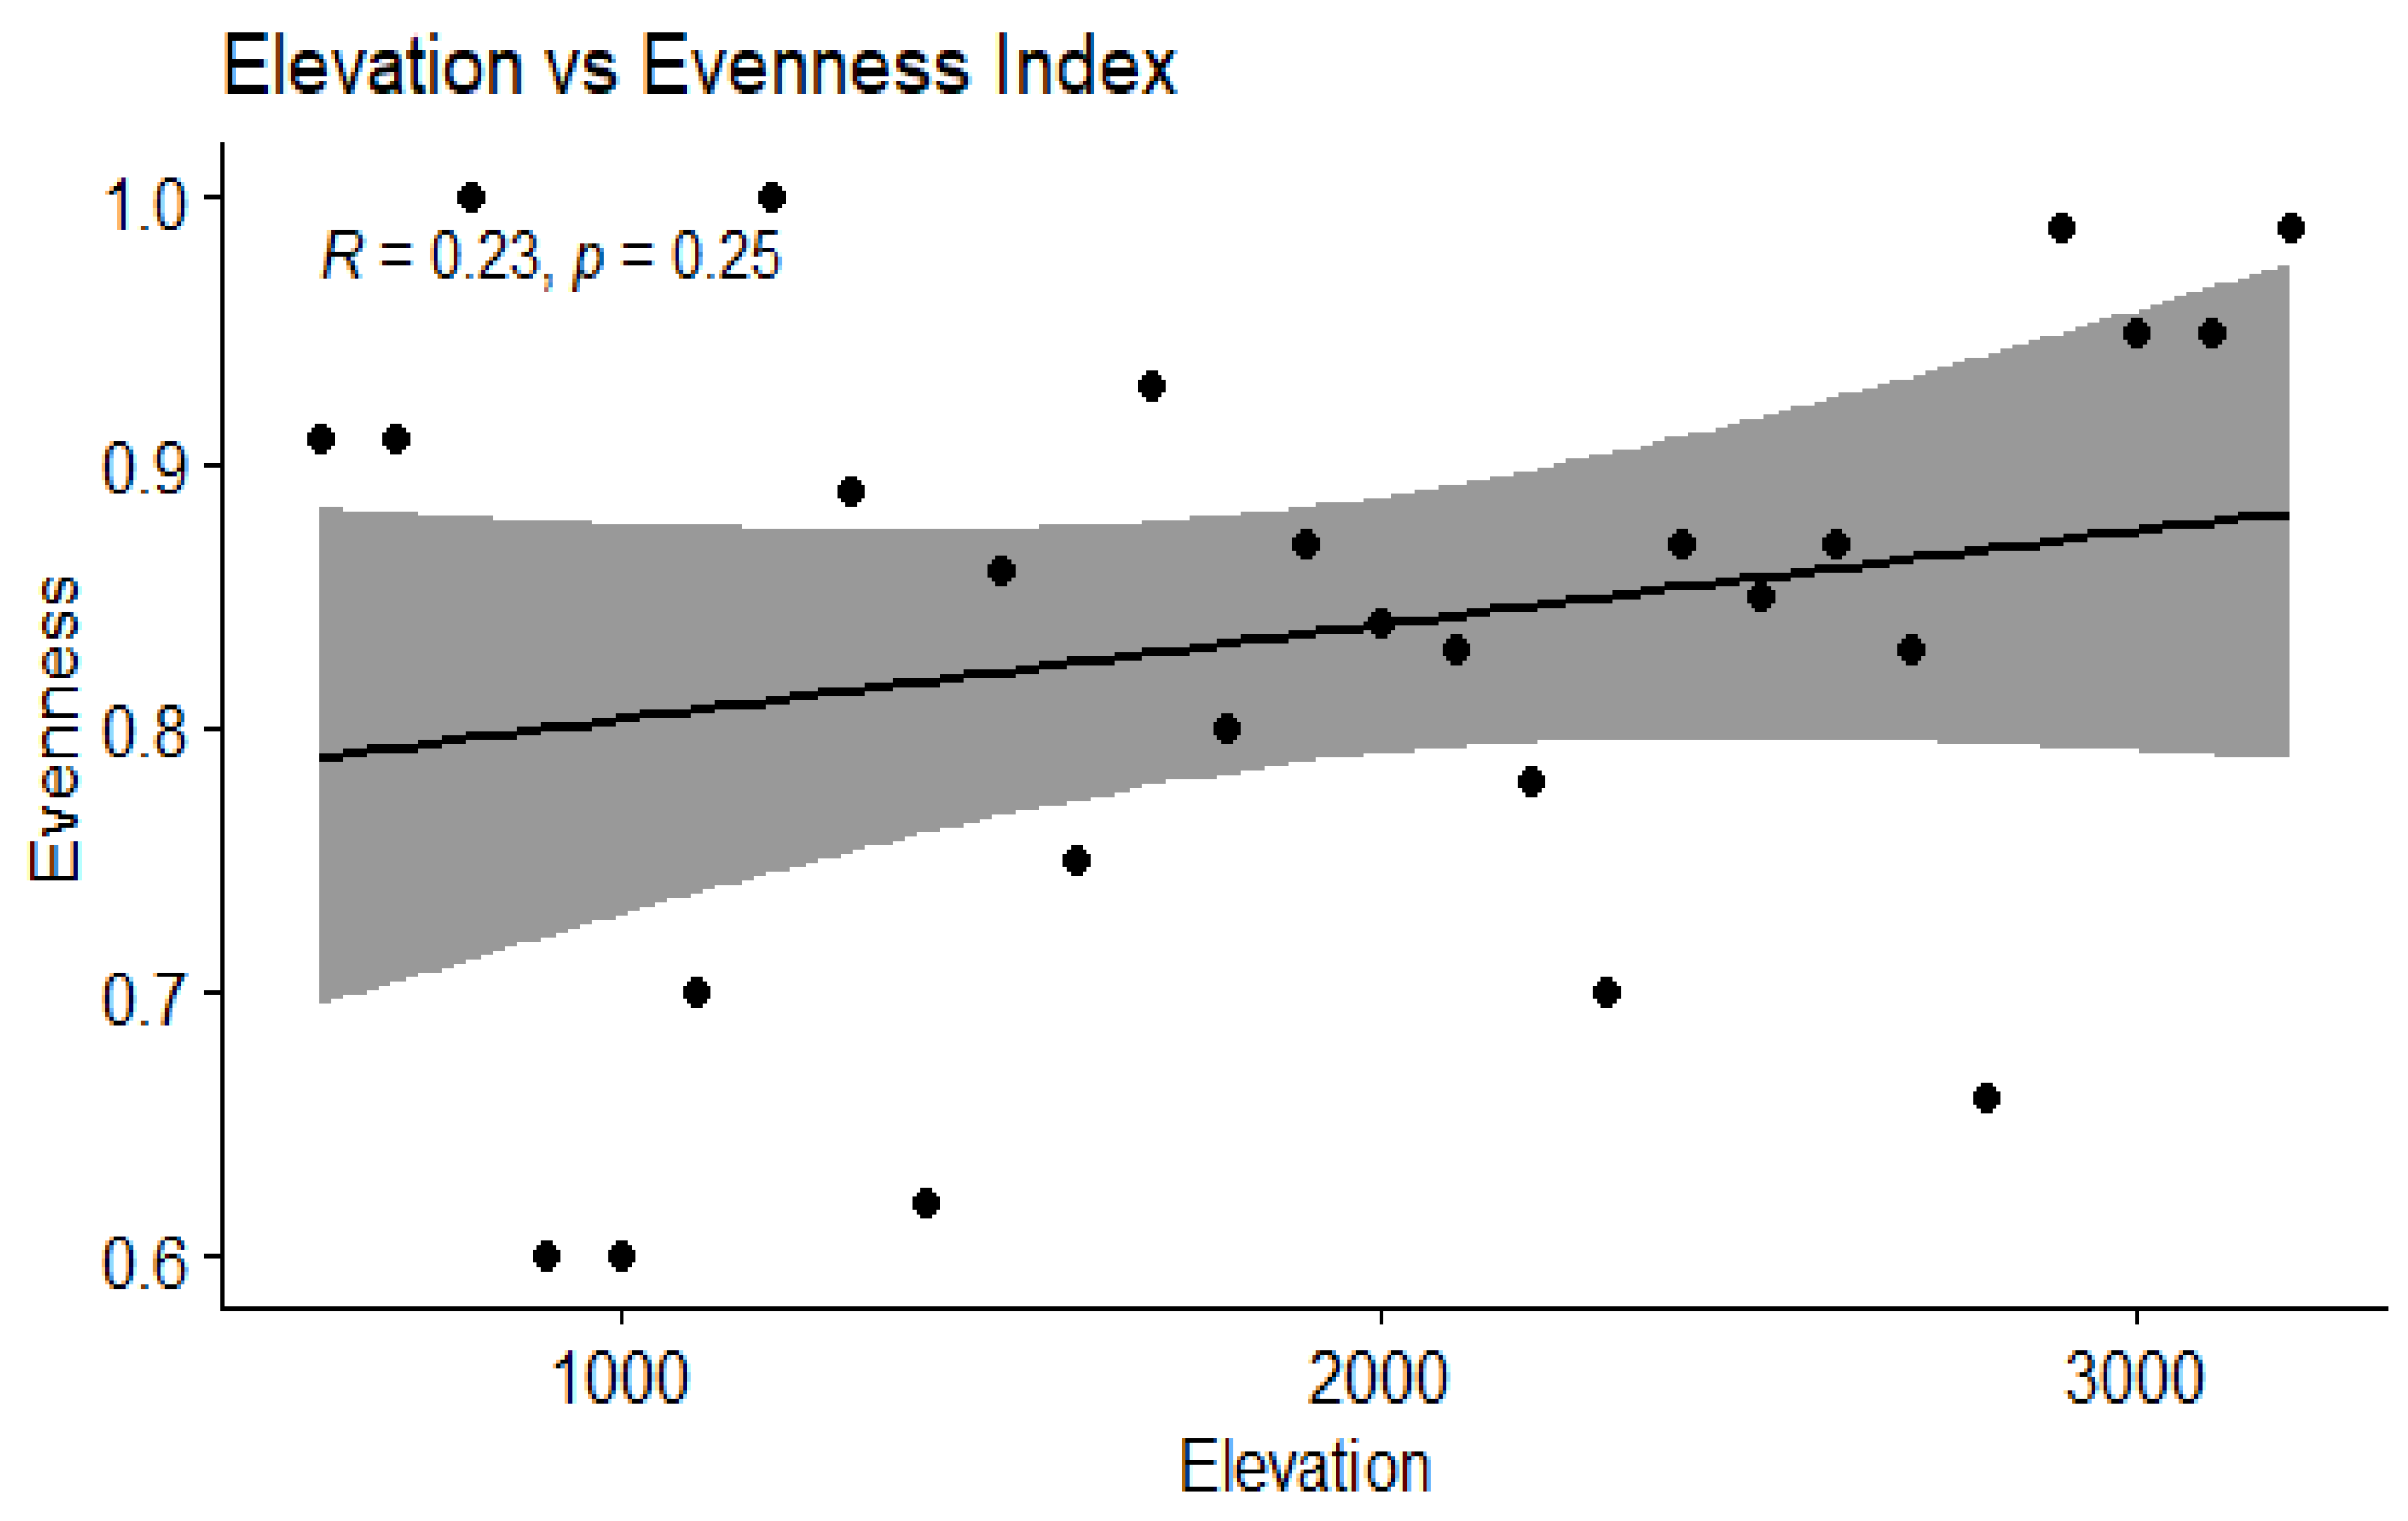
A moderate positive but non-significant correlation was observed for the Shannon index (r = 0.34, p = 0.08), while evenness showed a weak, non-significant relationship (r = 0.23, p = 0.25) (Figure 7 and Figure 8). These results imply a trend toward greater dominance diversity at higher elevations, though evenness remains relatively unaffected.
Spearman’s rank correlation confirmed these trends (Table A2). A significant monotonic relationship was observed between elevation and Simpson’s index (ρ = 0.43, p < 0.05), while Shannon (ρ = 0.32) and evenness (ρ = 0.21) correlations remained non-significant. These consistent results across both methods strengthen the interpretation that Simpson’s diversity increases with elevation, possibly due to greater dominance by a few resilient species in high-altitude zones.

4. Discussion

This research aimed to evaluate the structure, composition, and diversity of forest stands in Dailekh’s forests, located in Nepal’s mid-hill region. The outcomes of this research offer foundational data about the area’s potential for species conservation along an elevational gradient. Further discussion of the results can be found in the following sections.

4.1. Forest Composition

The plant composition and richness are significantly impacted by topographical factors such as elevation, aspect, and slope. Similar findings were reported by [64], who found that topography influenced local hydrology and soil moisture, which in turn influenced patterns of plant variety. Altitude is the most important determinant of tree distribution due to its direct impact on the microclimate of the habitat [65]. In the present study, importance values of species differed along the altitude. This variation is likely due to topographical features such as temperature gradients, soil composition, aspect, and exposure. The floristic composition of tree species varies by elevational zone, according to [66]. Similar findings were found, indicating that the Pinaceae and Ericaceae families are dominant in the upper subalpine region. This could be because of the same temperature gradient, aspect, and soil composition. Yet, Rhododendron arboretum and Alnus nepalensis were the two most dominating species in the lower temperate zone where the study was conducted, and the same species are seen here. [18] found that Shorea robusta was the predominant species in tropical and subtropical regions, which completely coincides with our findings.
This pattern is similar to those reported by [36] in the mid-hills of Nepal. The higher diversity at mid-elevations in our study may be driven by canopy structural heterogeneity, which supports a greater range of light environments and microhabitats, facilitating the coexistence of both shade-tolerant and light-demanding species. This suggests that mid-elevation forests play a disproportionate role in maintaining canopy-level biodiversity and should be prioritized for mixed-species canopy management.

4.2. Forest Structure

Tree structural characteristics like stem densities, basal area, diameter at breast height (DBH), and height depend on the type of forest. This study’s results are compared and contrasted with those found in Langtang National Park (LNP). The research indicates an average tree density of 250 to 800 per hectare, aligning with the density ranges of 460 to 865 per hectare observed in LNP [66]. In the Kumaun Himalaya, stem density values recorded in other studies varied from 420 to 1300 trees/ha [67], while in the western Himalaya, values ranged from 990 to 1470 trees/ha [68] within the altitude range of 1200 to 2500 masl. This could be attributed to factors such as topography, human disturbance, and forest type.
In this study, the average height of tree species recorded was the maximum in the elevation zone of 3100 masl. In contrast to this, some of the tallest and largest trees in the Himalaya were reported between 2500 and 3000 m in the study conducted by [69]. The reason may be the irregular size of trees, due to regeneration rates at lower elevations in comparison to higher ones. The average tree height was the maximum at 2100 masl (30.03 m) and the minimum in the highest plot at 3900 masl (2.44 m) in the research carried out by [66]. In this study, the total basal area for sampling plots ranged from 7.46 to 82.43 m2/ha. This variation may be due to factors such as forest age and successional stage, soil and substrate differences, light availability, canopy structure, environmental stress, and human influence (e.g., past land use, selective logging, or forest management practices). These results are consistent with findings from other studies in the Himalayan region, such as 78–92 m2/ha in lesser Himalayan moist temperate forests [70]; 90–152 m2/ha in trans Himalayan forests of Nepal [71]; and 86–129 m2/ha in Garwal Himalayas [72].
The increased basal area at 2400 m aligns with southwestern aspects, which receive prolonged sunlight, enhancing photosynthetic efficiency and growth rates (Quercus semicarpifolia IVI = 102.5). This aspect also reduces frost risk, fostering soil organic matter accumulation and water retention [73]. Conversely, northern aspects at similar elevations showed lower basal areas (e.g., 13.39 at 2500 m), likely due to shaded and cooler microclimates.
Variation in basal area and height across the elevational gradient also reflects changes in canopy structure, which influence light penetration, microclimatic buffering, and epiphytic communities [55,74]. Taller canopies in upper elevations may provide greater vertical stratification, supporting specialized canopy flora and fauna [21,39], while denser lower-elevation canopies may enhance carbon capture but reduce understory regeneration [46,75].
The Shannon diversity index (0.00–2.15) observed in this study indicates substantial variation in species diversity across the elevational gradient. Diversity was extremely low (near zero) at some high-elevation plots, reflecting monospecific dominance (e.g., Quercus semicarpifolia) and limited regeneration under harsh climatic conditions, whereas mid-elevation zones exhibited moderate diversity, consistent with the mid-domain effect commonly reported in montane ecosystems [66,71]. Our maximum Shannon value (2.15) falls within the typical range for Himalayan forests (1.16–3.40), suggesting that despite local anthropogenic pressures at lower elevations, overall diversity patterns remain comparable to other regions. Similarly, Simpson’s index (0.00–0.86) revealed strong dominance in upper temperate forests, while evenness (0.60–1.00) demonstrated an uneven species distribution at both low and high extremes of the gradient. These patterns align with previous findings [66] that link diversity to microclimatic variability, soil conditions, and human disturbance. Importantly, the observed diversity decline at higher elevations, combined with low evenness, implies vulnerability to environmental stress and highlights the need for elevation-specific conservation strategies to maintain ecological resilience under climate change. These diversity patterns also translate into differences in canopy heterogeneity, a key driver of canopy-level processes such as nutrient cycling, water interception, and habitat provision for canopy-dependent organisms [44,74]. The dominance of Shorea robusta at low elevations and Quercus semicarpifolia at high elevations indicates differing canopy architectures that may shape species interactions, epiphyte load, and canopy microclimates [21,39,75]. To further validate these patterns, both Pearson and Spearman correlation analyses were performed between elevation and tree diversity indices. Both methods indicated a statistically significant positive association between elevation and Simpson’s index, while Shannon and evenness showed weaker, non-significant relationships. The consistent result from the non-parametric Spearman analysis supports the finding that species dominance diversity increases with elevation, likely due to environmental filtering in harsher, high-altitude habitats. These conditions tend to favor a few resilient species, thereby reducing overall species richness but increasing the dominance of those that can thrive [66,71]. This underscores the importance of considering species dominance not just richness when assessing biodiversity along environmental gradients.

4.3. Influence of Topographic Aspect and Anthropogenic Factors

Contrary to initial observations, Kruskal–Wallis tests revealed no significant aspect-mediated differences in forest structure or diversity indices (IVI: p = 0.999; Shannon: p = 0.999; evenness: p = 0.999). This suggests that elevation overrides aspect effects in this system, possibly due to (1) strong elevational climatic gradients masking aspect microclimates, (2) similar disturbance regimes across aspects, or (3) sample size limitations in aspect-specific subgroups. While other Himalayan studies report aspect effects [26,33], our findings align with high-elevation systems where thermal stress dominates microclimatic variation [73].

4.4. Linking Forest Structure to Carbon and Biodiversity Targets

Our findings on basal area, tree height, and slope-driven variations across elevational zones have direct implications for Nepal’s REDD+ and biodiversity conservation strategies. Higher basal areas (e.g., 82.43 m2/ha at 3100 m) and taller trees in upper elevations (Quercus semicarpifolia-dominated zones) suggest greater carbon storage potential in these forests, aligning with Nepal’s goals to enhance forest carbon stocks under REDD+ [40,42]. Conversely, lower elevations with high stem density but smaller trees (e.g., Shorea robusta at 600 m) may prioritize biodiversity conservation, as they support richer understory communities [7].
Slope emerged as a critical modulator of forest structure. At mid-elevations (1000–2500 m), steeper slopes (>30°) correlated with a reduced stem density (250–600 stems/ha) but larger basal area (e.g., 61.2 m2/ha at 2400 m), likely due to limited anthropogenic access and soil erosion, favoring larger, stress-tolerant trees [73]. In contrast, gentler slopes (<15°) at lower elevations (<1000 m) exhibited greater human disturbance, fragmenting habitats and reducing carbon stocks. These patterns highlight the need to integrate the slope into management frameworks, as steep slopes at mid-elevations may act as natural carbon refuges, while gentle slopes in lowlands require restoration to buffer biodiversity loss. From a canopy ecology perspective, the large crowns and high leaf area index in upper-elevation stands contribute to both carbon sequestration and canopy habitat complexity [21,46]. These canopy traits not only influence primary productivity but also regulate ecosystem processes such as evapotranspiration and canopy–atmosphere gas exchange [75,76]. The elevational zonation identified here (tropical to subalpine) provides a template for spatially targeted forest management:
  • High-elevation zones (2500–3200 m): Prioritize carbon sequestration due to large-tree dominance and slow regeneration. Steep northern slopes here may need protection from landslides to preserve soil carbon.
  • Mid-elevations (1000–2500 m): Balance carbon and biodiversity, leveraging mixed-species resilience [57]. Moderate slopes (15–30°) in this zone, particularly southwestern aspects, support high basal areas (e.g., 2400 m) and should be prioritized for REDD+ projects.
  • Low elevations (<1000 m): Focus on community-based biodiversity conservation, as these areas face higher anthropogenic pressure [19]. Gentle slopes here are prone to agricultural encroachment; agroforestry on these terrains could enhance habitat connectivity.
This aligns with Nepal’s National Biodiversity Strategy and Forest Policy 2015, which emphasize landscape-scale approaches. For instance, protecting high-carbon subalpine forests on stable slopes could contribute to Nepal’s NDC targets, while restoring degraded mid-elevation forests on erosion-prone slopes may enhance habitat connectivity for endemic species like Rhododendron arboreum.
Based on these findings, the following management recommendations are proposed to translate ecological insights into actionable forest governance:
  • Incorporate Elevational Zonation into Forest Management: Management plans should reflect elevational differences in species composition and forest structure to ensure that conservation and utilization strategies are ecologically appropriate.
  • Conduct Aspect-wise and Microclimatic Studies: As slope aspect and local climatic conditions influence forest dynamics, further research is essential to understand how these variables interact with elevation to shape biodiversity and carbon stocks.
  • Monitor and Mitigate Anthropogenic Pressures: Activities such as grazing, logging, and land-use change should be regulated, especially in sensitive zones, through strengthened community forest management and stricter enforcement of forest policies.
  • Implement Climate-Responsive Conservation Strategies: Given the potential for altitudinal shifts in species distributions due to climate change, long-term monitoring programs are necessary to track compositional changes and inform adaptive management.
  • Enhance Local Capacity and Awareness: Capacity-building initiatives for local communities and forest managers are vital to improve awareness of elevation-specific ecological dynamics and promote sustainable forest stewardship.
By integrating these strategies into spatially explicit forest policies, the resilience of Nepal’s forest ecosystems—especially in the mid-hills—can be bolstered amid ongoing environmental change and anthropogenic pressure.

4.5. Policy Implications, Limitations, and Future Directions

This study provides critical insights into how elevation and topographic aspects influence forest structure, species composition, and biodiversity in Nepal’s mid-hill region, offering a scientific foundation for spatially targeted forest management and conservation policies. The clear variation in forest characteristics along elevational gradients and aspects underscores the necessity of elevation- and aspect-sensitive strategies that balance carbon sequestration goals in higher-altitude forests with biodiversity conservation priorities in lower-elevation zones. Incorporating these ecological patterns into Nepal’s REDD+ framework and National Biodiversity Strategy can strengthen climate-resilient forest governance. Moreover, active involvement of local communities in elevation-specific conservation efforts is vital to mitigate human pressures and promote sustainable stewardship, especially in zones vulnerable to climate change and land-use changes.
However, while this study addresses key factors such as elevation and aspect, important environmental variables including soil type, slope variability, and detailed anthropogenic metrics remain beyond its scope. The absence of data on soil nutrient gradients and livestock grazing intensity, for example, limits a full understanding of regeneration constraints at higher elevations [17,75]. These factors likely play a significant role in shaping biodiversity patterns and forest dynamics and warrant further investigation. Additionally, the cross-sectional design restricts insights into temporal forest changes and resilience under ongoing climatic and anthropogenic pressures. While we employed widely used indices such as Shannon’s diversity index, Simpson’s diversity index, and Pielou’s evenness, we recognize that diversity metrics based on Hill numbers (effective number of species) provide improved comparability between sites and facilitate clearer ecological interpretation. Future studies in this region should incorporate Hill numbers alongside traditional indices to strengthen cross-site comparisons and align with emerging best practices in biodiversity assessment.
Future research should prioritize integrating these missing variables, soil properties, slope characteristics, and detailed human disturbance metrics, along with long-term ecological monitoring. Such comprehensive data will enhance predictive modeling of species distribution, forest carbon storage, and ecological resilience, enabling more adaptive and effective forest management. Future studies should integrate direct measurements of canopy attributes such as leaf area index, canopy gap fraction, and vertical stratification to better link species diversity and structural patterns with canopy ecological processes. Furthermore, embedding climate-responsive monitoring programs and fostering meaningful community engagement will strengthen sustainable forest stewardship. Addressing these limitations will better equip policymakers and forest managers to develop spatially explicit conservation and restoration strategies that sustain Nepal’s montane forest ecosystems in the face of environmental change.

5. Conclusions

This study highlights the interplay of elevational zonation and topographic aspect in shaping the forest structure and biodiversity. The results clearly demonstrate that elevation significantly influences forest stand characteristics including basal area, tree height, and stem density as well as the diversity and distribution of tree species. Higher elevations were generally characterized by larger but fewer trees, while lower elevations hosted smaller, more densely packed individuals. Statistical analysis confirmed elevation as the primary environmental filter, with no significant effects of topographic aspect on biodiversity indices (IVI: p = 0.999; Shannon: p = 0.999). Species richness exhibited a non-linear pattern, with moderate diversity peaks at mid-elevations, affirming the mid-domain effect commonly observed in montane ecosystems. The dominance of species such as Shorea robusta at lower elevations and Quercus semicarpifolia at higher altitudes underscores the altitudinal niche differentiation driven by climatic and edaphic factors. Furthermore, diversity indices such as Shannon, Simpson, and evenness varied notably across elevations, highlighting the complex interplay between environmental gradients and ecological community assembly.
Additionally, slope gradients and aspect influenced forest structural variation and carbon storage potential, with steeper slopes harboring larger trees that contribute substantially to biomass accumulation. This study also reflects how anthropogenic pressures vary with elevation and topography, affecting regeneration and forest resilience. These insights underscore the importance of incorporating topographic complexity and human impact gradients into adaptive forest management and climate mitigation planning.
These findings provide essential baseline data for understanding biodiversity patterns across elevationally heterogeneous landscapes and underscore the importance of integrating elevation and topographic aspect into forest management strategies. In the face of accelerating climate change and mounting anthropogenic pressures, such spatially explicit ecological insights are critical for informing adaptive conservation, ecosystem restoration, and climate-resilient land-use planning in Nepal and comparable montane regions globally. Notably, the correlation analysis revealed a significant positive association between elevation and Simpson’s diversity index, indicating that species dominance increases with altitude. This trend reflects strong environmental filtering at higher elevations, where only a few resilient species persist. Therefore, biodiversity assessments should not focus solely on species richness but also consider dominance patterns to more accurately capture ecological dynamics along elevational gradients. These integrative findings support the development of nuanced, elevation-sensitive forest governance frameworks capable of sustaining ecosystem functionality under changing environmental conditions.

Author Contributions

Conceptualization, S.A. and R.J.; methodology, S.A., R.J. and T.N.M.; formal analysis, S.A., R.J. and P.B.; investigation, S.A., R.J. and T.N.M.; data curation, S.A., R.J. and T.N.M.; writing—original draft preparation, S.A. and R.J.; writing—review and editing, all authors; supervision, R.J. All authors have read and agreed to the published version of the manuscript.

Funding

No funding was received to conduct this study.

Acknowledgments

The authors would like to express their sincere gratitude to Arjun Lamsal (CNRM, Katari) and Ganesh K.C., Forest Guard at the Division Forest Office, Dailekh, for their valuable support and cooperation during the data collection process. We also extend our sincere thanks to Bikram Singh, Forest Officer at Triveni Divison Forest Office, Udayapur, and Rakshanda Sedhain, Forest Officer at the Division Forest Office, Dailekh, for their valuable guidance and continuous support to the principal author throughout the research period.

Conflicts of Interest

The authors declare no conflicts of interest.

Appendix A

Table A1. Summary of relative density, relative frequency, relative basal area, IVI, and relative abundance of different species.
S.N.Scientific NameFamilyRelative Density (%)Relative Frequency (%)Relative Basal Area (%)IVIRelative Abundance (%)
1Shorea robustaDipterocarpaceae27.186.1611.3344.6713.81
2Alnus nepalensisBetulaceae8.539.5912.9831.102.79
3Persea odoratissimaLauraceae2.382.742.397.512.72
4Ligustrum robustumOleaceae3.774.112.3010.182.87
5Pyrus pashiaRosaceae1.392.740.304.431.59
6Ficus neriifoliaMoraceae0.200.680.060.940.91
7Madhuca longifoliaSapotaceae3.176.161.6210.961.61
8Schima wallichiiTheaceae1.982.050.744.773.02
9Pinus roxburghiiPinaceae3.172.741.667.583.63
10Quercus leucotrichophoraFagaceae1.192.740.904.831.36
11Ficus semicordataMoraceae0.602.050.202.850.91
12Myrica esculentaMyricaceae1.393.420.695.501.27
13Albizia lebbeckFabaceae (Mimosoideae)0.400.680.201.281.81
14Senegalia catechuFabaceae (Mimosoideae)1.791.370.323.484.08
15Diospyros malabaricaEbenaceae1.982.740.274.992.27
16Prunus cerasoidesRosaceae0.200.680.040.930.91
17Rhododendron arboreumEricaceae8.137.537.0022.673.38
18Pogostemon benghalensisLamiaceae0.400.680.081.161.81
19Bauhinia variegataFabaceae (Caesalpinioideae)0.200.680.020.900.91
20Pinus wallichianaPinaceae3.374.1112.3819.862.57
21Quercus semecarpifoliaFagaceae7.345.4826.8039.624.20
22Juglans regiaJuglandaceae1.191.371.303.862.72
23Garuga pinnataBurseraceae0.600.680.541.822.72
24Toona ciliata (Cedrela toona)Meliaceae0.791.371.823.991.81
25Dalbergia sissooFabaceae (Faboideae)2.581.370.454.405.90
26Albizia proceraFabaceae (Mimosoideae)1.191.370.312.872.72
27Premna longifoliaLamiaceae0.200.680.271.160.91
28Daphniphyllum himalaenseDaphniphyllaceae1.190.680.142.015.44
29Falconeria insignisEuphorbiaceae0.601.370.252.211.36
30Castanopsis tribuloidesFagaceae1.592.051.004.642.42
31Lyonia ovalifoliaEricaceae2.386.160.609.141.21
32Quercus acutissimaFagaceae1.980.680.593.269.07
33Tsuga dumosaPinaceae1.796.164.9412.890.91
34Michelia champacaMagnoliaceae1.192.740.444.371.36
35Rhododendron campanulatumEricaceae3.974.115.0713.153.02
Total100.00100.00100.00300.0100.00
Table A2. Correlation tests between elevation and three biodiversity indices.
IndexPearson (r)p-ValueSpearman (ρ)p-ValueInterpretation
Simpson0.450.0180.43<0.05Significant positive correlation
Shannon0.340.080.32NSModerate, not statistically significant
Evenness0.230.250.21NSWeak, not significant
Table A3. Summary of climatic and soil characteristics across elevational zones in Dailekh district, Nepal (note: climate data adapted from Department of Hydrology and Meteorology (DHM), Nepal; soil types based on FAO classification and regional ecological studies).
Elevational ZoneElevation Range (m)Mean Annual Temperature (°C)Mean Annual Precipitation (mm)Dominant Soil Type
Tropical<100020–251200–1500Sandy loam to silty loam
Subtropical1000–200015–201500–2000Loam to clay loam
Lower Temperate2000–250010–151500–2500Silty clay, high organic matter
Upper Temperate2500–32005–102000–3000Shallow loam, rocky substrate

References

  1. Gutiérrez, A.G.; Huth, A. Successional stages of primary temperate rainforests of Chiloé Island, Chile. Perspect. Plant Ecol. Evol. Syst. 2012, 14, 243–256. [Google Scholar] [CrossRef]
  2. Waheed, M.; Haq, S.M.; Arshad, F.; Bussmann, R.W.; Hashem, A.; Abd_Allah, E.F. Plant distribution, ecological traits and diversity patterns of vegetation in subtropical managed forests as guidelines for forest management policy. Front. For. Glob. Chang. 2024, 7, 1406075. [Google Scholar] [CrossRef]
  3. Rahman, I.U.; Hart, R.E.; Ijaz, F.; Afzal, A.; Iqbal, Z.; Calixto, E.S.; Abd_Allah, E.F.; Alqarawi, A.A.; Hashem, A.; Al-Arjani, A.-B.F.; et al. Environmental variables drive plant species composition and distribution in the moist temperate forests of Northwestern Himalaya, Pakistan. PLoS ONE 2022, 17, e0260687. [Google Scholar] [CrossRef] [PubMed]
  4. Thapliyal, N.; Bhojak, P.; Sekar, K.C.; Bisht, K.; Mehta, P.; Arya, D.; Joshi, S. Potential drivers of plant diversity and composition in high-altitude alpine regions of Himalaya. Community Ecol. 2025, 26, 85–103. [Google Scholar] [CrossRef]
  5. Sharma, C.M.; Mishra, A.K.; Krishan, R.; Tiwari, O.P.; Rana, Y.S. Impact of climate on structure and composition of Ridge Top forests in Garhwal Himalaya. Taiwania 2016, 61, 61–69. [Google Scholar]
  6. Kattel, G.R. Climate warming in the Himalayas threatens biodiversity, ecosystem functioning and ecosystem services in the 21st century: Is there a better solution? Biodivers. Conserv. 2022, 31, 2017–2044. [Google Scholar] [CrossRef]
  7. Adhikari, Y.P.; Fischer, A.; Pauleit, S. Sustainable conservation perspectives for epiphytic orchids in the central Himalayas, Nepal. Appl. Ecol. Environ. Res. 2015, 13, 753–767. [Google Scholar] [CrossRef]
  8. Paudel, P.K.; Bhattarai, B.P.; Kindlmann, P. An overview of the biodiversity in Nepal. Himal. Biodivers. Chang. World 2011, 1, 1–40. [Google Scholar]
  9. Paudel, P.K.; Jha, P.K. Nepal’s unique physiographic and climatic diversity, compressed within a narrow latitudinal span, offers a microcosm of global biodiversity patterns. J. Biodivers. Conserv. 2011, 20, 123–135. [Google Scholar]
  10. DFRS. Forest Resource Assessment Nepal; Department of Forest Research and Survey: Kathmandu, Nepal, 2016. [Google Scholar]
  11. Bhattarai, P.C.; Acharya, S.P. Sustainable Management of Non-wood Forest Products for Rural Livelihoods in Nepal. In Nonwood and Livelihood: Sustainable Management of Non-Wood Forest Products for Rural Livelihoods in South Asia; SAARC Agriculture Centre: Dhaka, Bangladesh, 2021; 166p. [Google Scholar]
  12. Kreft, H.; Jetz, W.; Mutke, J.; Barthlott, W. Contrasting environmental and regional effects on global pteridophyte and seed plant diversity. Ecography 2010, 33, 408–419. [Google Scholar] [CrossRef]
  13. Dani, R.S.; Divakar, P.K.; Baniya, C.B. Diversity and composition of plants species along elevational gradient: Research trends. Biodivers. Conserv. 2023, 32, 2961–2980. [Google Scholar] [CrossRef]
  14. Vetaas, O.R.; Paudel, K.P.; Christensen, M. Principal factors controlling biodiversity along an elevation gradient: Water, energy and their interaction. J. Biogeogr. 2019, 46, 1652–1663. [Google Scholar] [CrossRef]
  15. Asefa, M.; Cao, M.; He, Y.; Mekonnen, E.; Song, X.; Yang, J. Ethiopian vegetation types, climate and topography. Plant Divers. 2020, 42, 302–311. [Google Scholar] [CrossRef]
  16. Shaheen, H.; Ullah, Z.; Khan, S.M.; Harper, D.M. Species composition and community structure of western Himalayan moist temperate forests in Kashmir. For. Ecol. Manag. 2012, 278, 138–145. [Google Scholar] [CrossRef]
  17. Kumar, R.; Bhardwaj, A.K.; Chandra, K.K. Levels of Natural and Anthropogenic Disturbances and Assessment of Their Impact on Plant Community Functional Diversity. Forestist 2023, 73, 1–12. [Google Scholar] [CrossRef]
  18. Joshi, R.; Chhetri, R.; Yadav, K. Vegetation Analysis in Community Forests of Terai Region, Nepal. Int. J. Environ. 2019, 8, 68–82. [Google Scholar] [CrossRef]
  19. Bhandari, S.K.; Maraseni, T.; Timilsina, Y.P.; Parajuli, R. Species composition, diversity, and carbon stock in trees outside forests in middle hills of Nepal. For. Policy Econ. 2021, 125, 102402. [Google Scholar] [CrossRef]
  20. Khan, M.L.; Bawa, K.S. Effectiveness of protected area network in biodiversity conservation in north-east India: A case study of Meghalaya state. J. Ecol. 2014, 5, 1–12. [Google Scholar]
  21. Ali, A. Forest stand structure and functioning: Current knowledge and future challenges. Ecol. Indic. 2019, 98, 665–677. [Google Scholar] [CrossRef]
  22. Bisht, M.; Sekar, K.C.; Mukherjee, S.; Thapliyal, N.; Bahukhandi, A.; Singh, D.; Bhojak, P.; Mehta, P.; Upadhyay, S.; Dey, D. Influence of anthropogenic pressure on the plant species richness and diversity along the elevation gradients of Indian Himalayan high-altitude protected areas. Front. Ecol. Evol. 2022, 10, 751989. [Google Scholar] [CrossRef]
  23. Khan, M.; Khan, S.M.; Ilyas, M.; Alqarawi, A.A.; Ahmad, Z.; Abd_Allah, E.F. Plant species and communities assessment in interaction with edaphic and topographic factors; an ecological study of the mount Eelum District Swat, Pakistan. Saudi J. Biol. Sci. 2017, 24, 778–786. [Google Scholar] [CrossRef]
  24. Zhang, J.T.; Xu, B.; Li, M. Vegetation patterns and species diversity along elevational and disturbance gradients in the Baihua Mountain Reserve, Beijing, China. Mt. Res. Dev. 2013, 33, 170–179. [Google Scholar] [CrossRef]
  25. Sharma, C.M.; Mishra, A.K.; Prakash, O.; Dimri, S.; Baluni, P. Assessment of forest structure and woody plant regeneration on ridge tops at upper Bhagirathi basin in Garhwal Himalaya. Trop. Plant Res. 2014, 1, 62–71. [Google Scholar]
  26. Tomar, P.K.; Thakur, S.; Pandey, R. Altitudinal variation in soil properties with reference to forest structure and composition in the Western Himalaya. Sci. Total Environ. 2024, 866, 161281. [Google Scholar]
  27. Rumpf, S.B.; Hülber, K.; Klonner, G.; Moser, D.; Schütz, M.; Wessely, J.; Willner, W.; Zimmermann, N.E.; Dullinger, S. Range dynamics of mountain plants decrease with elevation. Proc. Natl. Acad. Sci. USA 2018, 115, 1848–1853. [Google Scholar] [CrossRef]
  28. Coverdale, T.C.; Davies, A.B. Unravelling the relationship between plant diversity and vegetation structural complexity: A review and theoretical framework. J. Ecol. 2023, 111, 1378–1395. [Google Scholar] [CrossRef]
  29. Costa, F.V.D.; Viana-Júnior, A.B.; Aguilar, R.; Silveira, F.A.; Cornelissen, T.G. Biodiversity and elevation gradients: Insights on sampling biases across worldwide mountains. J. Biogeogr. 2023, 50, 1879–1889. [Google Scholar] [CrossRef]
  30. Dolezal, J.; Dvorsky, M.; Kopecky, M.; Liancourt, P.; Hiiesalu, I.; Macek, M.; Altman, J.; Chlumska, Z.; Rehakova, K.; Capkova, K.; et al. Vegetation dynamics at the upper elevational limit of vascular plants in Himalaya. Sci. Rep. 2016, 6, 24881. [Google Scholar] [CrossRef]
  31. Wambulwa, M.C.; Milne, R.; Wu, Z.Y.; Spicer, R.A.; Provan, J.; Luo, Y.H.; Zhu, G.; Wang, W.; Wang, H.; Gao, L.; et al. Spatiotemporal maintenance of flora in the Himalaya biodiversity hotspot: Current knowledge and future perspectives. Ecol. Evol. 2021, 11, 10794–10812. [Google Scholar] [CrossRef]
  32. Li, T.; Liang, J.; Chen, X.; Wang, H.; Zhang, S.; Pu, Y.; Xu, X.; Li, H.; Xu, J.; Wu, X.; et al. The interacting roles and relative importance of climate, topography, soil properties and mineralogical composition on soil potassium variations at a national scale in China. Catena 2021, 196, 104875. [Google Scholar] [CrossRef]
  33. Bisht, N.S.; Rawat, G.S.; Nautiyal, D.C. Influence of altitude and aspect on forest vegetation in the Indian Himalayas. Ecol. Indic. 2022, 139, 108891. [Google Scholar]
  34. Padalia, H.; Rai, I.D.; Pangtey, D.; Rana, K.; Khuroo, A.A.; Nandy, S.; Singh, G.; Sekar, K.C.; Sharma, N.; Uniyal, S.K.; et al. Fine-scale classification and mapping of subalpine-alpine vegetation and their environmental correlates in the Himalayan global biodiversity hotspot. Biodivers. Conserv. 2023, 32, 4387–4423. [Google Scholar] [CrossRef]
  35. McCain, C.M.; Grytnes, J.A. Elevational gradients in species richness. Encycl. Life Sci. 2010, 15, 1–10. [Google Scholar]
  36. Sharma, N.; Behera, M.D.; Das, A.P.; Panda, R.M. Plant richness pattern in an elevation gradient in the Eastern Himalaya. Biodivers. Conserv. 2019, 28, 2085–2104. [Google Scholar] [CrossRef]
  37. Gillman, L.N.; Wright, S.D. Species richness and evolutionary speed: The influence of temperature, water and area. J. Biogeogr. 2014, 41, 39–51. [Google Scholar] [CrossRef]
  38. Bilal, M. Biological Impacts of Climate Change on Ecosystem Functionality: An Ecological Perspective. Biol. Biotechnol. Commun. 2024, 1, 104–113. [Google Scholar]
  39. Sharma, C.M.; Mishra, A.K.; Tiwari, O.P.; Krishan, R.; Rana, Y.S. Effect of elevational gradients on forest structure and composition on ridge tops in Garhwal Himalaya. Energy Ecol. Environ. 2017, 2, 404–417. [Google Scholar] [CrossRef]
  40. Pandey, S.S.; Cockfield, G.; Maraseni, T.N. Dynamics of carbon and biodiversity under REDD+ regime: A case from Nepal. Environ. Sci. Policy 2014, 38, 272–281. [Google Scholar] [CrossRef]
  41. Joshi, R.; Pangeni, M.; Neupane, S.S.; Yadav, N.P. Regeneration Status and Carbon Accumulation Potential in Community Managed Sal (Shorea robusta) Forests of Far-Western Terai Region, Nepal. Eur. J. Ecol. 2021, 7, 26–39. [Google Scholar] [CrossRef]
  42. Joshi, R.; Shrestha, T.K.; Mishra, B.; Gautam, J.; Maharjan, B.; Gosai, K.R.; Maraseni, T.; Neupane, B. Assessment of Carbon Sequestration in Private Forests Across Two Different Physiographic Regions of Nepal: Implications for Conservation and Climate Change Mitigation. Scientifica 2023, 2023, 6599067. [Google Scholar] [CrossRef]
  43. Pandit, M.K.; Sodhi, N.S.; Koh, L.P.; Bhaskar, A.; Brook, B.W. Elevational gradients and the imperilment of biodiversity. Biol. Conserv. 2021, 261, 109266. [Google Scholar]
  44. Lelli, C.; Bruun, H.H.; Chiarucci, A.; Donati, D.; Frascaroli, F.; Fritz, Ö.; Goldberg, I.; Nascimbene, J.; Tøttrup, A.P.; Rahbek, C.; et al. Biodiversity response to forest structure and management: Comparing species richness, conservation relevant species and functional diversity as metrics in forest conservation. For. Ecol. Manag. 2019, 432, 707–717. [Google Scholar] [CrossRef]
  45. Löf, M.; Madsen, P.; Metslaid, M.; Witzell, J.; Jacobs, D.F. Restoring forests: Regeneration and ecosystem function for the future. New For. 2019, 50, 139–151. [Google Scholar] [CrossRef]
  46. Piponiot, C.; Anderson-Teixeira, K.J.; Davies, S.J.; Allen, D.; Bourg, N.A.; Burslem, D.F.; Cárdenas, D.; Chang-Yang, C.; Chuyong, G.; Cordell, S.; et al. Distribution of biomass dynamics in relation to tree size in forests across the world. New Phytol. 2022, 234, 1664–1677. [Google Scholar] [CrossRef] [PubMed]
  47. Joshi, R.; Singh, H.; Chettri, R.; Poudel, S.; Rijal, S. Carbon Sequestration Potential of Community Forests: A Comparative Analysis of Soil Organic Carbon Stock in Community Managed Forests of Far-Western Nepal. Eurasian J. Soil Sci. 2021, 10, 96–104. [Google Scholar] [CrossRef]
  48. Maharjan, S.K.; Koirala, M.; Sharma, L.N. Altitudinal variation in plant community composition and structure along different aspects in the central Himalayas, Nepal. Plant Ecol. 2022, 223, 997–1011. [Google Scholar]
  49. Rubenstein, M.A.; Weiskopf, S.R.; Bertrand, R.; Carter, S.L.; Comte, L.; Eaton, M.J.; Johnson, C.G.; Lenoir, J.; Lynch, A.J.; Miller, B.W.; et al. Climate change and the global redistribution of biodiversity: Substantial variation in empirical support for expected range shifts. Environ. Evid. 2023, 12, 7. [Google Scholar] [CrossRef]
  50. Aryal, S.; Shrestha, S.; Maraseni, T.; Wagle, P.C.; Gaire, N.P. Carbon stock and its relationships with tree diversity and density in community forests in Nepal. Int. For. Rev. 2018, 20, 263–273. [Google Scholar] [CrossRef]
  51. Pandey, H.P.; Maaren, I.E.; Shah, K.K.; Maraseni, T.N. Response of topographic and biodiversity variables on biomass and carbon density in community forests of himalayan foot-hills. J. For. Livelihood 2020, 19, 51–65. [Google Scholar]
  52. Joshi, R.; Singh, H.; Chhetri, R.; Yadav, R. Assessment of Carbon Sequestration Potential in Degraded and Non-Degraded Community Forests in Terai Region of Nepal. J. For. Environ. Sci. 2020, 36, 113–121. [Google Scholar]
  53. Joa, B.; Winkel, G.; Primmer, E. The unknown known—A review of local ecological knowledge in relation to forest biodiversity conservation. Land Use Policy 2018, 79, 520–530. [Google Scholar] [CrossRef]
  54. Khan, S.M.; Page, S.E.; Ahmad, H.; Harper, D.M. Sustainable utilization and conservation of plant biodiversity in montane ecosystems: The western Himalayas as a case study. Ann. Bot. 2013, 112, 479–501. [Google Scholar] [CrossRef]
  55. Lindenmayer, D.B.; Franklin, J.F.; Fischer, J. General management principles and a checklist of strategies to guide forest biodiversity conservation. Biol. Conserv. 2006, 131, 433–445. [Google Scholar] [CrossRef]
  56. Joshi, R.; Singh, H. Carbon Sequestration Potential of Disturbed and Non-disturbed Forest Ecosystem: A Tool for Mitigating Climate Change. Afr. J. Environ. Sci. Technol. 2020, 14, 385–393. [Google Scholar] [CrossRef]
  57. Aryal, S.; Baral, S.; Basnyat, B.; Timilsina, Y.P.; Gauli, K.; Maraseni, T. Synergy between Carbon and Biodiversity in Restored Forests: A case from leasehold forestry of Nepal. For. J. Inst. For. Nepal 2022, 19, 16–27. [Google Scholar] [CrossRef]
  58. Chytrý, M.; Otýpková, Z. Plot sizes used for phytosociological sampling of European vegetation. J. Veg. Sci. 2003, 14, 563–570. [Google Scholar] [CrossRef]
  59. Mueller-Dombois, D. Natural dieback in forests. BioScience 1987, 37, 575–583. [Google Scholar] [CrossRef]
  60. Pretzsch, H. Forest Dynamics, Growth, and Yield: From Measurement to Model; Springer: Berlin/Heidelberg, Germany, 2008; p. 39. [Google Scholar]
  61. Curtis, J.T.; Mcintosh, R.P. The interrelations of certain analytic and synthetic phytosociological characters. Ecology 1950, 31, 434–455. [Google Scholar] [CrossRef]
  62. Simpson, E.H. Measurment of Diversity. Nature 1949, 163, 688. [Google Scholar] [CrossRef]
  63. Pielou, E.C. An Introduction to Mathematical Ecology; Wiley: New York, NY, USA, 1969; p. 286. [Google Scholar]
  64. Moeslund, J.E.; Arge, L.; Bocher, P.K.; Dalgaard, T.; Svenning, J.C. Topography as a driver of local terrestrial vascular plant diversity patterns. Nord. J. Bot. 2013, 31, 129–144. [Google Scholar] [CrossRef]
  65. Adhikari, Y.P.; Fischer, A.; Fischer, H.S. Micro-site conditions of epiphytic orchids in a human impact gradient in Kathmandu valley, Nepal. J. Mt. Sci. 2012, 9, 331–342. [Google Scholar] [CrossRef]
  66. Pandey, K.P.; Adhikari, Y.P.; Weber, M. Structure, composition and diversity of forest along the elevational gradient in the Himalayas, Nepal. Appl. Ecol. Environ. Res. 2016, 14, 235–251. [Google Scholar] [CrossRef]
  67. Saxena, A.K.; Singh, J.S. A phytosociological analysis of woody species in forest communities of a part of Kumaun Himalaya. Vegetatio 1982, 50, 3–22. [Google Scholar] [CrossRef]
  68. Gairola, S.; Sharma, C.M.; Suyal, S.; Ghildiyal, S.K. Species composition and Diversity in Mid-elevational Moist Temperate Forests of the Western Himalaya. J. For. Sci. 2011, 27, 1–15. [Google Scholar]
  69. Shrestha, T.B. Ecology and Vegetation of North-West Nepal (Karnali Region); Royal Nepal Academy: Kathmandu, Nepal, 1982. [Google Scholar]
  70. Ahmed, M.; Husain, T.; Heikh, A.H.S.; Hussain, S.S.; Siddiqui, M. Phytosociology and structure of Himalayan forests from different climatic zones of Pakistan. Pak. J. Bot. 2006, 38, 361–383. [Google Scholar]
  71. Kunwar, R.M.; Sharma, S.P. Quantitative analysis of tree species in two community forests of Dolpa district, mid-west Nepal. Himal. J. Sci. 2004, 2, 23–28. [Google Scholar] [CrossRef]
  72. Pandey, P.K. Quantitative vegetation analysis as per aspect and altitude, and regeneration behaviour of tree species in Garhwal Himalayan forest. Ann. For. 2001, 9, 39–52. [Google Scholar]
  73. Maharjan, S.K.; Sterck, F.J.; Raes, N.; Poorter, L. Temperature and soils predict the distribution of plant species along the Himalayan elevational gradient. J. Trop. Ecol. 2022, 38, 58–70. [Google Scholar] [CrossRef]
  74. Coverdale, T.C.; Davies, S.J. Functional traits and forest structure mediate regeneration dynamics in tropical forests. J. Ecol. 2023, 111, 345–360. [Google Scholar]
  75. Rubenstein, J.M.; Chazdon, R.L.; Uriarte, M. Linking biodiversity conservation with carbon storage in tropical forest landscapes. Conserv. Biol. 2023, 37, e13957. [Google Scholar]
  76. Baldocchi, D.; Falge, E.; Gu, L.; Olson, R.; Hollinger, D.; Running, S.; Anthoni, P.; Bernhofer, C.; Davis, K.; Evans, R.; et al. FLUXNET: A new tool to study the temporal and spatial variability of ecosystem-scale carbon dioxide, water vapor, and energy flux densities. Bull. Am. Meteorol. Soc. 2002, 83, 2415–2434. [Google Scholar] [CrossRef]
Figure 1. Study area map showing the location of Dailekh district in Karnali Province, Nepal (top-left), the position of sample points within the district (bottom-left), and the detailed transect line with corresponding sampling points and elevation gradients (right).
Diversity 17 00588 g001
Figure 2. Graph illustrating the relationship between basal area and elevation.
Diversity 17 00588 g002
Figure 3. Distribution of stems per hectare (≥5 cm DBH) with elevation.
Diversity 17 00588 g003
Figure 4. Variation in mean heights along the elevation gradient.
Diversity 17 00588 g004
Figure 5. Comparison of (a) IVI, (b) Shannon diversity index, and (c) Pielou’s evenness across topographic aspects. Boxes show medians and interquartile ranges (IQR), whiskers extend to 1.5 × IQR. No significant differences were detected (Kruskal–Wallis: p > 0.05 for all indices).
Diversity 17 00588 g005aDiversity 17 00588 g005b
Figure 6. Scatterplot showing the relationship between elevation and Simpson diversity index.
Diversity 17 00588 g006
Figure 7. Scatterplot showing the relationship between elevation and Shannon diversity index.
Diversity 17 00588 g007
Figure 8. Scatterplot showing the relationship between elevation and Pielou’s evenness index.
Diversity 17 00588 g008
Table 1. Recorded tree species and their composition in different altitudinal zones of the study area, ranked by Importance Value Index (IVI).
RankSpeciesStem DensityBasal Area (m2/ha)FrequencyIVI
no./haRDn (%)BARBA (%)FRF (%)
Lower subalpine zone (3000–3200 m)
1Quercus semicarpifolia108.335.239,257.543.610025103.782
2Pinus wallichiana672228,265.131.41002578.0
3Tsuga dumosa581915,717.517.51002561.4
4Rhododendron campanulatum75246782.17.51002556.9
Upper temperate zone (2500–3000 m)
1Quercus semicarpifolia1203254,755.253.010017.9102.5
2Pinus wallichiana401115,171.414.76010.735.9
3Alnus nepalensis3597453.57.210017.934.3
4Rhododendron arboreum3085445.15.36010.723.9
5Ligustrum robustum3592335.22.3407.118.6
6Persea odoratissima1031893.51.8203.68.0
7Juglans regia51688.30.7203.65.6
8Castanopsis tribuloides1031651.21.6203.67.8
9Lyonia ovalifolia2571202.41.26010.718.5
10Rhododendron campanulatum5111,001.610.76010.722.7
11Tsuga dumosa65171627.31.6203.622.3
Lower temperate zone (2000–2500 m)
1Rhododendron arboreum1303014,566.229.810016.776.0
2Alnus nepalensis551313,120.226.88013.352.6
3Persea odoratissima3585926.912.1406.726.7
4Michelia champaca3071545.83.28013.323.3
5Quercus leucotichophora2052932.06.06010.020.5
6Juglans regia2563874.67.9203.316.9
7Ligustrum robustum409346.60.7406.716.5
8Castanopsis tribuloides2561828.83.7203.312.8
9Daphniphylum himalainsis307479.41.0203.311.1
10Lyonia ovalifolia153307.90.6406.710.7
11Garuga pinnata1531879.63.8203.310.6
12Premna longifolia Roxb.51962.92.0203.36.4
13Myrica esculenta51616.21.3203.35.7
14Falconeria insignis51447.60.9203.35.4
15Maduca longifolia5197.50.2203.34.7
Subtropical zone (1000–2000 m)
1Shorea robusta1933616,942.622.3508.266.5
2Alnus nepalensis631224,979.432.9609.854.4
3Maduca longifolia3575504.77.37011.525.3
4Pinus roxburghii4076389.48.4406.622.5
5Quercus acutissima2552077.62.7406.614.0
6Cedrella tooni1026391.78.4203.313.6
7Schima wallichi2552579.63.4304.913.0
8Diospyros malabarica255906.51.2406.612.4
9Myrica esculenta1531807.82.4406.611.7
10Pyrus pashia1831049.41.4406.611.2
11Rhododendron arboreum2341419.91.9304.911.0
12Ficus semicordata81691.10.9304.97.2
13Ligustrum robustum1021369.91.8203.37.0
14Lyonia ovalifolia102580.80.8101.64.3
15Persea odoratissima81576.10.8101.63.8
16Pogosteman benghalensis51782.51.0101.63.6
17Albizzia lebbeck51702.60.9101.63.5
18Falconeria insignis51422.50.6101.63.1
19Quercus leucotichophora51214.00.3101.62.9
20Ficus neriifolia30.47215.20.3101.62.4
21Prunus cerasoides30.47154.10.2101.62.3
22Bauhinia variegata30.4771.60.1101.62.2
23Castanopsis tribuloides30.4781.50.1101.62.2
Tropical zone (<1000 m)
1Shorea robusta3756721,592.784.710030.0182.2
2Dalbergia sisso81151594.76.36720.040.9
3Senegilia catechu56101127.14.46720.034.5
4Albizzia procera3871084.04.36720.031.0
5Maduca longifolia6197.50.43310.011.5
Table 2. Distribution of tree diameter classes (DBH in cm) across elevational gradients (600–3200 m) in Dailekh district, Nepal. Values represent the number of individuals per 20 × 20 m plot.
Sample Plot No.Elevation (m)DBH Classes (cm)
5–<1010–29.9≥30
16000182
27003191
38004139
49006133
510006116
611001137
712009190
8130015170
914006180
1015004103
111600784
1217000125
1318001115
141900673
1520002131
162100192
172200467
182300464
19240011513
202500398
212600037
2227000314
2328000313
2429000013
2530000013
2631000013
2732000011
Disclaimer/Publisher’s Note: The statements, opinions and data contained in all publications are solely those of the individual author(s) and contributor(s) and not of MDPI and/or the editor(s). MDPI and/or the editor(s) disclaim responsibility for any injury to people or property resulting from any ideas, methods, instructions or products referred to in the content.