Article

Genetic Evidence Reveals Unexpected Diversity and Genetic Exchange Between White-Fringed Weevils (Coleoptera, Curculionidae)

by
Noelia V. Guzman
1,*,†,
Marcela S. Rodriguero
1,2,*,†,
Viviana A. Confalonieri
1,2 and
Analia A. Lanteri
3
1
Instituto de Ecología, Genética y Evolución de Buenos Aires (IEGEBA) (UBA-CONICET), Intendente Güiraldes y Costanera Norte s/n, 4º Piso, Pabellón II, Ciudad Autónoma de Buenos Aires C1428EHA, Argentina
2
Departamento de Ecología, Genética y Evolución, Facultad de Ciencias Exactas y Naturales, Universidad de Buenos Aires, Intendente Güiraldes y Costanera Norte s/n, 4º Piso, Pabellón II, Ciudad Autónoma de Buenos Aires C1428EHA, Argentina
3
División Entomología, Museo de la Plata, Facultad de Ciencias Naturales y Museo, Universidad Nacional de La Plata, Paseo del Bosque s/n, La Plata B1900FWA, Argentina
*
Authors to whom correspondence should be addressed.
These authors contributed equally to this work.
Diversity 2025, 17(8), 561; https://doi.org/10.3390/d17080561 (registering DOI)
Submission received: 30 May 2025 / Revised: 7 August 2025 / Accepted: 8 August 2025 / Published: 10 August 2025
(This article belongs to the Section Animal Diversity)

Abstract

The closely related Naupactini species Naupactus leucoloma, Naupactus peregrinus, and Naupactus minor—collectively known as “white-fringed weevils”—form a monophyletic group within the N. leucoloma species group. Mostly parthenogenetic, a few sexually reproducing populations of both N. leucoloma and N. peregrinus occur in their native ranges (Argentinian Mesopotamian region), where they overlap. In 2013, after several decades during which only females had been recorded, a few males potentially belonging to these species were discovered. To clarify their taxonomic identity and understand the group’s evolutionary dynamics, we analyzed their mitochondrial and nuclear genetic markers to assess their genetic variation distribution and infer their phylogenetic relationships. Molecular phylogenetic analyses revealed that these males constitute an independently evolving lineage, whereas morphological comparisons produced inconclusive results. Statistical tests confirmed introgression between these unidentified males and N. leucoloma. These findings uncover unexpected levels of genetic divergence within this group of Neotropical weevils.

1. Introduction

White-fringed beetles are broad-nosed weevils of the genus Naupactus Dejean (Curculionidae: Entiminae: Naupactini), recognized by a distinct fringe of white scales along the sides of the body, extending from the head to the apex of the elytra [1]. They are native to South America (Argentina, southern Brazil, Paraguay, and Uruguay) and include invasive species found in several countries around the world such as the USA, Australia, New Zealand, South Africa, Azores Islands (Portugal), Chile (including Eastern Islands), and Perú [2].
International interest in white-fringed weevils began with the occasional introduction of Naupactus leucoloma Boheman into Florida during the summer of 1936, followed by its rapid spread throughout the United States, where it caused damage to several crops [3,4]. More than a century after its original description by Boheman (1840) [5], L.L. Buchanan, a specialist at the United States Department of Agriculture (USDA), conducted a taxonomic study of the species and transferred it to Pantomorus Schoenherr, subgenus Graphognathus Buchanan, based on the presence of vestigial hind wings and, consequently, flightlessness—a characteristic used at the time to distinguish Naupactus from Pantomorus. Later, he described other species of white-fringed weevils introduced into the USA, such as Naupactus peregrinus Buchanan, Naupactus minor Buchanan, and a series of races belonging to the so-called N. leucoloma complex, mainly differentiated from one another by characteristics of the integument and vestiture [5,6,7].
White-fringed weevils were considered parthenogenetic due to the absence of males in large samples collected worldwide and preserved in various entomological collections, similar to other South American Naupactini that became invasive [8,9,10]. However, in his redescription of N. leucoloma, Hustache (1947: 104) [1] reported the presence of males from Argentina, although without specific locality data or detailed morphological descriptions.
Lanteri and Marvaldi [1] established the synonymy of Naupactus and Graphognathus, described the so-called N. leucoloma species group, and redescribed the three known species of white-fringed weevils—N. leucoloma, N. peregrinus, and N. minor. They also included in this group two additional species native to Argentina, Naupactus tucumanensis Hustache and Naupactus albolateralis Hustache, both characterized by fully developed hind wings and presumed to reproduce sexually. Moreover, they described and illustrated males of N. leucoloma and N. peregrinus, providing outline drawings of the genitalia. These few males were collected in Paraná, Entre Ríos Province (both species), and in Caacupé, Paraguay (only N. peregrinus). Phylogenetic analyses reaffirmed the synonymy of Naupactus and Graphognathus, and suggested that Naupactus verecundus Hustache, 1947 might also belong to the “leucoloma group” [11]. However, this hypothesis was dismissed by a subsequent, more species-rich analysis [12]. This work also revealed that N. minor and N. peregrinus are more closely related to each other than to any other species, within the N. leucoloma species group [12].
The study of parthenogenetic Naupactini in South America, their closest sexual relatives, the genetic variability in both native and introduced ranges, their invasive potential, and the origin of parthenogenesis is among the main objectives of our research program. The most significant contributions on white-fringed weevils published to date include the following: the analysis of the association between thelytokous parthenogenesis and Wolbachia infection status [13]; the evaluation of haplotype diversity in N. leucoloma in comparison with another South American Naupactus species with sexual reproduction [9]; the phylogenetic relationships of white-fringed weevils with other Naupactus species [12]; and the effects of reproductive system and the ability to respond to physiologically demanding host plants on invasiveness [14,15]. Long-term fieldwork spanning a large area, which made these results possible, led to the striking discovery of a few white-fringed weevil males after several decades of finding only females. These specimens were collected near the Paraná River Delta and resembled all the parthenogenetic species in the group, without exhibiting clear diagnostic characteristics of any particular one. Accordingly, to clarify whether these males correspond to one of the already described species or constitute an independently evolving lineage within the N. leucoloma species group, additional analyses integrating morphological and molecular data are needed. To this end, we conducted a phylogenetic inference and species delimitation study using multiple datasets—including mitochondrial and nuclear DNA sequences, as well as genome-wide SNPs—and analyzed the distribution of genetic variation and interspecific gene flow among these entities.

2. Materials and Methods

2.1. Sample Collection

Thirty-nine specimens of “white-fringed weevils” were obtained from multiple localities in Argentina, mainly the Mesopotamia (delimited by Paraná, Paraguay, and Uruguay rivers) and the Pampa regions, as well as from other countries over a span of several years (Table 1 and Figure S1). The dataset includes specimens previously analyzed in Guzmán et al. [9] and del Río et al. [12] and newly collected individuals. Specimens of N. tucumanensis were used as outgroups.
Three male individuals attracted particular attention, as their external morphology was compatible with any of the three parthenogenetic species of the N. leucoloma group, which typically reproduce without males (hereafter, “Undetermined Males”, UM). They come from Entre Ríos province, localities of Diamante and Victoria, close to Paraná, where the male of N. leucoloma and N. peregrinus studied by Lanteri and Marvaldi [1] were collected (Figure S1). All the specimens were preserved in absolute ethanol and stored at –20 °C until DNA extraction.

2.2. Amplification and Sequencing of Mitochondrial and Nuclear Markers

Sequences of the mitochondrial cytochrome c oxidase subunit 1 (COI) gene for N. leucoloma, N. peregrinus, N. minor, and N. tucumanensis were retrieved from GenBank (Table 1). New COI sequences were generated for N. leucoloma and N. minor females—mainly from the province of Entre Ríos—as well as for the UM specimens.
For N. leucoloma, N. minor and the UM, we also amplified sequences of the nuclear ribosomal DNA internal transcribed spacer 1 (ITS1).
Whole-genomic DNA was extracted using a lysis buffer containing Proteinase K, following the protocol described by Sunnucks and Hales [16]. Individuals preserved in absolute ethanol were air-dried before extraction. DNA quantity and quality were assessed using a NanoDrop 2000 spectrophotometer (Thermo, Rockford, IL, USA) and visualized on 1% agarose gels stained with GelRed 0.1% (Biotium, Hayward, CA, USA). For SNP genotyping, all samples were quantified using Qubit dsDNA HS Assay Kit (Invitrogen, Carlsbad, CA, USA), with assays read on a Qubit-version 2.0 (Invitrogen, Carlsbad, CA, USA).
The COI and ITS1 regions were both amplified using primers previously tested in other Naupactini species [9,17]. COI primer sequence were S1718 5′-GGA GGA TTT GGA AAT TGA TTA GTT CC-3′ and A2442 5′-GCT AAT CAT CTA AAA ATT TTA ATT CCT GTT GG-3′ [18], and ITS1 primer sequences were rDNA2 (5′-TTG ATT ACG TCC CTG CCC TTT-3′) [19] and rDNA 1.58S (5′-ACG AGC CGA GTG ATC CAC CG-3′) [20].
PCR reactions were performed in a final volume of 50 µL containing 50–100 ng of template DNA, 100 ng of each primer (Invitrogen, Carlsbad, CA, USA), 0.1 mM of each dNTP (GenBiotech, Buenos Aires, Argentina), 3 mM MgCl2, 1 U of Taq DNA polymerase, and 1X reaction buffer (Invitrogen, Carlsbad, CA, USA). Amplifications were carried out following the protocol described in Guzman et al. [9] for COI and Rodriguero et al. [17] for ITS1.
PCR products were visualized on 1.4% agarose gels and purified using ExoFastAP enzymes (Thermo, Rockford, IL, USA). Bidirectional sequencing was performed using a 3130-XL Automatic Sequencer (Applied Biosystems Inc., Gaithersburg, MD, USA) in Sequencing and Genotyping Service of Faculty of Exact and Natural Sciences, University of Buenos Aires (Buenos Aires, Argentina). Sequences were deposited in GenBank under accession numbers provided in Table 1. Chromatograms were inspected, trimmed, and aligned using Bioedit [21] with manual verification of ambiguous sites.

2.3. ddRAD-Seq Library Preparation and SNP Genotyping

Double-digest RAD sequencing (ddRAD-seq) [22] was used to assess genome-wide variation among selected individuals of the four species, including the UM, since it is one of the most cost-effective methods for organisms without a reference genome. Library preparation was performed at the Genomic and Bioinformatics Unit, INTA, Argentina. Prior to full-scale library construction, a preliminary digestion test was conducted to evaluate several restriction enzyme pairs. Based on fragment distribution and yield, the enzyme combination EcoRI and MspI was selected for optimal digestion in this group of weevils.
Genomic DNA was digested with EcoRI and MspI, and size-selected fragments between 300 and 500 bp were isolated. Adapter ligation, barcoding, and library amplification were carried out following the protocol of Peterson et al. [22], with minor modifications. Paired-end (2 × 125 bp) sequencing was performed on a Novaseq 6000 (Illumina, San Diego, CA, USA).
Raw reads were demultiplexed and quality-filtered, and loci were assembled de novo using the ustacks, cstacks, and sstacks modules through the denovo_map.pl pipeline from Stacks v2.6 following the protocols of Catchen et al. [23] and Catchen et al. [24] (available at NCBI as BioProject PRJNA1264493). The parameters were set as follows: M = 5 and n = 5, according to the protocol proposed by Rivera-Colon and Catchen [25]. The pipeline was executed including the --paired and --force-diff-len options to accommodate paired-end read structure and minor differences in read lengths, respectively, ensuring optimal recovery of loci across samples.
A mean of 2.06 million raw reads was obtained per sample, and we finally genotyped 3513 loci with a coverage of 10.5x after applying population constraints.
SNP calling and filtering were performed using the populations module in Stacks. The filtering criteria included a minor allele frequency threshold of --min-maf 0.03, and a minimum sample proportion per population of --min-samples-per-pop 0.70, which specifies that at least 70% of the samples within each population must be present for that population to be included in the analysis, retaining one SNP per locus (ddRADseq_0 dataset). A total of 2868 SNPs were initially retained after applying the filters --geno 0.3 and the exclusion of the individuals LC1 and Cn1 for excessive missingness (ddRADseq_1 dataset, available in Figshare: 10.6084/m9.figshare.29156063). To study the genetic structure of this sample, we excluded the outgroup N. tucumanensis, retrieving a total of 2107 SNPs (ddRADseq_2 dataset, available in Figshare: 10.6084/m9.figshare.29156063). Finally, the ddRADseq_1 dataset was filtered to exclude loci with excessively high heterozygosity using filterhetero.py, thereby reducing the inclusion of potential paralogous loci. This filtering step yielded 2729 SNPs (ddRADseq_3 dataset, available in Figshare: 10.6084/m9.figshare.29156063), and were used for phylogenetic inference.

2.4. Phylogenetic Reconstruction Based on Mitochondrial, Nuclear, and Genomic Data

Phylogenetic relationships based on mitochondrial (COI) and nuclear (ITS1) sequences were inferred using MrBayes v. 3.2.7 [26]. Sequences were aligned and visually inspected for accuracy using the program ClustalO [27] and adjusted manually. The number of COI haplotypes and ITS1 alleles and the number of polymorphic sites for each dataset were determined with DnaSP v. 6 [28]. The best-fit nucleotide substitution models for each marker were GTR + I (COI) and HKY + G (ITS1), which were estimated using JModelTest v 2.0 [29] as implemented in Phylemon v. 2.0 [30], based on the Akaike Information Criterion (AIC). Bayesian analysis was performed implementing the ‘Metropolis-coupled Markov Chain Monte Carlo’ (MCMCMC) algorithm. Two independent analyses using four chains, one cold and three incrementally heated, were run using a random starting tree over 500,000 generations sampling every 50 generations. The average standard deviation of split frequencies stabilized to a difference of <1%, and the software Tracer v1.6 [31] was used to assess convergence of the cold chain. The initial 125,000 generations from each run were discarded as burn-in. Tree parameters and topology were visualized with FigTree v. 1.4.4 (http://tree.bio.ed.ac.uk/software/figtree/, accessed on 1 December 2024).
To reconstruct evolutionary relationships based on genome-wide SNP data, a Maximum Likelihood (ML) phylogenetic tree was inferred using RAxML v8.2.12 [32]. The GTR +G substitution model was applied along with the Lewis ascertainment bias correction, appropriate for SNP-only data. Node supports were evaluated with 1000 rapid bootstrap replicates.
Finally, a total evidence analysis was performed using a concatenated matrix that included the mitochondrial COI gene and the genome-wide SNP dataset ddRADseq_3. Phylogenetic inference was conducted with RAxML v8.2.12 [32] under the JC69 substitution model. Node supports were assessed as before. Resulting trees were visualized and annotated using FigTree v1.4.4 (http://tree.bio.ed.ac.uk/software/figtree/, accessed on 1 December 2024).

2.5. Network and Genetic Structure Analyses

To further explore potential reticulate evolutionary patterns, a phylogenetic network was constructed using SplitsTree v4.17.1 [33]. The network was inferred from the ddRADseq_2 SNP dataset through the neighbor-net algorithm based on uncorrected p-distances. This method allows for the visualization of conflicting phylogenetic signals, which can reflect historical hybridization or incomplete lineage sorting (ILS).
To visualize the genetic structure across the three parthenogenetic species of the N. leucoloma species group and to determine the placement of the UM in relation to the known species, a Principal Component Analysis (PCA) was conducted using the ddRADseq_2 dataset. The analysis was performed in the R statistical environment v.4.1.0 [34] through RStudio v1.0.153 [35] using the ‘glPca’ function (library: adegenet) [36], after converting the VCF file to a genlight object via the vcfR [37] and adegenet pipelines. The first two principal components (PCs) were plotted with the packages ggplot2 [38].
Additionally, pairwise genetic distances between species were calculated for both mtDNA and nDNA (SNPs). Mitochondrial DNA distances were estimated using MEGA-X [39] on the basis of the uncorrected p-distance method (i.e., proportion of nucleotide sites at which two sequences being compared are different). Genetic distances based on SNPs were calculated through the Jost’s D algorithm DST [40], which is suitable for clonal organisms since it does not depend on expected heterozygosity [41]. Due to its small sample size, the N. peregrinus sample was excluded from this analysis. For comparative purposes, we retrieved COI sequences from both parthenogenetic (GenBank accession nos. MH844637–MH844645) and sexual (GenBank accession nos. MH844646–MH844653) lineages of Pantomorus postfasciatus Hustache [42], and estimated uncorrected p-distances as described above.
To assess the possibility of historical introgression or gene flow, we performed the ABBA-BABA test (Patterson’s D-statistic) [43] using Dsuite, modules Dtrios [44]. The taxa N. minor, N. leucoloma, and UM were tested as possible P1, P2, and P3 combinations, with N. tucumanensis designated as the outgroup (P4).
In a four-taxon pectinate tree of the form [(((P1, P2), P3), P4)], where A and B represent ancestral and derived alleles, respectively, the P3 lineage is expected to share derived alleles with P1 (BABA) or P2 (ABBA) in equal proportions under a scenario without gene flow. A significant excess of either BABA or ABBA patterns is interpreted as evidence of the historical admixture between lineages (D ≠ 0). If there is only ILS, the ABBA and BABA patterns should occur with equal frequency (D = 0). Statistical significance was evaluated using 1000 bootstrap replicates per test, and a Z-score was calculated to quantify the number of standard deviations by which the D-statistic deviates from zero.
To explore hybridization patterns within the N. leucoloma species group, we utilized the R packages triangulaR [45], vcfR [37], and ggplot2 [38] to create triangular plots based on hybrid index values and interclass heterozygosity. This methodology allows for the detection and quantification of admixture between two parental lineages using SNPs that exhibit high allele frequency divergence. The analysis was based on a filtered VCF file derived from the ddRAD-seq1 dataset. Triangular plots were generated under two alternative parental configurations: (i) N. minor (NM) and N. leucoloma (NL) as the putative parents; (ii) UM and N. minor (NM) as the parental groups; and (iii) UM and N. leucoloma (NL) as the potential parentals.
To identify species-informative loci, we applied the alleleFreqDiff() function from the triangulaR package, retaining SNPs with allele frequency differences of at least 0.8 between the chosen parental populations. These highly differentiated markers were used to calculate both the hybrid index (based on allele composition) and interclass heterozygosity (reflecting heterozygous genotypes with alleles from different parental sources). All individuals were plotted within the triangular coordinate space defined by these two parameters, enabling assignment to potential hybrid categories.
Because some species are currently parthenogenetic, the interpretation of hybrid categories was approached with caution. Additionally, we ensured that missing data did not introduce bias into clustering patterns by removing loci with high levels of missingness.

2.6. Species Delimitation Analysis

To assess the number of independently evolving lineages within the three parthenogenetic species of the N. leucoloma group, we implemented a species delimitation analysis using SNAPPER, a coalescent-based method designed for unlinked biallelic markers, as implemented in BEAST2 [46]. The ddRADseq_2 dataset including representative individuals from each species—N. leucoloma, N. peregrinus, N. minor, and the UM—was used. Through SNAPPER analysis, missing data were filtered, resulting in a matrix of 558 SNPs.
Chains were sampled every 1000 iterations, run for 2 million iterations, and stopped after confirming with Tracer v.1.7 [31] that they had reached long-term stationarity and large effective sample sizes (ESSs) of parameters (>200). In particular, we used a gamma prior for the snapper coalescent rate (λ) with shape α = 0.01 and scale β = 100.1. The Yule birth rate prior was specified as a LogNormal distribution with M = 1.0 and S = 1.25. We conducted an evaluation of three scenarios for species delimitation, as follows: model 1 assumed that UM form a separated species in the N. leucoloma group; model 2 assigned males as conspecific to N. minor; and model 3 considered males as conspecific to N. leucoloma.
We compared their fit using marginal likelihood estimation (MLE) through path sampling [47]. Each path sampling analysis included 48 steps with a chain length of 100,000 generations per step and a burn-in of 10%, following convergence diagnostics from preliminary runs. Briefly, this approach consists of reconstructing phylogenies with different predefined species and sample assignments, ranking them by MLE. This ranking is supported through Bayes factor (BF) [48], by multiplying by two the difference of MLE between two models (BF = 2 × (|model 1| − |model 2|)). The strength of the support from BF comparison of competing models was evaluated using the framework of Kass and Raftery [49]. The BF scale is as follows: 0 < ln(BF) < 1 is not worth more than a bare mention; 1 < ln(BF) < 3 is positive evidence; 3 < ln(BF) < 5 is strong support; and ln(BF) > 5 is decisive. This framework allowed us to evaluate the hypothesis of a distinct evolutionary lineage for the newly discovered males.

2.7. Morphological Evaluation

Morphological identification of the species was carried out using diagnostic traits described in previous taxonomic treatments of the group [1,7], including both male and female genitalia. Specimens were examined under a Nikon SMZ1000 stereomicroscope (Tokyo, Japan). Females of the four species examined were compared with the type specimens, and the UM were compared with the males of N. leucoloma studied by Lanteri and Marvaldi [1] preserved in the collection of the Museo de La Plata, Argentina. Specimens of N. peregrinus were not available, as they had been returned to Charles W. O’Brien’s collection at Arizona State University, Tempe, Arizona.
Photographs were taken using a Micrometrics 391CU 3.2 MP digital camera (Shangai, China) attached to a Nikon SMZ1000 stereomicroscope for specimens over 10 mm in length (N. leucoloma), and a JVC KY-F75U camera (JVC, Yokohama, Japan) attached to a Leica MZ16F stereomicroscope (Leica Microsystems GmbH, Wetzlar, Germany) for specimens under 10 mm (N. peregrinus and N. minor).

3. Results

3.1. Phylogenetic Reconstruction Based on Mitochondrial, Nuclear, and Genomic Data

The COI dataset was 591 bp in length and included 98 segregating sites. We identified twelve haplotypes: two haplotypes in N. leucoloma females (n = 18), four in N. minor females (n = 12), four in UM (n = 4), one in N. peregrinus (n = 1), and one in N. tucumanensis (n = 1).
ITS1 sequences were 913 bp in length and showed 35 segregating sites in some of the specimens under study. In others, we observed superimposed peaks in the electropherograms across almost the entire DNA sequence (recorded as NA in Table 1), which may indicate either hybridization (e.g., [50]) or heterozygosity (e.g., [42]). We reported two alleles for N. leucoloma females (n = 7), one allele for N. minor females (n = 1), two alleles for UM (n = 3), and two alleles for N. tucumanensis (n = 2).
Bayesian inference based on the COI dataset recovered four well-supported clades (Figure 1A). The UM formed a sister clade to the three parthenogenetic species. Within this cluster, N. leucoloma is the sister to the species pair N. minor–N. peregrinus, the latter represented by a single specimen. This relationship is consistent with that recovered by del Río et al. [12]. Females sampled at the same sites as UM were assigned, based on both morphological and molecular analyses, to either N. leucoloma or N. minor.
The phylogenetic hypothesis retrieved from the ITS1 dataset shows that the group including the UM is the sister to the species pair N. leucoloma–N. minor (Figure 1B).
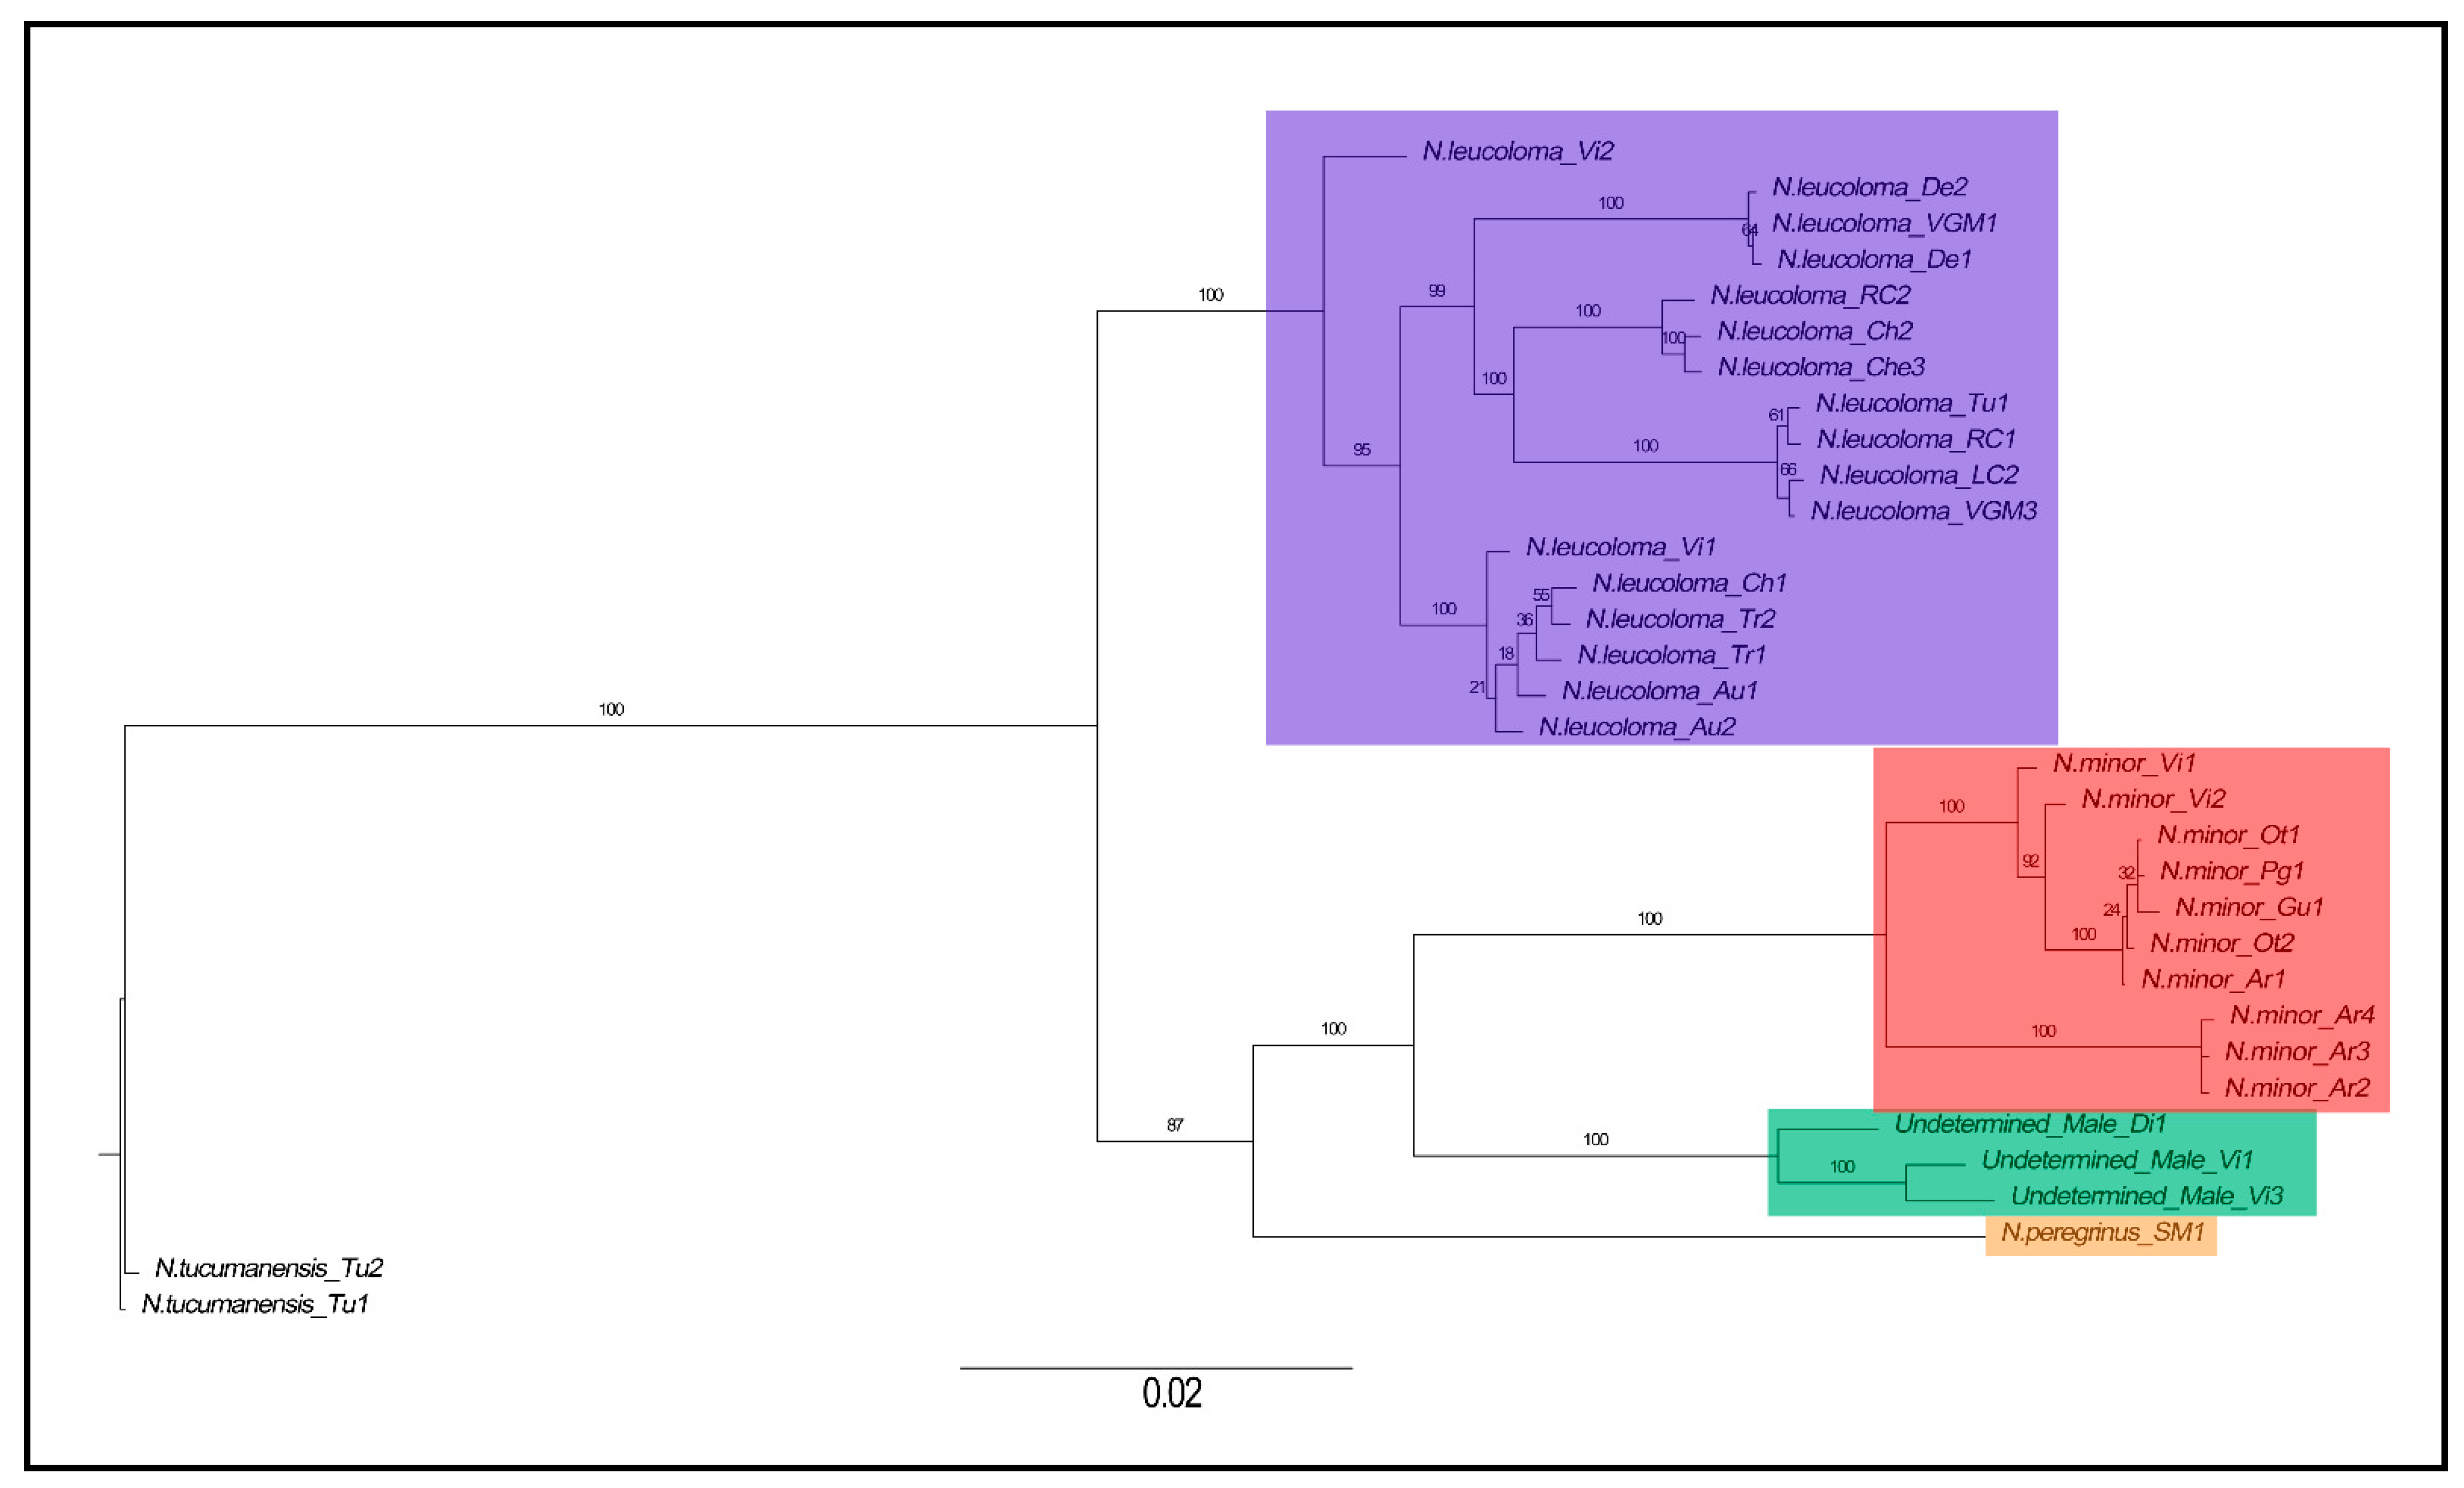
The SNP dataset yielded a different tree (Figure 2), in which the UM clustered with N. minor females with high support. The branching sequence was as follows: (N. leucoloma (N. peregrinus (UM, N. minor))). The tree obtained from the combined dataset (mtDNA + SNPs) was identical to that recovered from the SNP dataset alone (Figure S2).

3.2. Network and Genetic Structure Analyses

The PCA based on the SNP dataset placed N. peregrinus and the UM in an intermediate position between females of N. leucoloma and N. minor, showing no overlapping among the four groups (Figure 3A). The first two principal components accounted for 55.38% of the total variation. The neighbor-net network obtained from the same dataset also showed the UM in an intermediate position between N. leucoloma and N. minor females, with high levels of reticulation along the branches connecting the UM to each parthenogenetic species (Figure 3B), which might indicate putative outcrossing events between the taxonomic units included in this analysis (either introgression or hybridization), ILS, recombination, or homoplasy.
Estimates of the genetic distances showed similar trends between the COI and SNPs datasets (Figure 3C). The highest values of both the p-distance and DST were observed between N. leucoloma and N. minor. In contrast, the UM were not markedly different from either group of females. However, DST indicated a higher differentiation from N. minor females, whereas p-distances were fairly similar between the UM and both parthenogenetic species (Figure 3C).
The genetic distance between unisexual and sexual lineages of the same nominal species P. postfasciatus was p = 0.044. This value was clearly exceeded by that estimated between UM and any parthenogenetic species of the N. leucoloma species group.
The ABBA-BABA test indicated significant gene flow between N. leucoloma and UM (D = 0.53, Z = 4.58, p = 4.66 × 10⁻⁶), which would indicate signs of introgression between the two lineages, rather than ILS.
The triangle plot analysis revealed no hybridization in any of the parental configurations analyzed. Either with UM as parental or offspring, the potential hybrid descendants fell in intermediate positions but displayed low interclass heterozygosity, suggesting the presence of backcrosses or individuals with ancient introgression rather than recent F1 hybrids (Figure S3A–F).

3.3. Species Delimitation Analysis

Species delimitation models were compared using Bayes Factor Delimitation (Table 2). We found decisive support for the model that recognizes the UM as an independently evolving evolutionary lineage, i.e., as a separate species from both N. leucoloma and N. minor (2logeBF = –5559.735).
Based on all the molecular analyses presented above, we suggest that the UM would be closer to N. minor than to any other species of the group under study, although with a genetic distance that exceeds that one between the unisexual and sexual lineages of other Naupactini species, e.g., P. postfasciatus.

3.4. Morphological Evaluation

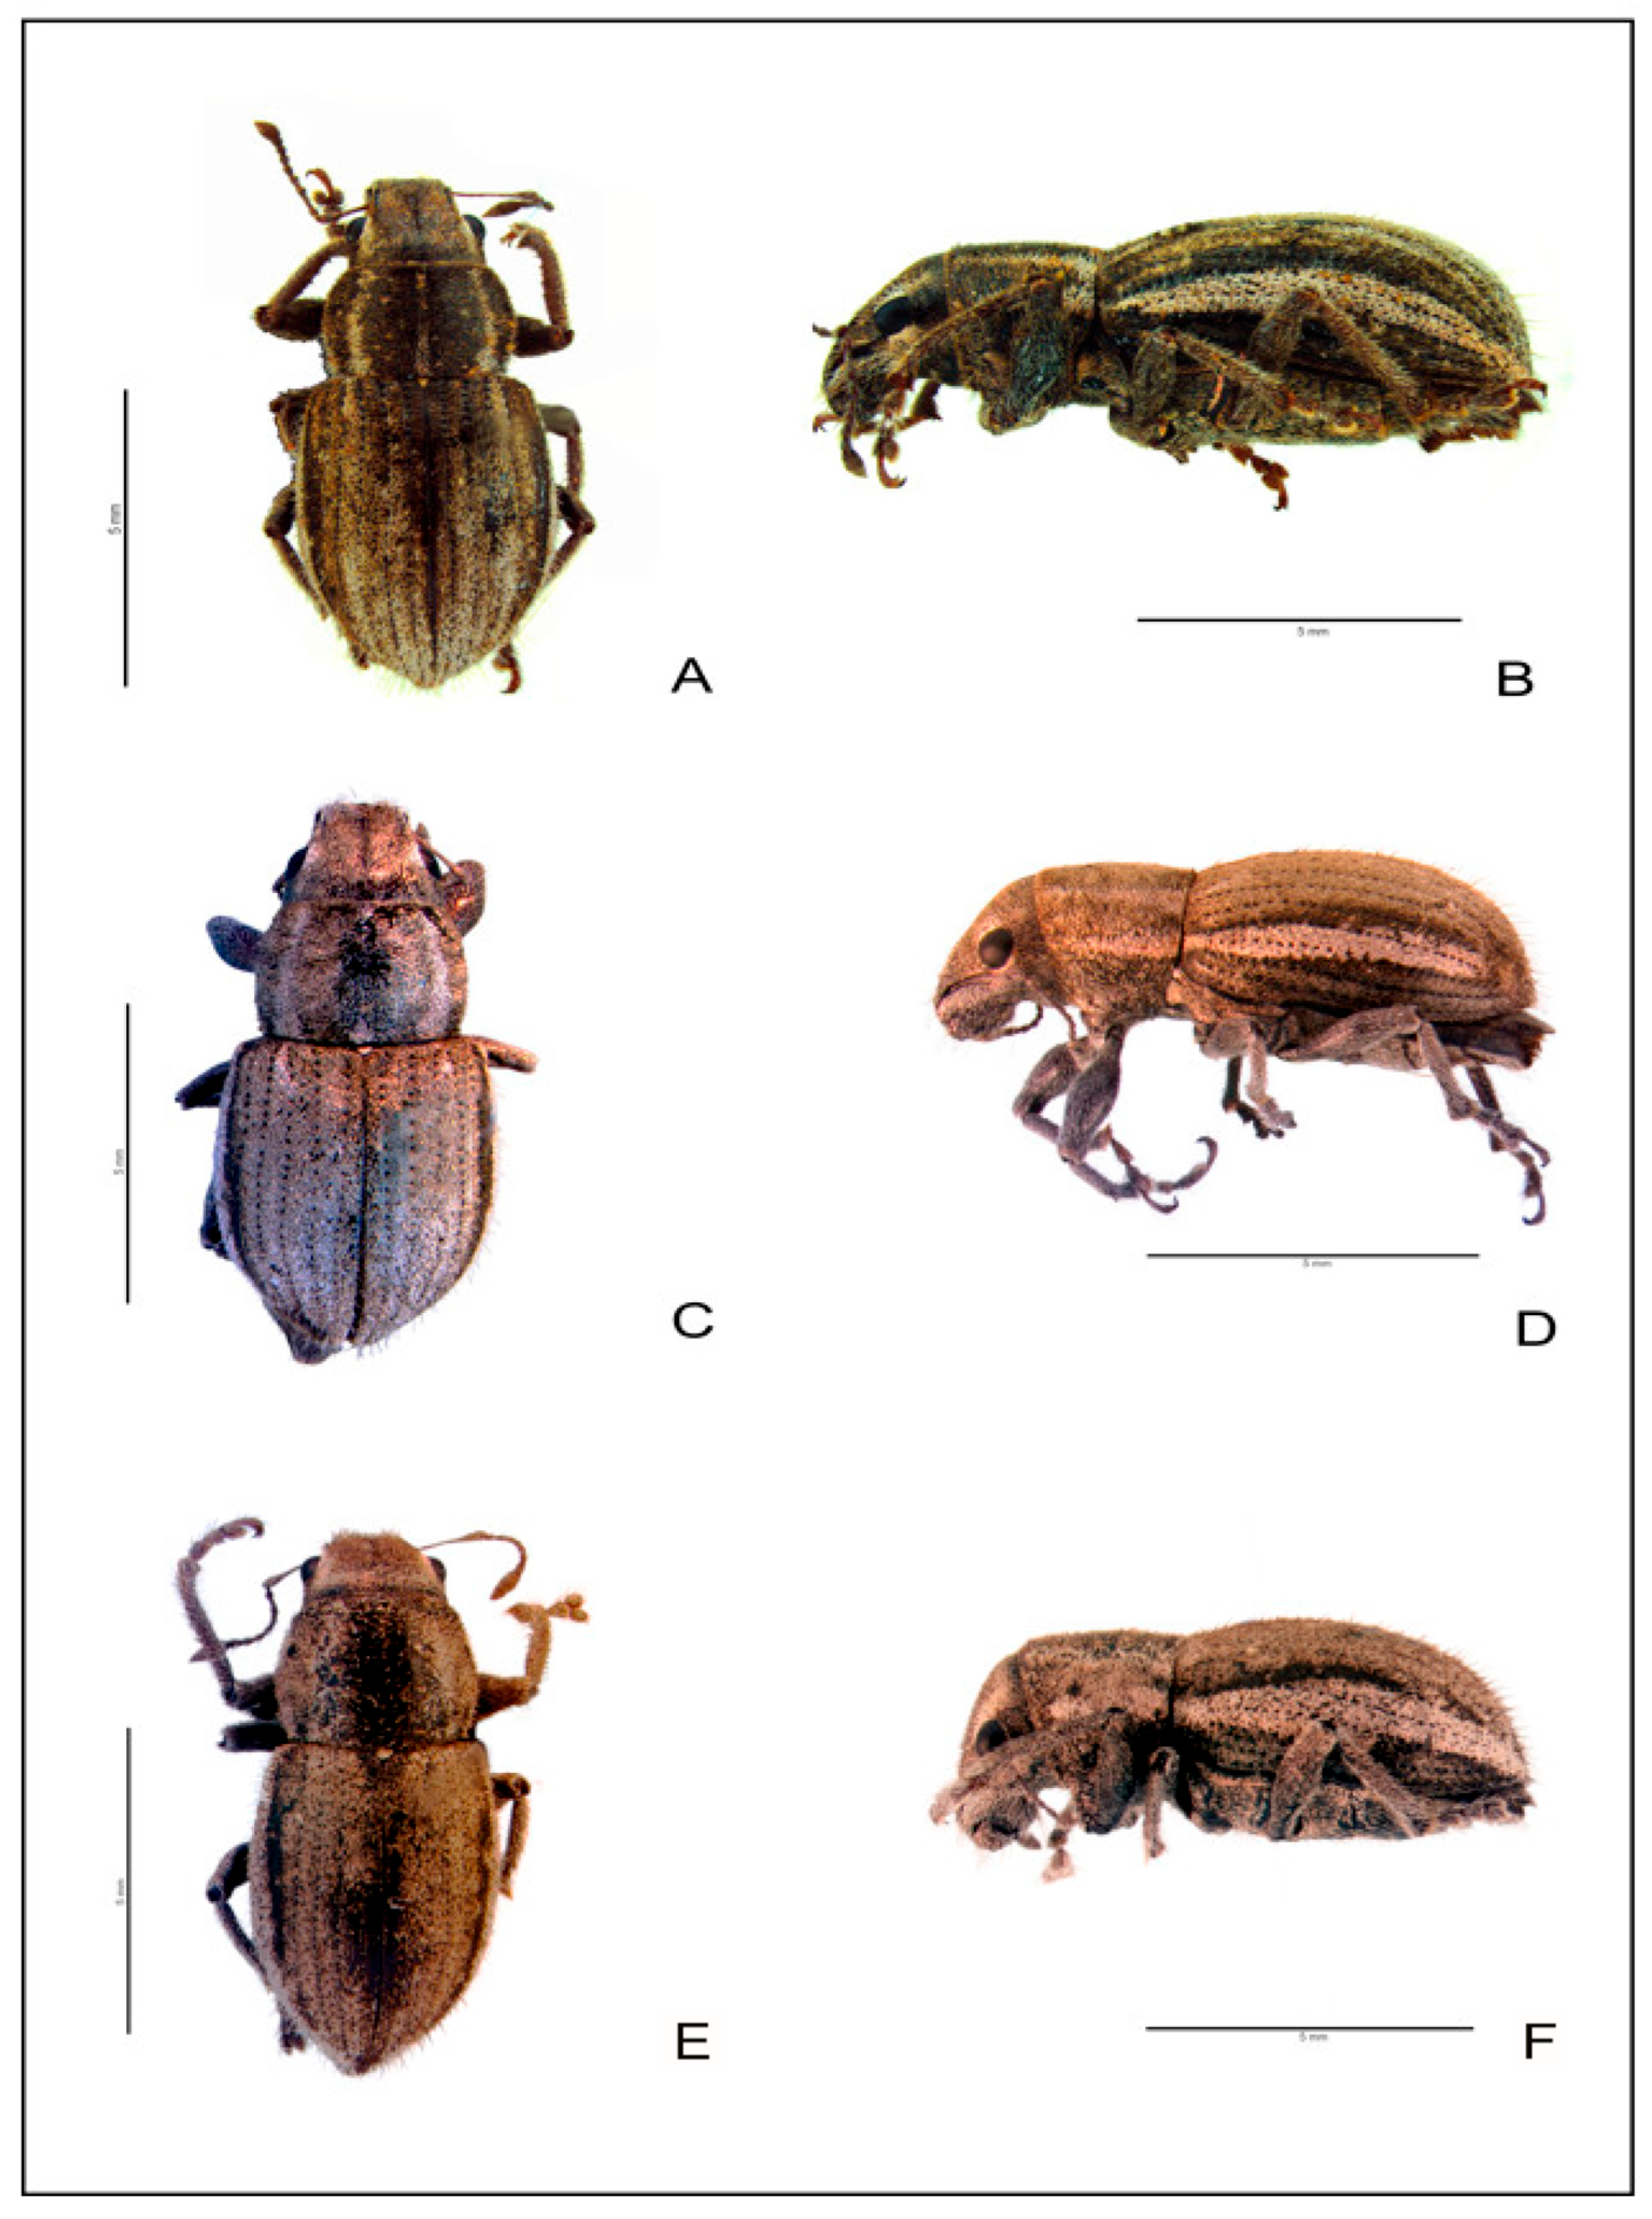
Naupactus leucoloma (Figure 4A,B), N. minor (Figure 4C,D), and N. peregrinus (Figure 4E,F) can be distinguished by slight differences, mainly in the integument and vestiture, some of which may be variable, especially in N. leucoloma. The most similar species are N. leucoloma and N. minor, the latter usually being smaller (less than 10 mm in length). The most diagnostic characters used to distinguish between them involve the convexity of the eyes, the median groove of the rostrum, the orientation of the setae on the rostrum and pronotum, and the development of the corbel at the apex of the metatibia.
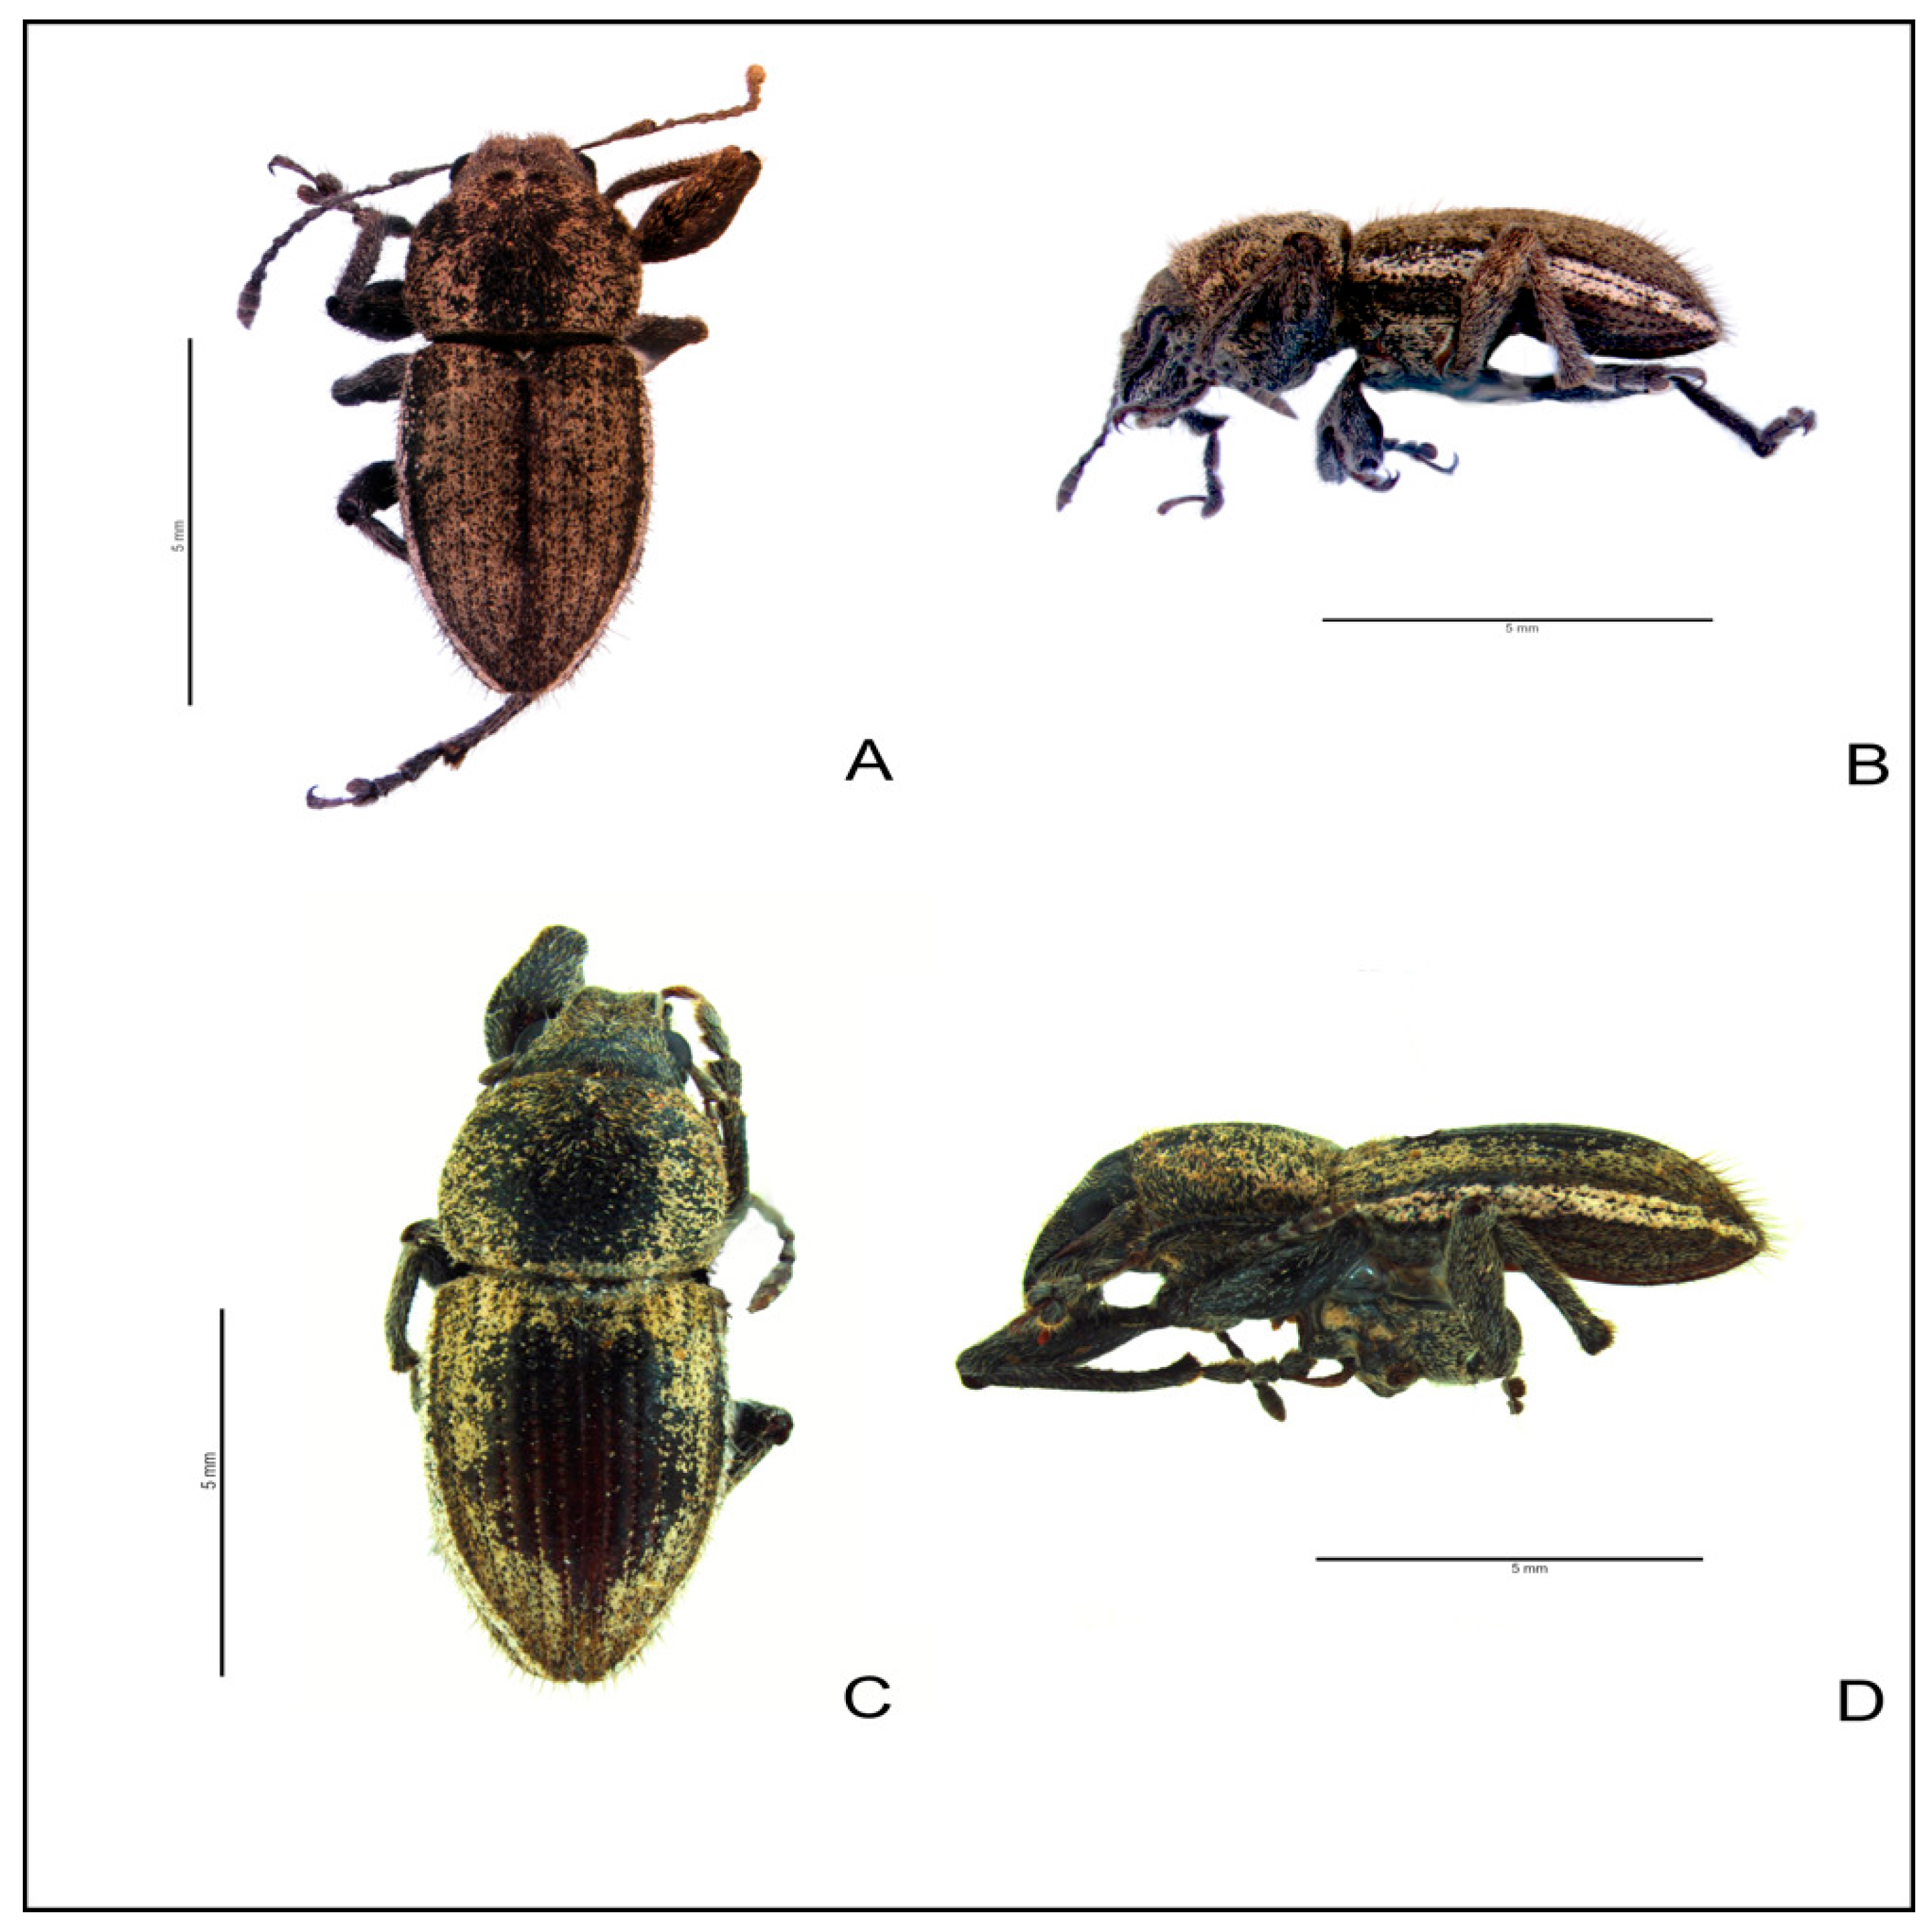
The males under study exhibit the typical characteristics of sexual dimorphism in Naupactus: the body (rostrum, pronotum, and elytra) is more slender and elongate than in females; the antennae are slightly longer; the pronotum is more convex dorsally and almost as long as it is wide; the profemora are more robust (Figure 5A,B); and the last ventrite is trapezoidal (see Figure 24 in [1]).
The slightly convex eyes of these males resemble those of N. leucoloma (in N. minor, the eyes are almost flat, and, in N. peregrinus, they are convex in the lateral view). The integument of the rostrum and pronotum is rugose, as in N. leucoloma (in N. peregrinus and N. minor, the integument ranges from slightly rugose to smooth), and the setosity is suberect (in the other species, it is usually appressed, except in some variants of N. leucoloma). The setae on the rostrum are transversely oriented toward the median groove, as in N. peregrinus (in N. leucoloma and N. minor, they form semicircles on each side of the groove). The median groove of the rostrum is widened toward the apex and has a small carina, as in N. leucoloma and N. minor. The setae on the pronotum are centrally and anteriorly oriented, as in N. leucoloma and N. minor, although, in N. leucoloma, this character shows some variation. The corbel of the metatibia is well developed, as in N. minor and N. peregrinus (in N. leucoloma, it is usually obsolete).
The UM differ from those assigned to N. leucoloma by Lanteri and Marvaldi [1] (Figure 5C,D) in being smaller and more hirsute. Other external characteristics are similar, as is the shape of the penis (see [1], Figures 36 and 37). All the males were collected in the same area of Argentina: Entre Ríos Province, near the Paraná River. Those described as N. leucoloma were collected in the surroundings of Paraná City (January 1979), while the UM were collected in Diamante and Victoria (February 2013).
In Table S1, we show the main morphological characters that differentiate the females of N. leucoloma, N. minor, and N. peregrinus examined for this study (Figure 4), plus the UM (Figure 5A,B) and the males of N. leucoloma (Figure 5C,D).
Morphological evidence suggests that the UM may represent a different variant or ‘race’ sensu Buchanan [1] of N. leucoloma, a hypothesis that conflicts with the conclusions derived from the molecular data.
In short, the combination of molecular and morphological evidence prevented us from assigning the UM to any of the parthenogenetic species within the N. leucoloma species group. Morphologically, the UM exhibits intermediate characteristics among the three species, though with a closer resemblance to N. leucoloma, while the molecular data suggest that it may represent an independently evolving lineage. However, based on the currently available data, we are not in a position to describe it as a new species.

4. Discussion

4.1. Four Independently Evolving Lineages

In the present study, we examined a group of males that, at first glance, could belong to any of the parthenogenetic species within the N. leucoloma species group. However, based on the available data, we were unable to assign these males to any of the species recognized by Lanteri and Marvaldi within this taxonomic group [1], nor could we confidently describe them as a new species. This is because, from the molecular perspective, they appear to represent an independently evolving lineage, whereas the morphological data reveal a mosaic of characteristics from the three parthenogenetic species under consideration.
A survey of both the mitochondrial and nuclear variation in the N. leucoloma species group and the group of males of uncertain origin suggests that these represent an independently evolving lineage. Analyses using both types of markers consistently recovered reciprocally monophyletic groups. However, the inferred sister-group relationships are different between datasets, revealing some degree of conflict. The larger number of nuclear characteristics provided by the ddRAD-seq dataset likely contributes to the higher confidence in the resulting ML topology [51], which supports N. minor as the sister group of the UM. Additionally, the independence of the three parthenogenetic Naupactus species and the UM is supported by their clustering patterns in the PCA plot, where the first two principal components—accounting for a high percentage of the explained variance—clearly separate the four entities. This pattern is further corroborated by the structure of the neighbor-net, as well as by the species delimitation analyses based on coalescent theory, which probabilistically identified the UM as an independently evolving lineage.
It might seem reasonable to assign the UM studied here to a sexual lineage of one of the parthenogenetic species in this group. However, the genetic distance between these males and any parthenogenetic group of females is twice as large as that observed between unisexual and sexual lineages in other species, such as Pantomorus postfasciatus (Hustache) [35]. For instance, the parthenogenetic lineages of N. leucoloma are of more recent origin than those of P. postfasciatus (see [35]); thus, the hypothesis that these UM represent the sexual populations of this weevil appears improbable. Further field trips near the Paraná River Delta, with larger sample sizes including females, may shed light on the relationships within this species group.

4.2. Causes of Conflict

The neighbor-net network displays certain ambiguities, which may be attributed to ILS, gene flow (introgression or hybridization), recombination, or homoplasy. However, recombination and homoplasy can be ruled out as significant sources of conflict, since we used independent and unlinked SNPs, making recombination unlikely. Homoplasy, on the other hand, is more common in repetitive chromosomal regions or in datasets with few informative characteristics [52]. ILS can also be dismissed, given the high support of the phylogenetic tree based on the ddRAD-seq dataset, the clear clustering observed in the PCA, and the significantly positive result of the ABBA-BABA test, which supports introgression rather than ILS. Indeed, the shape and position of the loops in the neighbor-net network (i.e., between independently evolving lineages) are consistent with the gene flow among specific lineages, as Huson and Bryant have consistently pointed out [33]. Therefore, we consider gene flow the most likely source of conflict, in agreement with the ABBA-BABA test result presented earlier. Regarding gene flow, the ABBA-BABA test suggests introgression rather than hybridization, as the genomic patterns observed in the triangle plots do not conclusively indicate ongoing hybridization. Nevertheless, we cannot entirely rule out its occurrence. But the well-supported clustering of individuals and the absence of widespread admixed genotypes indicate that, if hybridization events have occurred, they are likely historical and their genomic signatures were already erased. Thus, hybridization may have played a role in the evolutionary history of these lineages, but our data support their current recognition as distinct evolutionary units with traces of historical introgression.
On the other hand, according to the morphological analysis, the UM might represent what Buchanan called “a race” within N. leucoloma, a conclusion that clearly conflicts with the genetic evidence, which supports the UM as an independently evolving lineage and sister species to N. minor. The morphological resemblance between N. leucoloma and UM may result from the previously discussed introgression events, assuming these affect genes associated with external morphology. This could explain why the UM were morphologically aligned with specimens identified as N. leucoloma by Lanteri and Marvaldi [1], despite being smaller and more hirsute.
Buchanan’s early insights [6] remain relevant for understanding the taxonomic complexity of the N. leucoloma species group due to both the unisexual reproduction and high morphological variability. The present contribution reveals that genetic diversity within the parthenogenetic members of the N. leucoloma species group is much higher than we previously believed when we began the first molecular analyses based on N. leucoloma [9]. There are several independently evolving lineages which exchange genetic information occasionally, and the processes underlying this genetic variation will require further studies.

4.3. Successive Rounds of Parthenogenesis and Sexuality Shapes the Genetic Variation of Weevils in Singular Ways

Previous studies, such as Guzmán et al. [9], proposed that N. leucoloma clones may have hybridized with individuals of a related species, based on the observation of nuclear heterozygosity levels higher than expected for unisexual species. A similar explanation was suggested for the genus Aramigus Horn, where a study combining morphological and molecular data concluded that the incongruence between datasets was likely due to hybridization [53]. The same has been proposed for N. cervinus, a species complex in statu nascendi [17], whose ecotypes occasionally exchanged genetic material over its evolutionary history [50]. Although no signatures of hybridization were detected in the present study, as the triangle plot analyses showed, the gene flow between closely related parthenogenetic and sexually reproducing entities may have occurred in multiple directions, potentially promoting introgression and resulting in mosaic morphologies.
Our preliminary results suggest that the presence of sexual reproduction in some biological entities within the N. leucoloma species group plays a significant role in facilitating gene flow, even among parthenogenetic species. In this context, sexual reproduction may occasionally contribute to increase genetic variation within the three parthenogenetic members of the group herein studied.
The coexistence of both sexual and unisexual lineages (UM, N. leucoloma, N. minor, and N. peregrinus) is reminiscent of the well-known species complex of the broad-nosed weevil Otiorhynchus scaber (Linnaeus). Within the O. scaber complex, four forms are recognized: one sexually reproducing diploid lineage with a very limited distribution, another diploid lineage which reproduces by parthenogenesis and also with limited distribution, and two widely distributed polyploid parthenogenetic forms [54,55]. All coexist in the central area of their geographical range, where the genetic and clonal diversity are highest, while diversity decreases toward the margins of the distribution as ploidy levels increase, resulting in only tetraploids inhabiting the range margins [55,56,57,58]. These authors proposed that the high clonal diversity in O. scaber populations arises from a continuous transition from diploid sexuality to triploid and, finally, tetraploid parthenogenesis, driven by chance fertilizations of unreduced eggs. The geographical distribution pattern of the sexual and parthenogenetic populations described for O. scaber is a common phenomenon among parthenogenetic animals with varying ploidy levels. Strikingly, the UM herein studied were found in the central area proposed for N. leucoloma, and were never found in the margins of its distribution [9]. It would be interesting to test the ploidy levels and the degree of genetic variation of the N. leucoloma clones in the central area with those from the margin of their geographic range.
Parthenogenesis probably increased the taxonomic complexity of the N. leucoloma species group, as it can distort genetic diversity and would promote morphological divergence through mechanisms such as polyploidy and a lack of recombination [54]. Phylogenetic analyses of unisexuals are methodologically more challenging than those of sexual species, particularly when the mode of parthenogenesis, the occurrence of hybridization, and the ploidy level remain unknown [54]. This likely explains, at least in part, why the relationships among N. leucoloma, N. minor, and N. peregrinus differ depending on the molecular markers used or when compared with morphological data.
Genetic surveys in weevils of the tribe Naupactini have revealed surprisingly high levels of genetic variation ([9,16,40], present work), pointing to several plausible biodiversity hotspots in southern South America, such as the Paranaense forest, a humid subtropical forest that is one of the biologically richest and most diverse ecosystems on the planet, and the gallery forests where these weevils range. This is not an isolated case of high genetic diversity; for instance, see Husemann et al. [59], which demonstrated the existence of three distinct genetic lineages in the former grasshopper species Trimerotropis pallidipennis (Burmeister 1838), now redefined as a species complex. Altogether, these findings reveal unexpected sources of genetic variation and underscore the need for further studies in this still poorly explored continent.

5. Conclusions

This study uncovered a highly divergent lineage of males within the N. leucoloma species group that cannot be assigned to any known parthenogenetic species. Molecular and morphological evidence consistently support the existence of four independently evolving lineages, with the UM representing a distinct entity. Patterns of genetic variation, including signals of historical introgression, suggest that occasional gene flow—facilitated by rare sexual reproduction—has shaped the evolutionary history of this group. These findings highlight the role of reproductive mode transitions in promoting diversity and reinforce the gallery forests of southern South America as critical hotspots of weevil biodiversity.

Supplementary Materials

The following supporting information can be downloaded at: https://www.mdpi.com/article/10.3390/d17080561/s1, Figure S1. Sampling locations of Naupactus leucoloma, Naupactus minor, Naupactus peregrinus, Naupactus tucumanensis, and the undetermined males; Figure S2. Maximum likelihood phylogenetic tree based on the COI + ddRAD-seq datasets from the parthenogenetic species of the Naupactus leucoloma species group and the undetermined males. Outgroup: Naupactus tucumanensis. Numbers above branches indicate bootstrap support values. Only values above 50% are shown. Branch lengths represent the number of substitutions per site. The scale bar represents the expected number of substitutions per site. Colored boxes indicate distinct genetic clades: Green box, undetermined males; Red box, identified Naupactus minor females; Blue box, identified Naupactus leucoloma females; and Orange box, identified Naupactus peregrinus females; Figure S3. Triangle plot (left) and triangle plot with samples colored by percent missing data (right). Each point is an individual colored by species and by percentage of missing data in each sample, respectively. (A) and (B) N. minor and N. leucoloma as the parental configuration; (C) and (D) UM and N. minor as the parental configuration; and (E) and (F) UM and N. leucoloma as the parental configuration. Table S1. Key diagnostic characteristics for distinguishing among the studied species.

Author Contributions

Conceptualization, N.V.G., M.S.R. and A.A.L.; methodology, N.V.G., M.S.R., V.A.C. and A.A.L.; formal analysis, N.V.G. and M.S.R.; investigation, N.V.G., M.S.R., V.A.C. and A.A.L.; resources, N.V.G., M.S.R., V.A.C. and A.A.L.; data curation, N.V.G., M.S.R. and A.A.L.; writing—original draft preparation, N.V.G., M.S.R. and A.A.L.; writing—review and editing, N.V.G., M.S.R., V.A.C. and A.A.L.; visualization, N.V.G.; supervision, V.A.C. and A.A.L.; project administration, N.V.G., V.A.C. and A.A.L.; funding acquisition, N.V.G., V.A.C. and A.A.L. All authors have read and agreed to the published version of the manuscript.

Funding

This research was funded by Agencia Nacional de Promoción Científica y Tecnológica (ANPCyT), grant number PICT-2013-1468 (VAC), PICT-2016-2798 (AAL), and PICT-2018-1850 (NVG); and Universidad de Buenos Aires (UBA), grant number UBACyT 20020220100194BA (VAC). The APC was funded by MDPI through the Award for Best Poster Presentation at the 3rd International Electronic Conference on Diversity.

Data Availability Statement

ddRADseq datasets are publicly archived in Figshare. Datasets are available at 10.6084/m9.figshare.29156063 Reads obtained by ddRAD sequencing are available at NCBI as BioProject PRJNA1264493. DNA sequences are available under Accession Nos. PV934253-60 (COI) and PV940799-805 (ITS1).

Acknowledgments

We especially thank María Paula Campos for her collaboration in the fieldwork, Cristian Amaya Roncancio and Judy A. Rincón for their help with photographs, and Cecilia Guzman for their valuable suggestions in designing Figure 1, Figure 2, Figure 3, Figure 4 and Figure 5. We also thank the anonymous reviewers for their comments, which helped improve this paper. NVG, MSR, VAC, and AAL are members of the Research Career of the Consejo Nacional de Investigaciones Científicas y Técnicas, Argentina.

Conflicts of Interest

The authors declare no conflicts of interest. The sponsors had no role in the design, execution, interpretation, or writing of the study.

References

  1. Lanteri, A.A.; Marvaldi, A.E. Graphognathus Buchanan, a new synonym of Naupactus Dejean, and systematics of the N. leucoloma species group (Coleoptera: Curculionidae). Coleop. Bull. 1995, 49, 206–228. [Google Scholar]
  2. EPPO Naupactus leucoloma. EPPO Datasheets on Pests Recommended for Regulation. 2021. Available online: https://gd.eppo.int (accessed on 1 May 2025).
  3. Watson, R.J. Naupactus leucoloma (Coleoptera, Curculionidae): A Pest New to the United States. Fla. Entomol. 1937, 20, 1–3. [Google Scholar] [CrossRef]
  4. Young, H.C.; App, B.A. Biology of the white-fringed beetle (Naupactus leucoloma Boh.). USDA Bur. Entomol. Plant Quar. Circular E-464. 1939. 24p. Available online: https://www.biodiversitylibrary.org/item/216240 (accessed on 1 May 2025).
  5. Buchanan, L.L. The species of Pantomorus of America north of Mexico. United States Department of Agriculture. Misc. Publ. 1939, 341, 1–39. [Google Scholar]
  6. Buchanan, L.L. Four new species of white-fringed beetles (subgenus Graphognathus) from the southeastern part of the United States (Coleoptera: Curculionidae). Bull. Brooklyn Entomol. Soc. 1942, 37, 107–110. [Google Scholar]
  7. Buchanan, L.L. A correction and two new races in Graphognatus (white-fringed beetles) (Coleoptera: Curculionidae). J. Wash. Acad. Sci. 1947, 37, 19–22. [Google Scholar]
  8. Lanteri, A.A.; Normark, B. Parthenogenesis in the tribe Naupactini (Coleoptera: Curculionidae). Ann. Entomol. Soc. Am. 1995, 88, 722–731. [Google Scholar] [CrossRef]
  9. Guzmán, N.V.; Lanter, A.A.; Confalonieri, V.A. Colonization ability of two invasive weevils with different reproductive modes. Evol. Ecol. 2012, 26, 1371–1390. [Google Scholar] [CrossRef]
  10. Lanteri, A.A.; Guzmán, N.V.; del Río, M.G.; Confalonieri, V.A. Potential geographic distributions and successful invasions of parthenogenetic broad–nosed weevils (Coleoptera: Curculionidae) native to South America. Environ. Entomol. 2013, 42, 677–686. [Google Scholar] [CrossRef]
  11. Scataglini, M.A.; Lanteri, A.A.; Confalonieri, V.A. Phylogeny of the Pantomorus–Naupactus complex based on morphological and molecular data (Coleoptera: Curculionidae). Cladistics 2005, 21, 131–142. [Google Scholar] [CrossRef]
  12. del Rio, M.G.; Rodriguero, M.S.; Confalonieri, V.A.; Lanteri, A.A. Molecular and Morphological Phylogenetic Analysis of Naupactus Dejean (Curculionidae: Entiminae) and Allied Genera: The Dilemma of Classification. Diversity 2018, 10, 59–68. [Google Scholar] [CrossRef]
  13. Rodriguero, M.S.; Confalonieri, V.A.; Guedes, J.C.; Lanteri, A.A. Wolbachia infection in the tribe Naupactini (Coleoptera, Curculionidae): Association between thelytokous parthenogenesis and infection status. Insect Mol. Biol. 2010, 19, 631–640. [Google Scholar] [CrossRef]
  14. Rodriguero, M.S.; Guzmán, N.V.; Lanteri, A.A.; Confalonieri, V.A. The effect of reproductive system on invasiveness: Lessons from South American weevils. Fla. Entomol. 2019, 102, 495–500. [Google Scholar] [CrossRef]
  15. Mackay-Smith, A.; Dornon, K.M.; Lucier, R.; Okimoto, A.; Sousa, M.D.F.; Rodriguero, M.; Confalonieri, A.V.; Lanteri, A.A.; Sequeira, S. A Host-specific gene expression as a tool for introduction success in Naupactus parthenogenetic weevils. PLoS ONE 2021, 16, e0248202. [Google Scholar] [CrossRef]
  16. Sunnucks, P.; Hales, D.F. Numerous transposed sequences of mitochondrial cytochrome oxidase I-II in aphids of the genus Sitobion (Hemiptera: Aphididae). Mol. Biol. Evol. 1996, 13, 510–524. [Google Scholar] [CrossRef]
  17. Rodriguero, M.S.; Lanteri, A.A.; Confalonieri, V.A. Speciation in the asexual realm: Is the parthenogenetic weevil Naupactus cervinus a complex of species in statu nascendi? Mol. Phylogenet. Evol. 2013, 68, 644–656. [Google Scholar] [CrossRef] [PubMed]
  18. Normark, B.B. Phylogeny and Evolution of Parthenogenesis in the Aramigus tessellatus Complex (Coleoptera: Curculionidae). Ph.D. Thesis, Cornell University, Ithaca, NY, USA, 1994. [Google Scholar]
  19. Vrain, T.C.; Wakarchuk, D.C.; Levesque, A.C.; Hamilton, R.I. Intraspecific rDNA restriction fragment length polymorphism in the Xiphinema americanum group. Fundam. Appl. Nematol. 1992, 15, 563–573. [Google Scholar]
  20. Cherry, T.; Szalanski, A.L.; Todd, T.C.; Powers, T.O. The internal transcribed spacer region of Belonolaimus (Nemata: Belonolaimidae). J. Nematol. 1997, 29, 23–29. [Google Scholar]
  21. Hall, T.A. BioEdit: A user-friendly biological sequence alignment editor and analysis program for Windows 95/98/NT. Nucleic Acids Res. Spec. Ser. 1999, 41, 95–98. [Google Scholar]
  22. Peterson, B.K.; Weber, J.N.; Kay, E.H.; Fisher, H.S.; Hoekstra, H.E. Double digest RADseq: An inexpensive method for de novo SNP discovery and genotyping in model and non-model species. PLoS ONE 2012, 7, e37135. [Google Scholar] [CrossRef]
  23. Catchen, J.M.; Amores, A.; Hohenlohe, P.; Cresko, W.; Postlethwait, J.H. Stacks: Building and Genotyping Loci De Novo From Short-Read Sequences. G3 Genes Genomes Genet. 2011, 1, 171–182. [Google Scholar] [CrossRef]
  24. Catchen, J.; Hohenlohe, P.A.; Bassham, S.; Amores, A.; Cresko, W.A. Stacks: An analysis tool set for population genomics. Mol. Ecol. 2013, 22, 3124–3140. [Google Scholar] [CrossRef]
  25. Rivera-Colón, A.G.; Catchen, J. Population Genomics Analysis with RAD, Reprised: Stacks 2. In Marine Genomics, 1st ed.; Verde, C., Giordano, D., Eds.; Humana: New York, NY, USA, 2022; Volume 2498, pp. 145–168. [Google Scholar]
  26. Ronquist, F.; Teslenko, M.; van der Mark, P.; Ayres, D.L.; Darling, A.; Höhna, S.; Larget, B.; Liu, L.; Suchard, M.A.; Huelsenbeck, J.P. MrBayes 3.2: Efficient Bayesian phylogenetic inference and model choice across a large model space. Syst. Biol. 2012, 61, 539–542. [Google Scholar] [CrossRef]
  27. Sievers, F.; Wilm, A.; Dineen, D.; Gibson, T.J.; Karplus, K.; Li, W.; Lopez, R.; McWilliam, H.; Remmert, M.; Söding, J.; et al. Fast, scalable generation of high-quality protein multiple sequence alignments using Clustal Omega. Mol. Syst. Biol. 2011, 7, 539. [Google Scholar] [CrossRef]
  28. Rozas, J.; Ferrer-Mata, A.; Sánchez-DelBarrio, C.J.; Guirao-Rico, S.; Librado, P.; Ramos-Onsins, E.S.; Sánchez-Gracia, A. DnaSP 6: DNA Sequence Polymorphism Analysis of Large Data Sets. Mol. Biol. Evol. 2017, 34, 3299–3302. [Google Scholar] [CrossRef] [PubMed]
  29. Darriba, D.; Taboada, G.L.; Doallo, R.; Posada, D. jModelTest 2: More models, new heuristics and parallel computing. Nat. Methods 2012, 9, 772. [Google Scholar] [CrossRef] [PubMed]
  30. Sánchez, R.; Serra, F.; Tárraga, J.; Medina, I.; Carbonell, J.; Pulido, L.; de María, A.; Capella-Gutíerrez, S.; Huerta-Cepas, J.; Gabaldón, T.; et al. Phylemon 2.0: A suite of web-tools for molecular evolution, phylogenetics, phylogenomics and hypotheses testing. Nucleic Acids Res. 2011, 39, W470–W474. [Google Scholar] [CrossRef]
  31. Rambaut, A.; Drummond, A.J.; Xie, D.; Baele, G.; Suchard, M.A. Posterior Summarization in Bayesian Phylogenetics Using Tracer 1.7. Syst. Biol. 2018, 67, 901–904. [Google Scholar] [CrossRef] [PubMed]
  32. Stamatakis, A. RAxML version 8: A tool for phylogenetic analysis and post-analysis of large phylogenies. Bioinformatics 2014, 30, 1312–1313. [Google Scholar] [CrossRef] [PubMed]
  33. Huson, D.H.; Bryant, D. Application of phylogenetic networks in evolutionary studies. Mol. Biol. Evol. 2006, 23, 254–267. [Google Scholar] [CrossRef]
  34. R Core Team. R: A Language and Environment for Statistical Computing; R Foundation for Statistical Computing: Vienna, Austria, 2019; Version 4.2.3; Available online: https://www.R-project.org (accessed on 1 December 2024).
  35. RStudio Team. RStudio: Integrated Development Environment for R; Version 2024.04.2+746; RStudio, Inc.: Boston, MA, USA, 2020. [Google Scholar]
  36. Jombart, T. adegenet: A R package for the multivariate analysis of genetic markers. Bioinformatics 2008, 24, 1403–1405. [Google Scholar] [CrossRef]
  37. Knaus, B.J.; Grünwald, N.J. vcfr: A package to manipulate and visualize variant call format data in R. Mol. Ecol. Res. 2017, 17, 44–53. [Google Scholar] [CrossRef]
  38. Wickham, H. ggplot2: Elegant Graphics for Data Analysis; Springer: New York, NY, USA, 2016. [Google Scholar]
  39. Kumar, S.; Stecher, G.; Li, M.; Knyaz, C.; Tamura, K. MEGA X: Molecular Evolutionary Genetics Analysis across Computing Platforms. Mol. Biol. Evol. 2018, 35, 1547–1549. [Google Scholar] [CrossRef]
  40. Jost, L. GST and its relatives do not measure differentiation. Mol. Ecol. 2008, 17, 4015–4026. [Google Scholar] [CrossRef] [PubMed]
  41. Millar, M.A.; Byrne, M. Variable clonality and genetic structure among disjunct populations of Banksia mimica. Conserv. Genet. 2020, 21, 803–818. [Google Scholar] [CrossRef]
  42. Elias-Costa, A.J.; Confalonieri, V.A.; Lanteri, A.A.; Rodriguero, M.S. Game of clones: Is Wolbachia inducing speciation in a weevil with a mixed reproductive mode? Mol. Phylogenet. Evol. 2019, 133, 42–53. [Google Scholar] [CrossRef] [PubMed]
  43. Durand, E.Y.; Patterson, N.; Reich, D.; Slatkin, M. Testing for ancient admixture between closely related populations. Mol. Biol. Evol. 2011, 28, 2239–2252. [Google Scholar] [CrossRef]
  44. Malinsky, M.; Matschiner, M.; Svardal, H. Dsuite—Fast D-statistics and related admixture evidence from VCF files. Mol. Ecol. Resour. 2021, 21, 584–595. [Google Scholar] [CrossRef]
  45. Wiens, B.J.; DeCicco, L.H.; Colella, J.P. triangulaR: An R package for identifying AIMs and building triangle plots using SNP data from hybrid zones. Heredity 2025, 134, 251–262. [Google Scholar] [CrossRef]
  46. Bouckaert, R.; Heled, J.; Kühnert, D.; Vaughan, T.; Wu, C.H.; Xie, D.; Suchard, M.A.; Rambaut, A.; Drummond, A.J. BEAST 2: A software platform for Bayesian evolutionary analysis. PLoS Comput. Biol. 2014, 10, e1003537. [Google Scholar] [CrossRef]
  47. Baele, G.; Lemey, P.; Bedford, T.; Rambaut, A.; Suchard, M.A.; Alekseyenko, A.V. Improving the accuracy of demographic and molecular clock model comparison while accommodating phylogenetic uncertainty. Mol. Biol. Evol. 2012, 29, 2157–2167. [Google Scholar] [CrossRef]
  48. Grummer, J.A.; Bryson, R.W.; Reeder, T.W. Species delimitation using Bayes factors: Simulations and application to the Sceloporus scalaris species group (Squamata: Phrynosomatidae). Syst. Biol. 2014, 63, 119–133. [Google Scholar] [CrossRef]
  49. Kass, R.E.; Raftery, A.E. Bayes factors. J. Am. Stat. Assoc. 1995, 90, 773–795. [Google Scholar] [CrossRef]
  50. Rodriguero, M.S.; Wirth, S.A.; Alberghina, J.S.; Lanteri, A.A.; Confalonieri, V.A. A tale of swinger insects: Signatures of past sexuality between divergent lineages of a parthenogenetic weevil revealed by ribosomal intraindividual variation. PLoS ONE 2018, 13, e0195551. [Google Scholar] [CrossRef] [PubMed]
  51. Knowles, L.L. Statistical phylogeography. Annu. Rev. Ecol. Evol. Syst 2009, 40, 593–612. [Google Scholar] [CrossRef]
  52. Whitfield, J.B.; Lockhart, P.J. Deciphering ancient rapid radiations. Trends Ecol. Evol. 2007, 22, 258–265. [Google Scholar] [CrossRef] [PubMed]
  53. Normark, B.B.; Lanteri, A.A. Incongruence between morphological and mitochondrial-DNA characters suggests hybrid origins of parthenogenetic weevil lineages (genus Aramigus). Syst. Biol. 1998, 47, 475–494. [Google Scholar] [CrossRef]
  54. Tomiuk, J.; Loeschcke, V. Evolution of parthenogenesis in the Otiorhynchus scaber complex. Heredity 1992, 68, 391–397. [Google Scholar] [CrossRef]
  55. Stenberg, P.; Lundmark, M.; Knutelski, S.; Saura, A. Evolution of clonality and polyploidy in a weevil system. Mol. Biol. Evol. 2003, 20, 1626–1632. [Google Scholar] [CrossRef]
  56. Stenberg, P.; Terhivuo, J.; Lokki, J.; Saura, A. Clone diversity of tetraploid Otiorhynchus scaber in Northern Europe. Hereditas 1997, 126, 169–172. [Google Scholar] [CrossRef]
  57. Stenberg, P.; Terhivuo, J.; Lokki, J.; Saura, A. Clone diversity in the polyploid weevil Otiorhynchus scaber. Hereditas 2000, 132, 137–142. [Google Scholar] [CrossRef]
  58. Stenberg, P.; Lundmark, M. Distribution, mechanisms and evolutionary significance of clonality and polyploidy in weevils. Agric. For. Entomol. 2004, 6, 259–266. [Google Scholar] [CrossRef]
  59. Husemann, M.; Guzmán, N.V.; Danley, P.D.; Cigliano, M.M.; Confalonieri, V.A. Biogeography of Trimerotropis pallidipennis (Acrididae: Oedipodinae): Deep divergence across the Americas. J. Biogeogr. 2013, 40, 261–273. [Google Scholar] [CrossRef]
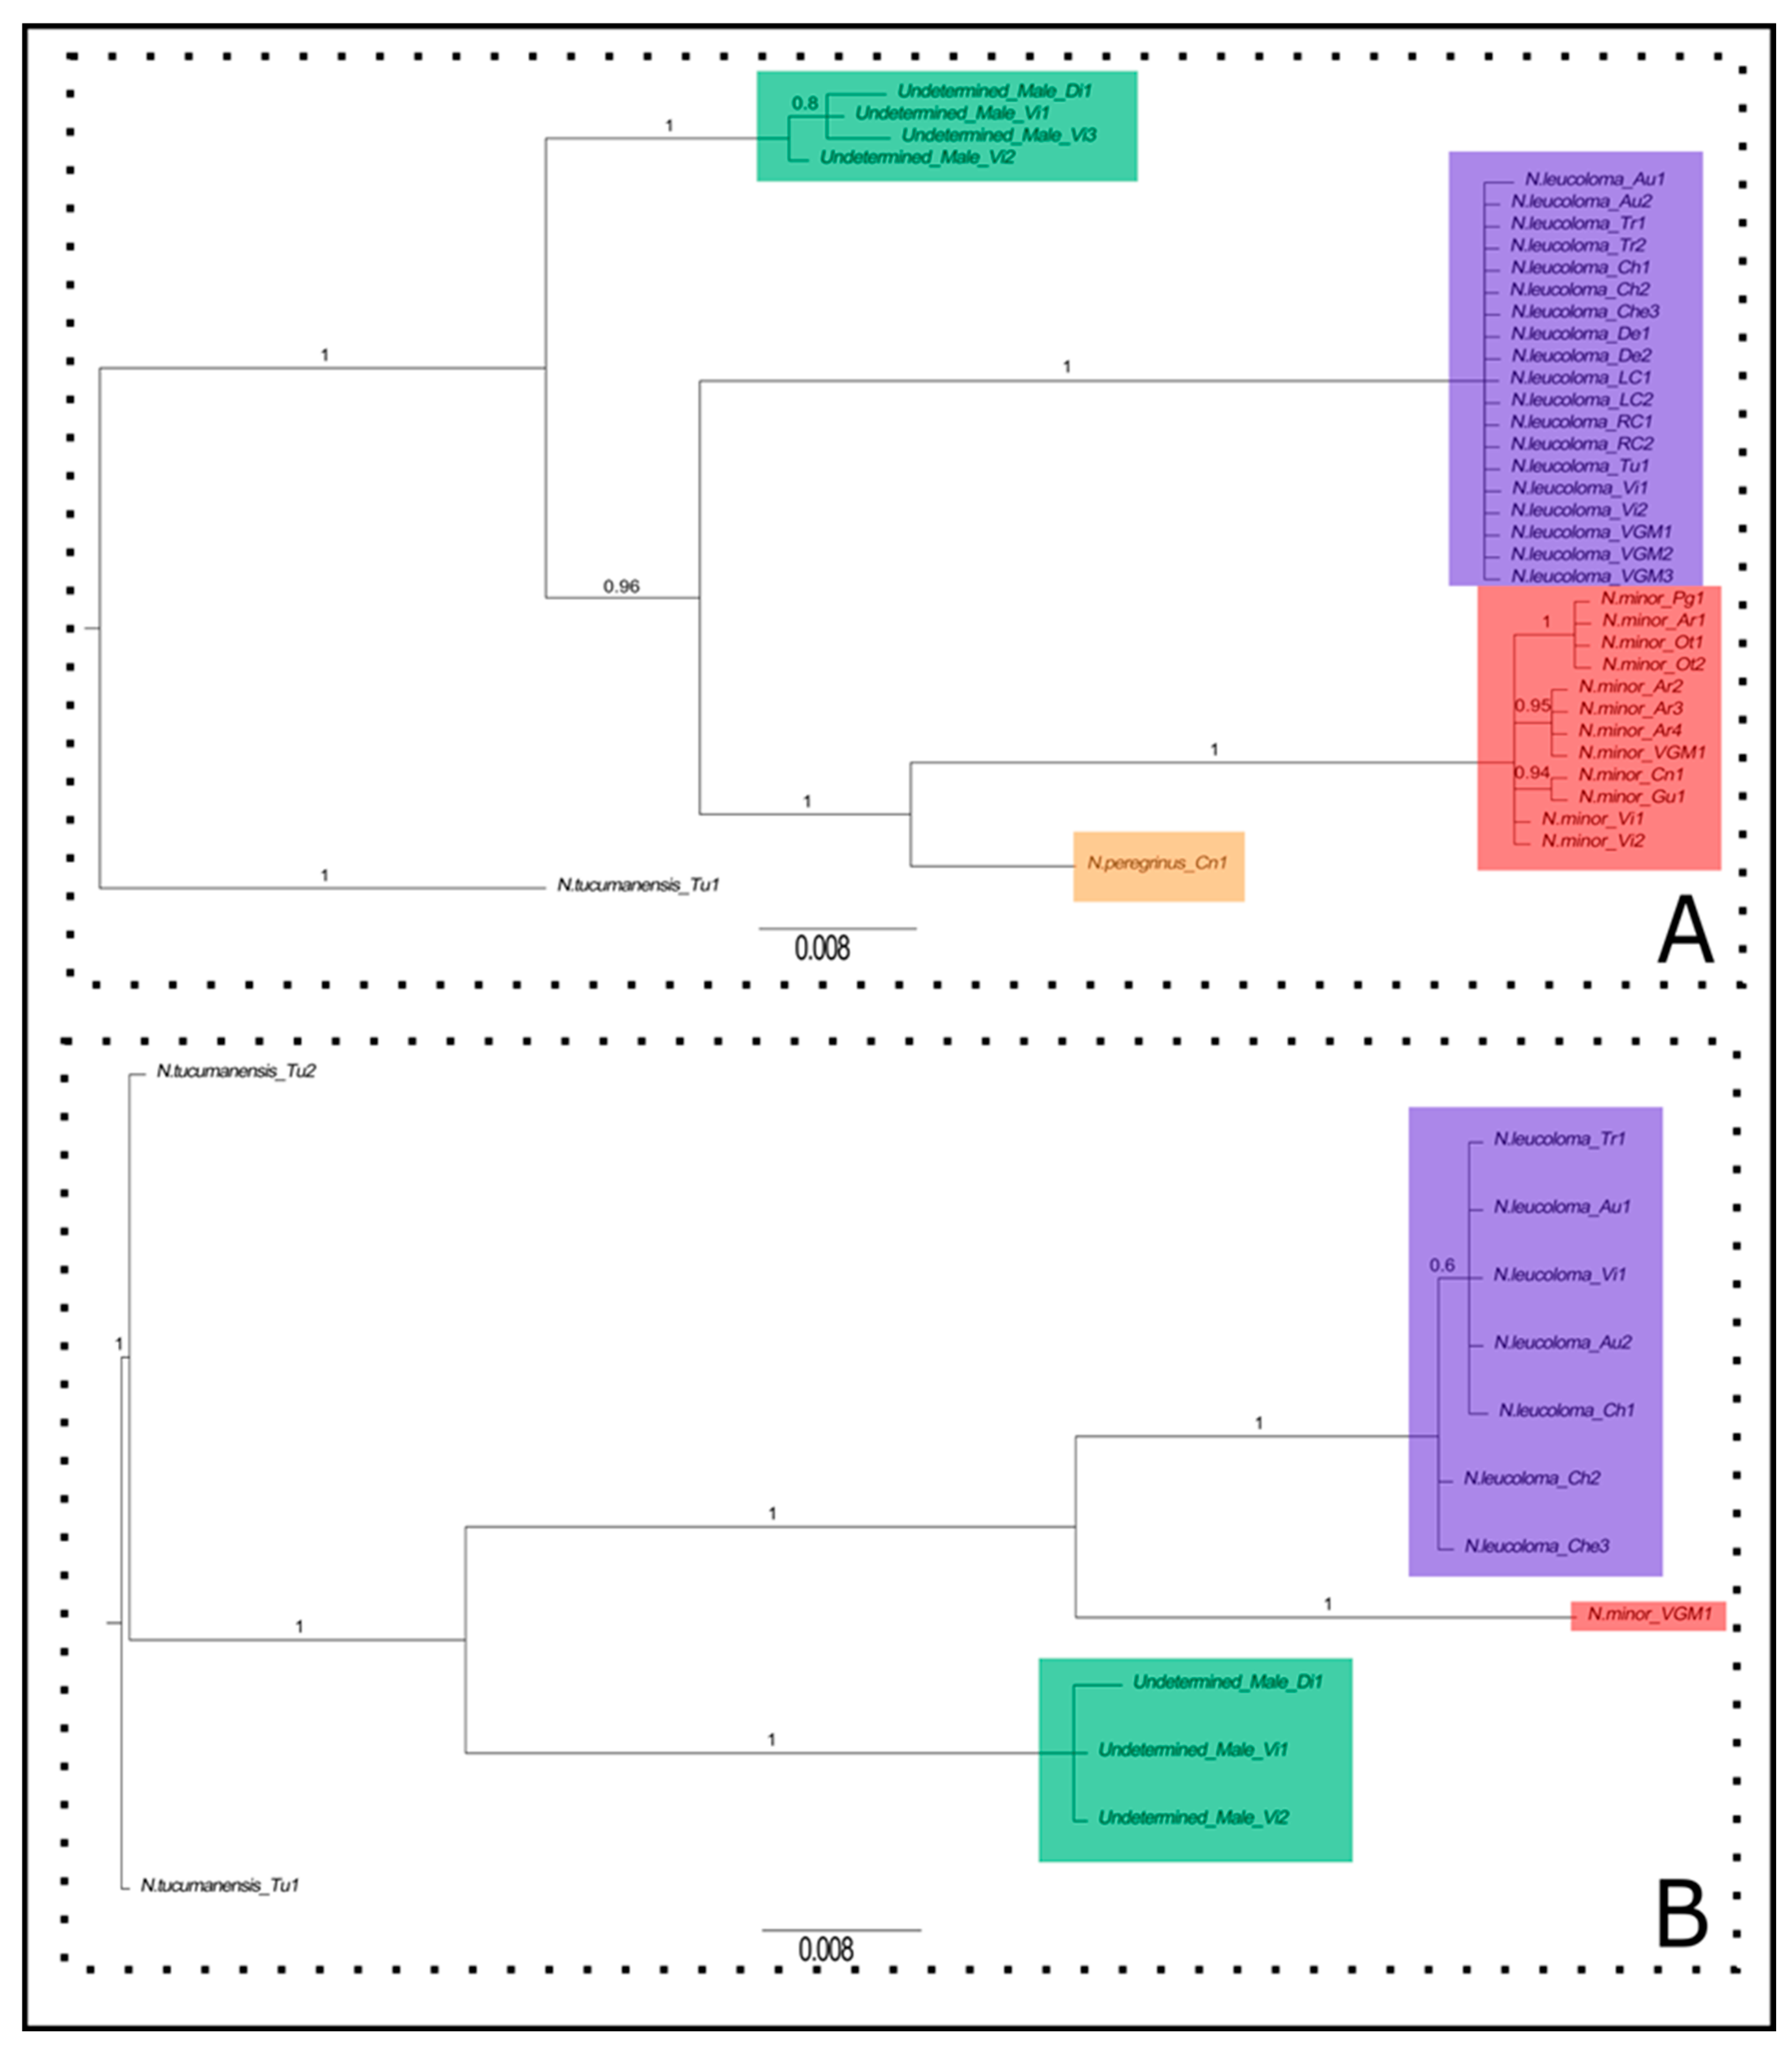
Figure 1. Phylogenetic reconstruction of the Naupactus leucoloma species group. (A) Bayesian phylogenetic tree based on COI sequences belonging to the parthenogenetic species of the Naupactus leucoloma species group and the undetermined males. Outgroup: Naupactus tucumanensis. Posterior probabilities are indicated at each node. Branch lengths represent the number of substitutions per site. The scale bar represents the expected number of substitutions per site. Colored boxes indicate distinct genetic clades: Green box, undetermined males; Red box, identified Naupactus minor females; Blue box, identified Naupactus leucoloma females; and Orange box, identified Naupactus peregrinus females. (B) Bayesian phylogenetic tree based on ITS1 sequences belonging to the parthenogenetic species of the Naupactus leucoloma species group and the undetermined males. Outgroup: Naupactus tucumanensis. Posterior probabilities are indicated at each node. Branch lengths represent the number of substitutions per site. The scale bar represents the expected number of substitutions per site. Colored boxes indicate distinct genetic clades: Green box, undetermined males; Red box, identified Naupactus minor females; and Blue box, identified Naupactus leucoloma females.
Diversity 17 00561 g001
Figure 2. Maximum likelihood phylogenetic tree estimated from the ddRAD-seq dataset from the parthenogenetic species of the Naupactus leucoloma species group and the undetermined males. Outgroup: Naupactus tucumanensis. Numbers above branches indicate bootstrap support values. Branch lengths represent the number of substitutions per site. Only values above 50% are shown. The scale bar represents the expected number of substitutions per site. Colored boxes indicate distinct genetic clades: Green box, undetermined males; Red box, identified Naupactus minor females; Blue box, identified Naupactus leucoloma females; and Orange box, identified Naupactus peregrinus females.
Diversity 17 00561 g002
Figure 3. Genetic structure analysis of the Naupactus leucoloma species group. (A) Principal component analysis (PCA) scatterplot generated from the ddRAD-seq dataset. Species are represented by different colors; dots represent individual specimens, and ellipses denote 95% inertia. The plot displays the first two principal components. (B) Neighbor-net network of the parthenogenetic species of the Naupactus leucoloma species group and the undetermined males constructed in SPLITSTREE4 using the ddRAD-seq dataset. Terminal labels represent individuals: Nl (blue), Naupactus leucoloma females; Nm (red), Naupactus minor females; UM (green), undetermined males; and Np (orange), Naupactus peregrinus females. (C) Heatmap showing pairwise genetic distances. Lower triangle: p-distances based on COI sequences; and upper triangle: pairwise Jost’s D (DST) based on the ddRAD-seq dataset. Color intensity corresponds to the distance scale shown at right. Nl_F: Naupactus leucoloma females; Nm_F: Naupactus minor females; and U_M: undetermined males.
Diversity 17 00561 g003
Figure 4. Morphological comparison between parthenogenetic species of the Naupactus leucoloma species group. Habitus. (A) Dorsal view of Naupactus leucoloma female. (B) Lateral view of Naupactus leucoloma female. (C) Dorsal view of Naupactus minor female. (D) Lateral view of Naupactus minor female. (E) Dorsal view of Naupactus peregrinus female. (F) Lateral view of Naupactus peregrinus female.
Diversity 17 00561 g004
Figure 5. Morphological comparison between males of the Naupactus leucoloma species group. Habitus. (A) Dorsal view of undetermined males. (B) Lateral view of undetermined males. (C) Dorsal view of Naupactus leucoloma male. (D) Lateral view of Naupactus leucoloma male.
Diversity 17 00561 g005
Table 1. List of specimens analyzed, including species name, sampling site, latitude, longitude, sampling size, and GenBank accession numbers for each gene.
Specimen IDSpecies Name Sex Sampling SeasonLocationGeographical CoordinatesNCOI Haplotype (Acc. No.)ITS1 Haplotype (Acc. No.)
Nl_LCNaupactus leucolomafemale2007AR, CD, La Carlota33° 26′ S,
63° 18′ W
2L1 (JF811695.1)NA
Nl_RCNaupactus leucolomafemale2007AR, CD, Río Cuarto33° 08′ S,
64° 21′ W
2L1 (JF811695.1)NA
Nl_TrNaupactus leucolomafemale2005AR, CHB, Trelew43° 15′ S,
65° 18′ W
2L1 (JF811695.1)LI (PV940799)
Nl_ViNaupactus leucolomafemale2013AR, ER, Victoria32° 26′ S,
60° 10′ W
2L1 (JF811695.1)LI (PV940799)
Nl_VGMNaupactus leucolomafemale2013AR, ER, RN 12, Viale–María Grande31° 48′ S,
59° 56′ W
3L1 (JF811695.1)NA
Nl_ChNaupactus leucolomafemale2006AR, PBA, Chillar37° 18′ S,
59° 59′ W
2L1 (JF811695.1)LI (PV940799)–LII (PV940800)
Nl_DeNaupactus leucolomafemale2005AR, PBA, Delta34° 26′ S,
58 ° 33′ W
2L1 (JF811695.1)NA
Nl_TuNaupactus leucolomafemale2009AR, TC, Los Leales27° 12′ S,
65° 18′ W
1L1 (JF811695.1)NA
Nl_Au1Naupactus leucolomafemale2005AU, NSW, Kiama34° 52′ S,
150 ° 44′ E
1L3 (JF811693.1)LI (PV940799)
Nl_Au2Naupactus leucolomafemale2005AU, WA, Wheatblty31° 45′ S,
118° 06′ E
1L1 (JF811695.1)LI (PV940799)
Nl_CheNaupactus leucolomafemale2006CH, RM, Santiago33° 32′ S,
70° 46′ W
1L1 (JF811695.1)LII (PV940800)
Nm_CnNaupactus minorfemale2006AR, ER, Concordia31° 24′ S,
58° 02′ W
1M3 (PV934253)NA
Nm_GuNaupactus minorfemale2006AR, ER, Gualeguay33°09′ S,
59°19′ W
1M3 (PV934253)NA
Nm_ViNaupactus minorfemale2013AR, ER, Victoria32° 26′ S,
60° 10′ W
2M4 (PV934255)NA
Nm_VMGNaupactus minorfemale2013AR, ER, RN 12,Viale–María Grande31° 48′ S,
59° 56′ W
1M2 (PV934256)MI (PV940801)
Nm_ArNaupactus minorfemale2005AR, PBA, Arrecifes34° 04′ S,
60° 07′ W
4M1 (PV934254)
M2 (pending)
NA
Nm_OtNaupactus minorfemale2004AR, PBA, R.N. Otamendi34° 13′ S,
58° 54′ W
2M1 (PV934254)NA
Nm_PgNaupactus minorfemale2005AR, PBA, Pergamino33 ° 53′ S,
60° 34′ W
1M1 (PV934254)NA
Np_CnNaupactus peregrinusfemale2006AR, ER, Concordia31° 24′ S,
58° 02′ W
1P1 (MH537935.1)NA
Np_SMNaupactus peregrinusfemale2007BR, RS, Santa Maria9° 41′ S,
53° 48′ W
1NANA
Nt_TuNaupactus tucumanensisfemale2009AR, TC, Los Leales7° 12′ S,
65° 18′ W
2T1 (MH537938.1)TI (PV940804)–TII (PV940805)
UM_DiUndetermined Malesmale2013AR, ER, Diamante32° 03′ 43″ S, 60° 38′ 39″ W1N1 (PV934257)NI (PV940802)
UM_ViUndetermined Malesmale2013AR, ER, Victoria32° 26′ S,
60° 10′ W
2N2 (PV934258)–N3 (PV934259)–N4 (PV934260)NI (PV940802)–NII (PV940803)
Abbreviations: (i) Countries: AR: Argentina, AU: Australia, BR: Brazil, CH: Chile; (ii) Provinces within AR: PBA: Buenos Aires, CHB: Chubut, CD: Córdoba, ER: Entre Ríos, (iii) Sites within PBA: Ar: Arrecifes, Ch: Chillar, De: Delta, Ot: Otamendi Natural Reserve, Pg: Pergamino; (iv) Sites within ER: Cn: Concordia, Di: Diamante, Gu: Gualeguaychú, Vi: Victoria, VMG: National Route 12 between Viale and María Grande; (v) Regions within CH: RM: Región Metropolitana; (vi) States of BR: RS: Rio Grande do Sul; (vii) States of AU: NSW: New South Wales, WA: Western Australia; (viii) UM: undetermined males; (ix) NA: not available; (x) GB Acc. No.: GenBank Accession Numbers.
Table 2. Path sampling results for three species delimitation models of the parthenogenetic species from the Naupactus leucoloma species group.
ModelNo. of Biological UnitsMLEBFLn BF
14−5559.735--
23−6789.1302466.467.81
33−6859.1582606.507.85
Abbreviations: BF, Bayes Factor; and MLE, marginal likelihood estimate. For a detailed description of the models, see main text.
Disclaimer/Publisher’s Note: The statements, opinions and data contained in all publications are solely those of the individual author(s) and contributor(s) and not of MDPI and/or the editor(s). MDPI and/or the editor(s) disclaim responsibility for any injury to people or property resulting from any ideas, methods, instructions or products referred to in the content.