Article

Using Circuit Theory to Identify Important Ecological Corridors for Large Mammals Between Wildlife Refuges

1
Department of Wildlife Ecology and Management, Faculty of Forestry, Kastamonu University, Kastamonu 37150, Türkiye
2
Department of Forest Engineering, Faculty of Forestry, Kastamonu University, Kastamonu 37150, Türkiye
*
Author to whom correspondence should be addressed.
Diversity 2025, 17(8), 542; https://doi.org/10.3390/d17080542 (registering DOI)
Submission received: 21 June 2025 / Revised: 25 July 2025 / Accepted: 26 July 2025 / Published: 1 August 2025
(This article belongs to the Special Issue Habitat Assessment and Conservation Strategies)

Abstract

Habitat fragmentation restricts the movement of large mammals across broad landscapes, leading to isolation of individuals or groups, reduced interaction with other species, and limited access to vital resources in surrounding habitats. In this study, we aimed to determine the wildlife ecological corridors for five large mammals (Ursus arctos, Cervus elaphus, Capreolus capreolus, Sus scrofa, and Canis lupus) between Kastamonu Ilgaz Mountain Wildlife Refuge and Gavurdağı Wildlife Refuge. In the field studies, we used the transect, indirect observation, and camera-trap methods to collect presence data. Maximum Entropy (MaxEnt) (v. 3.4.1) software was used to create habitat suitability models of the target species, which are based on the presence-only data approach. The results indicated that AUC values varied between 0.808 and 0.835, with water sources, stand type, and slope contributing most significantly to model performance. In order to determine wildlife ecological corridors, resistance surface maps were created using the species distribution models (SDMs), and bottleneck areas were determined. The Circuit Theory approach was used to model the connections between ecological corridors. As a result of this study, we developed connectivity models for five large mammals based on Circuit Theory, identified priority wildlife ecological corridors, and evaluated critical connection points between two protected areas, Ilgaz Mountain Wildlife Refuge and Gavurdağı Wildlife Refuge. These findings highlight the essential role of ecological corridors in sustaining landscape-level connectivity and supporting the long-term conservation of wide-ranging species.

Graphical Abstract

1. Introduction

In recent years, habitat fragmentation has increasingly become a major threat to wildlife due to factors such as rapid population growth, industrialization, overexploitation of natural resources, habitat destruction, agricultural expansion, wildlife diseases, poaching, and climate change [1,2]. These factors limit the ability of large mammals, along with many other wildlife species, to move freely across landscapes. They often confine individuals or groups to isolated areas, disrupt interspecies interactions, restrict access to essential resources, and hinder natural dispersal patterns [2]. In this context, ecological corridors are pathways that connect fragmented and isolated habitats, enabling species dispersal, access to natural resources, and the continuity of ecological processes [2,3]. The removal of natural or human-induced barriers enhances the functionality of these corridors, allowing species to move more easily across the landscape [2,4].
The concept of ecological corridors is expressed in various ways in the literature, including terms such as corridor habitat connections, wildlife corridors, land connections, distribution corridors, ecological structures, greenways, green belts, and open spaces [5,6].Wildlife species utilize ecological corridors either directly for activities such as migration, foraging, mating, and dispersal or indirectly, as these corridors maintain habitat connectivity that supports ecosystem functions essential to their survival. Therefore, ecological corridors are fundamental tools in biodiversity conservation strategies and land-use planning efforts [7]. A variety of methods and software tools have been developed to identify potential corridors between habitat patches. Widely adopted tools include Circuitscape [8], the least-cost path method [9], graph-theoretic approaches [10], and the resistant core model [11]. Among these, the circuit theory approach has gained increasing attention in recent years for modeling connectivity between habitats designated for wildlife species [12]. Circuit theory is a widely used approach in ecological connectivity modeling to evaluate species movement, gene flow, and habitat connectivity across fragmented landscapes. It conceptualizes the landscape as a resistance surface, where different land cover types are assigned resistance values based on how easily species can traverse them. Rather than focusing solely on the single optimal or least-cost path, circuit theory simulates multiple potential movement routes between habitat patches. This allows for a more realistic representation of wildlife dispersal by accounting for alternative and redundant corridors, reflecting the complexity of natural movement behavior [8,9,12,13].
The Circuitscape software (Available: https://circuitscape.org) (accessed on 24 May 2024) applies this theory by modeling ecological flows similar to electrical current, using resistance surfaces to estimate movement probabilities and densities. Areas with high current density indicate critical corridors or pinch points, which are essential for conservation planning and maintaining landscape connectivity. High ecological connectivity between habitats allows species to move between habitats, which positively affects gene flow, whereas the opposite can lead to reduced biodiversity and extinction [13,14].
The process of mapping ecological corridors is often carried out by creating habitat-suitability maps of wildlife species and identifying resistance surfaces [2]. Ecological resistance represents the level of difficulty that species will face in moving from one place to another in a landscape. Resistance areas can be unique for each species [15].
Species distribution models (SDMs) can be used in corridor modeling to transform habitat suitability into meaningful resistance surfaces. These models can produce spatial habitat suitability maps by determining the environmental variables suitable for a species so that areas of high suitability correspond to lower resistance values [14,15]. This method evaluates areas where species move into less suitable habitats, which incur more energy costs, reduce their chances of survival, and limit access to critical resources as high resistance, and conversely, areas where species can move more freely, find essential resources, and are more distant from environmental pressures as low resistance. In this way, regions restricting species movement act as ecological barriers [8,13]. In this way, SDMs link a species’ ecological requirements and landscape features, ensuring that identified corridors are ecologically meaningful and suitable for conservation planning. Maximum entropy modeling (MaxEnt) is widely used for many different purposes, such as conservation planning of wildlife species, determining the potential distribution of endangered species, and determining the effects of climate change on species’ habitats [16,17]. The maximum entropy method has also recently begun to be used in wildlife studies and planning in Türkiye [18,19,20].
Türkiye is the only country with three of the world’s 34 biodiversity hotspots (Euro-Siberian, Irano-Anatolia, and Mediterranean) with a rich ecology hosting approximately 10,000 plant species and 80,000 animal species [21,22]. In addition to Türkiye, India is another biologically rich country that spans four global biodiversity hotspots. These regions are recognized for their exceptional levels of endemism and species richness, making both countries critical for global biodiversity conservation efforts [23]. Other countries that similarly host multiple biodiversity hotspots include Indonesia, Brazil, China, and Malaysia, highlighting their global significance in preserving ecological diversity. In this context, it is important to note that the ratio of protected areas to the total surface area in Türkiye is currently 8.69%, with approximately 13.2% of the country’s land designated as protected areas [24]. While the Aichi 2020 Targets recommend the protection of 17% of the world’s land areas, the Aichi 2030 Targets recommend the protection of at least 30% of the world’s terrestrial and inland water areas in an ecologically representative, well-connected manner [25]. This being the case, it is known that protected areas and their management and planning are inadequate to represent the rich diversity of species, habitats, and ecosystems in Türkiye. Existing protected areas in Türkiye are exposed to non-purposeful uses such as mining and energy and are managed in a wood production-centered manner, ignoring wildlife and biodiversity. Wildlife species in these areas, which are currently threatened by various uses, are also negatively affected by habitat fragmentation. In Türkiye, protected areas generally do not have adequate management plans, but management plans, especially in areas that are critical in terms of biodiversity, need to be better prepared, implemented, and evaluated, and this will be possible by better assessing and analyzing the demands of wildlife species [22].
Protected areas concerning wildlife from the protected area statuses in Türkiye are called National Parks and Wildlife Refuges. Wildlife Refuges are defined as “areas where game and wild animals and wildlife are protected and developed, game animals are settled, measures are taken to improve the living environment, and hunting can be done within the framework of a special hunting plan when necessary.” There are 85 Wildlife Refuges in Türkiye, 4 of which are located in Kastamonu. Although the Ilgaz Mountain Wildlife Refuges and the Gavurdağı Mountain Wildlife Refuges in Kastamonu are located on the foothills of the same mountain, and animals actively use both areas, they have different management and planning. Apart from the division, road, mining, and forestry works and other plans carried out in the area have caused habitat fragmentation and seriously negatively affected species’ passage [26,27]. The study emphasized the potential existence of an ecological corridor for wild animals between these two areas and aimed to guide the incorrectly implemented wildlife planning and species and ecosystem protection efforts in these two areas. There are a limited number of studies on corridor ecology in Türkiye [20,28,29].
This study, conducted between 2021 and 2023 in the Kastamonu Ilgaz and Gavurdağı Wildlife Refuges located in the Black Sea Region of Türkiye, aimed to identify and evaluate wildlife ecological corridors between two protected areas for five large mammal species (brown bear (Ursus arctos), red deer (Cervus elaphus), roe deer (Capreolus capreolus), wild boar (Sus scrofa), and gray wolf (Canis lupus)). Ecological modeling and Circuit Theory were applied using presence data collected through indirect observations (e.g., tracks, scat, hair, scratch marks, feeding signs, nests, and bedding areas) during transect surveys, as well as camera trap images. The study also represents the first detailed effort in Türkiye to detect wildlife corridors connecting two protected areas, with the broader goal of supporting habitat connectivity and informing conservation planning for wide-ranging species.

2. Materials and Methods
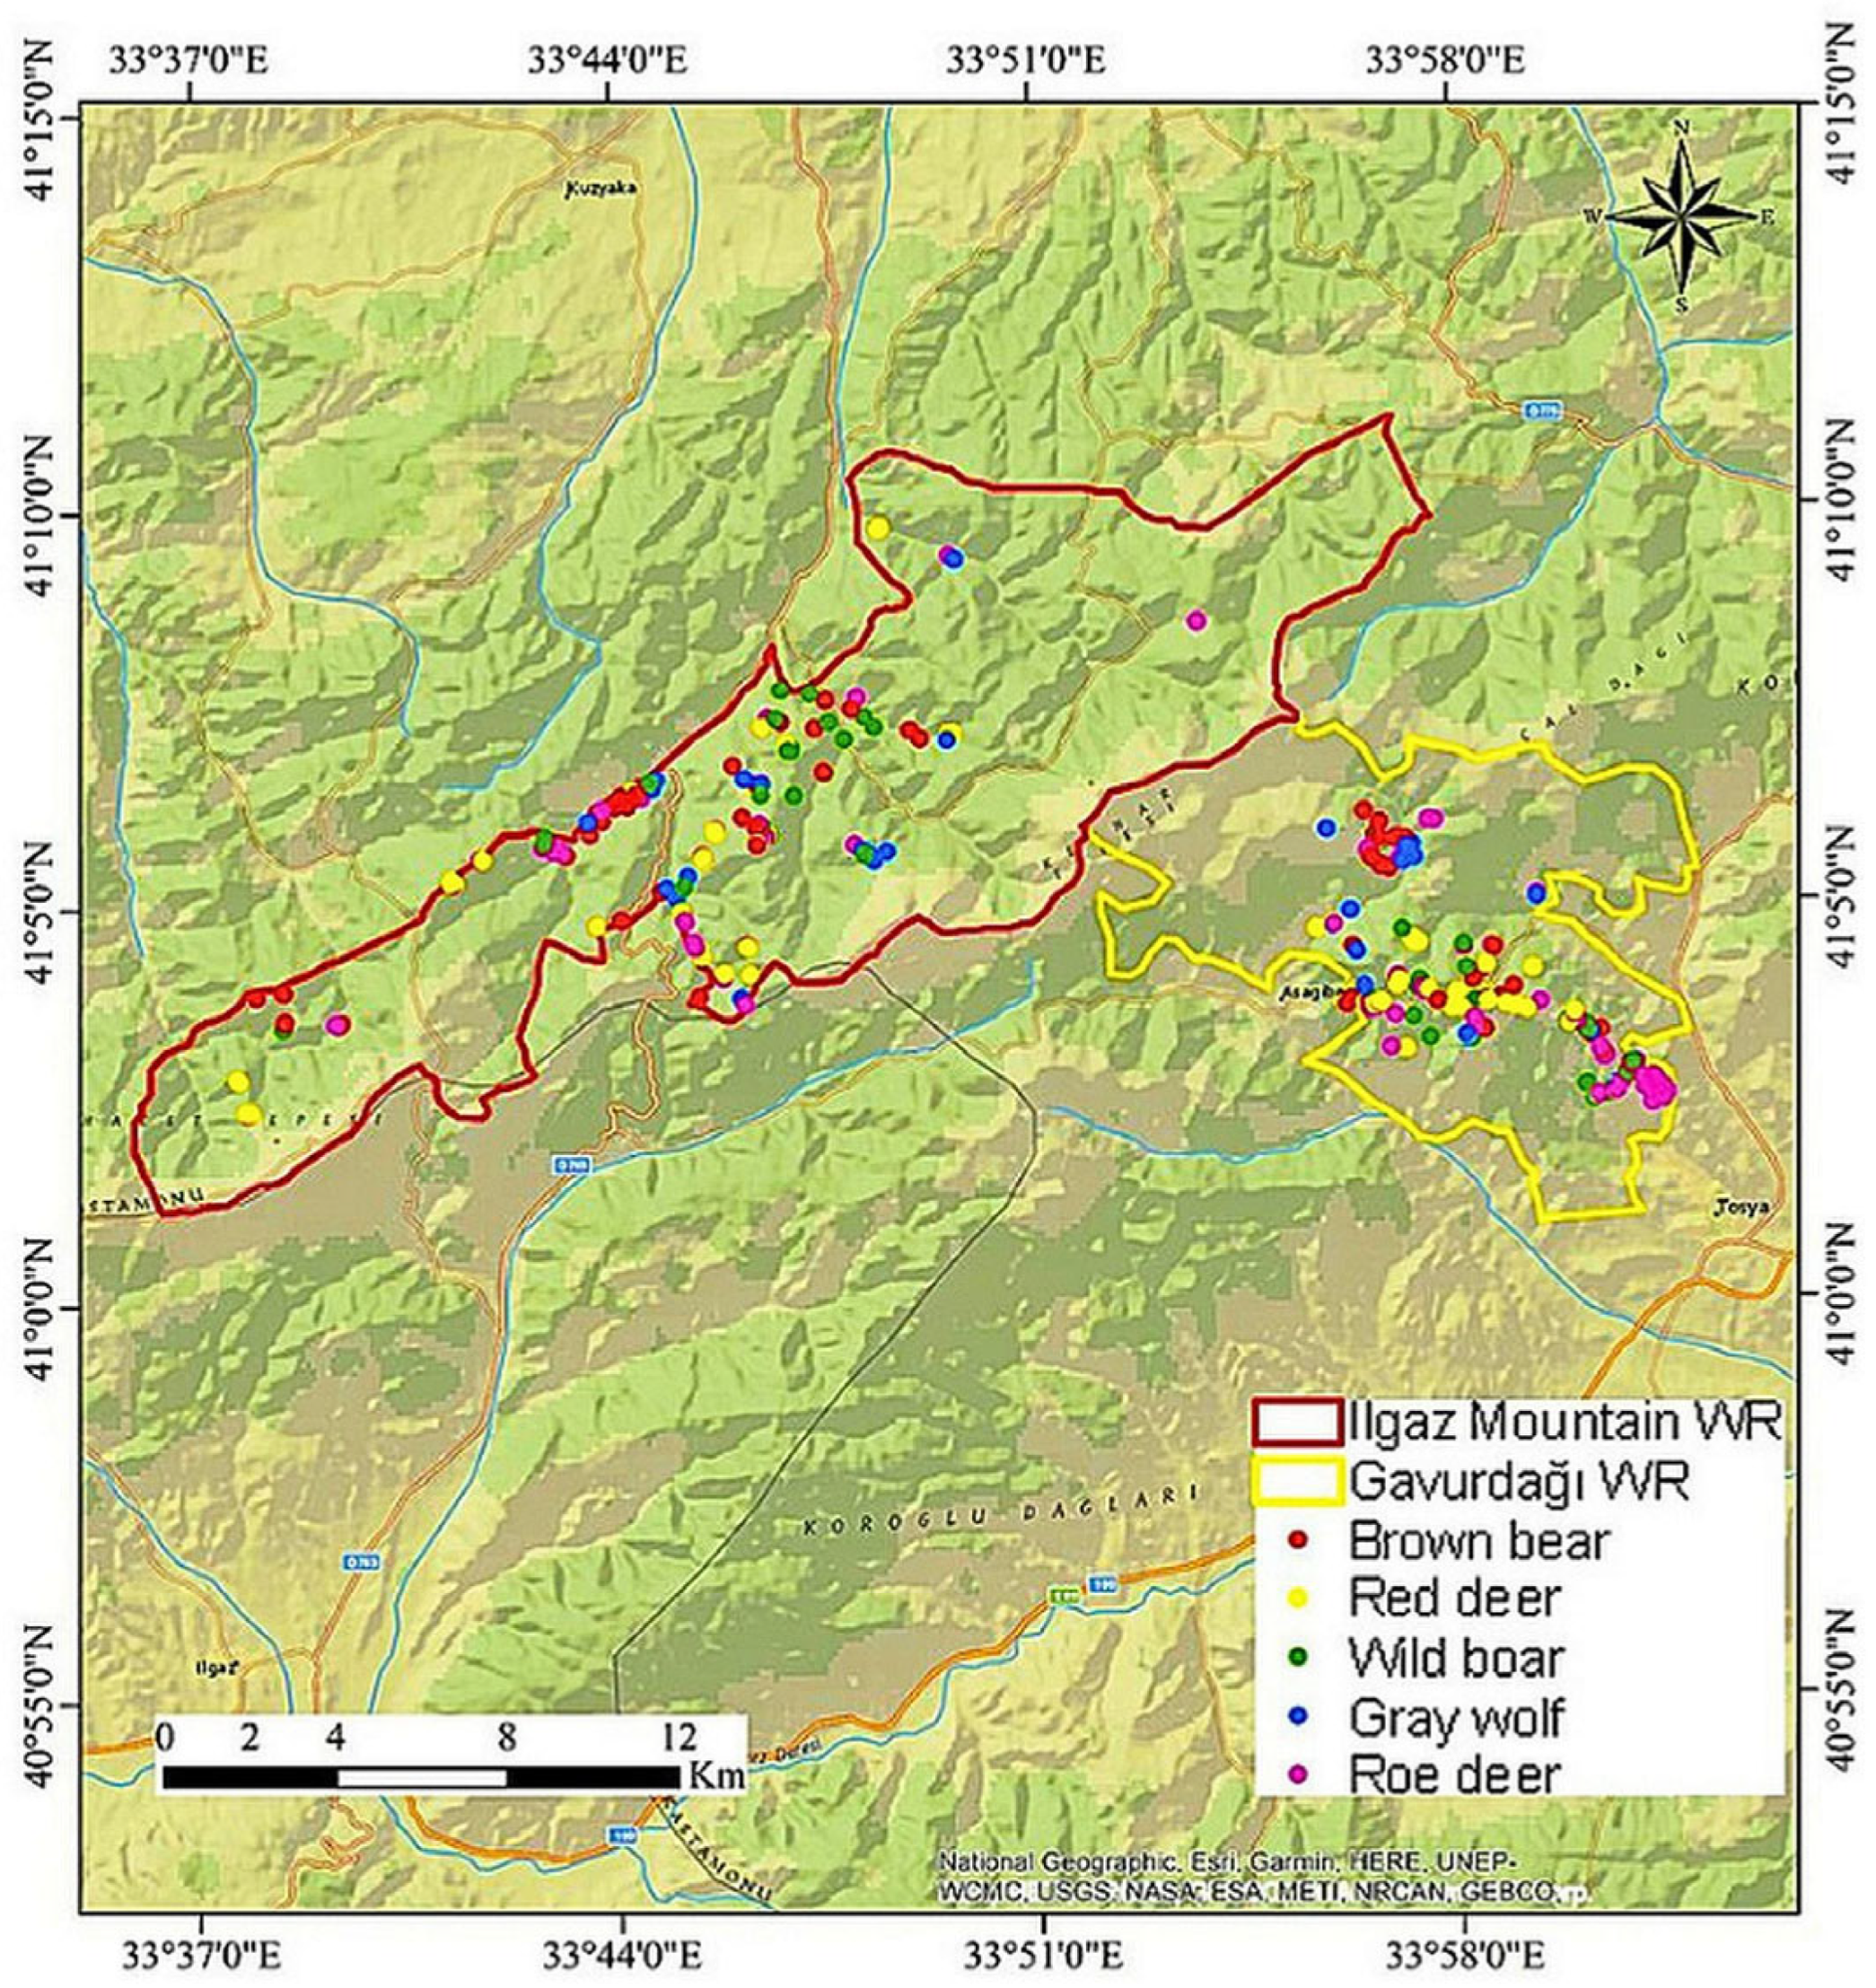
2.1. Study Area

The study area includes two important wildlife refuges, Ilgaz Mountain WR and Gavurdağı WR, with a total area of 263.42 km2 located in Kastamonu province. Ilgaz Mountain WR is located within the borders of Kastamonu province and İhsangazi district. Its total size is 170.81 km2. The elevation ranges from 1400 to 2587 m. Büyük Hacet Hill (2587 m) is the summit of Ilgaz Mountain. The area generally has an oceanic climate, with hot and dry summers and cold and rainy winters. Precipitation occurs as rain in the spring and summer months and as snow in the winter months. It contains two important areas in terms of biodiversity: Ilgaz Mountain WR and Ilgaz Mountain National Park. Ilgaz Mountain WR and Ilgaz Mountain National Park is one of the areas with significant biodiversity in the region. Trojan Fir (Abies nordmanniana subsp. equi-trojani) and Uludağ fir (Abies nordmanniana ssp. bornmuelleriana) are dominant tree species in the region. It is of great importance, as it has the largest distribution area among other fir taxa in Türkiye and forms the richest forests. Scots pine (Pinus sylvestris), Black pine (Pinus nigra), Oriental beech (Fagus orientalis), Hornbeam (Carpinus betulus), and Oak species (Quercus petraea, Quercus robur) are distributed in the Ilgaz Mountain WR. Ilgaz Mountain WR includes 77% of forest area [26].
Gavurdağı WR is located within the borders of Tosya (one of the districts of Kastamonu province), totaling 92.62 km2. The elevation ranges from 1040 to 2380 m. Transportation is complicated by unpaved roads due to their rugged, sloping, and fractured terrain. The slopes overlooking the Ilgaz-Hacet Hill section are especially inaccessible in winter. Since the study area is in the transition zone, both Continental and Black Sea climates dominate. Summers are mild; winters are cold and rainy. Precipitation is in the form of snow and rain. In terms of forest ecosystems, Black Pine, Scots Pine, Fir, Oak species, Willow species, and Dwarf Juniper are distributed in the region. Gavurdağı WR includes 75% of the forest area [27].
Ilgaz Mountain WR and Gavurdağı WR are two adjacent areas. Also, it hosts many wild animals such as Eurasian lynx (Lynx lynx Linnaeus), red fox (Vulpes vulpes Linnaeus), golden jackal (Canis aureus Linnaeus), Eurasian badger (Meles meles), European hare (Lepus europaeus), marten (Martes sp.), Anatolian squirrel (Sciurus anomalus), and European wild cat (Felis silvestris) [26,27,30]. Wild animals can benefit from many large and small streams in the area. These streams are constantly flowing in summer and winter. The study area is given in Figure 1.

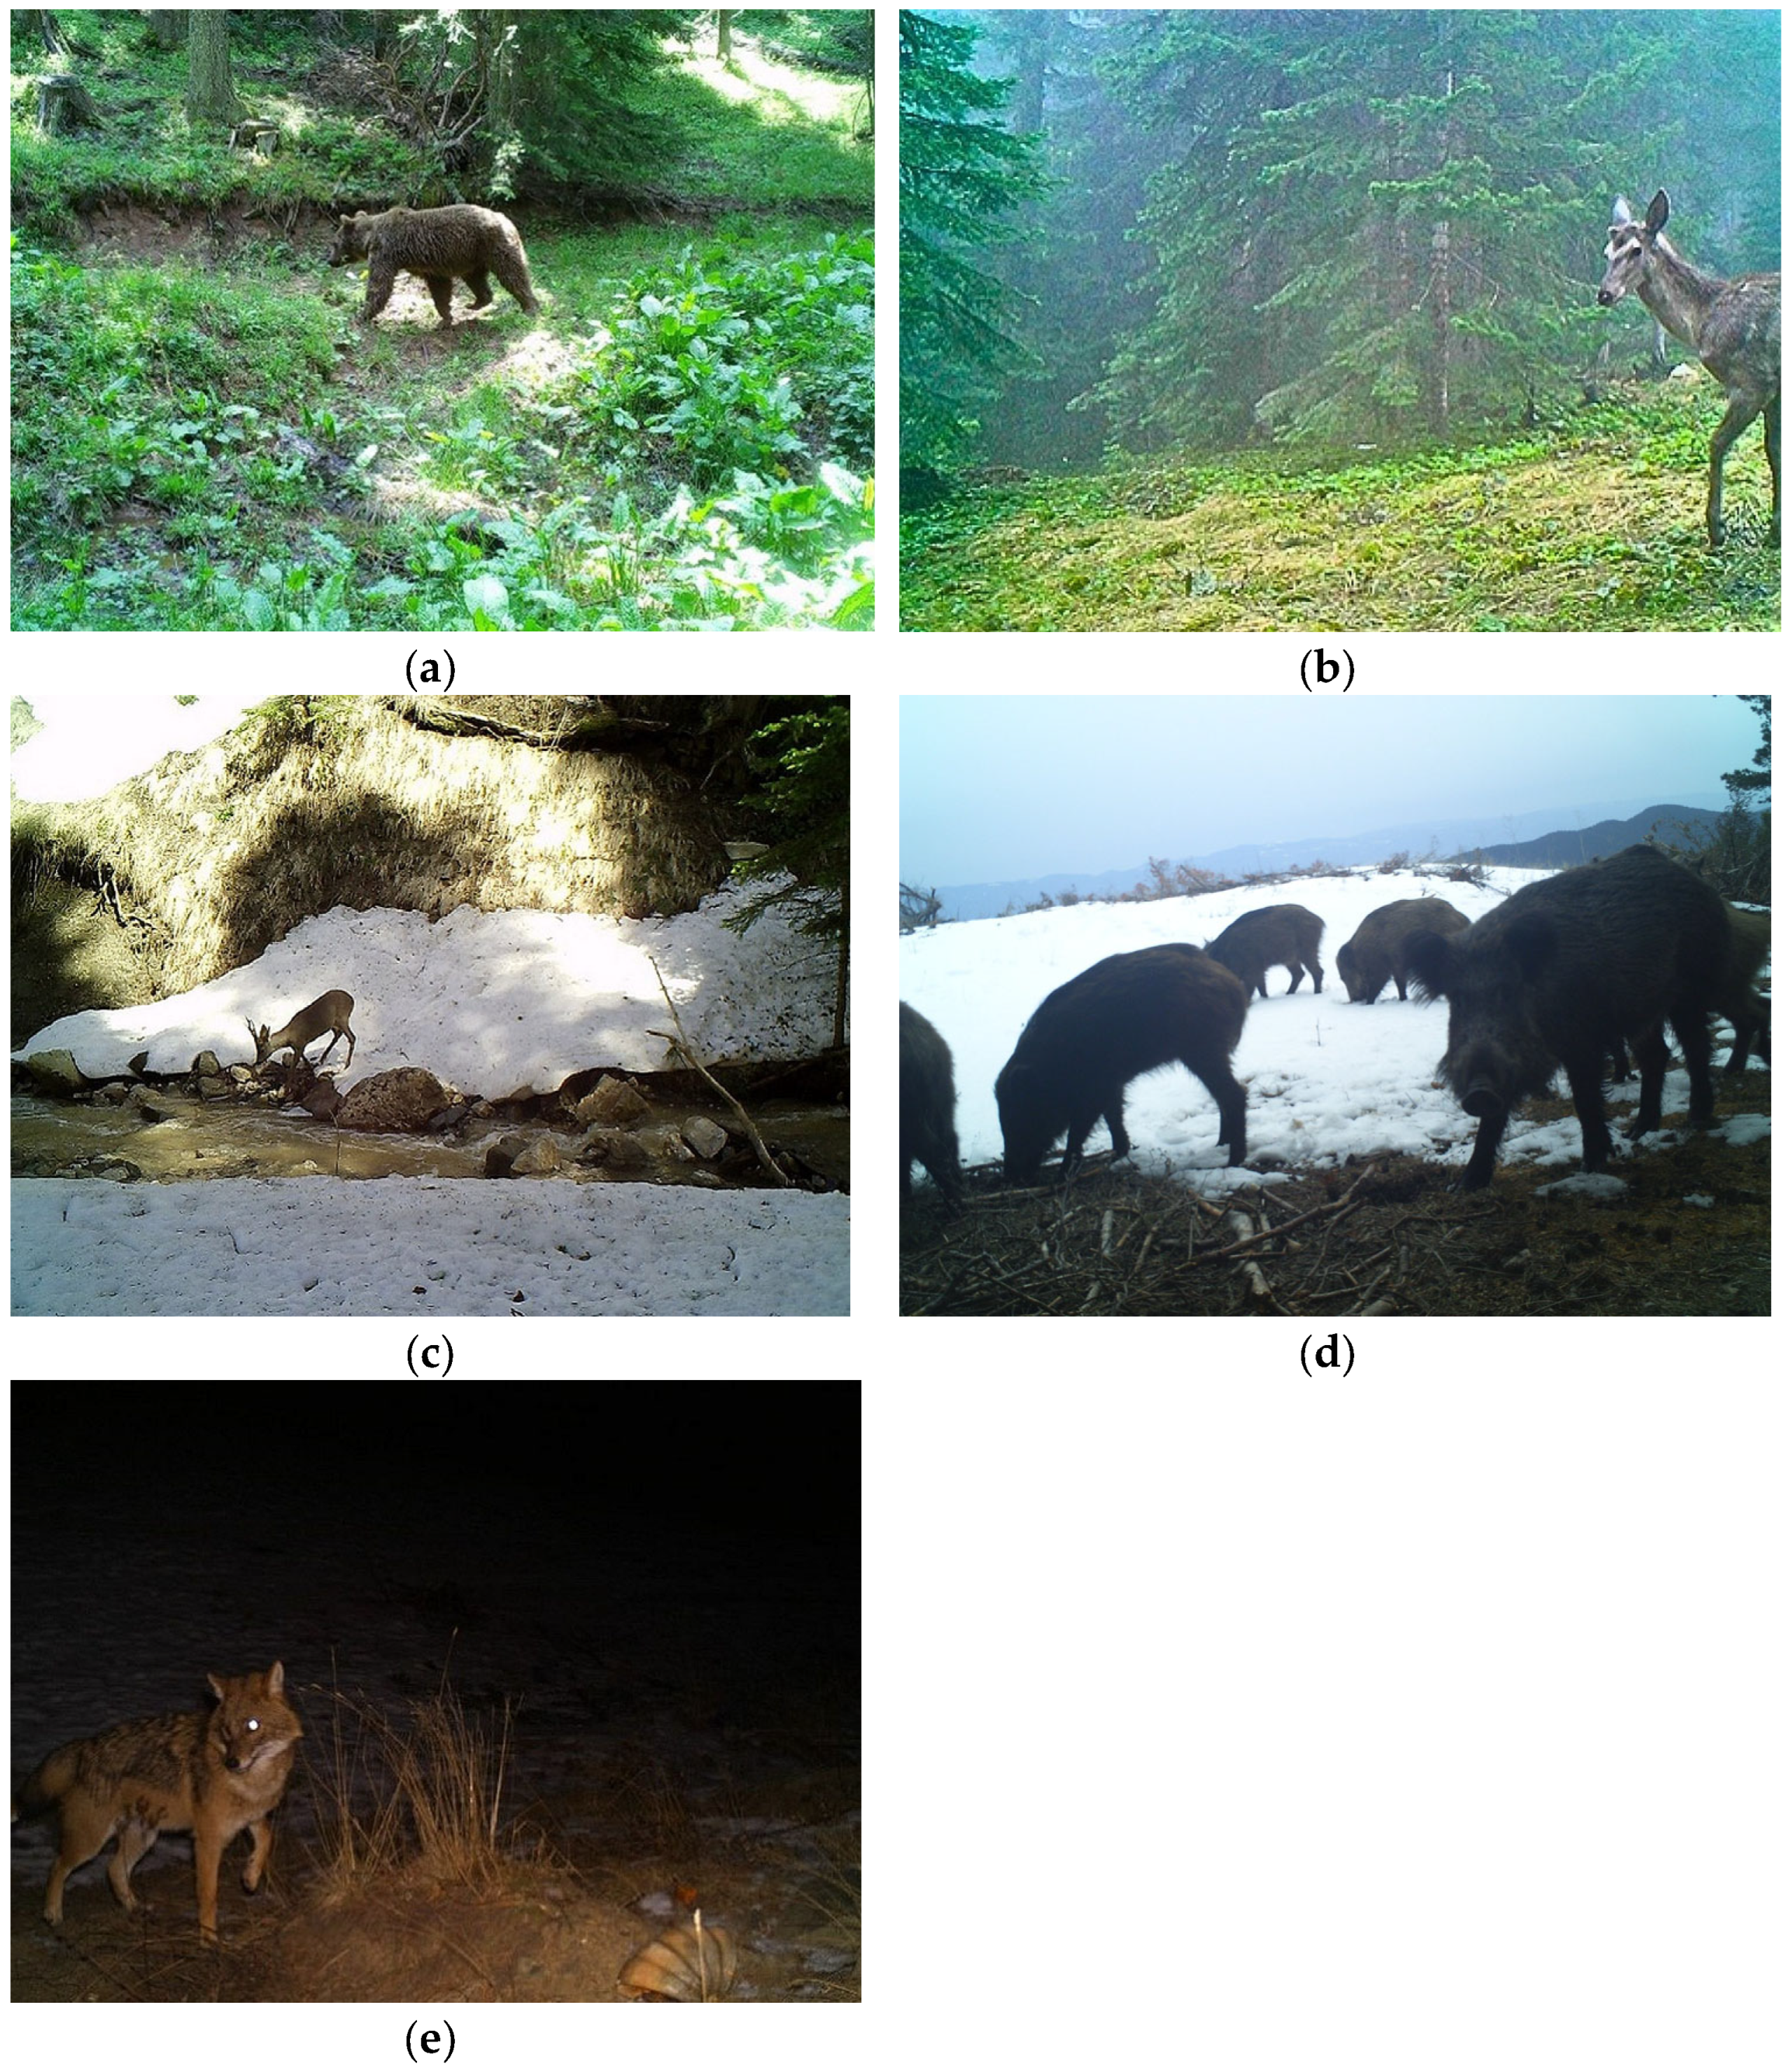
2.2. Determination of Species

We selected five large mammals distributed in the study area: Brown bear, roe deer, red deer, gray wolf, and wild boar. The reason for choosing these species is the previous inventory [26,27] and literature studies [30,31,32] and the investigation of habitat preferences of wild animals and their dispersal abilities in ecological corridors. Baguette [33] broadly defines dispersal as the movement of individuals (or propagules in plants) from their place of origin or natal area to another location where they settle. This can include reproduction sites, areas for establishing new populations, or places to access different resources. Large mammals move using ecological corridors to access various food sources and to perform migration and dispersal behaviors in order to survive [34]. Determining ecological corridors and connectivity networks in an area can contribute to determining corridors and distribution areas for target species and other species distributed in the study area. In this context, the five large mammal species (brown bear, grey wolf, red deer, roe deer, and wild boar) were selected as umbrella species, as they can serve to represent and protect other species across the landscape [35,36]. These species were chosen based on their ecological roles within the ecosystem, their wide-ranging behavior, and their ability to represent diverse habitat types across the landscape. Brown bears and gray wolves were selected as umbrella species due to their wide-ranging habitat requirements and strong influence on landscape-level connectivity [37,38]. Red deer and roe deer function as indicator species, reflecting habitat quality and vegetation structure [31,39]. Wild boar was included for its role in ecosystem functioning and its adaptability across different habitats [40]. Additionally, these species represent different trophic levels and movement behaviors, contributing to a more robust and multi-scale corridor assessment. Their habitat use overlaps with many other wildlife species, allowing for effective conservation planning through the identification of corridors that benefit a wider range of species [20].
In this context, by prioritizing corridors that meet the needs of wide-ranging taxa, conservation efforts are more likely to meet the ecological needs of many other, less mobile or data-poor species. Corridor designs that accommodate these umbrella species can help ensure that the landscape maintains the structural and functional connectivity needed for a broader group of wildlife [35,36].

2.3. Occurrence Data

Field studies were carried out in Ilgaz Mountain WR and Gavurdağı WR between 2021 and 2023. The presence data evidence was formed in two categories: (1) camera closure using “on camera” and (2) opportunistically “off camera”: direct observations and animal track recording [41]. A total of 74 transects, each 100–150 m long and 3 m wide on each side, were walked for indirect and direct observation. In addition to the species directly observed, signs such as tracks, breeding tracks, and other traces were collected, and their coordinates were recorded via GPS. Field studies were carried out in 2–3 week periods for direct and indirect observation by separating them seasonally. For indirect observation methods, Murie & Elbroch’s [42] Field Guide to Animal Tracks was used, and a variety of animal tracks were recorded, including tracks, hair, gnaws, and feces. A total of 808 records were obtained for 106 bears, 196 roe deer, 348 red deer, 50 grey wolves, and 108 wild boars (Figure A1).
The recorded occurrence points were converted into CSV format for modeling. To minimize spatial autocorrelation and reduce sampling bias, spatial filtering was applied prior to model development. This process ensured spatial independence among presence records and improved model reliability [43]. Additionally, to clearly detect animal species with dense tracks and traces through indirect observation and to identify other species found in the field, a total of 54 camera trap stations were established on forest roads, water sources, and at animal crossing points used by animals for passage. The camera traps were hung on trees at appropriate heights (approximately 50–60 cm) according to the topographic conditions of the field, and a hybrid camera trap (Bushnell HD trail camera) with both photo and video features was used [19,20]. With these cameras, species that appear as ghost images that cannot be sufficiently determined in photographs can also be identified with video. In addition, the trigger period between consecutive events was set to the lowest possible level, and all cameras were set to take three consecutive images for each trigger event [44].
Batteries and memory cards were changed every 21–45 days depending on seasonal conditions. The camera traps remained in the field for 1 year. A total of 2880 camera trap days and 8756 photographs and video recordings were obtained. When activities other than wild animals (triggers caused by humans, farm animals, or windy weather) were excluded, a total of 4669 photographs and video storages remained. A total of 1798 captures of 5 species were obtained in the Ilgaz Mountain WR in 27 stations. Representative photos of the five large mammal species observed in the study area are shown in Figure 2. The most frequently observed species were roe deer (448 captures) and red deer (416 captures), while the least frequently observed species was the gray wolf (254 captures). Similarly, a total of 1578 valid captures were obtained in 27 stations in the Gavurdağı WR. The most frequently observed species were brown bear (387 captures) and wild boar (454 captures), while the least frequently observed species was gray wolf (158 captures).

2.4. Ecological Variables

Ten different ecological variables were used for modeling studies. These are grouped into three categories: topographic variables (elevation, aspect, slope, solar radiation, ruggedness, hillshade), environmental variables (distance to road and water sources), and stand variables (stand type and closeness). Stand types are grouped into eight categories. It is represented as 1: Pure coniferous, 2: Pure broad-leaved, 3: Coniferous-leaved, 4: Broad-leaved-coniferous, 5: Coniferous-coniferous, 6: Broad-leaved-Broad-leaved, 7: Degraded stand, 8: Non-forested area. Since there is no active human settlement in the study area, it was not used as an ecological variable [26,27].
Environmental variables are frequently used in creating resistance surface maps: topographic structures (slope, aspect, and elevation), environmental factors, distance factors (water and road), landforms, and settlements [13,34,45,46]. Unlike other studies, we used standard parameters (stand type and crown closure). A digital elevation model (DEM) was generated using the contour lines of the study area. Scaled maps of 30 × 30 m environmental variables were obtained using geographic information system (GIS) analysis in ArcMap (v. 10.8) software. All rasterized base maps were cut to the scale of the study area and converted to ASCII (American Standard Code for Information Interchange) format for use in the MaxEnt (v. 3.4.1) software. Determination of wildlife ecological corridors consists of two stages. These are habitat suitability modeling and ecological corridor modeling.

2.5. Habitat Suitability Model Development

Species distribution models (SDMs) are one of the important tools used in wildlife management, planning, and conservation studies today [47,48,49]. SDMs are powerful tools used to predict and map the temporal and spatial distributions of species by combining species data with environmental variables [50,51]. In modeling, species presence/absence data and generally topographic and climatic variables are preferred as environmental data [52,53]. Other SDMs have also been developed for habitat suitability models [54]. However, the Maximum Entropy Model (MaxEnt) is the most popular among these models due to its ease of use, ability to map distributions, and ability to explain the effects of variables on distributions with high prediction accuracy [55].
We used the MaxEnt (v. 3.4.1) entropy modeling approach, a machine learning technique, to build habitat suitability models for five large mammals. The MaxEnt model is mainly used in species distribution modeling studies using only presence data and non-biological environmental factors. For this reason, it is thought to be more successful than other modeling methods [56,57].
Base maps of environmental variables are required to use this software. For this reason, base maps of ten ecological variables were created using ArcGIS, and the data was then converted into a format that can be read and analyzed by the program. Ecological variable selection is important in modeling. It is recommended not to include all variables, to keep statistically significant variables, and to eliminate others [58]. Including all variables can lead to problems such as overfitting, multicollinearity, and reduced model interpretability. Selecting only statistically significant variables is important for predictive accuracy and understanding the individual contributions of ecological variables to the model [59,60].
For this purpose, before modeling, Pearson correlation analysis was applied to prevent the multicollinearity problem that may occur between the 10 ecological variables [61,62]. Based on the Pearson’s correlation analysis (Table A1), variables with a correlation coefficient (r) ≥ ±0.7 were excluded to avoid multicollinearity. Additionally, the ‘road’ variable was removed from the model due to the limited presence of road networks in the largely natural study area and therefore its limited ecological relevance to the species’ distribution. According to the results, 7 variables (slope, aspect, hillshade, solar radiation, ruggedness, water sources, and stand type) were selected and included in the modeling process.

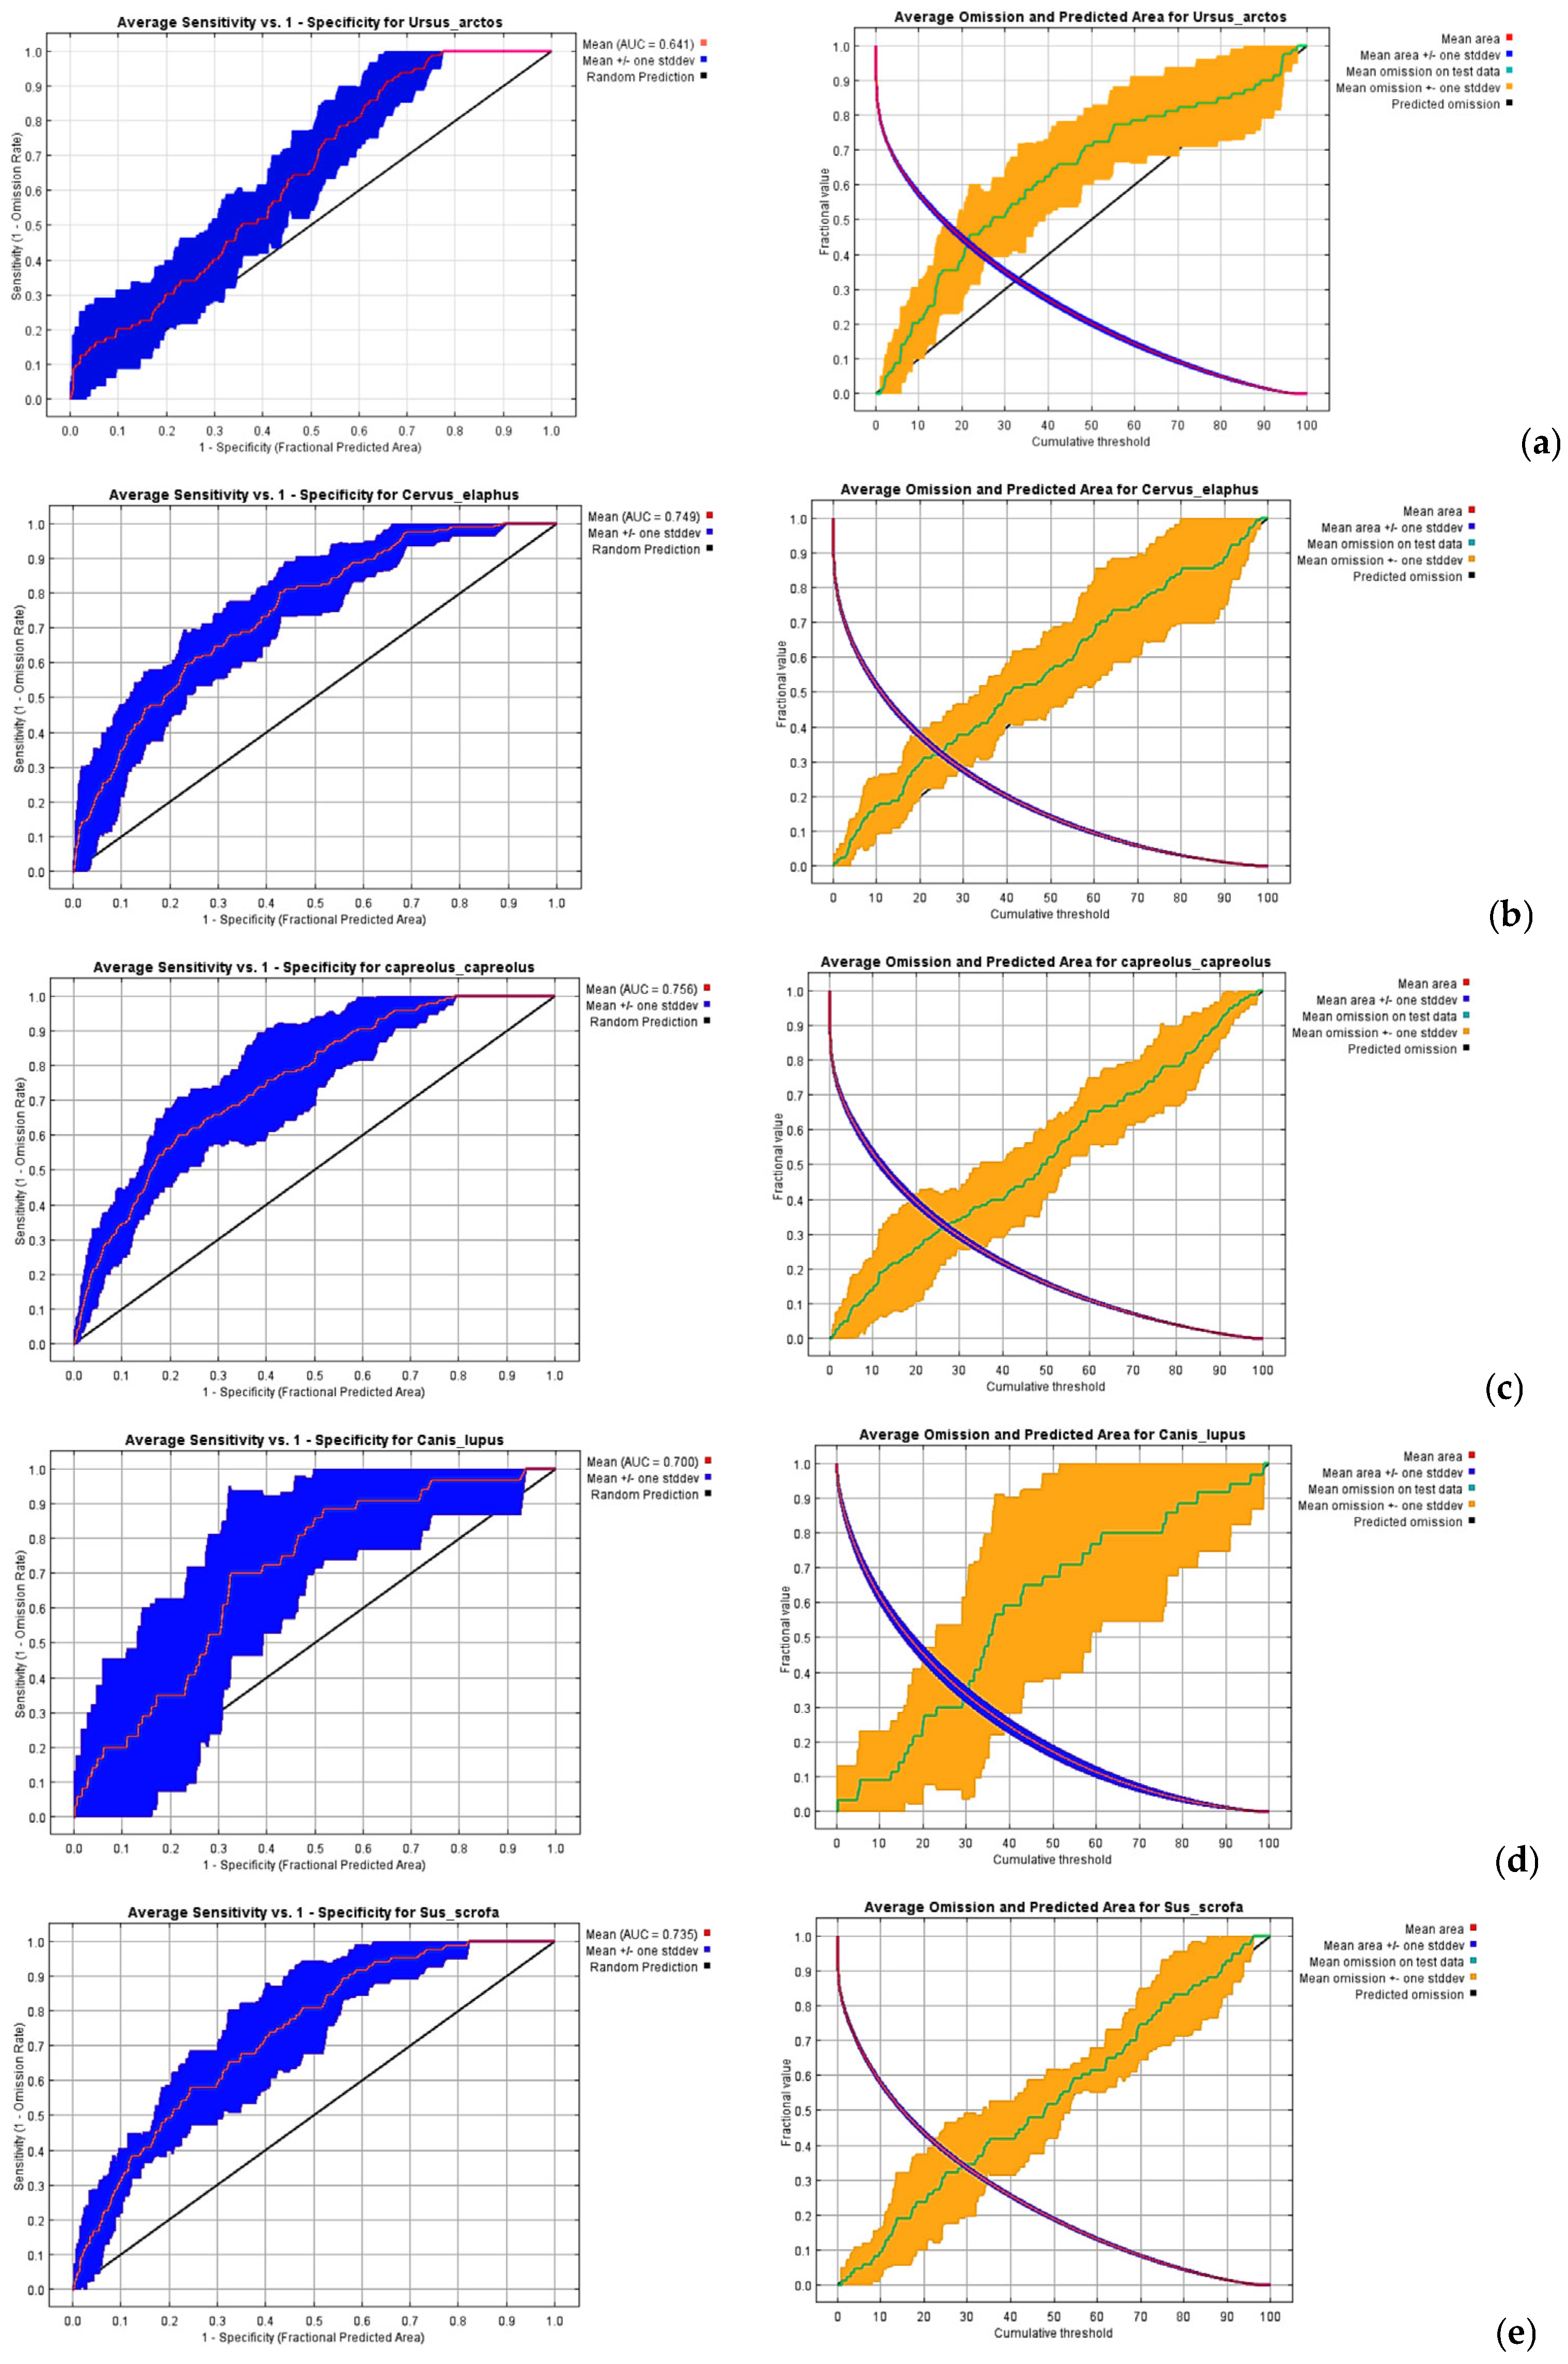
2.6. Model Validation and Analyses

The Jackknife method was used to measure the effects of environmental variables used in habitat suitability modeling [63]. To test the validity of habitat suitability models for each species, 75% of the location point data was selected as the training set, and the remaining 25% was used for validating the Maxent model. Logistic and categoric formats were used as the output formats. The model was run with 10 replicates to achieve the most suitable results. The regularization factor was taken as 1. The outputs were converted to raster format and mapped using ArcMap (v. 10.8) software.
In order to evaluate the accuracy performance of the MaxEnt model, the area under the curve (AUC) obtained from the ROC (receiver operating characteristic) curve is evaluated [64]. AUC is a metric of model fit to distinguish between suitable and unsuitable habitats. We evaluated model performance using the AUC metric. AUC values ranging between 0.7 and 0.9 indicate that the model distinguishes between presences and background points or absences with a high degree of accuracy. When the AUC equals bad (0.5–0.6), average (0.6–0.7), high (0.7–0.8), very high (0.8–0.9), and perfect (0.9–1) [55,58]. In this context specifically, an AUC value of 1 indicates that the model is 100% accurate in distinguishing presence points from random background points or absences. An AUC < 0.5 means that model performance is worse than random, and a value of 0 would mean that the model is completely inaccurate [64,65].

2.7. Circuit Theory Method

We used the Circuit Theory model in conservation initiatives at large spatial scales, as it has become one of the most widely used connectivity approaches [66,67]. This method provides a comprehensive investigation of potential linkage and connectivity variability. The method basically compares the landscape with an electrical circuit. While resistance in the electrical circuit represents obstacles in the path of a moving wild animal, the conductivity of the electrical circuit represents the habitat permeability. The current flowing through the circuit can be used to calculate the movement probabilities of a randomly moving wild animal. A voltage or potential difference estimates the probability of moving animals leaving any point in the habitat and reaching the target before another [68,69,70].
Circuit Theory has been widely applied to ecological network studies [2,34,66,71]. Circuitscape software (Available: https://circuitscape.org) (accessed on 24 May 2024) is capable of efficiently translating spatial data sets into graph structures by converting cells to nodes and connecting them to their neighbors via resistors [8,69]. The resulting maps indicate the current flow at each cell in the landscape. An increase in the flow of the current between habitat patches serves to highlight the areas in which the species are more likely to move. The availability of multiple pathways will facilitate greater connectivity between habitat patches. Areas where current density is high or alternative routes are not available demonstrate pinch points that act as bottlenecks to movement [68,69].

2.8. Connectivity Model Development

We used Linkage Mapper, a geographic information systems tool, to define ecological corridors for five large mammals. Linkage Mapper (v. 3.1.0) is software that analyzes regional wildlife habitat connectivity based on the Circuit Theory approach. This software requires less processing time than other mapping software when working with large datasets [8,69,72]. We used two tools for this study: (1) Build Network and Map Linkages and (2) Pinchpoint Mapper. In order to apply the circuit model in determining ecological connections, two separate core habitat areas were selected in the model input: Ilgaz Mountain WR and Gavurdağı WR. The modeling stage includes determining focal nodes and generating a resistance surface map and pinch points.

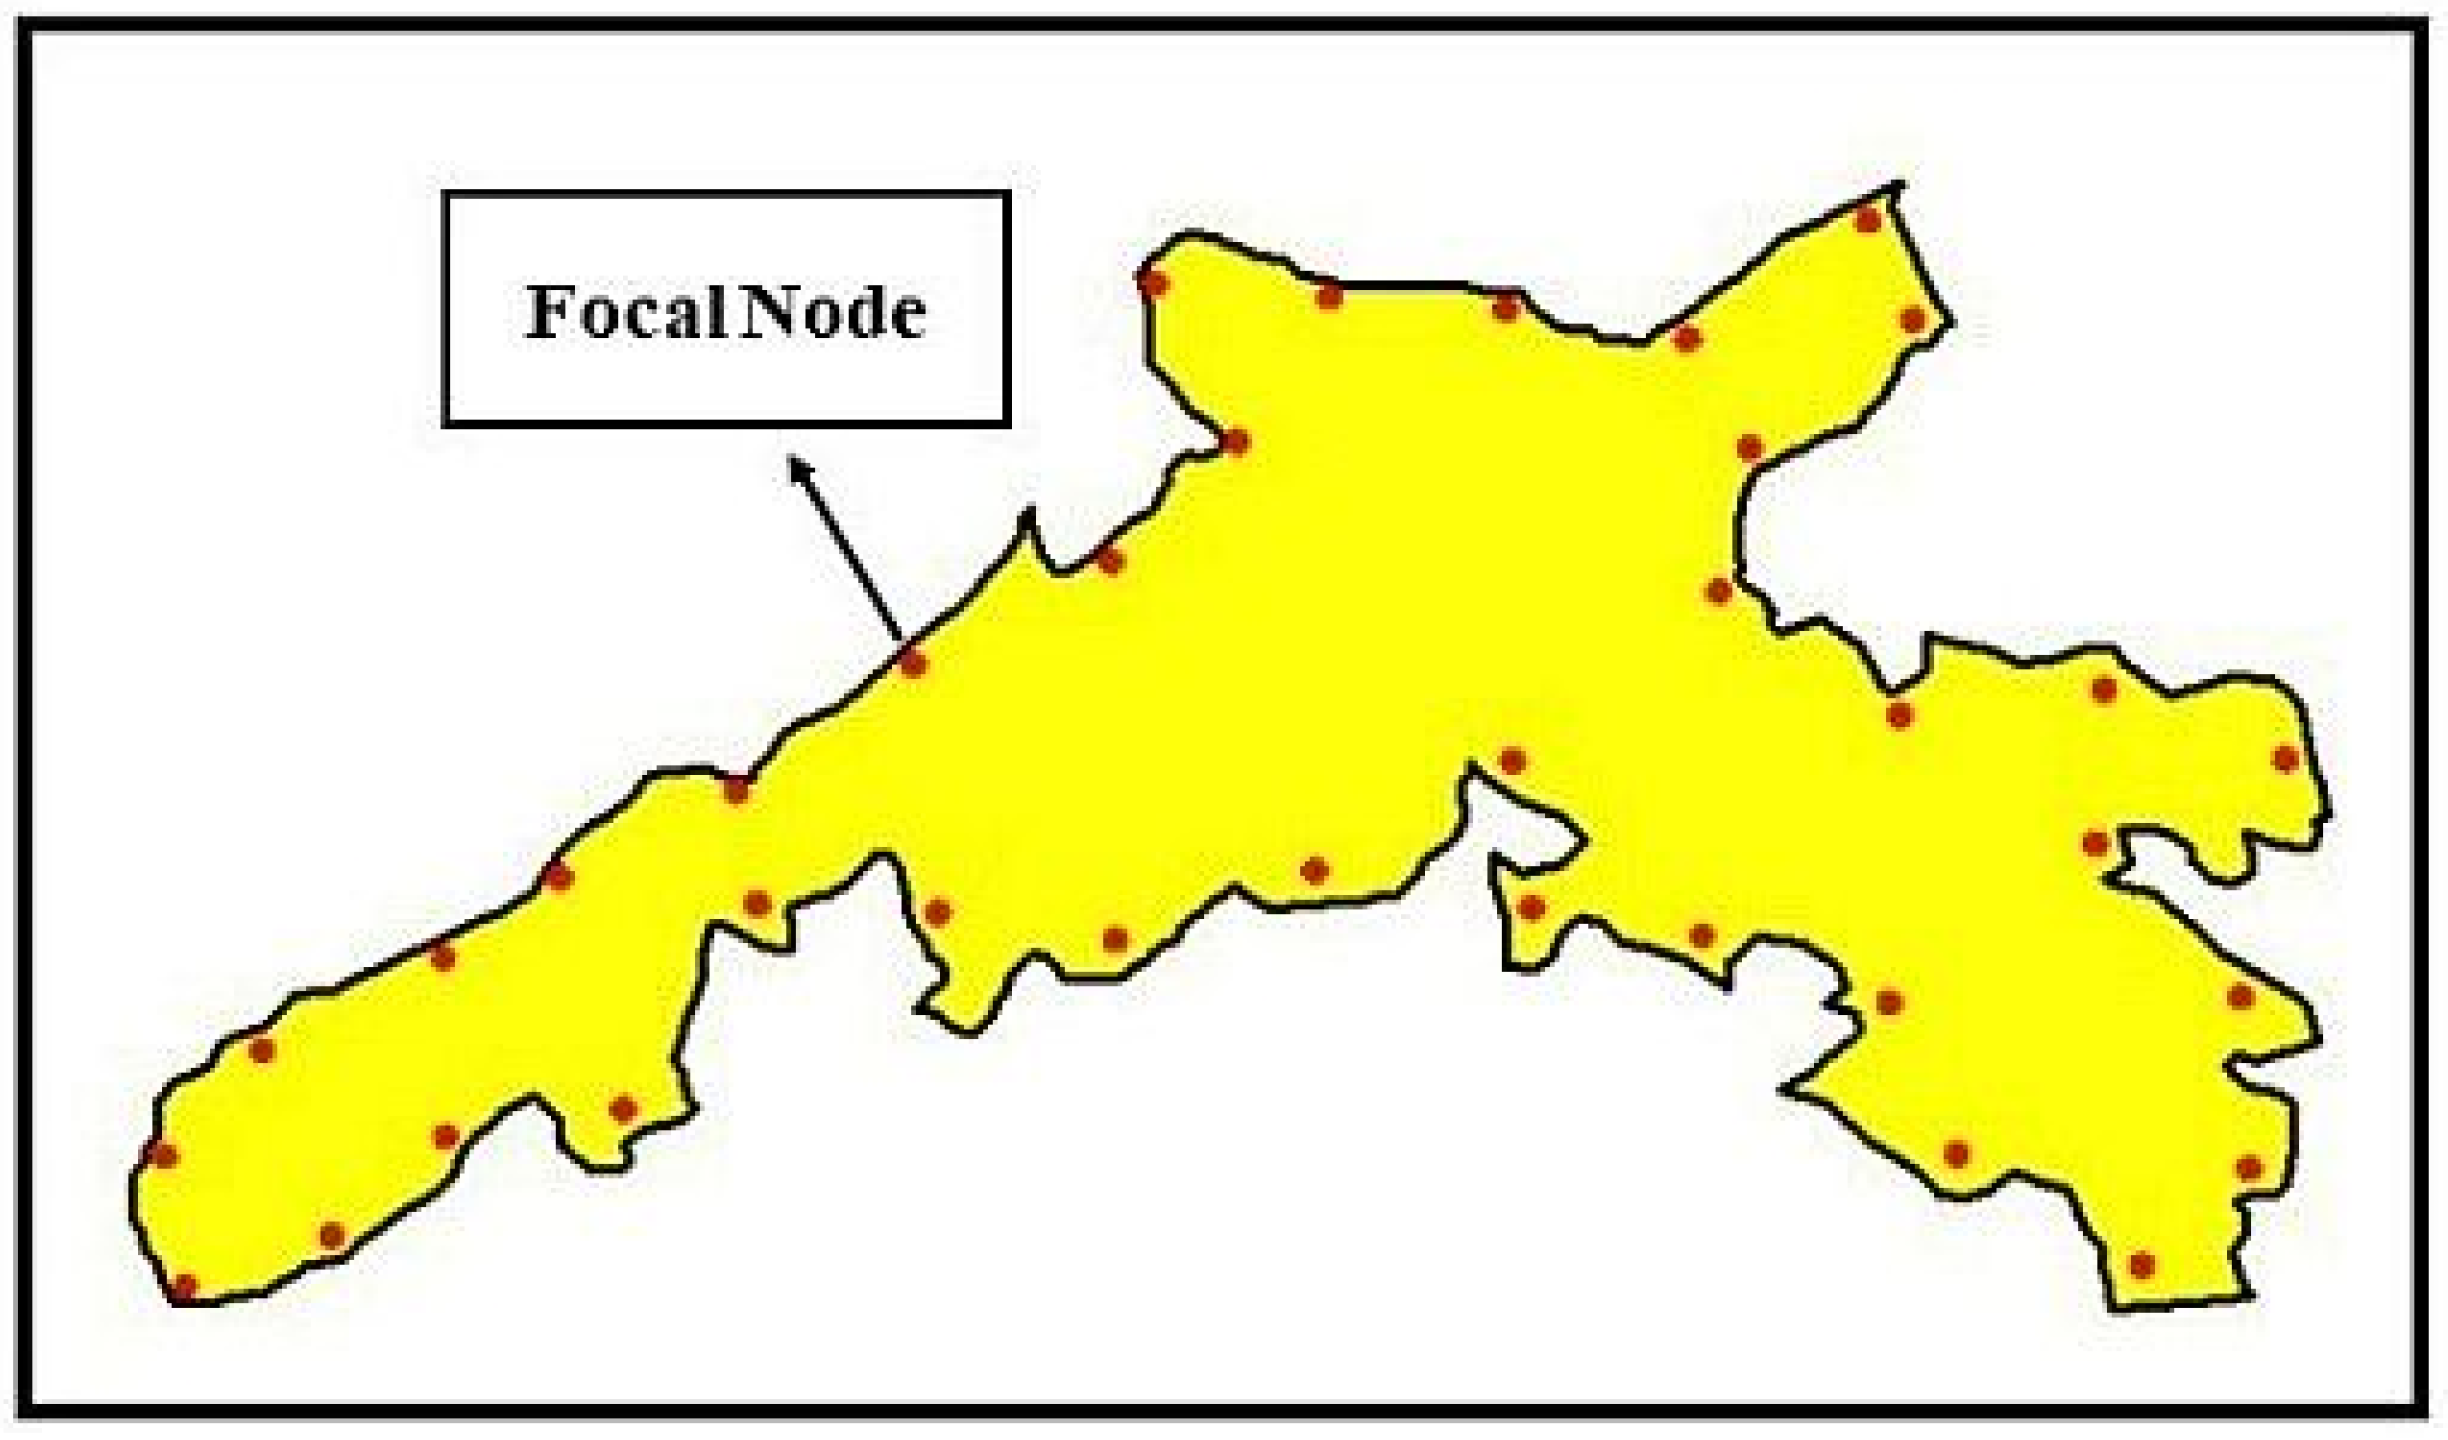
2.8.1. Determination of Focal Nodes

The Circuit Theory approach requires focal nodes to run. Focal nodes enable connectivity flows between important habitat patches to be modeled in circuit analysis [8,68]. These nodes can be considered as the boundary of core areas [73]. In this study, we placed focal nodes along the borders of our defined core areas to ensure that connectivity analyses captured only internal movements of wildlife within the two protected areas (Figure 3). This choice is intended to reflect dispersal patterns, as animals often move inland from the periphery of suitable habitats. Adjacent core areas were identified in the first stage using Create Networks and Map Connections, a toolkit from the Connectivity Mapper Toolbox [74]. It is important to note that spatial manipulation or different selection of core area clusters when identifying focal nodes may affect the predicted connectivity patterns. Future studies could conduct sensitivity analyses by systematically varying the locations of focal nodes and core area boundaries to assess the extent to which these methodological decisions affect the identification of corridors, pinch points, and overall connectivity outcomes [68,69,74].

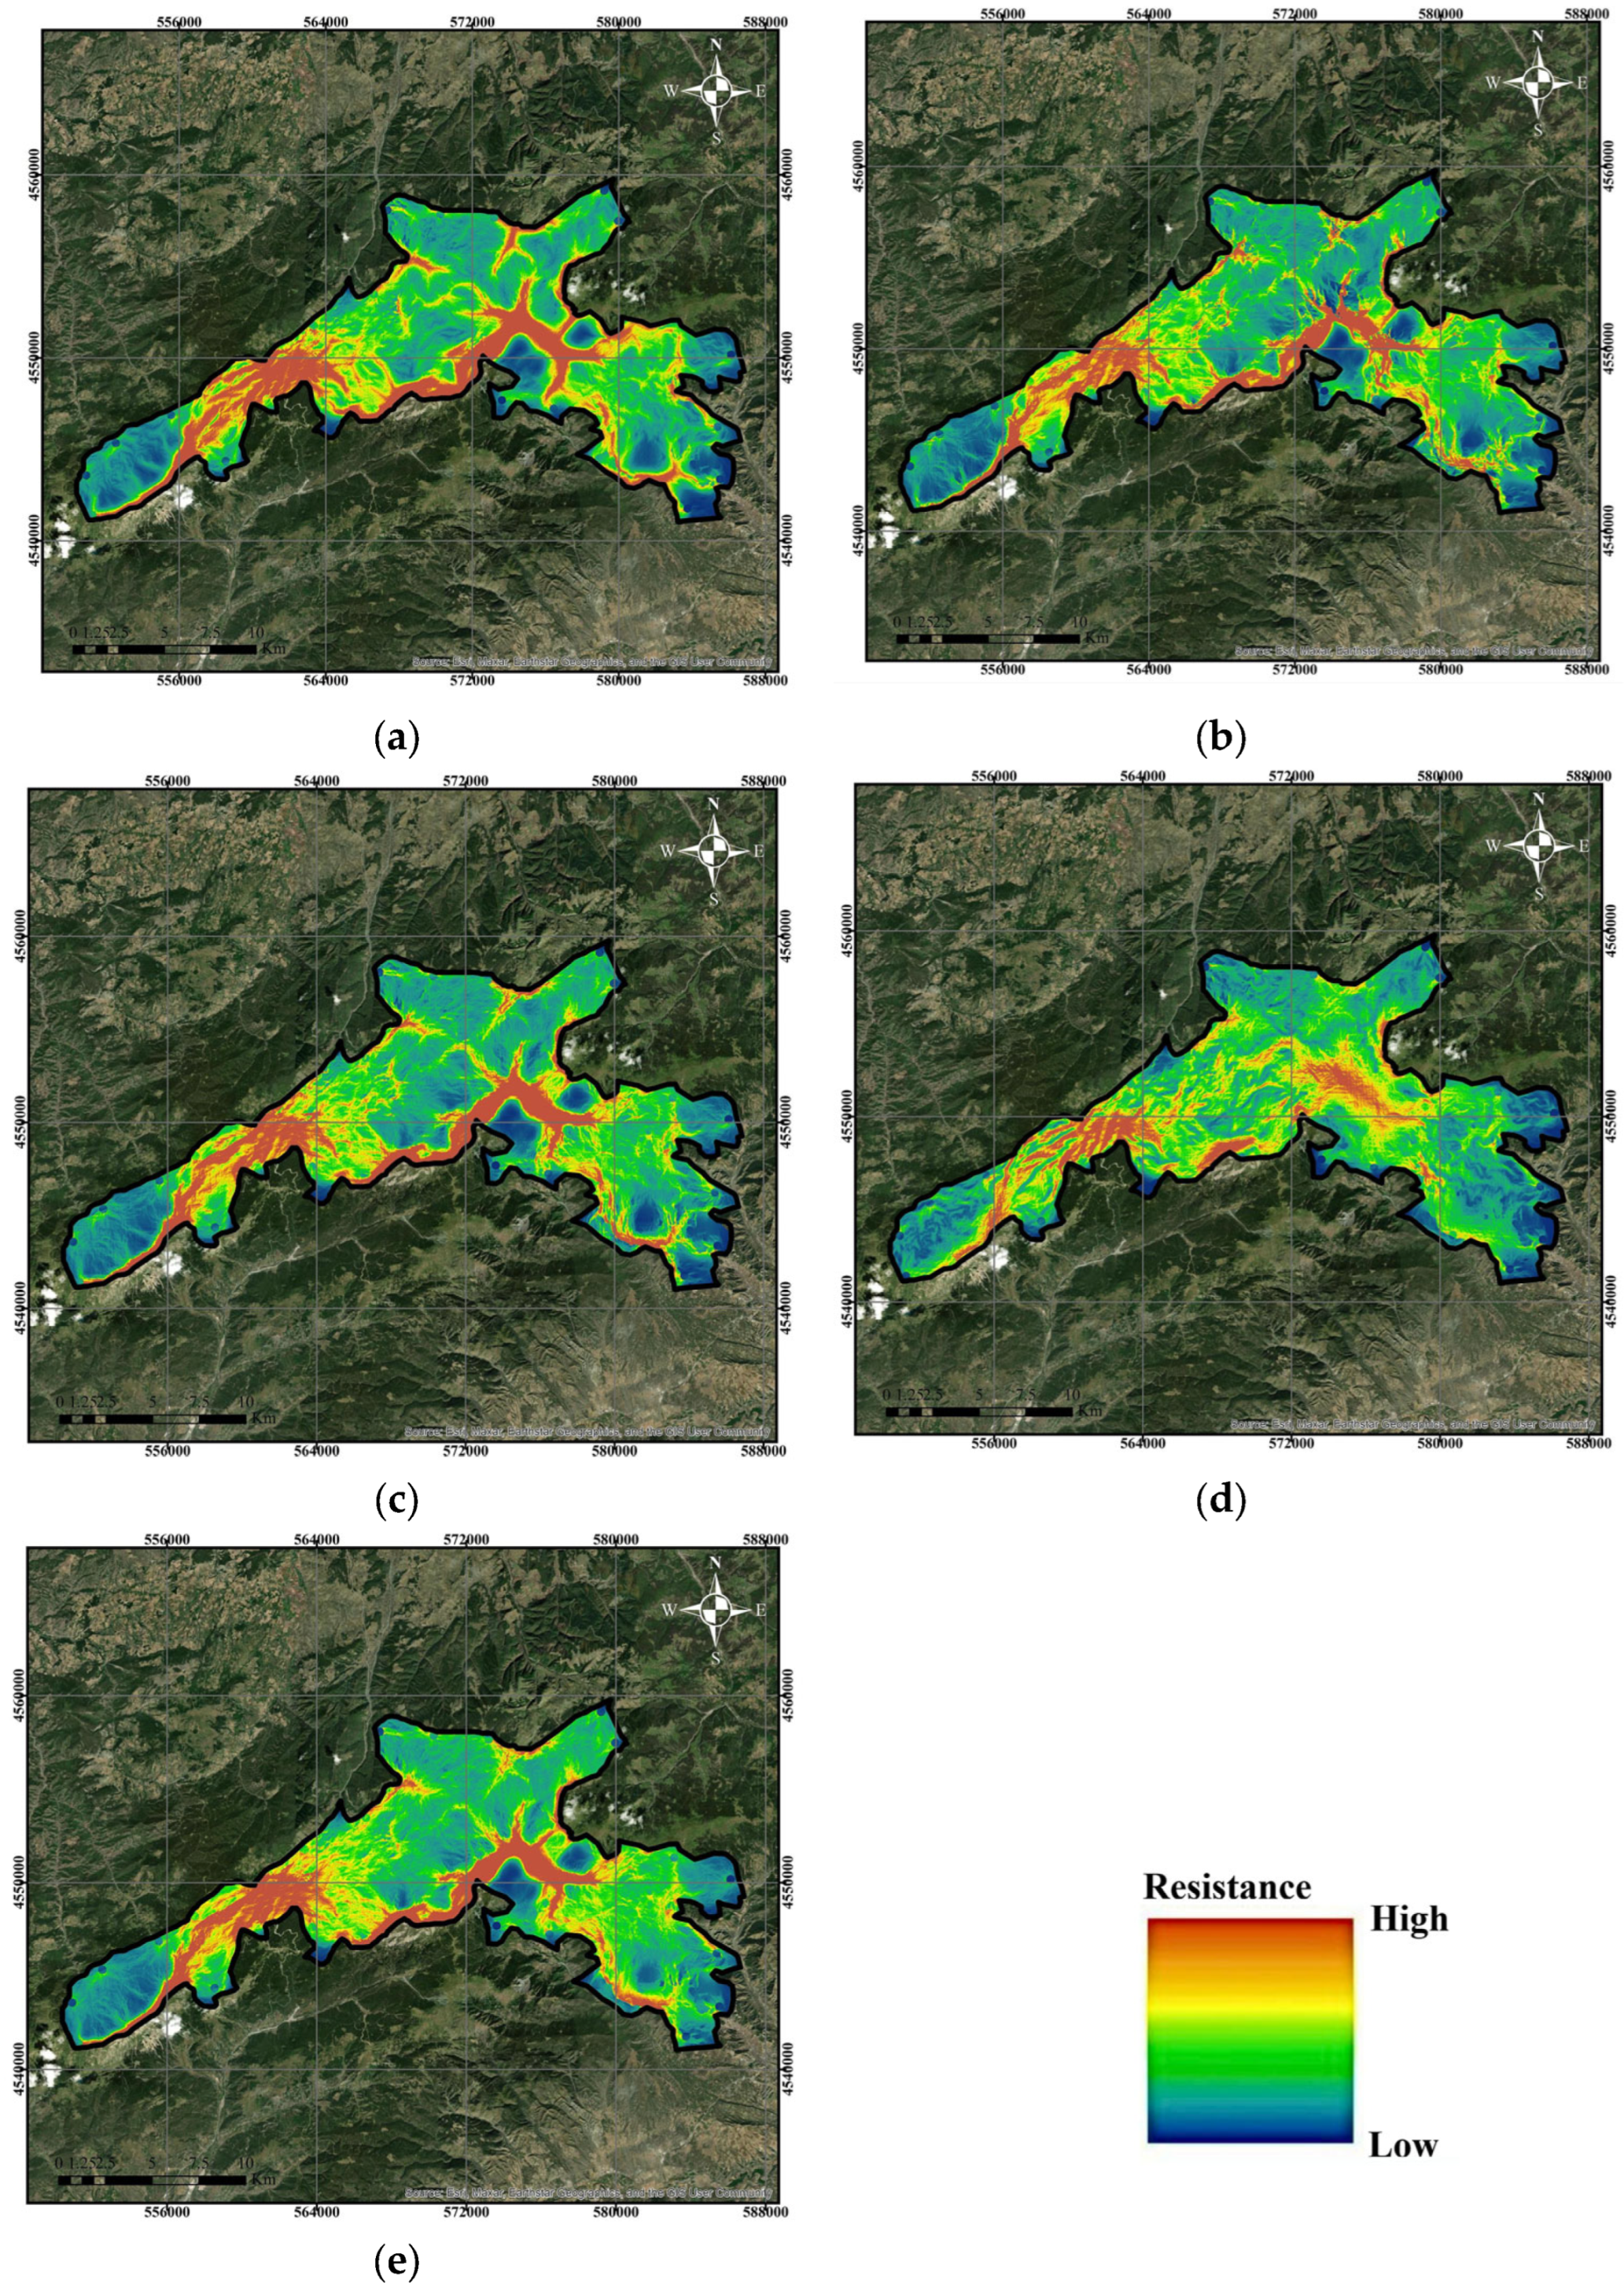
2.8.2. Determination of Resistance Surface

Using resistance surfaces in ecological corridor modeling studies is one of the most preferred methods for estimating inter-patch connectivity [15,75]. Resistance refers to wild animals’ difficulty moving through the landscape. The resistance surfaces of each species in the field vary [45]. While a low resistance value allows the species to move on the land, high resistance causes a decrease in ecological activities such as reproduction, foraging, mating, feeding, and migration that may occur in an area for wild animals [34,66,73]. It also reduces the likelihood of an area being used as an ecological corridor. By removing or improving areas with high resistance, connection between different habitats can be achieved [76,77]. Resistance estimates are often derived from habitat suitability model values because habitat suitability is more accessible to examine than landscape use during dispersal movements [78,79].
In this study, we used the MaxEnt method to create habitat suitability maps, from which we developed landscape resistance surfaces. This method converts areas with higher habitat suitability to lower resistance values, reflecting landscapes that are more permeable to wildlife movement, and inversely [75,78]. Therefore, we determined resistance surfaces from the habitat suitability maps using the MaxEnt method. Corridors are created using the least costly patch. Various types of data can be used to estimate resistance, including presence, displacement, GPS collar, and genetic data [74,79]. Using independent data sources (e.g., telemetry or genetic data) for model validation can increase the accuracy of the results, ensuring that the proposed corridors are ecologically meaningful and useful for conservation planning. Estimating resistance directly from dispersion data is considered the most reliable approach [77,80].
Furthermore, the way habitat suitability values are converted to resistance scores can affect the location of corridors and the determination of connectivity zones. By comparing results using different resistance conversion methods or parameter sets, we can determine how robust the model is to changes in resistance estimates [79,80]. Similarly, changing the core area definitions or weights in the resistance surfaces can also change the results. For example, different assessments of land cover types, road networks, or human impacts can change the location and width of corridor patches [73,81]. Therefore, conducting targeted analyses on factors such as core habitats or infrastructure can help quantify and reduce uncertainties.

2.8.3. Determination of Pinch-Points

Pinch points are areas where strong current flows, which animals use because they cannot find alternative routes. Pinch points are important areas for wildlife conservation studies in connecting ecological resources and ensuring migratory access of species [29,33]. Pinch points may arise from the contraction of low-resistance cover types or restrictions caused by physical features such as transportation networks. It can also be caused by natural or human-induced means. Removing such obstacles allows species to move [4,74,82].
In this study, we used the Pinchpoint Mapper, a toolkit of the Linkage Mapper Toolbox, to determine the spatial distribution of ecological pinch points [66,68,74]. The areas with the highest current values were determined as pinch points. Pinchpoint Mapper uses Circuitscape algorithms to connect maps produced by the Linkage Mapper and creates maps that identify pinch-points and effective resistance values in ecological corridors [66,68,83]. The Linkage Mapper toolkit identifies pinch-points based on the width of corridors. The software cuts the lowest-cost corridors by a user-defined corridor width before integrating the flow into the system [83,84]. Different corridor cutting widths, such as 50, 100, 200, and 500 cost-weighted km, were tried to evaluate the effect of Cost-Weighted Corridor Width on the result, and 100 km was chosen. The circuit mode for the raster centrality calculator is All-to-one. When there are many core areas, selecting this mode enables faster analysis. However, in this mode, the software connects one pinch-point to the main line and all remaining pinch-points to other current sources [68,74].

3. Results

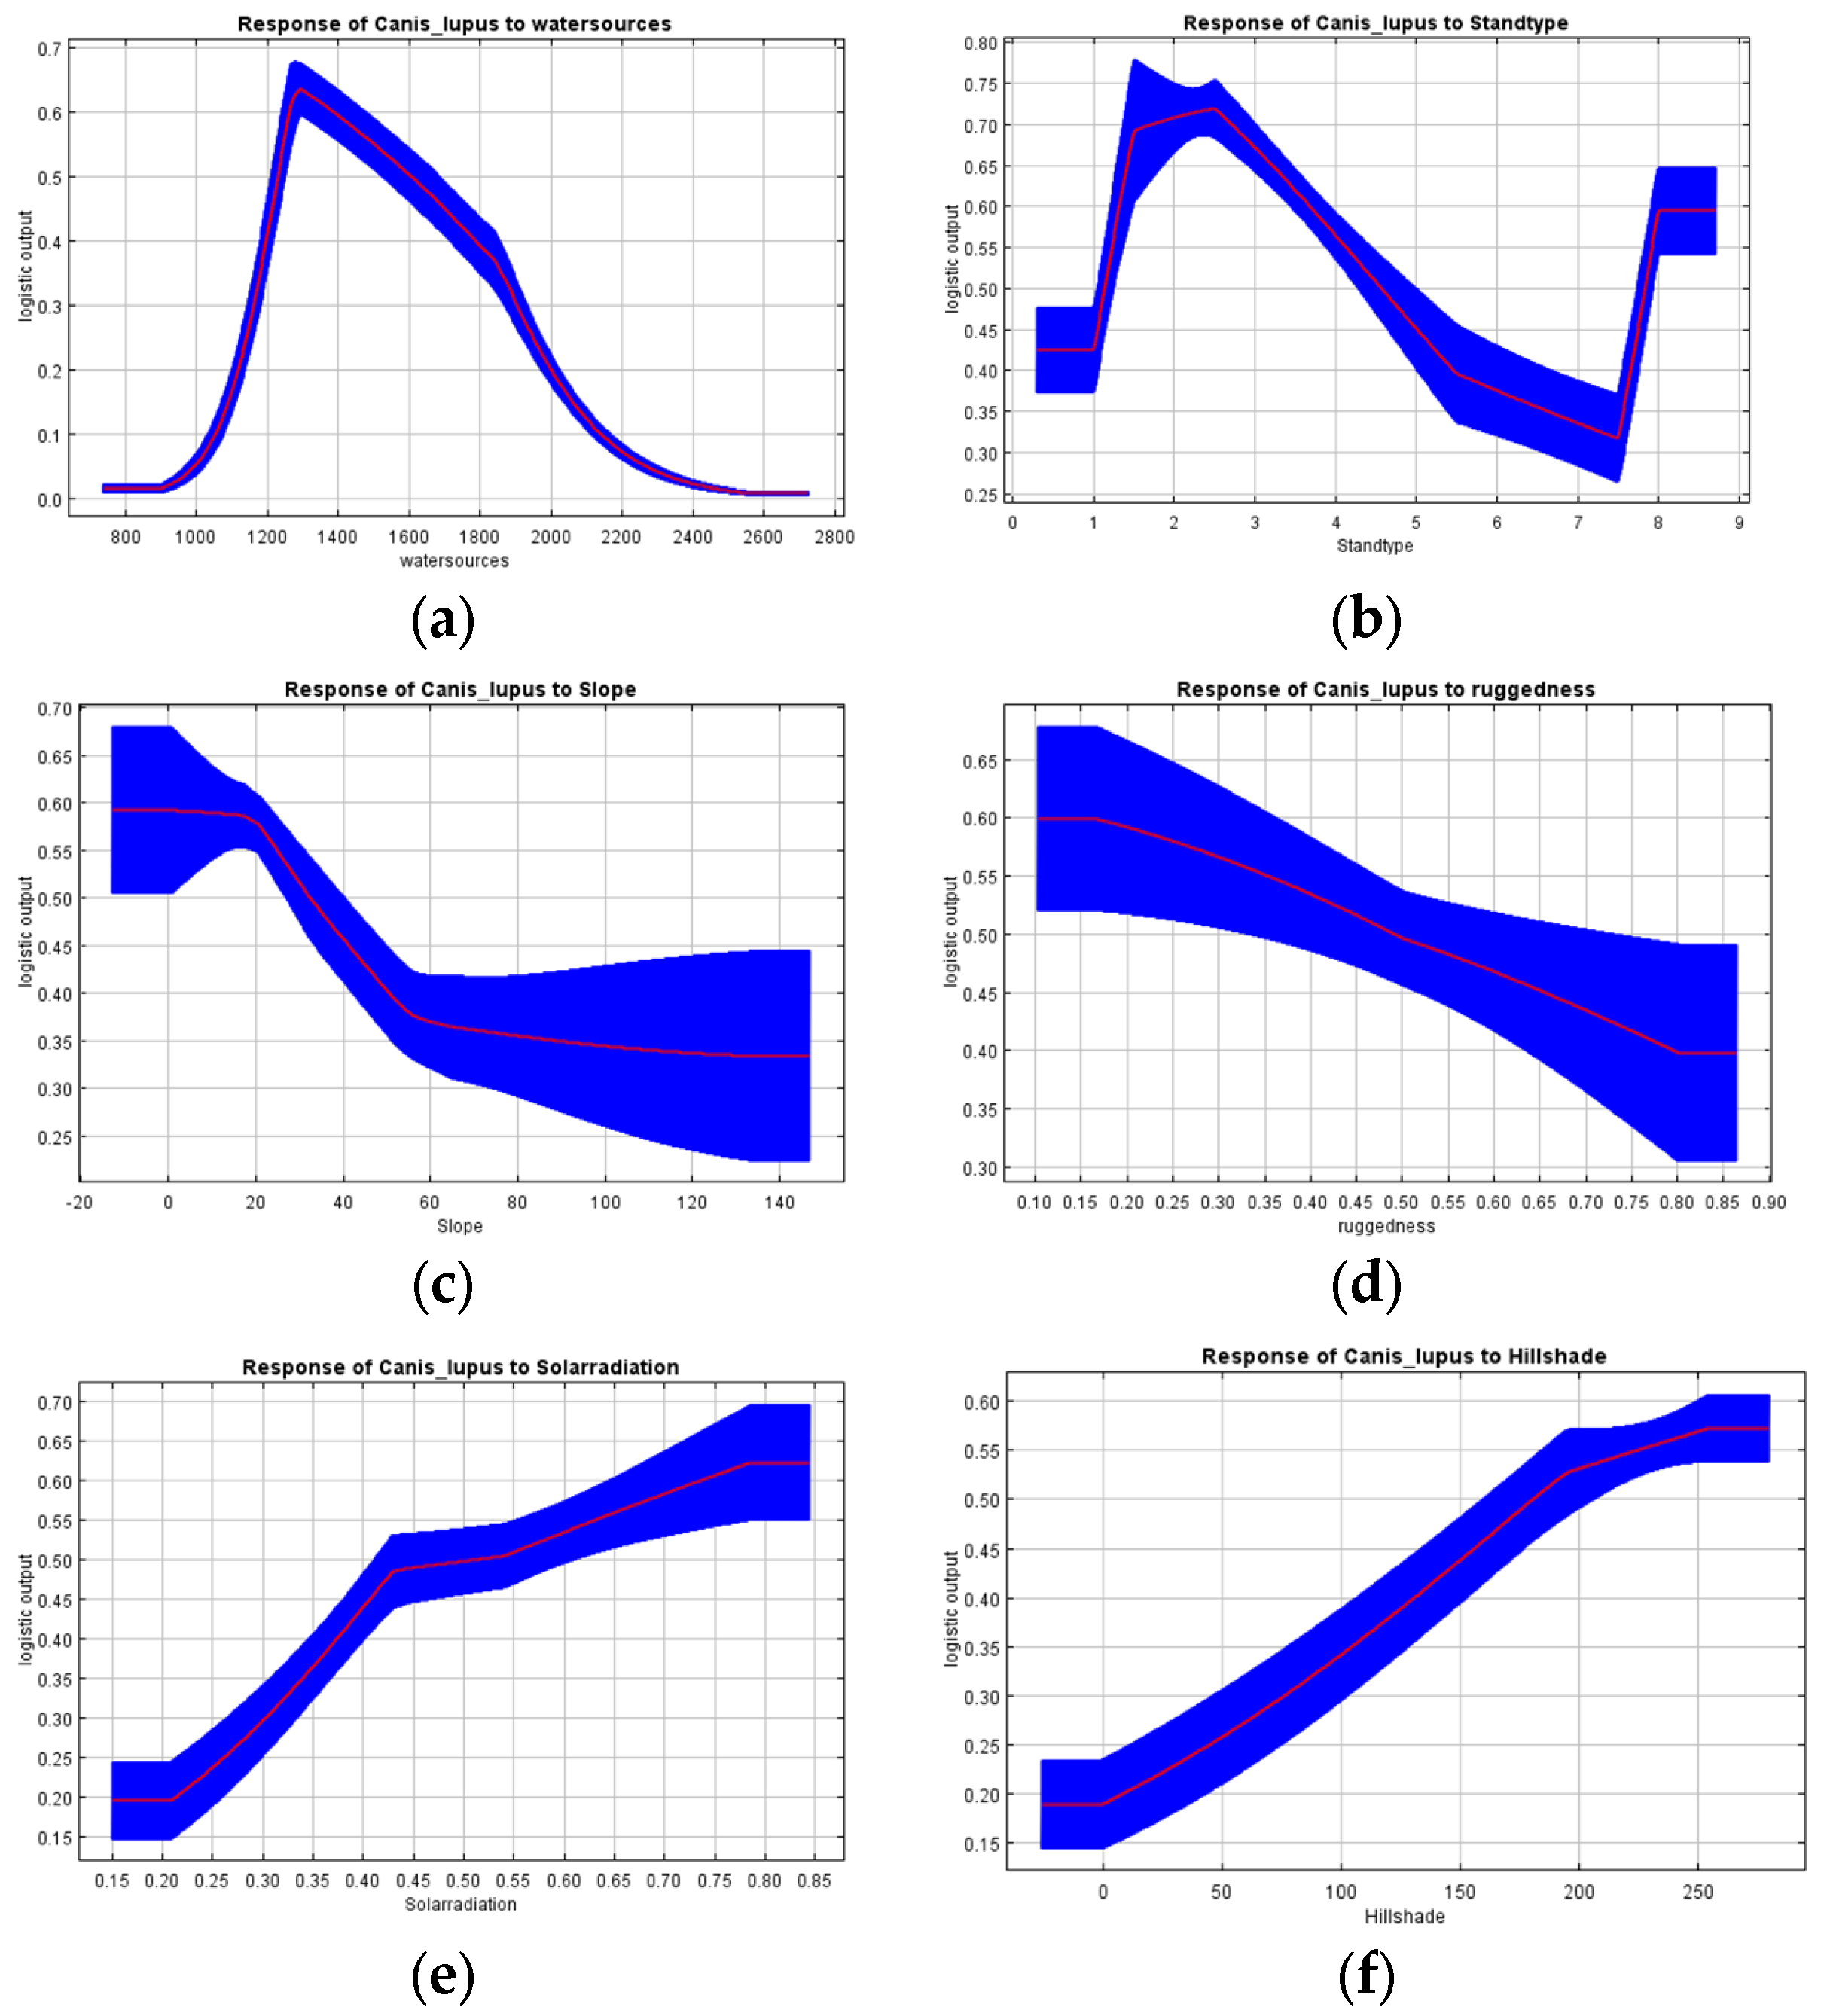
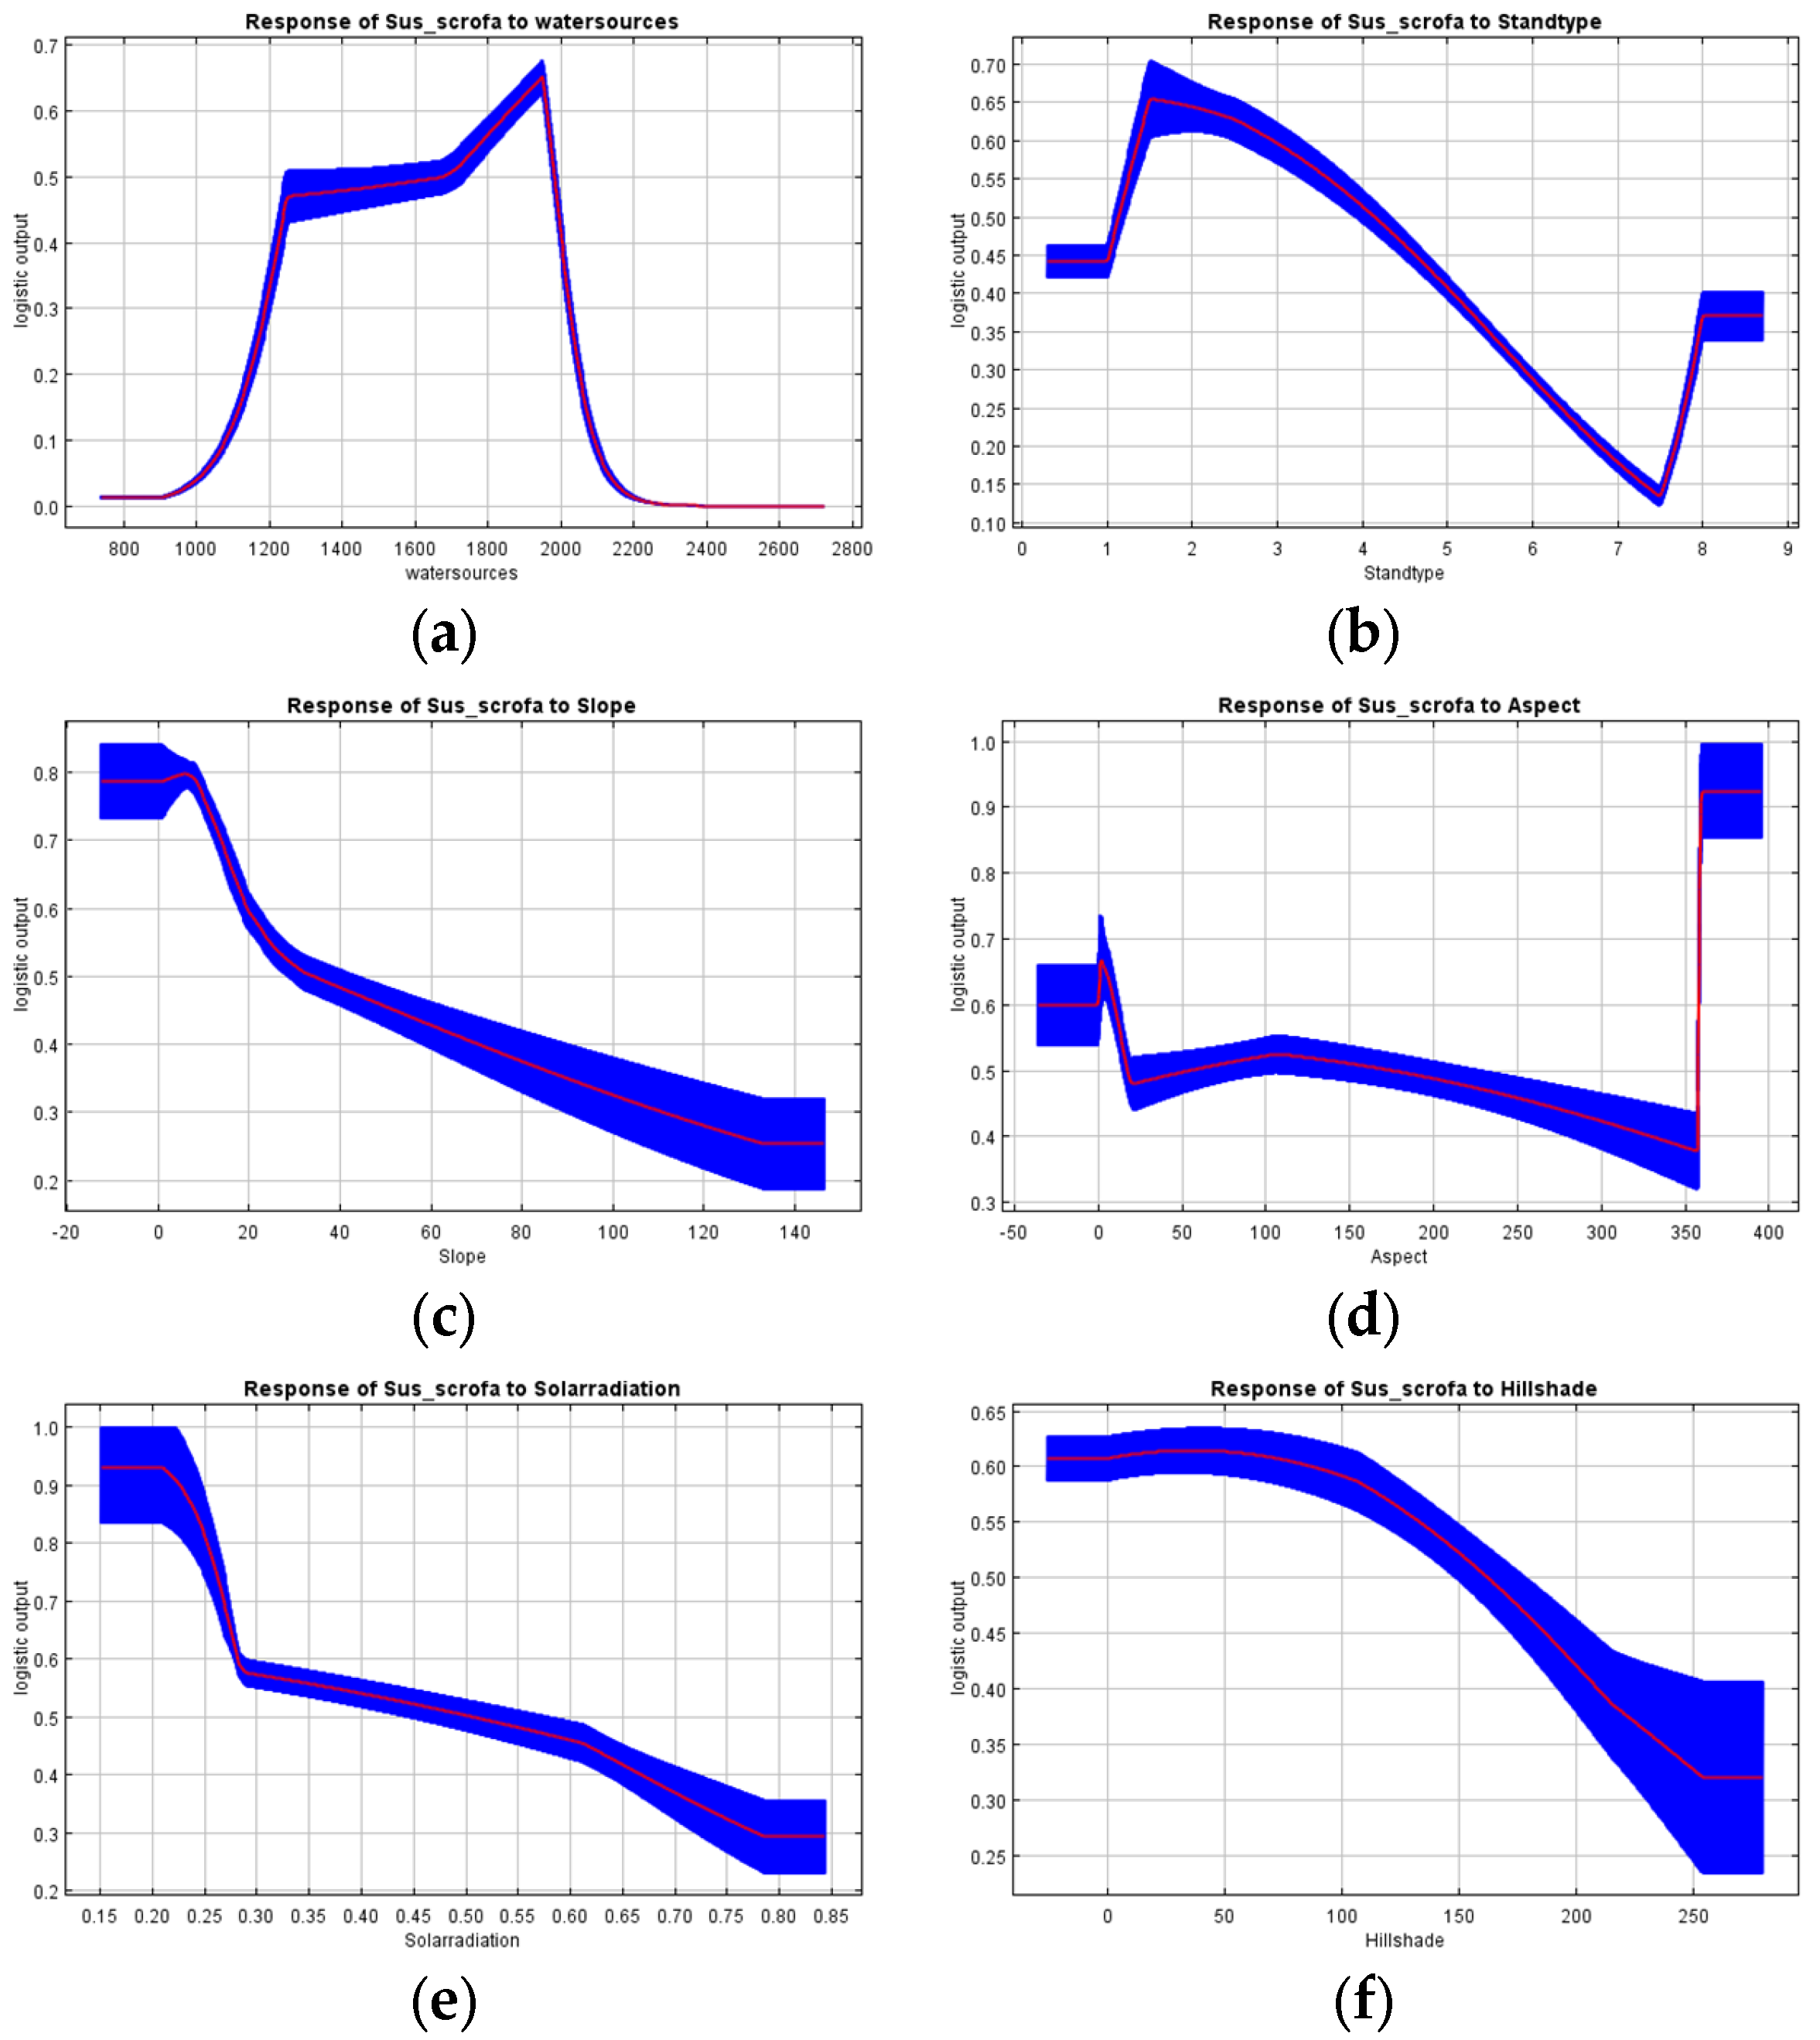
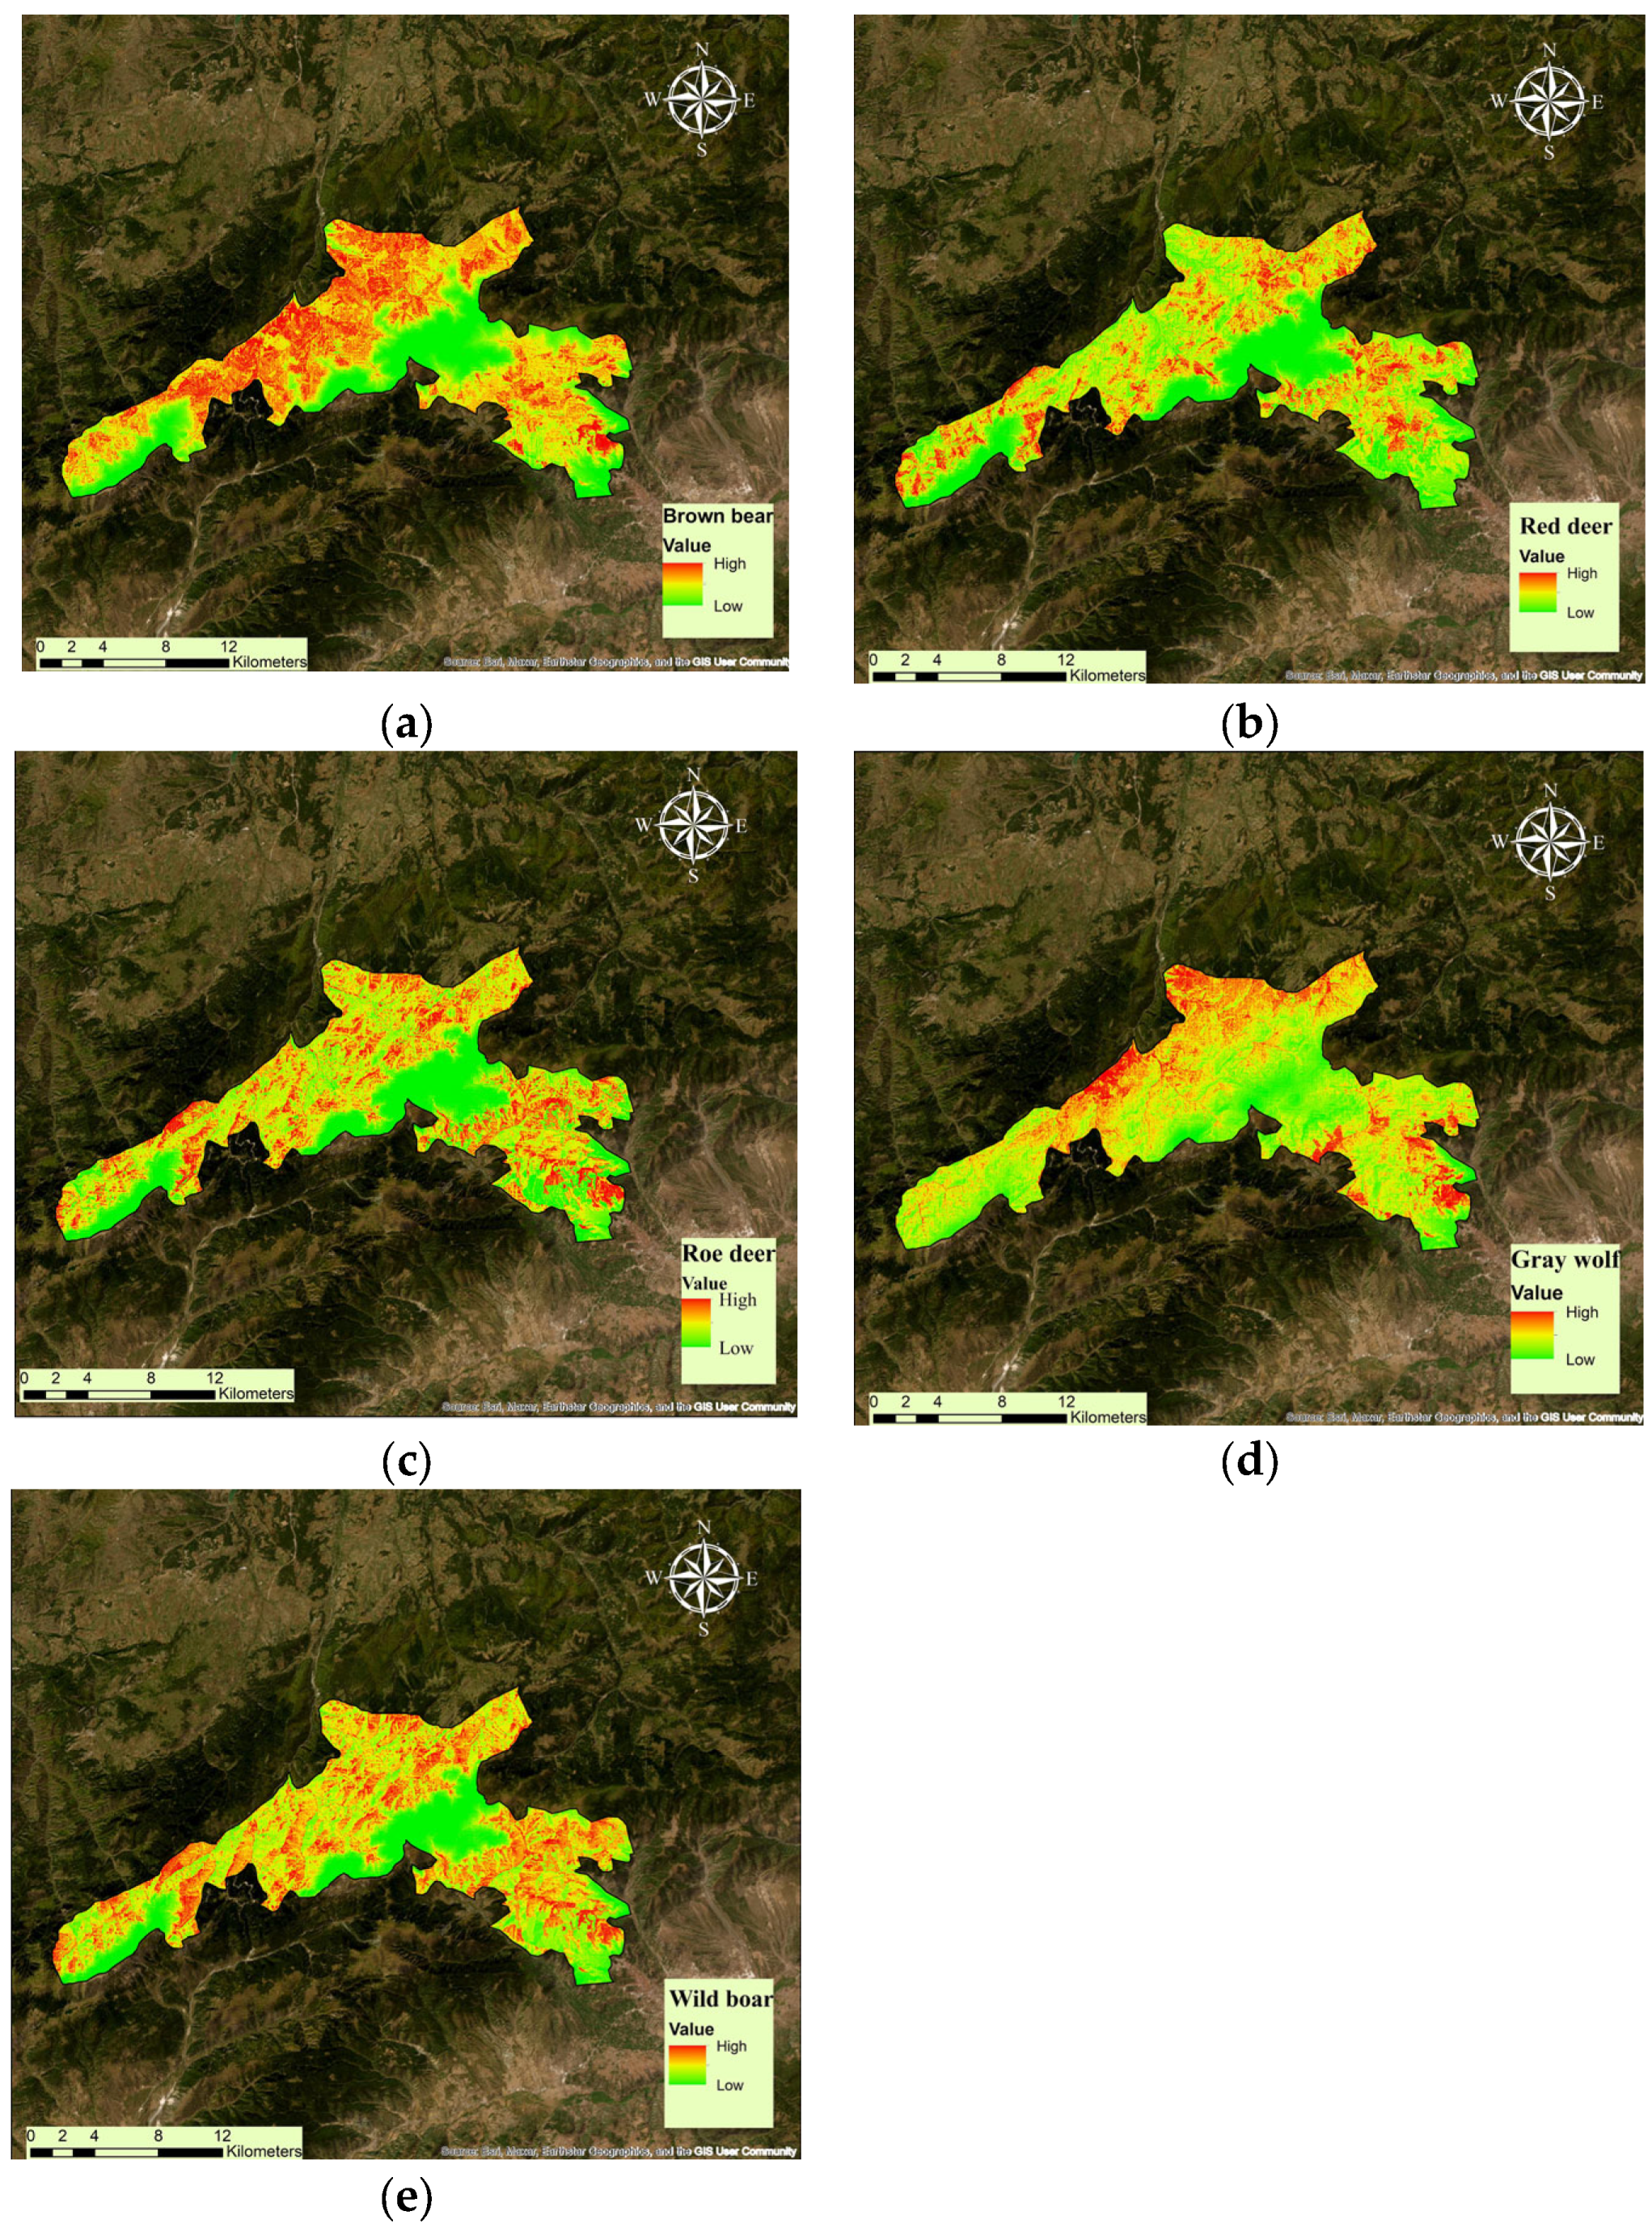
3.1. Habitat Suitability Model

Results of the habitat suitability models produced spatial patterns for five large mammals (brown bear, grey wolf, red deer, roe deer, and wild boar) in the landscape between Ilgaz Mountain WR and Gavurdağı WR (Figure 4). The MaxEnt models demonstrated reliable performance for all species, as indicated by their AUC values derived from the receiver operating characteristic (ROC) curves. These values ranged from 0.641 for brown bears to 0.756 for roe deer, red deer (0.749), gray wolves (0.700), and wild boar (0.735).
According to Baldwin, AUC scores in this range indicate that the models successfully distinguish suitable habitats from unsuitable areas [85]. AUC values, moderate to high, indicate strong predictive performance [86]. The alignment of the training data and test data lines close to the ideal performance line (0:0–1:1) observed in Figure A2 supports the robustness of our estimates [38].
The variable contributions evaluated using the jackknife test (Figure A3) showed that water resources and stand type consistently influenced habitat suitability for all five species. It can be seen that the relative importance of other factors varied according to species. In the modeling for the brown bear, stand type, water resources, ruggedness, slope, solar radiation, and aspect variables were significant, respectively (Figure A4, Table 1). In contrast, in the red deer model, water resources appeared to be more dominant in the model, followed by stand type, slope, ruggedness, hillshade, aspect, and solar radiation (Figure A5, Table 2). Habitat suitability models for roe deer, grey wolf, and wild boar were mainly influenced by water resources and stand type, along with other environmental variables such as ruggedness, slope, and ruggedness (Figure A6, Figure A7 and Figure A8, Table 3, Table 4 and Table 5).
The variable contributions evaluated using the jackknife test (Figure A3) showed that water resources and stand type consistently influenced habitat suitability for all five species. It can be seen that the relative importance of other factors varied according to species.
In the modeling for the brown bear, stand type, water resources, ruggedness, slope, solar radiation, and aspect variables were significant, respectively (Figure A4, Table 1).
In contrast, in the red deer model, water resources appeared to be more dominant in the model, followed by stand type, slope, ruggedness, hillshade, aspect, and solar radiation (Figure A5, Table 2).
While stand type and water resources variables were important for the roe deer (Figure A6, Table 3), water resources, stand type, and ruggedness variables were important in the model for the grey wolf (Figure A7, Table 4).
Finally, the wild boar model was similarly ranked by water resources, followed by stand type, hillshade, aspect, slope, solar radiation, and ruggedness (Figure A8, Table 5).

3.2. Wildlife Ecological Corridor Modeling

Wildlife ecological corridor maps for five large mammal species (brown bear, red deer, roe deer, wild boar, and gray wolf) between Ilgaz Mountain WR and Gavurdağı WR are presented in Figure 5. In this study, Circuit Theory was applied through Circuitscape software (Available: https://circuitscape.org) (accessed on 24 May 2024) to identify potential corridors and critical pinch-points based on landscape resistance values [68,69,74]. Using the habitat suitability models produced by MaxEnt, a resistance surface was created and then used in Circuit Theory to generate ecological connectivity maps. The connectivity models varied between species due to differences in habitat suitability, resistance to movement across the landscape, and habitat preferences [74,78,79]. The areas highlighted in blue on the connectivity maps indicate low-resistance pathways, commonly referred to as pinch-points, which are crucial for facilitating wildlife movement through narrow or constrained landscape corridors. In contrast, the red areas signify regions with high resistance (e.g., human settlements, roads, or unsuitable habitats) where wildlife movement is significantly restricted or entirely avoided.
As a result of wildlife corridor modeling, Figure 6 shows two possible wildlife ecological corridors that are thought to be common by five large mammals between Ilgaz Mountain WR and Gavurdağı WR. One is in the Hacet Hill location, and the other is between the Eceler and Bostan locations. It was hypothesized that the human-wildlife relationship in the Eceler and Bostan locality was more intense than in the Hacet Hill locality. Because these areas have semi-active forest villages with low populations that people visit seasonally. Also, employees working in tourism facilities, which are used especially for skiing, reported that brown bears and other species generally use the trash dumps near the buildings to look for food. As a result of interviews with local people living in the Bostan region, it was determined that wild boars also damage agricultural areas and agricultural products to find food, that footprints and feces are found on the waterfront, and that wild boars create muddy areas [26,27].

4. Discussion

4.1. Habitat Suitability Modeling

Habitat suitability modeling results for the five mammal species studied, brown bear (Figure 4a and Figure A4), red deer (Figure 4b and Figure A5), roe deer (Figure 4c and Figure A6), wolf (Figure 4d and Figure A7), and wild boar (Figure 4e and Figure A8), revealed species-specific environmental preferences. These variables were found to be determinants of habitat suitability for the species, respectively. All species in the study preferred areas at medium to high altitudes; brown bears and wild boars preferred altitudes around 1700–2000 m, while red deer and roe deer preferred altitudes between 1600 and 1900 m. Grey wolves preferred slightly lower altitudes between 1200 and 1400 m. Proximity to water sources stands out as a critical factor for all species. Access to water sources is essential for the water requirement, thermoregulation, and reproductive processes of the species. While gray wolves generally prefer nesting areas close to streams, especially during the lactation period [37,87], wild boars depend on swampy or moist habitats for cooling and feeding [88]. Similar trends have been reported in the literature for brown bears, which use water-rich areas to regulate body temperature and support omnivorous feeding behavior [89]. Water resources are crucial for red deer and roe deer, as reported by Evcin et al. [31]. Red deer and roe deer prefer gentle slopes that provide easier access to food and water. Red deer use low-slope areas for bedding and feeding [90]. Roe deer avoid steep topography due to difficulty accessing food and water [31]. In contrast, gray wolves and brown bears are more tolerant of steeper terrain, benefiting from the rugged terrain that provides protection and isolation from human disturbance [37,91].
Stand type is another important factor for the habitat preferences of species. As a result of the modeling, broadleaf, coniferous, and mixed forests generally emerged as important habitats for all species. Brown bears were found in areas with high vegetation dominated by pure or mixed forest types, consistent with the findings of Acarer and Mert [91]. Red deer preferred mixed forests and forest openings [90,92], while roe deer used open forest edges and agricultural interfaces [31]. Grey wolves and wild boars preferred denser forests providing food and shelter [37,88]. Forest density is critical for grey wolves in protecting their cubs and finding prey [37]. The ruggedness variable was positively correlated with habitat suitability for species such as grizzly bears, suggesting that highly rugged terrain provides greater concealment from predators and human activities [91]. The dense vegetation in these areas provides hiding places for species particularly sensitive to disturbance. The nocturnal behavior of wild boars, combined with their reliance on shaded areas to reduce thermoregulatory stress, highlights the importance of environmental features that provide both cover and access to critical resources [93,94]. Shaded areas, often close to water and food sources, are also crucial for concealment and enable species to minimize interactions with humans and predators [94]. Overall, modeling results suggest that while species share common habitat preferences, certain features appear specific to particular species.

4.2. Evaluation of Wildlife Corridors Modeling Results

The result of wildlife ecological corridor modeling for all species, developed with the Linkage Mapper Method based on the Circuit Theory approach, determined that two potential corridors for five large mammals occurred between Hacet Hill and the Bostan and Eceler locations (Figure 6).
The distribution of ecological corridors in the study area varies spatially. Comparing the two corridors, Hacet Hill is located on Ilgaz Mountain, a bridge between Ilgaz Mountain WR and Gavurdağı WR. Therefore, it provides passage for species between the two regions. The elevation ranges from 1400 to 2587 m. The highest peak is Büyükhacet Hill (2587 m), which is also the highest peak of the Western Black Sea Region, and the second peak is Küçükhacet Hill (2546 m). Büyük Hacet Hill and Küçük Hacet Hill are important areas, as they are suitable feeding, breeding, and living environments for wild animals [26,30]. Due to elevation and slope, Hacet Hill is where human activities such as agriculture and forestry, lack of settlements, traffic flow, and hunting are very low. For this reason, it offers a living space for wild animals where they will not be disturbed and will be away from human activities. On the contrary, the results showed that the Eceler and Bostan regions have intense human activities. Wild animals distributed in the region are affected by many disturbances, such as tunnel construction, mining, agriculture and forestry, highways, and settlements [18,26,30,44]. It has been determined that bears, gray wolves, and red deer use the area around the Ilgaz Tunnel to cross the road.
Ilgaz Mountain WR, located between the Eceler and Bostan regions, is an important position on a regional and national scale with its natural, cultural, and recreational resource values. It is one of the important winter tourism centers of Türkiye [26,95]. The study area is in good condition in terms of water resources. There are specific large and small streams in the field that meet the water needs of wild animals. The area also has artificial water sources, providing an alternative source for wild animals [26,27]. Water is vital for wild animals, as it directly influences their survival, behavior, and reproductive success. The availability of water shapes habitat suitability and plays a key role in determining the distribution and movement patterns of many species across the landscape [96,97]. Especially during the hot summer season, wild ungulates drink water more frequently to meet their body needs. The good water availability of the site shows that it can improve large mammal settlement in the forest habitat [98,99].
The Ilgaz Mountains are located in the bioclimatic transition zone. Therefore, the continental climate type is dominant. Summers are hot and dry; winters are cold and snowy. The vegetation is steppe [26,44]. After the winter season, snow remains on vegetation for long periods and melts very late, providing an advantage for wild animals in terms of access to water. Forest areas in ecological corridors contribute to the evapotranspiration cycle [96]. Located in various regions within the field, Jackal plum (Prunus spinosa), pear (Pyrus communis L.), sour cherry (Prunus cerasus L.), oak species (Quercus sp.), cherry (Prunus avium L.), walnut (Juglans regia L.), hazelnut (Corylus avellana L.), chestnut (Cestanea sativa Mill.), cranberry (Cornus mas L.), mountain ash (Sorbus torminalis), wild pear (Pyrus elaeagnifolia), and hawthorn (Crataegus microphylla) provide food sources for wild animals [26]. Since mobile species tend to search for food in the field, they constantly move around. Mobile animals show the behavior of carrying food from one place to another. As a feeding behavior, brown bears revisit known feeding areas during winter when food resources are insufficient. This is very important for the functioning of the food chain and ecosystem services [91].
As a result of the observations, the garbage dumps around the tourism facilities in the Ilgaz Mountain WR have become one of the points where wild animals, especially brown bears, come to search for food. Garbage, fruit trees, or agricultural areas are potential food sources for brown bears. Chynoweth et al. [100] stated that residential areas and garbage dumps in Türkiye are an important food source for wolves and brown bears. It was determined that wild boar damaged the Bostan region’s agricultural areas to find food and bears damaged honey hives. It has also been determined that wild boar rummage through animal manure, damage field crops, and create muddy areas for themselves near water. Küçük and Uslu [40] stated that wild boar damage agricultural areas when they cannot find enough food in their area. In field studies, intense footprints and feces in areas of human activity indicate that these areas are under human-wildlife interaction. In this regard, wild animals prefer to obtain food from places close to where people live.
All these data show that the human-wildlife relationship in the field is quite active and intense in the Eceler and Bostan locations, while there is no human pressure on Hacet Hill. In areas with less human influence, species face less resistance, and ecological corridors are longer. On the other hand, where human impact is significant, ecological corridors are generally shorter. Finally, ecological corridors created for large mammals are also used by other species. Thanks to ecological corridors, communication can be achieved between regions far from each other. It is thought that protecting species, ecosystems, and habitats will be possible by seamlessly connecting areas. Therefore, measures must be taken to maintain, develop, and repair ecological networks between areas [101,102].

5. Conclusions

Sustainable biodiversity conservation is achieved by creating plans that try to meet the habitat requirements of wildlife species and facilitate their movements within the natural ecosystem. In this context, wildlife corridors are critical structures that reduce the effects of habitat fragmentation, increase the genetic diversity of species, and ensure the survival of species populations. The Circuit Theory model based on habitat suitability used in this study revealed the potential corridor routes of five large mammal species spreading in the area and showed that two areas separated from each other, although sharing the same habitat, should be managed as a single area with improper protected area management and that there may be intense flow between these two areas. Our modeling shows that wildlife species in the study area mostly occupy habitats at higher altitudes and prefer water sources such as broad-leaved and coniferous forests and certain forest structures for feeding and sheltering. These preferences also emphasize how important the basic needs of wild animals are for their distribution and that protecting habitats means protecting wildlife. Wildlife conservation efforts should be integrated with targeted habitat management plans such as protecting water resources, reducing human-induced disturbances, and preserving forest integrity. Conservation efforts should prioritize the protection of wildlife ecological corridors. These corridors are critical pathways that connect fragmented habitats and enable species to move, thus preserving genetic diversity and ecological balance. To reduce human activities in these areas, it is of utmost importance to implement measures such as restricting agricultural expansion, uncontrolled logging, and road and construction projects that may disrupt the movement patterns of large mammals. In addition to constructing ecological corridors, habitat restoration and improvement initiatives are also needed to improve the quality of resources, such as food, water, etc., that constitute the basic needs of wildlife in these corridors. In this context, efforts such as reforestation of ecological corridors, increasing nutrient-rich vegetation in corridors, and facilitating access to water resources can create more favorable conditions for wildlife. Ecological infrastructures such as underpasses and overpasses should be prioritized, especially in areas where highways and other human-made structures cause habitat fragmentation. These structures serve as safe passages for wildlife, helping to reduce the risk of vehicle collisions and providing connectivity between fragmented habitats. The planning and design of such infrastructures should consider species’ ecological needs and behavioral characteristics. For planning and protection activities specific to wildlife species, detailed and up-to-date mapping of species distributions considering various factors is important for effective species protection planning. The information obtained will guide the development of long-term strategies to manage existing wildlife populations and reduce the negative effects of habitat loss and climate change. In Türkiye, planning is generally focused on wood production, especially in the planning of forest areas. This study is expected to guide wildlife management, and the maps produced will form a serious basis for protected area management and plans. The study also provides a concrete guide on the necessity of considering ecological corridors while preparing protected area management plans and species protection plans and the applicability of protection strategies at the national level.

Author Contributions

Conceptualization, B.K. and Ö.E.; methodology, B.K. and Ö.E.; software, B.K. and Ö.E.; validation, B.K. and Ö.E.; formal analysis, B.K. and Ö.E.; investigation, B.K. and Ö.E.; resources, B.K. and Ö.E.; data curation, B.K. and Ö.E.; writing—original draft preparation, B.K. and Ö.E.; writing—review and editing, B.K. and Ö.E.; visualization, B.K. and Ö.E.; supervision, Ö.E.; project administration, B.K. and Ö.E.; funding acquisition, B.K. and Ö.E. All authors have read and agreed to the published version of the manuscript.

Funding

The authors declare that no funds, grants, or other support were received during the preparation of this manuscript.

Institutional Review Board Statement

Not applicable.

Data Availability Statement

The datasets generated during and analyzed during the current study are available from the corresponding author on reasonable request.

Acknowledgments

We thank the General Directorate of Nature Conservation and National Parks personnel for their contribution and efforts in the field studies.

Conflicts of Interest

The authors declare no conflicts of interest.

Appendix A

Table A1. Correlation analysis results for the ecological variables.
AspectSlopeHillshadeClosenessStandtypeRuggednessSolarradiationWatersourcesRoadElevation
Aspect10.0120.5160.0390.0280.001−0.0130.1070.0190.107
Slope0.0121−0.1310.077−0.106−0.024−0.014−0.0690.054−0.069
Hillshade0.516−0.13110.165−0.0270.003−0.0040.141−0.0570.141
Closeness0.0390.0770.1651−0.709 *0.0160.007−0.274−0.309−0.274
Standtype0.028−0.106−0.027−0.709 *1−0.003−0.0020.3480.1510.348
Ruggedness0.001−0.0240.0030.016−0.00310.1320.0670.0130.067
Solarradiation−0.013−0.014−0.0040.007−0.0020.132210.0470.0140.047
Watersources0.107−0.0690.141−0.2740.3480.06700.04710.0581.000 *
Road0.0190.054−0.057−0.3090.1510.01300.0140.05810.058
Elevation0.107−0.0690.141−0.2740.3480.06700.0471.000 *0.0581
Values in bold with an asterisk (*) indicate strong correlations (|r| ≥ 0.7) and were excluded from the model to avoid multicollinearity.
Figure A1. Occurence points of five large mammals in the study.
Diversity 17 00542 g0a1
Figure A2. (Left) AUC value for MaxEnt with seven repeated runs, (Right) Omission rates for: (a) Brown bear (Ursus arctos), (b) Red deer (Cervus elaphus), (c) Roe deer (Capreolus capreolus), (d) Gray wolf (Canis lupus), (e) Wild boar (Sus scrofa).
Diversity 17 00542 g0a2
Figure A3. AUC values of the jackknife analysis for five large mammals: (a) Brown bear (Ursus arctos), (b) Red deer (Cervus elaphus), (c) Roe deer (Capreolus capreolus), (d) Gray wolf (Canis lupus), (e) Wild boar (Sus scrofa).
Diversity 17 00542 g0a3
Figure A4. MaxEnt response curve of the main environmental variables affecting the distribution of brown bear (Ursus arctos): (a) Water sources; (b) Stand type; (c) Slope; (d) Ruggedness; (e) Solar radiation; (f) Hillshade.
Diversity 17 00542 g0a4
Figure A5. MaxEnt response curve of the main environmental variables affecting the distribution of red deer (Cervus elaphus): (a) Water sources; (b) Stand type; (c) Slope; (d) Ruggedness; (e) Solar radiation; (f) Hillshade.
Diversity 17 00542 g0a5
Figure A6. MaxEnt response curve of the main environmental variables affecting the distribution of roe deer (Capreolus capreolus): (a) Water sources; (b) Stand type; (c) Slope; (d) Aspect; (e) Solar radiation; (f) Hillshade.
Diversity 17 00542 g0a6
Figure A7. MaxEnt response curve of the main environmental variables affecting the distribution of gray wolf (Canis lupus): (a) Water sources; (b) Stand type; (c) Slope; (d) Ruggedness; (e) Solar radiation; (f) Hillshade.
Diversity 17 00542 g0a7
Figure A8. MaxEnt response curve of the main environmental variables affecting the distribution of wild boar (Sus scrofa): (a) Water sources; (b) Stand type; (c) Slope; (d) Aspect; (e) Solar radiation; (f) Hillshade.
Diversity 17 00542 g0a8

References

  1. Fahrig, L.; Arroyo-Rodríguez, V.; Bennett, J.R.; Boucher-Lalonde, V.; Cazetta, E.; Currie, D.J.; Eigenbrod, F.; Ford, A.T.; Harrison, S.P.; Jaeger, J.A.C.; et al. Is habitat fragmentation bad for biodiversity? Biol. Conserv. 2019, 230, 179–186. [Google Scholar] [CrossRef]
  2. Rahimi, E.; Dong, P. Identifying barriers and pinch-points of large mammal corridors in Iran. J. Environ. Stud. Sci. 2023, 13, 285–297. [Google Scholar] [CrossRef]
  3. Hilty, J.; Worboys, G.L.; Keeley, A.; Woodley, S.; Lausche, B.; Locke, H.; Carr, M.; Pulsford, I.; Pittock, J.; White, J.W.; et al. Guidelines for Conserving Connectivity Through Ecological Networks and Corridors; Best Practice Protected Area Guidelines Series; IUCN: Gland, Switzerland, 2020. [Google Scholar]
  4. Rahimi, E.; Dong, P. What are the main human pressures affecting Iran’s protected areas? J. Environ. Stud. Sci. 2022, 12, 682–691. [Google Scholar] [CrossRef]
  5. Peng, J.; Zhao, H.; Liu, Y. Urban ecological corridors construction: A review. Acta Ecol. Sin. 2017, 37, 23–30. [Google Scholar] [CrossRef]
  6. Zhou, D.; Song, W. Identifying ecological corridors and networks in mountainous areas. Int. J. Environ. Res. Public Health 2021, 18, 4797. [Google Scholar] [CrossRef] [PubMed]
  7. Boakes, E.H.; McGowan, P.J.; Fuller, R.A.; Chang-qing, D.; Clark, N.E.; O’Connor, K.; Mace, G.M. Distorted views of biodiversity: Spatial and temporal bias in species occurrence data. PLoS Biol. 2010, 8, e1000385. [Google Scholar] [CrossRef]
  8. McRae, B.H.; Dickson, B.G.; Keitt, T.H.; Shah, V.B. Using circuit theory to model connectivity in ecology, evolution, and conservation. Ecology 2008, 89, 2712–2724. [Google Scholar] [CrossRef]
  9. Cushman, S.A.; McRae, B.; Adriaensen, F.; Beier, P.; Shirley, M.; Zeller, K. Biological corridors and connectivity. Key Top. Conserv. Biol. 2013, 2, 384–404. [Google Scholar] [CrossRef]
  10. Gilbert-Norton, L.; Wilson, R.; Stevens, J.R.; Beard, K.H. A meta-analytic review of corridor effectiveness. Conserv. Biol. 2010, 24, 660–668. [Google Scholar] [CrossRef]
  11. Compton, B.W.; McGarigal, K.; Cushman, S.A.; Gamble, L.R. A resistant-kernel model of connectivity for amphibians that breed in vernal pools. Conserv. Biol. 2007, 21, 788–799. [Google Scholar] [CrossRef]
  12. Malakoutikhah, S.; Fakheran, S.; Soffianian, A. Applying Circuitscape Theory to identify migration corridors between Mooteh and Ghamishloo wildlife refuges in Isfahan Province-Iran. Iran. J. Appl. Ecol. 2014, 2, 77–89. [Google Scholar]
  13. Zeller, K.A.; McGarigal, K.; Whiteley, A.R. Estimating landscape resistance to movement: A review. Landsc. Ecol. 2012, 27, 777–797. [Google Scholar] [CrossRef]
  14. McRae, B.H.; Beier, P. Circuit theory predicts gene flow in plant and animal populations. Proc. Natl. Acad. Sci. USA 2007, 104, 19885–19890. [Google Scholar] [CrossRef] [PubMed]
  15. Spear, S.F.; Balkenhol, N.; Fortin, M.J.; McRae, B.H.; Scribner, K.I.M. Use of resistance surfaces for landscape genetic studies: Considerations for parameterization and analysis. Mol. Ecol. 2010, 19, 3576–3591. [Google Scholar] [CrossRef]
  16. Salinas-Ramos, V.B.; Agnelli, P.; Bosso, L.; Ancillotto, L.; Russo, D. Body size of Italian greater horseshoe bats (Rhinolophus ferrumequinum) increased over one century and a half: A response to climate change? Mamm. Biol. 2021, 101, 1127–1131. [Google Scholar] [CrossRef]
  17. Lorestani, N.; Hemami, M.R.; Rezvani, A.; Ahmadi, M. Ecological niche models reveal divergent habitat use of Pallas’s cat in the Eurasian cold steppes. Ecol. Evol. 2022, 12, e9624. [Google Scholar] [CrossRef]
  18. Evcin, Ö. Can highway tunnel constructıon change the habitat selection of roe deer (Capreolus capreolus Linnaeus, 1758)? Environ. Monit. Assess. 2023, 195, 1410. [Google Scholar] [CrossRef]
  19. Ugış, A. Kastamonu-Ballıdağ Ve Kurtgirmez Mevkiilerinde Büyük Memeli Türlerin Habitat İlişkileri, Habitat Kullanımı ve Ekolojik Niş Modellemesi. Doctoral Thesis, Kastamonu University, Kastamonu, Türkiye, 2023. [Google Scholar]
  20. Uzun, G.; Evcin, Ö. Determination of Dispersal Corridors Used by Large Mammals Between Close Habitats. Diversity 2025, 17, 165. [Google Scholar] [CrossRef]
  21. Demirsoy, A. General and Türkiye Zoogeography; Meteksan: Ankara, Türkiye, 2002. [Google Scholar]
  22. Şekercioğlu, Ç.H.; Anderson, S.; Akçay, E.; Bilgin, R.; Can, Ö.E.; Semiz, G.; Tavşanoğlu, Ç.; Yokeş, M.B.; Soyumert, A.; İpekdal, K.; et al. Turkey’s globally important biodiversity in crisis. Biol. Conserv. 2011, 144, 2752. [Google Scholar] [CrossRef]
  23. Mittermeier, R.A.; Turner, W.R.; Larsen, F.W.; Brooks, T.M.; Gascon, C. Global biodiversity conservation: The critical role of hotspots. In Biodiversity Hotspots; Springer: Berlin/Heidelberg, Germany, 2011; pp. 3–22. [Google Scholar]
  24. World Wildlife Fund (WWF). Korumazsak Kaybederiz: Sürdürülebilir Bir Türkiye İçin Korunan Alanlar Hedef: 2030’a Kadar %30. WWF Türkiye Raporu. 2021. Available online: https://www.wwf.org.tr/?10800/Surdurulebilir-Bir-Turkiye-Icin-Korunan-Alanlar (accessed on 10 March 2025).
  25. Convention on Biological Diversity (CBD). The Kunming-Montreal Global Biodiversity Framework, 2030 Targets, 2022. Available online: https://www.cbd.int/gbf/targets (accessed on 14 January 2025).
  26. Kastamonu Ilgaz Dağı Yaban Hayatı Geliştirme Sahası Yönetim ve Gelişme Planı, T.C. Orman ve Su İşleri Bakanlığı, 10. Bölge Müdürlüğü, Kastamonu Şube Müdürlüğü, Kastamonu, 2012. Available online: https://bolge10.tarimorman.gov.tr (accessed on 22 January 2023).
  27. Kastamonu Tosya Gavurdağı Yaban Hayatı Geliştirme Sahası Yönetim ve Gelişme Planı, T.C. Orman ve Su İşleri Bakanlığı, 10. Bölge Müdürlüğü, Kastamonu Şube Müdürlüğü, Kastamonu, 2015. Available online: https://bolge10.tarimorman.gov.tr (accessed on 22 January 2023).
  28. Özcan, A.U. Ekolojik Köprülerin Potansiyel Yer Seçimleri: İzmir-Çeşme Otoyolu Örneği. Uluslararası Tarım Ve Yaban Hayatı Bilim. Derg. 2021, 7, 146–156. [Google Scholar] [CrossRef]
  29. Sütünç, H.S. Evaluation of landscape connectivity between protected areas using pinch points. Turk. J. For. 2021, 22, 331–341. [Google Scholar] [CrossRef]
  30. Akbaba, B.; Bulut, S. Inventory of large mammal species in the Ilgaz Mountains Çankırı: A major ecological corridor in Anatolia. Hittite J. Sci. Eng. 2020, 7, 73–80. [Google Scholar] [CrossRef]
  31. Evcin, Ö.; Küçük, Ö.; Aktürk, E. Habitat suitability model with maximum entropy approach for European roe deer (Capreolus capreolus) in the Black Sea Region. Environ. Monit. Assess. 2019, 191, 669. [Google Scholar] [CrossRef] [PubMed]
  32. Oğul, A.; Tuttu, U.; Öner, M.N.; Yorulmaz, T.; Özcan, A.U. Ilgaz Dağı’nda farklı orman kuruluşlarındaki bazı yaban hayvanlarının (Classis: Mammalia) aktivitelerinin belirlenmesi. Anadolu Orman Araştırmaları Derg. 2022, 8, 29–36. [Google Scholar] [CrossRef]
  33. Baguette, M.; Blanchet, S.; Legrand, D.; Stevens, V.M.; Turlure, C. Individual dispersal, landscape connectivity and ecological networks. Biol. Rev. 2013, 88, 310–326. [Google Scholar] [CrossRef]
  34. Jiang, X.; Liu, H.J.; Jiang, Z.Y.; Ni, R.P. Identifying migration routes of wild asian elephants in China based on ecological networks constructed by circuit theory model. Animals 2023, 13, 2618. [Google Scholar] [CrossRef]
  35. Fleishman, E.; Murphy, D.D.; Brussard, P.F. A new method for selection of umbrella species for conservation planning. Ecol. Appl. 2000, 10, 569–579. [Google Scholar] [CrossRef]
  36. Roberge, J.M.; Angelstam, P.E.R. Usefulness of the umbrella species concept as a conservation tool. Conserv. Biol. 2004, 18, 76–85. [Google Scholar] [CrossRef]
  37. Ertürk, A. Anadolu Canis lupus L. 1758 (Kurt) Türünün Alansal Ekolojisi ve Populasyon Yapısının Araştırılması. Doctoral Thesis, Hacettepe University, Ankara, Türkiye, 2017. [Google Scholar]
  38. Süel, H. Brown bear (Ursus arctos) habitat suitability modelling and mapping. Appl. Ecol. Environ. Res. 2019, 17, 4245–4255. [Google Scholar] [CrossRef]
  39. Oruç, M.S.; Mert, A.; Özdemir, İ. Modelling Habitat Suitability For Red Deer (Cervus elaphus L.) Using Environmental Variables In Çatacık Region. Bilge Int. J. Sci. Technol. Res. 2017, 1, 135–142. [Google Scholar]
  40. Küçük, Ö.; Uslu, N. Sinop-Bozburun Yaban Hayatı Koruma Alanında Yaban Domuzu (Sus scrofa L.) Sayımı. Kastamonu Orman Fakültesi Derg. 2004, 4, 45–57. [Google Scholar]
  41. Stachowicz, I.; Ferrer-Paris, J.R.; Sánchez-Mercado, A. Leveraging limited data from wildlife monitoring in a conflict affected region in Venezuela. Sci. Rep. 2024, 14, 1673. [Google Scholar] [CrossRef] [PubMed]
  42. Murie, O.J.; Elbroch, M. A Field Guide to Animal Tracks; Houghton Mifflin Harcourt: Boston, MA, USA, 2005. [Google Scholar]
  43. Evcin, Ö. Monitoring the annual change of fauna in Ilgaz Mountain Wildlife Reserve by using biodiversity indices. J. Biometry Stud. 2022, 2, 7–14. [Google Scholar] [CrossRef]
  44. McKaughan, J.E.; Stephens, P.A.; Hill, R.A. Estimating mesocarnivore abundance on commercial farmland using distance sampling with camera traps. Ecol. Solut. Evid. 2023, 4, e12229. [Google Scholar] [CrossRef]
  45. Özcan, A.U.; Aytaş, İ. Peyzaj direnç değişimlerinin ekolojik bağlantılar üzerine etkileri: Çankırı örneği. Bartın Orman Fakültesi Derg. 2020, 22, 979–992. [Google Scholar] [CrossRef]
  46. Zhou, G.; Huan, Y.; Wang, L.; Lan, Y.; Liang, T.; Shi, B.; Zhang, Q. Linking ecosystem services and circuit theory to identify priority conservation and restoration areas from an ecological network perspective. Sci. Total Environ. 2023, 873, 162261. [Google Scholar] [CrossRef]
  47. Valavi, R.; Guillera-Arroita, G.; Lahoz-Monfort, J.J.; Elith, J. Predictive performance of presence-only species distribution models: A benchmark study with reproducible code. Ecol. Monogr. 2022, 92, e01486. [Google Scholar] [CrossRef]
  48. Ahmadi, M.; Hemami, M.R.; Kaboli, M.; Shabani, F. MaxEnt brings comparable results when the input data are being completed; Model parameterization of four species distribution models. Ecol. Evol. 2023, 13, e9827. [Google Scholar] [CrossRef]
  49. Farashi, A.; Alizadeh-Noughani, M. Basic Introduction to Species Distribution Modelling. In Ecosystem and Species Habitat Modeling for Conservation and Restoration; Springer Nature: Singapore, 2023. [Google Scholar] [CrossRef]
  50. Pollock, L.J.; O’connor, L.M.; Mokany, K.; Rosauer, D.F.; Talluto, M.V.; Thuiller, W. Protecting biodiversity (in all its complexity): New models and methods. Trends Ecol. Evol. 2020, 35, 1119–1128. [Google Scholar] [CrossRef]
  51. Zurell, D.; Franklin, J.; König, C.; Bouchet, P.J.; Dormann, C.F.; Elith, J.; Fandos, G.; Feng, X.; Guillera-Arroita, G.; Guisan, A.; et al. A standard protocol for reporting species distribution models. Ecography 2020, 43, 1261–1277. [Google Scholar] [CrossRef]
  52. Lee-Yaw, J.; McCune, J.L.; Pironon, S.; Sheth, S.N. Species distribution models rarely predict the biology of real populations. Ecography 2022, 2022, e05877. [Google Scholar] [CrossRef]
  53. Liang, D.; Bailey, H.; Hoover, A.L.; Eckert, S.; Zarate, P.; Alfaro-Shigueto, J.; Mangel, J.C.; Campos, N.P.; Davilla, J.Q.; Baturen, D.S.; et al. Integrating telemetry and point observations to inform management and conservation of migratory marine species. Ecosphere 2023, 14, e4375. [Google Scholar] [CrossRef]
  54. Zhu, G.; Liu, G.; Bu, W.; Gao, Y. Ecological niche modeling and its applications in biodiversity conservation. Biodivers. Sci. 2013, 21, 90. [Google Scholar] [CrossRef]
  55. Merow, C.; Smith, M.J.; Silander, J.A., Jr. A practical guide to MaxEnt for modeling species’ distributions: What it does, and why inputs and settings matter. Ecography 2013, 36, 1058–1069. [Google Scholar] [CrossRef]
  56. Wang, G.; Wang, C.; Guo, Z.; Dai, L.; Wu, Y.; Liu, H.; Li, Y.; Chen, H.; Zhang, Y.; Zhao, Y.; et al. Integrating Maxent model and landscape ecology theory for studying spatiotemporal dynamics of habitat: Suggestions for conservation of endangered Red-crowned crane. Ecol. Indic. 2020, 116, 106472. [Google Scholar] [CrossRef]
  57. Pearson, R.G.; Raxworthy, C.J.; Nakamura, M.; Townsend Peterson, A. Predicting species distributions from small numbers of occurrence records: A test case using cryptic geckos in Madagascar. J. Biogeogr. 2007, 34, 102–117. [Google Scholar] [CrossRef]
  58. Warren, D.L.; Seifert, S.N. Ecological niche modeling in Maxent: The importance of model complexity and the performance of model selection criteria. Ecol. Appl. 2011, 21, 335–342. [Google Scholar] [CrossRef]
  59. Burnham, K.P.; Anderson, D.R.; Burnham, K.P.; Anderson, D.R. Practical Use of the İnformation-Theoretic Approach; Springer: New York, NY, USA, 1998; pp. 75–117. [Google Scholar] [CrossRef]
  60. Lewis, J.S.; Farnsworth, M.L.; Burdett, C.L.; Theobald, D.M.; Gray, M.; Miller, R.S. Biotic and abiotic factors predicting the global distribution and population density of an invasive large mammal. Sci. Rep. 2017, 7, 44152. [Google Scholar] [CrossRef]
  61. Dormann, C.F.; Elith, J.; Bacher, S.; Buchmann, C.; Carl, G.; Carré, G.; García Marquéz, J.R.; Gruber, B.; Lafourcade, B.; Leitão, P.J.; et al. Collinearity: A review of methods to deal with it and a simulation study evaluating their performance. Ecography 2013, 36, 27–46. [Google Scholar] [CrossRef]
  62. Lissovsky, A.A.; Dudov, S.V.; Obolenskaya, E.V. Species-distribution modeling: Advantages and limitations of its application. 1. General approaches. Biol. Bull. Rev. 2021, 11, 254–264. [Google Scholar] [CrossRef]
  63. Li, Z.; Liu, Y.; Zeng, H. Application of the MaxEnt model in improving the accuracy of ecological red line identification: A case study of Zhanjiang, China. Ecol. Indic. 2022, 137, 108767. [Google Scholar] [CrossRef]
  64. Phillips, S.J.; Anderson, R.P.; Schapire, R.E. Maximum entropy modeling of species geographic distributions. Ecol. Model. 2006, 190, 231–259. [Google Scholar] [CrossRef]
  65. Peterson, A.T.; Soberón, J.; Pearson, R.G.; Anderson, R.P.; Martínez-Meyer, E.; Nakamura, M.; Araújo, M.B. Ecological niches and geographic distributions (MPB-49). In Ecological Niches and Geographic Distributions (MPB-49); Princeton University Press: Princeton, NJ, USA, 2011. [Google Scholar] [CrossRef]
  66. Nor, A.N.M.; Rafaai, N.H.; Abdullah, S.A. Using Circuit Theory, Connectivity Analysis and Least-Cost Path to Model the Potential Ecological Corridors of Malayan Tapir (Tapirus indicus) at Chini-Bera Forest Complex in Pahang, Peninsular Malaysia. Sains Malays. 2023, 52, 3343–3355. [Google Scholar] [CrossRef]
  67. Dickson, B.G.; Albano, C.M.; Anantharaman, R.; Beier, P.; Fargione, J.; Graves, T.A.; Gray, M.E.; Hall, K.R.; Lawler, J.J.; Leonard, P.B.; et al. Circuit-theory applications to connectivity science and conservation. Conserv. Biol. 2019, 33, 239–249. [Google Scholar] [CrossRef]
  68. McRae, B.H. Pinchpoint Mapper Connectivity Analysis Software, Version 2.0; The Nature Conservancy: Seattle, WA, USA, 2012; Available online: http://www.circuitscape.org/linkagemapper (accessed on 8 April 2023).
  69. McRae, B.H.; Shah, V.B.; Mohapatra, T.K. Circuitscape User’s Guide; The University of California, Santa Barbara. Circuitscape 4 User Guide; The Nature Conservancy: Seattle, WA, USA, 2009. [Google Scholar]
  70. Pelletier, D.; Clark, M.; Anderson, M.G.; Rayfield, B.; Wulder, M.A.; Cardille, J.A. Applying circuit theory for corridor expansion and management at regional scales: Tiling, pinch points, and omnidirectional connectivity. PLoS ONE 2014, 9, e84135. [Google Scholar] [CrossRef]
  71. Gracanin, A.; Mikac, K.M. Evaluating modelled wildlife corridors for the movement of multiple arboreal species in a fragmented landscape. Landsc. Ecol. 2023, 38, 1321–1337. [Google Scholar] [CrossRef]
  72. Belote, R.T.; Dietz, M.S.; McRae, B.H.; Theobald, D.M.; McClure, M.L.; Irwin, G.H.; McKinley, P.S.; Gage, J.A.; Aplet, G.H. Identifying corridors among large protected areas in the United States. PLoS ONE 2016, 11, e0154223. [Google Scholar] [CrossRef]
  73. Nor, A.N.M.; Corstanje, R.; Harris, J.A.; Grafius, D.R.; Siriwardena, G.M. Ecological connectivity networks in rapidly expanding cities. Heliyon 2017, 3, e00325. [Google Scholar] [CrossRef]
  74. McRae, B.H.; Kavanagh, D.M. Linkage Mapper Connectivity Analysis Software; The Nature Conservancy: Seattle, WA, USA, 2011; Available online: http://www.circuitscape.org/linkagemapper (accessed on 8 April 2023).
  75. Zeller, K.A.; McGarigal, K.; Beier, P.; Cushman, S.A.; Vickers, T.W.; Boyce, W.M. Sensitivity of landscape resistance estimates based on point selection functions to scale and behavioral state: Pumas as a case study. Landsc. Ecol. 2014, 29, 541–557. [Google Scholar] [CrossRef]
  76. Huang, X.; Wang, H.; Shan, L.; Xiao, F. Constructing and optimizing urban ecological network in the context of rapid urbanization for improving landscape connectivity. Ecol. Indic. 2021, 132, 108319. [Google Scholar] [CrossRef]
  77. Kang, J.; Li, C.; Li, M.; Zhang, T.; Zhang, B. Identifying priority areas for conservation in the lower Yellow River basin from an ecological network perspective. Ecosyst. Health Sustain. 2022, 8, 2105751. [Google Scholar] [CrossRef]
  78. Keeley, A.T.; Beier, P.; Keeley, B.W.; Fagan, M.E. Habitat suitability is a poor proxy for landscape connectivity during dispersal and mating movements. Landsc. Urban Plan. 2017, 161, 90–102. [Google Scholar] [CrossRef]
  79. Wade, A.A.; McKelvey, K.S.; Schwartz, M.K. Resistance-Surface-Based Wildlife Conservation Connectivity Modeling: Summary of Efforts in the United States and Guide for Practitioners; United States Department of Agriculture, Forest Service, Rocky Mountain Research Station: Fort Collins, CO, USA, 2015. [Google Scholar]
  80. Elliot, N.B.; Cushman, S.A.; Macdonald, D.W.; Loveridge, A.J. The devil is in the dispersers: Predictions of landscape connectivity change with demography. J. Appl. Ecol. 2014, 51, 1169–1178. [Google Scholar] [CrossRef]
  81. Dutta, T.; Sharma, S.; McRae, B.H.; Roy, P.S.; DeFries, R. Connecting the dots: Mapping habitat connectivity for tigers in central India. Reg. Environ. Change 2016, 16, 53–67. [Google Scholar] [CrossRef]
  82. Meza Mori, G.; Cotrina-Sanchez, A.; Bandopadhyay, S.; Rojas-Briceño, N.B.; Torres Guzmán, C.; Coronel Castro, E.; Oliva, M. Does climate change impact the potential habitat suitability and conservation status of the national bird of Peru (Rupicola peruvianus)? Biodivers. Conserv. 2023, 32, 2323–2344. [Google Scholar] [CrossRef]
  83. Tao, Q.; Gao, G.; Xi, H.; Wang, F.; Cheng, X.; Ou, W.; Tao, Y. An integrated evaluation framework for multiscale ecological protection and restoration based on multi-scenario trade-offs of ecosystem services: Case study of Nanjing City, China. Ecol. Indic. 2022, 140, 108962. [Google Scholar] [CrossRef]
  84. Peng, J.; Yang, Y.; Liu, Y.; Du, Y.; Meersmans, J.; Qiu, S. Linking ecosystem services and circuit theory to identify ecological security patterns. Sci. Total Environ. 2018, 644, 781–790. [Google Scholar] [CrossRef]
  85. Baldwin, R.A. Use of maximum entropy modeling in wildlife research. Entropy 2009, 11, 854–866. [Google Scholar] [CrossRef]
  86. Qiao, H.; Soberón, J.; Peterson, A.T. No silver bullets in correlative ecological niche modeling: Insights from testing among many potential algorithms for niche estimation. Methods Ecol. Evol. 2015, 6, 1126–1136. [Google Scholar] [CrossRef]
  87. Mech, L.D.; Boitani, L. Wolf Social Ecology; USGS Northern Prairie Wildlife Research Center 318: Jamestown, ND, USA, 2003. [Google Scholar]
  88. Abaigar, T.; Del Barrio, G.; Vericad, J.R. Habitat preference of wild boar (Sus scrofa L., 1758) in a mediterranean environment. Indirect Evaluation by Signs. Mammalia 2009, 58, 201–210. [Google Scholar] [CrossRef]
  89. Sawaya, M.A.; Ramsey, A.B.; Ramsey, P.W. American black bear thermoregulation at natural and artificial water sources. Ursus 2017, 27, 129–135. [Google Scholar] [CrossRef]
  90. Sun, X.; Long, Z.; Jia, J. Identifying core habitats and corridors for giant pandas by combining multiscale random forest and connectivity analysis. Ecol. Evol. 2022, 12, e8628. [Google Scholar] [CrossRef] [PubMed]
  91. Acarer, A.; Mert, A. 21st century climate change threatens on the brown bear. Cerne 2024, 30, e-103305. [Google Scholar] [CrossRef]
  92. Oğurlu, İ. Habitat Use of Red Deer (Cervus elaphus L.) in Çatacik Forest. Turk. J. Zool. 1996, 20, 427–435. [Google Scholar] [CrossRef]
  93. Erdtmann, D.; Keuling, O. Behavioural patterns of free roaming wild boar in a spatiotemporal context. PeerJ 2020, 8, e10409. [Google Scholar] [CrossRef]
  94. Gordigiani, L.; Viviano, A.; Brivio, F.; Grignolio, S.; Lazzeri, L.; Marcon, A.; Mori, E. Carried away by a moonlight shadow: Activity of wild boar in relation to nocturnal light intensity. Mammal Res. 2022, 67, 39–49. [Google Scholar] [CrossRef]
  95. Kuter, N. Ilgaz Dağı Milli Parkı’nın Orman Peyzajı Ve Estetiği Açısından Değerlendirilmesi. Turk. J. For. 2008, 9, 36–47. [Google Scholar]
  96. DeFries, R.; Parashar, S.; Neelakantan, A.; Clark, B.; Krishnaswamy, J. Landscape Connectivity For Wildlife and Water: The State of the Literature. Curr. Landsc. Ecol. Rep. 2023, 8, 149–158. [Google Scholar] [CrossRef]
  97. Shaw, A.K. Causes and consequences of individual variation in animal movement. Mov. Ecol. 2020, 8, 12. [Google Scholar] [CrossRef]
  98. Epaphras, A.M.; Gereta, E.; Lejora, I.A.; Ole Meing’ataki, G.E.; Ng’umbi, G.; Kiwango, Y.; Mwangomo, E.; Semanini, F.; Vitalis, L.; Balozi, J.; et al. Wildlife water utilization and importance of artificial waterholes during dry season at Ruaha National Park, Tanzania. Wetl. Ecol. Manag. 2008, 16, 183–188. [Google Scholar] [CrossRef]
  99. Chakuya, J.; Mandisodza-Chikerema, R.; Ngorima, P.; Malunga, A. Water sources during drought period in a savanna wildlife ecosystem, northern Zimbabwe. Geol. Ecol. Landsc. 2023, 7, 323–328. [Google Scholar] [CrossRef]
  100. Chynoweth, M.; Coban, E.; Altin, Ç.; Şekercioğlu, Ç. Human-wildlife conflict as a barrier to large carnivore management and conservation in Turkey. Turk. J. Zool. 2016, 40, 972–983. [Google Scholar] [CrossRef]
  101. Khosravi, R.; Hemami, M.R. Identifying landscape species for ecological planning. Ecol. Indic. 2019, 99, 140–148. [Google Scholar] [CrossRef]
  102. Li, Q.; Zhou, Y.; Yi, S. An integrated approach to constructing ecological security patterns and identifying ecological restoration and protection areas: A case study of Jingmen, China. Ecol. Indic. 2022, 137, 108723. [Google Scholar] [CrossRef]
Figure 1. Location of the study area, showing Ilgaz Mountain Wildlife Refuge (in blue) and Gavurdağı Wildlife Refuge (in green).
Diversity 17 00542 g001
Figure 2. Representative camera trap photographs of the five target mammal species observed in the study area: (a) Brown bear (Ursus arctos), (b) Red deer (Cervus elaphus), (c) Roe deer (Capreolus capreolus), (d) Wild boar (Sus scrofa), (e) Gray wolf (Canis lupus).
Diversity 17 00542 g002
Figure 3. Focal nodes determined within the study area.
Diversity 17 00542 g003
Figure 4. Habitat suitability maps for five large mammals in the Ilgaz Mountain and Gavurdağı WRs: (a) Brown bear (Ursus arctos), (b) Red deer (Cervus elaphus), (c) Roe deer (Capreolus capreolus), (d) Gray wolf (Canis lupus), (e) Wild boar (Sus scrofa).
Diversity 17 00542 g004
Figure 5. Wildlife Ecological Corridor maps for five large mammals in between Ilgaz Mountain and Gavurdağı WRs: (a) Brown bear (Ursus arctos), (b) Red deer (Cervus elaphus), (c) Roe deer (Capreolus capreolus), (d) Gray wolf (Canis lupus), (e) Wild boar (Sus scrofa).
Diversity 17 00542 g005
Figure 6. Possible two wildlife ecological corridors identified between Ilgaz Mountain WR and Gavurdağı WR.
Diversity 17 00542 g006
Table 1. The relative contributions and permutation importance to the MaxEnt model of environmental variables for brown bear.
Ecological VariablePercent ContributionPermutation Importance
Water sources53.339.8
Stand type19.712.5
Slope12.114
Aspect8.213.2
Solar radiation3.74.8
Hillshade2.915.6
Ruggedness0.10.1
Table 2. The relative contributions and permutation importance to the MaxEnt model of environmental variables for red deer.
Ecological VariablePercent ContributionPermutation Importance
Water sources4550.3
Stand type30.423.3
Slope10.111.8
Aspect6.37.5
Hillshade31.9
Solar radiation33.7
Ruggedness1.81.4
Table 3. The relative contributions and permutation importance to the MaxEnt model of environmental variables for roe deer.
Ecological VariablePercent ContributionPermutation Importance
Stand type40.232.3
Water sources32.325.7
Slope17.423.9
Aspect43.6
Hillshade3.410.4
Solar radiation23
Ruggedness0.71
Table 4. The relative contributions and permutation importance to the MaxEnt model of environmental variables for gray wolf.
Ecological VariablePercent ContributionPermutation Importance
Water sources47.445.3
Stand type22.324.1
Aspect10.13.5
Hillshade8.67.8
Slope7.814.5
Solar radiation2.73.8
Ruggedness1.21
Table 5. The relative contributions and permutation importance to the MaxEnt model of environmental variables for wild boar.
Ecological VariablePercent ContributionPermutation Importance
Water sources53.339.8
Stand type19.712.5
Slope12.114
Aspect8.213.2
Solar radiation3.74.8
Hillshade2.915.6
Ruggedness0.10.1
Disclaimer/Publisher’s Note: The statements, opinions and data contained in all publications are solely those of the individual author(s) and contributor(s) and not of MDPI and/or the editor(s). MDPI and/or the editor(s) disclaim responsibility for any injury to people or property resulting from any ideas, methods, instructions or products referred to in the content.

