1. Introduction
The study of bird migration is paramount in ornithology and involves the use of various methodologies [
1,
2,
3,
4]. Bird migration research historically focused primarily on specific species or taxa, neglecting the avian spectrum as a whole [
5,
6,
7,
8,
9]. Research shows the North American flyway is conventionally divided into the Pacific, Central, Mississippi and Atlantic flyways [
10,
11,
12,
13,
14,
15,
16,
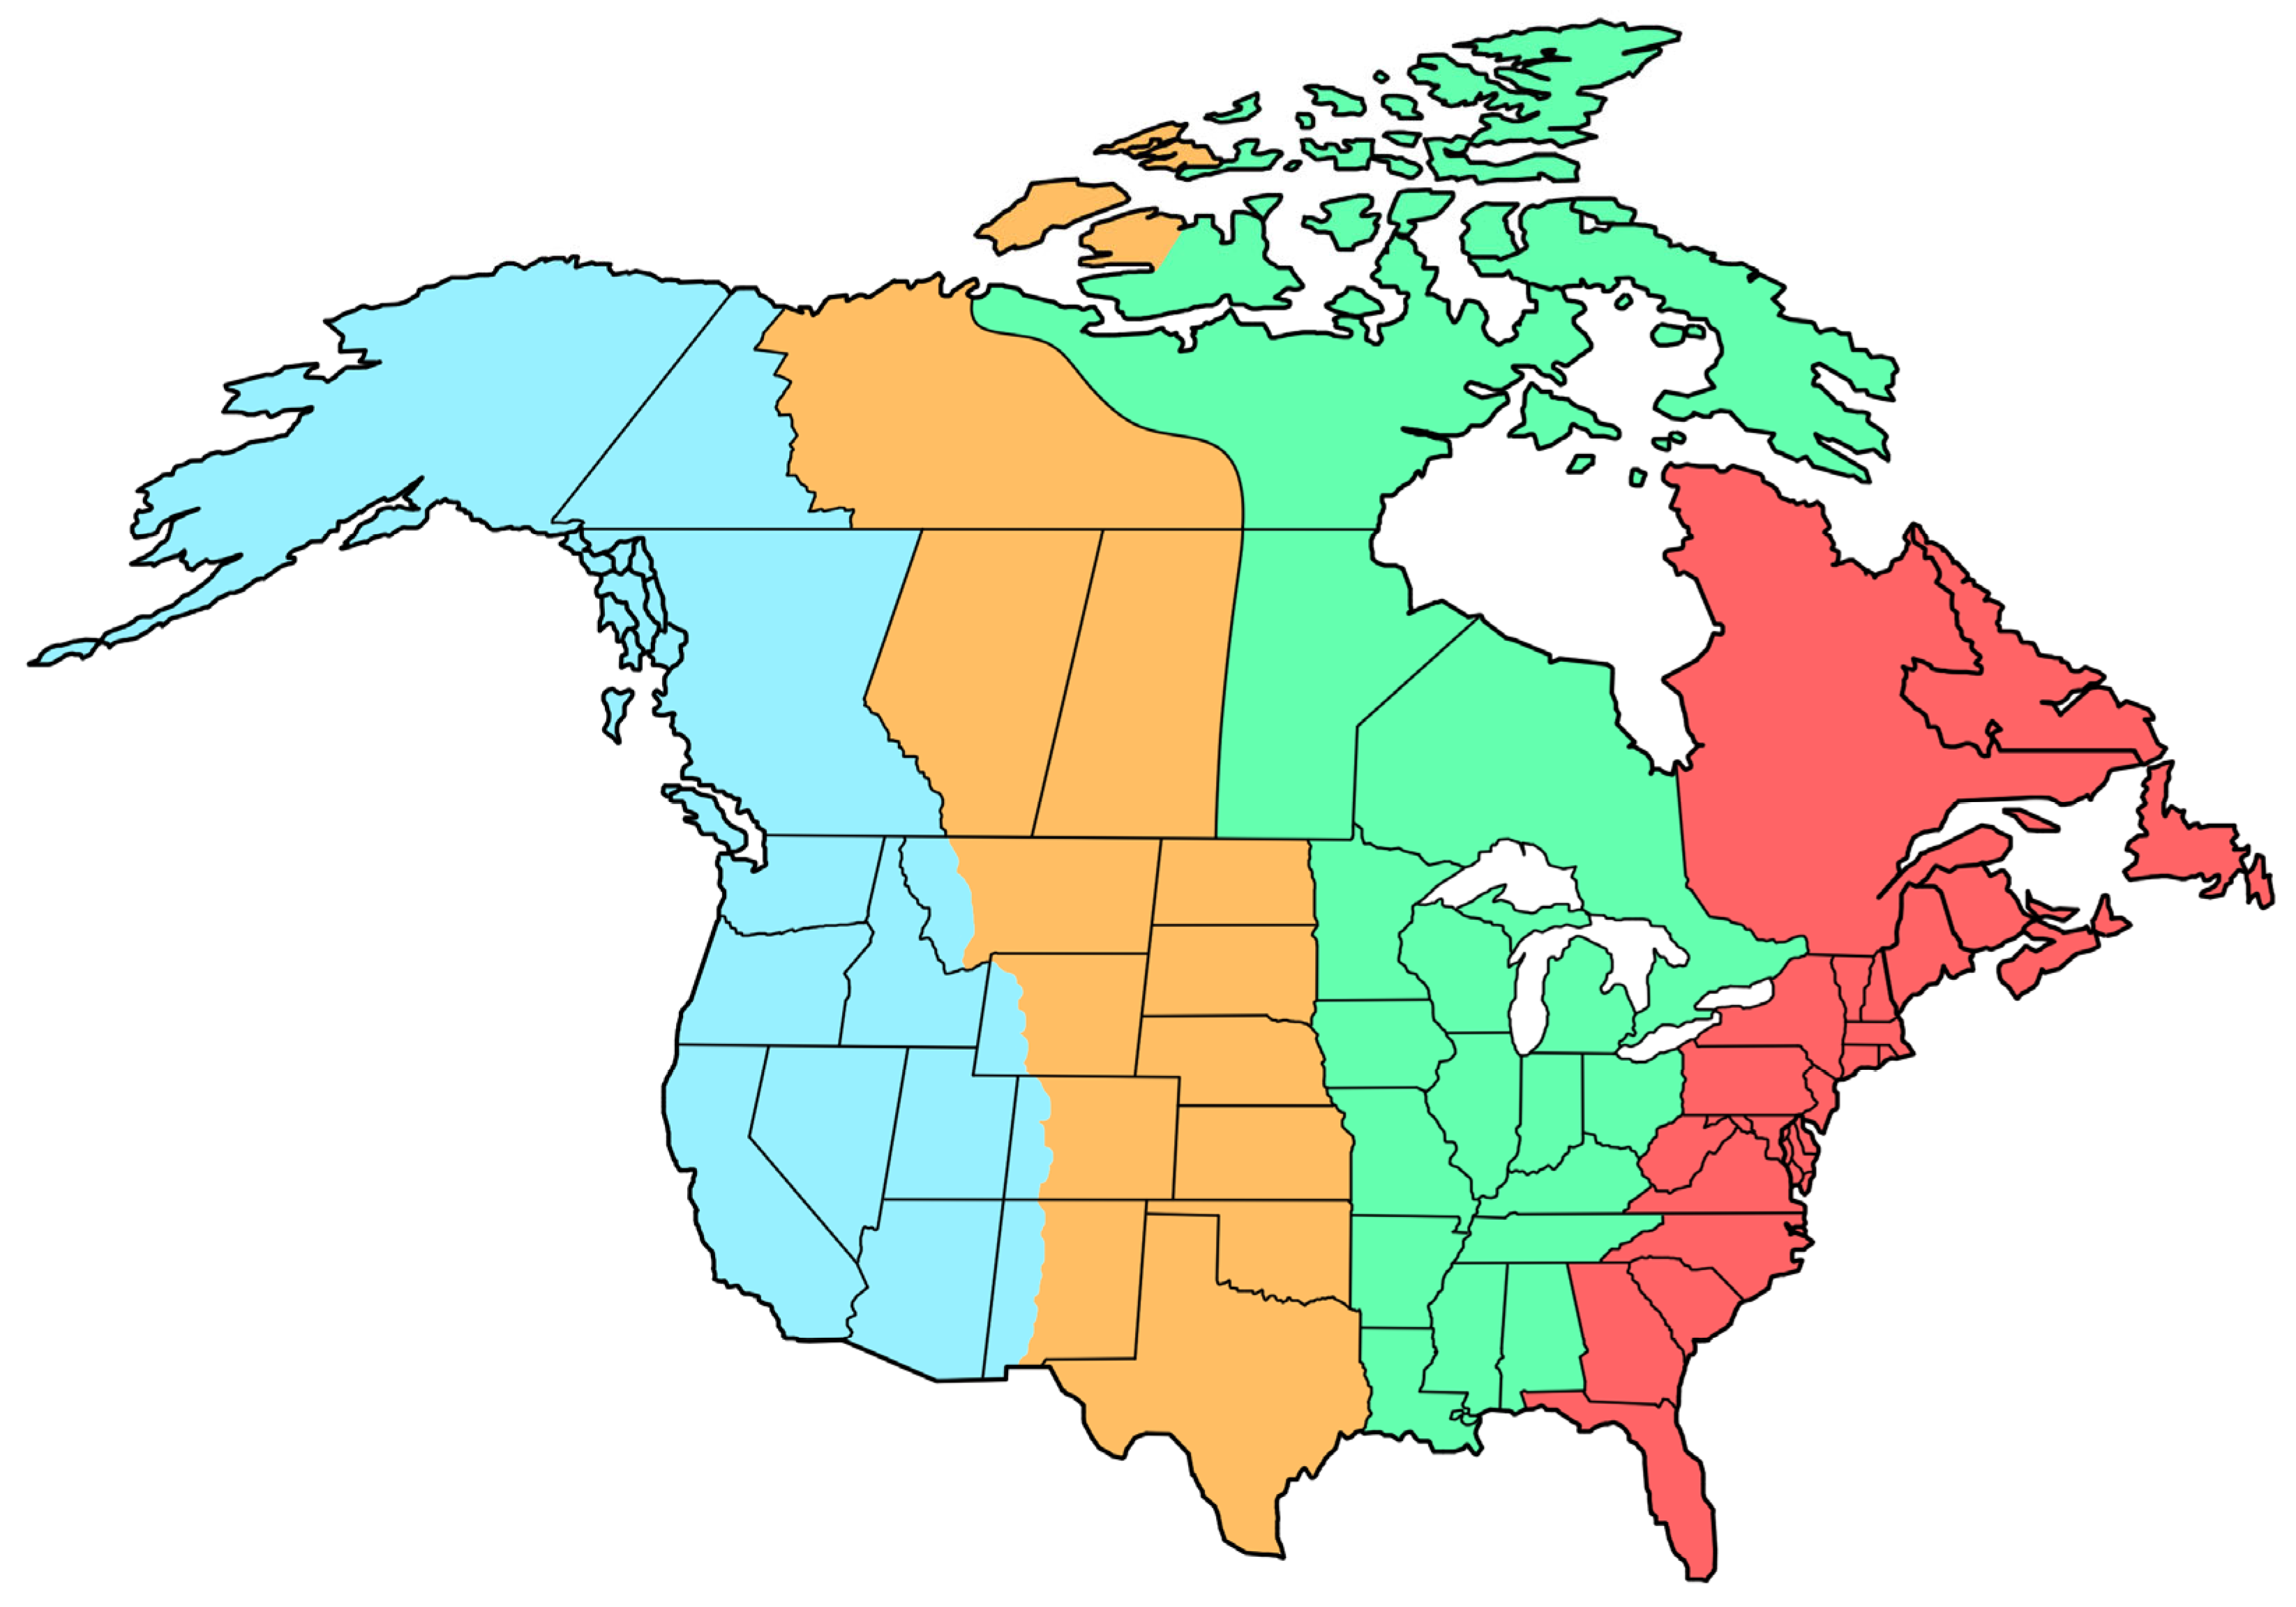
17] (
Figure 1). Despite methodological advancements, such as ring banding and satellite tracking, which have revealed the migratory paths of many bird species, including established routes [
17,
18,
19,
20], the results obtained using these methods offer limited perspectives owing to their microecological focus. In particular, satellite tracking is expensive; satellite tracking and ringing fail to encompass entire bird populations, which may number tens to hundreds of thousands [
20,
21]. Therefore, complementary macroecological studies are imperative for a comprehensive understanding of bird migration dynamics.
Based on data obtained with permission from eBird, the world’s largest avian database, we studied bird migration across the North American continent (US and Canada, excluding Mexico). eBird [
22], a citizen science initiative, includes a densely organised network of observation points across the continent. The extensive data repository has facilitated numerous avian studies, including resident and migratory birds, over an extended period [
23,
24,
25].
Figure 1.
Establish bird flight path predictions across the North American continent. From left to right: the Pacific (blue), Central (yellow), Mississippi (green) and Atlantic (red) flyways.
Figure 1.
Establish bird flight path predictions across the North American continent. From left to right: the Pacific (blue), Central (yellow), Mississippi (green) and Atlantic (red) flyways.
Until now, there has been no discussion from a migration research perspective on how useful big data collected from citizen scientists is and when the collected data should be used to improve statistical resolution.
We hypothesised that data containing resident and migratory bird counts would exhibit regional characteristics, and that macroecological analysis of the relationships among all regions and those with regional characteristics would reveal patterns in bird migration routes. To test this hypothesis, we divided the North American continent into states and conducted a state-level analysis of annual data. We focused on beta diversity, a concept integral to understanding the relationships among all states and states with characteristic traits.
Therefore, we want to share our research results widely to present the connection between big data and migration research for the first time and create a foundation for future researchers to actively utilise big data.
2. Materials and Methods
2.1. Research Design
Beta diversity, which indicates the similarity between regions, becomes closer on the figure when the species composition is similar and becomes farther away as the species composition differs. Because of this characteristic, when analysing beta diversity only for resident birds in various regions, the difference between adjacent regions may be small or almost nonexistent. In this situation, it is migratory birds that cause the differences between each region. Since they move in flocks in their preferred direction, they can be divided into several groups according to their migration route and show differences in beta diversity. Because of this characteristic, by using big data on resident and migratory birds accumulated in each region, resident bird data can establish a basis for positioning on the beta diversity figure, and migratory bird data can show differences between each region and form migration routes on the figure.
2.2. Data Downloading and Pre-Processing
Upon obtaining permission from eBird in 2021, we downloaded the entire 189 Gb dataset up to 2023, which was a process that lasted approximately 3 days. Subsequently, we extracted 538 Gb of UTF-16LE-coded text files in the Windows environment in increments of 1 million lines and created and saved new files [
26]. These text files were then transferred to the Linux environment for salting and conversion into the UTF-8 format for the North American countries included in our analysis [
27,
28]. The ‘data.table’ package was used to import the salted data into the R program, where it was merged by year and state before being pre-processed into a format compatible with the ‘phyloseq’ package for subsequent analysis [
29,
30,
31,
32].
2.3. Data Analysis and Visualisation
The ‘tibble’ package was used for conversion to phyloseq objects, and the ‘ggplot2’ package was used for analysis and visualisation [
33,
34,
35,
36,
37]. We plotted beta diversity using one year of data collected in each region as a single dataset. Each dot on the beta diversity figure represents one year of data for one region. Since data from the distant past, not recent data, were not recorded on-site, we set various time periods to see when data began to provide high resolution for migration paths. Two beta diversity metrics were visualised by pre-processing data for each year as follows: 1910–2023, 1920–2023, 1930–2023, 1940–2023, 1950–2023, 1960–2023, 1970–2023, 1980–2023 and 1990–2023 (
Figure 2 and
Figure 3).
The ‘microViz’ package was used to visualise beta diversity [
38], with two types of beta diversity plots generated based on the (i) Aitchison distance and (ii) redundancy analysis to depict genus level directionality. Given the compositional nature of the total bird population on the North American continent, we employed the Aitchison distance, which is suitable for compositional data analysis [
39]. To identify the bird taxa represented in each flyway, we used redundancy analysis [
40,
41] (
Figure 4). For the final flyway plot and redundancy analysis, data from 1990 to 2023 were plotted to present a visibly clear division.
3. Results
3.1. Utility of Accumulated eBird Data
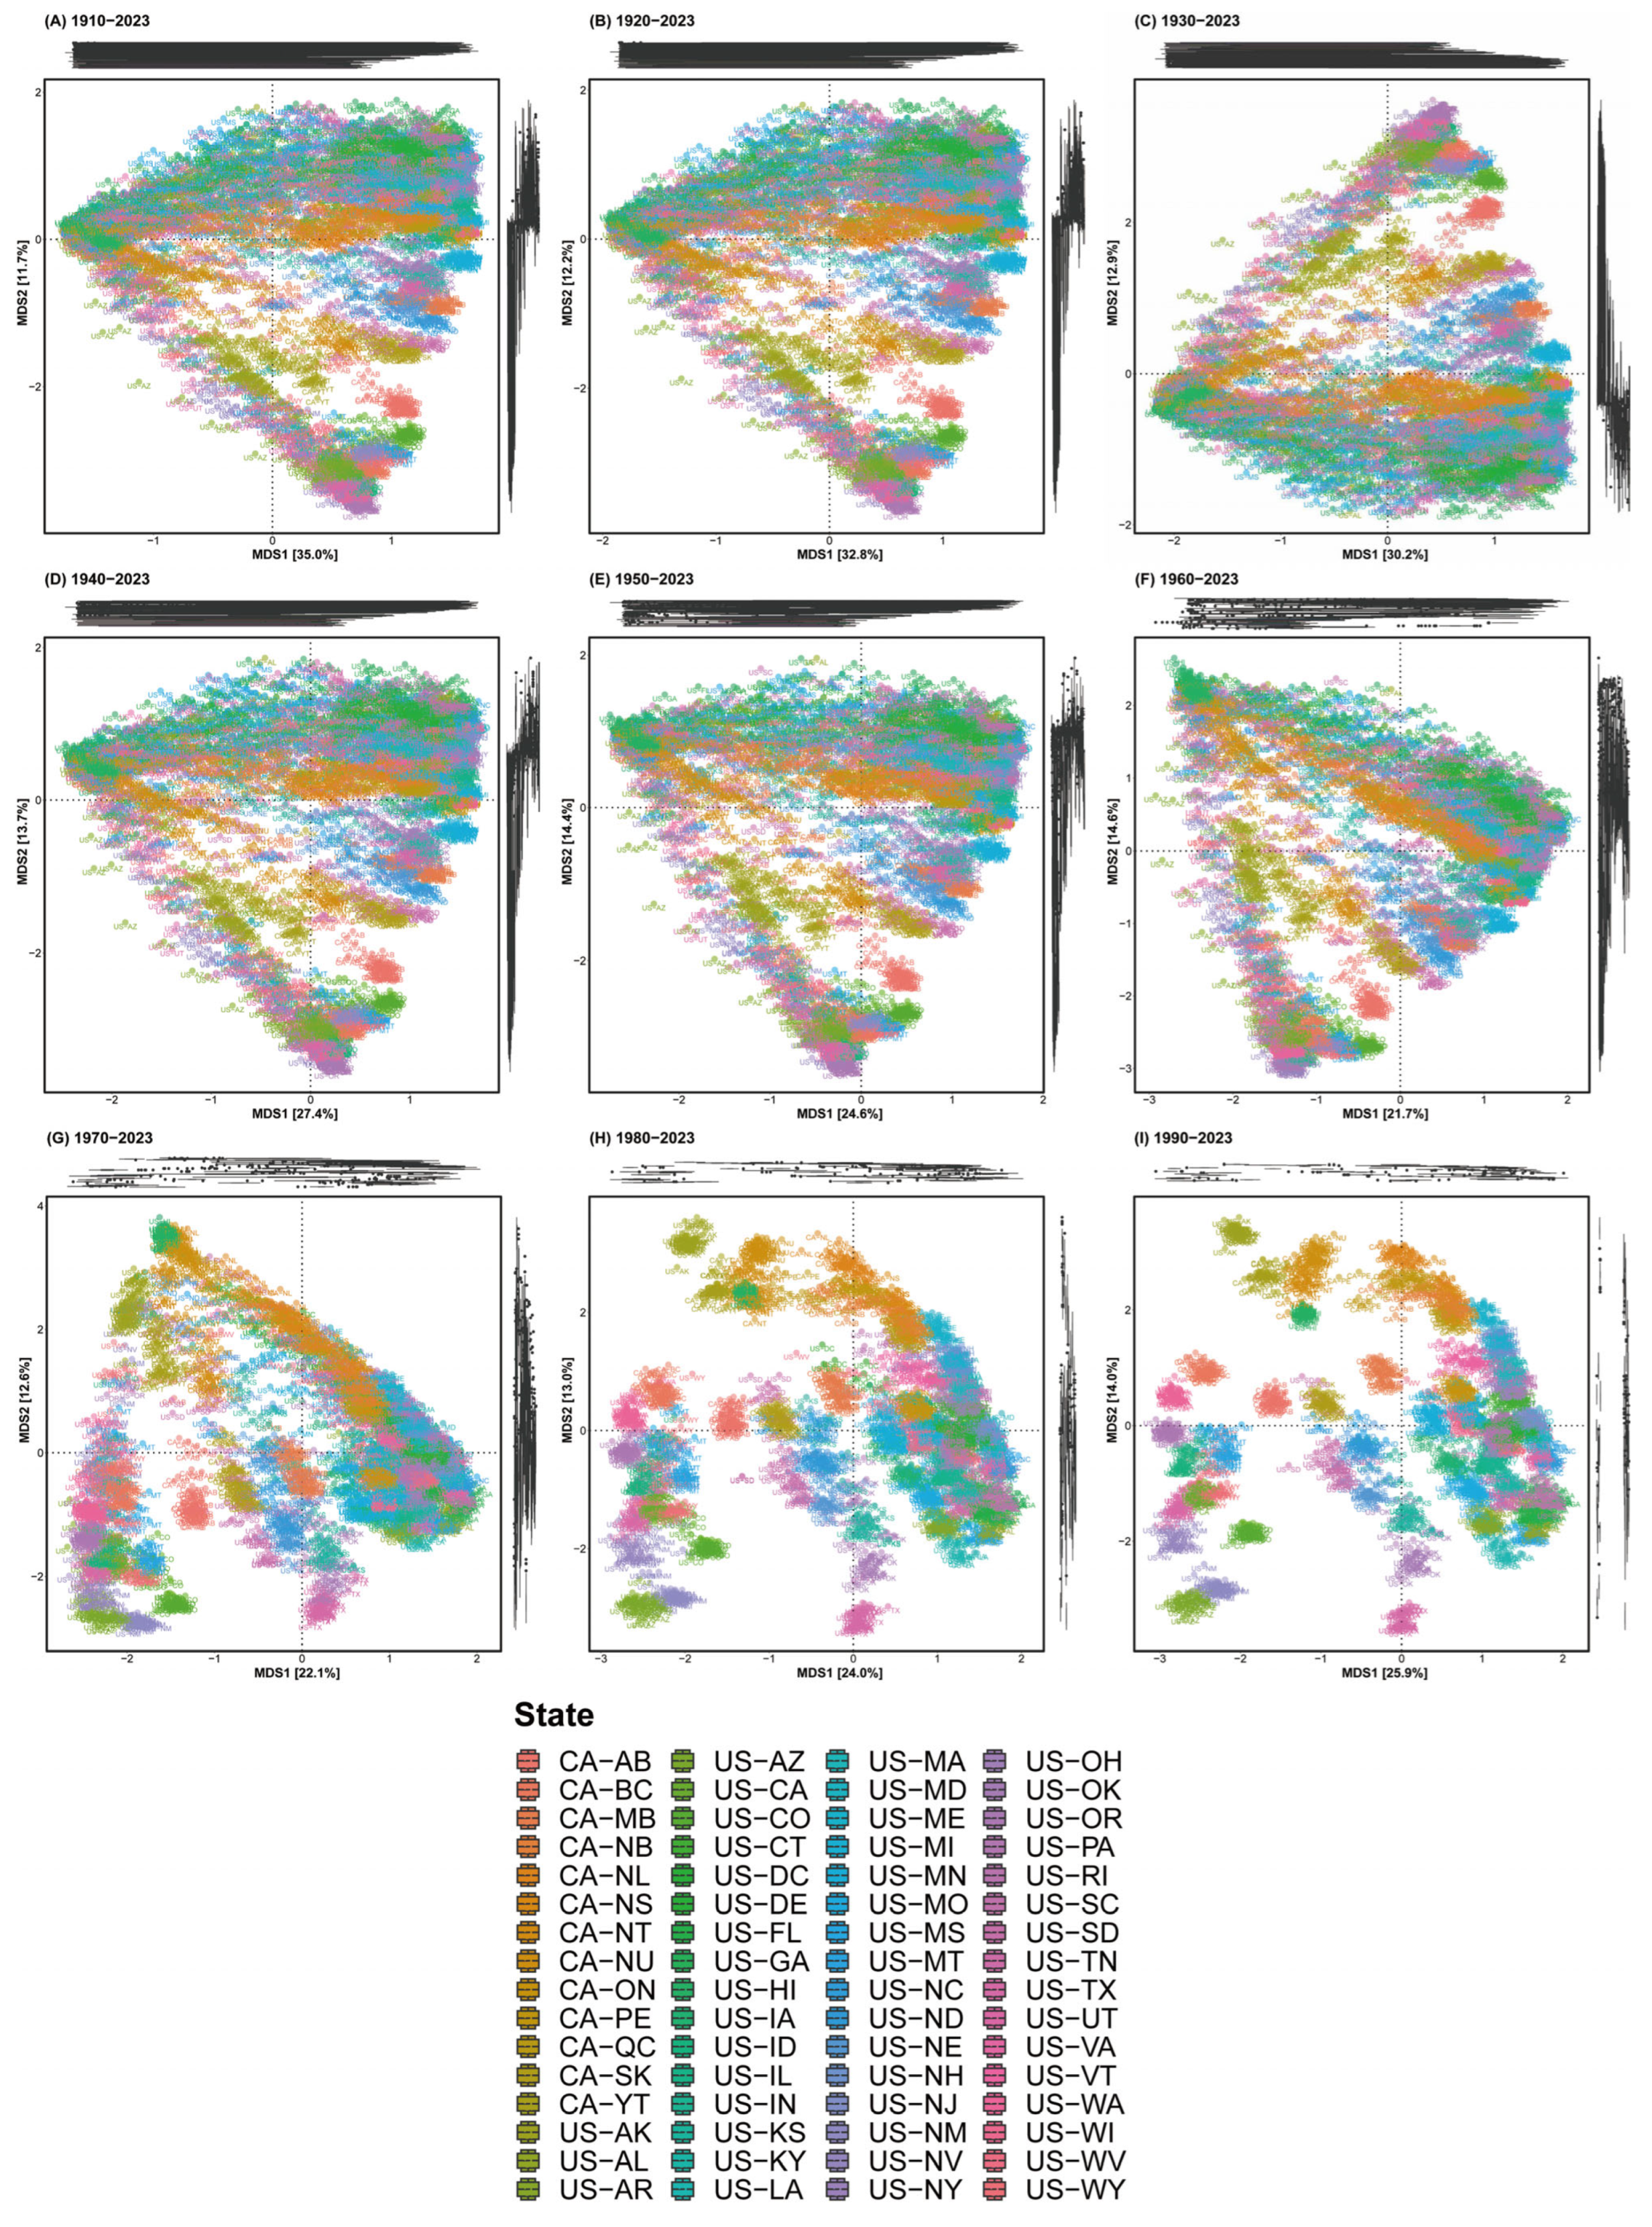
From 1910 to 2023, the cumulative eBird dataset was first organised into nine subsets as follows: 1910–2023, 1920–2023 and 1990–2023. The beta diversity of each subset was then visualised using the Aitchison distance (
Figure 2). Results revealed that the inclusion of pre-1980 data led to the geographic locations of all birds being interconnected from Hawaii. Conversely, using 1980–2023 and 1990–2023 data, the plots exhibited separation, closely aligning with the North American continent’s main geographic areas. However, an anomaly arose with the post-1980 data, where plots for Hawaii, located within the Pacific flyway, deviated from their actual geographic locations. Nevertheless, excluding Hawaii, the data are highly valuable for examining migration pathways across continental areas and will inform future analyses.
Figure 2.
Beta diversity depicted across nine datasets. (A) 1910–2023, (B) 1920–2023, (C) 1930–2023, (D) 1940–2023, (E) 1950–2023, (F) 1960–2023, (G) 1970–2023, (H) 1980–2023 and (I) 1990–2023 data. Distinct regional trends emerged after 1980.
Figure 2.
Beta diversity depicted across nine datasets. (A) 1910–2023, (B) 1920–2023, (C) 1930–2023, (D) 1940–2023, (E) 1950–2023, (F) 1960–2023, (G) 1970–2023, (H) 1980–2023 and (I) 1990–2023 data. Distinct regional trends emerged after 1980.
3.2. Three Primary Migration Pathways in North America
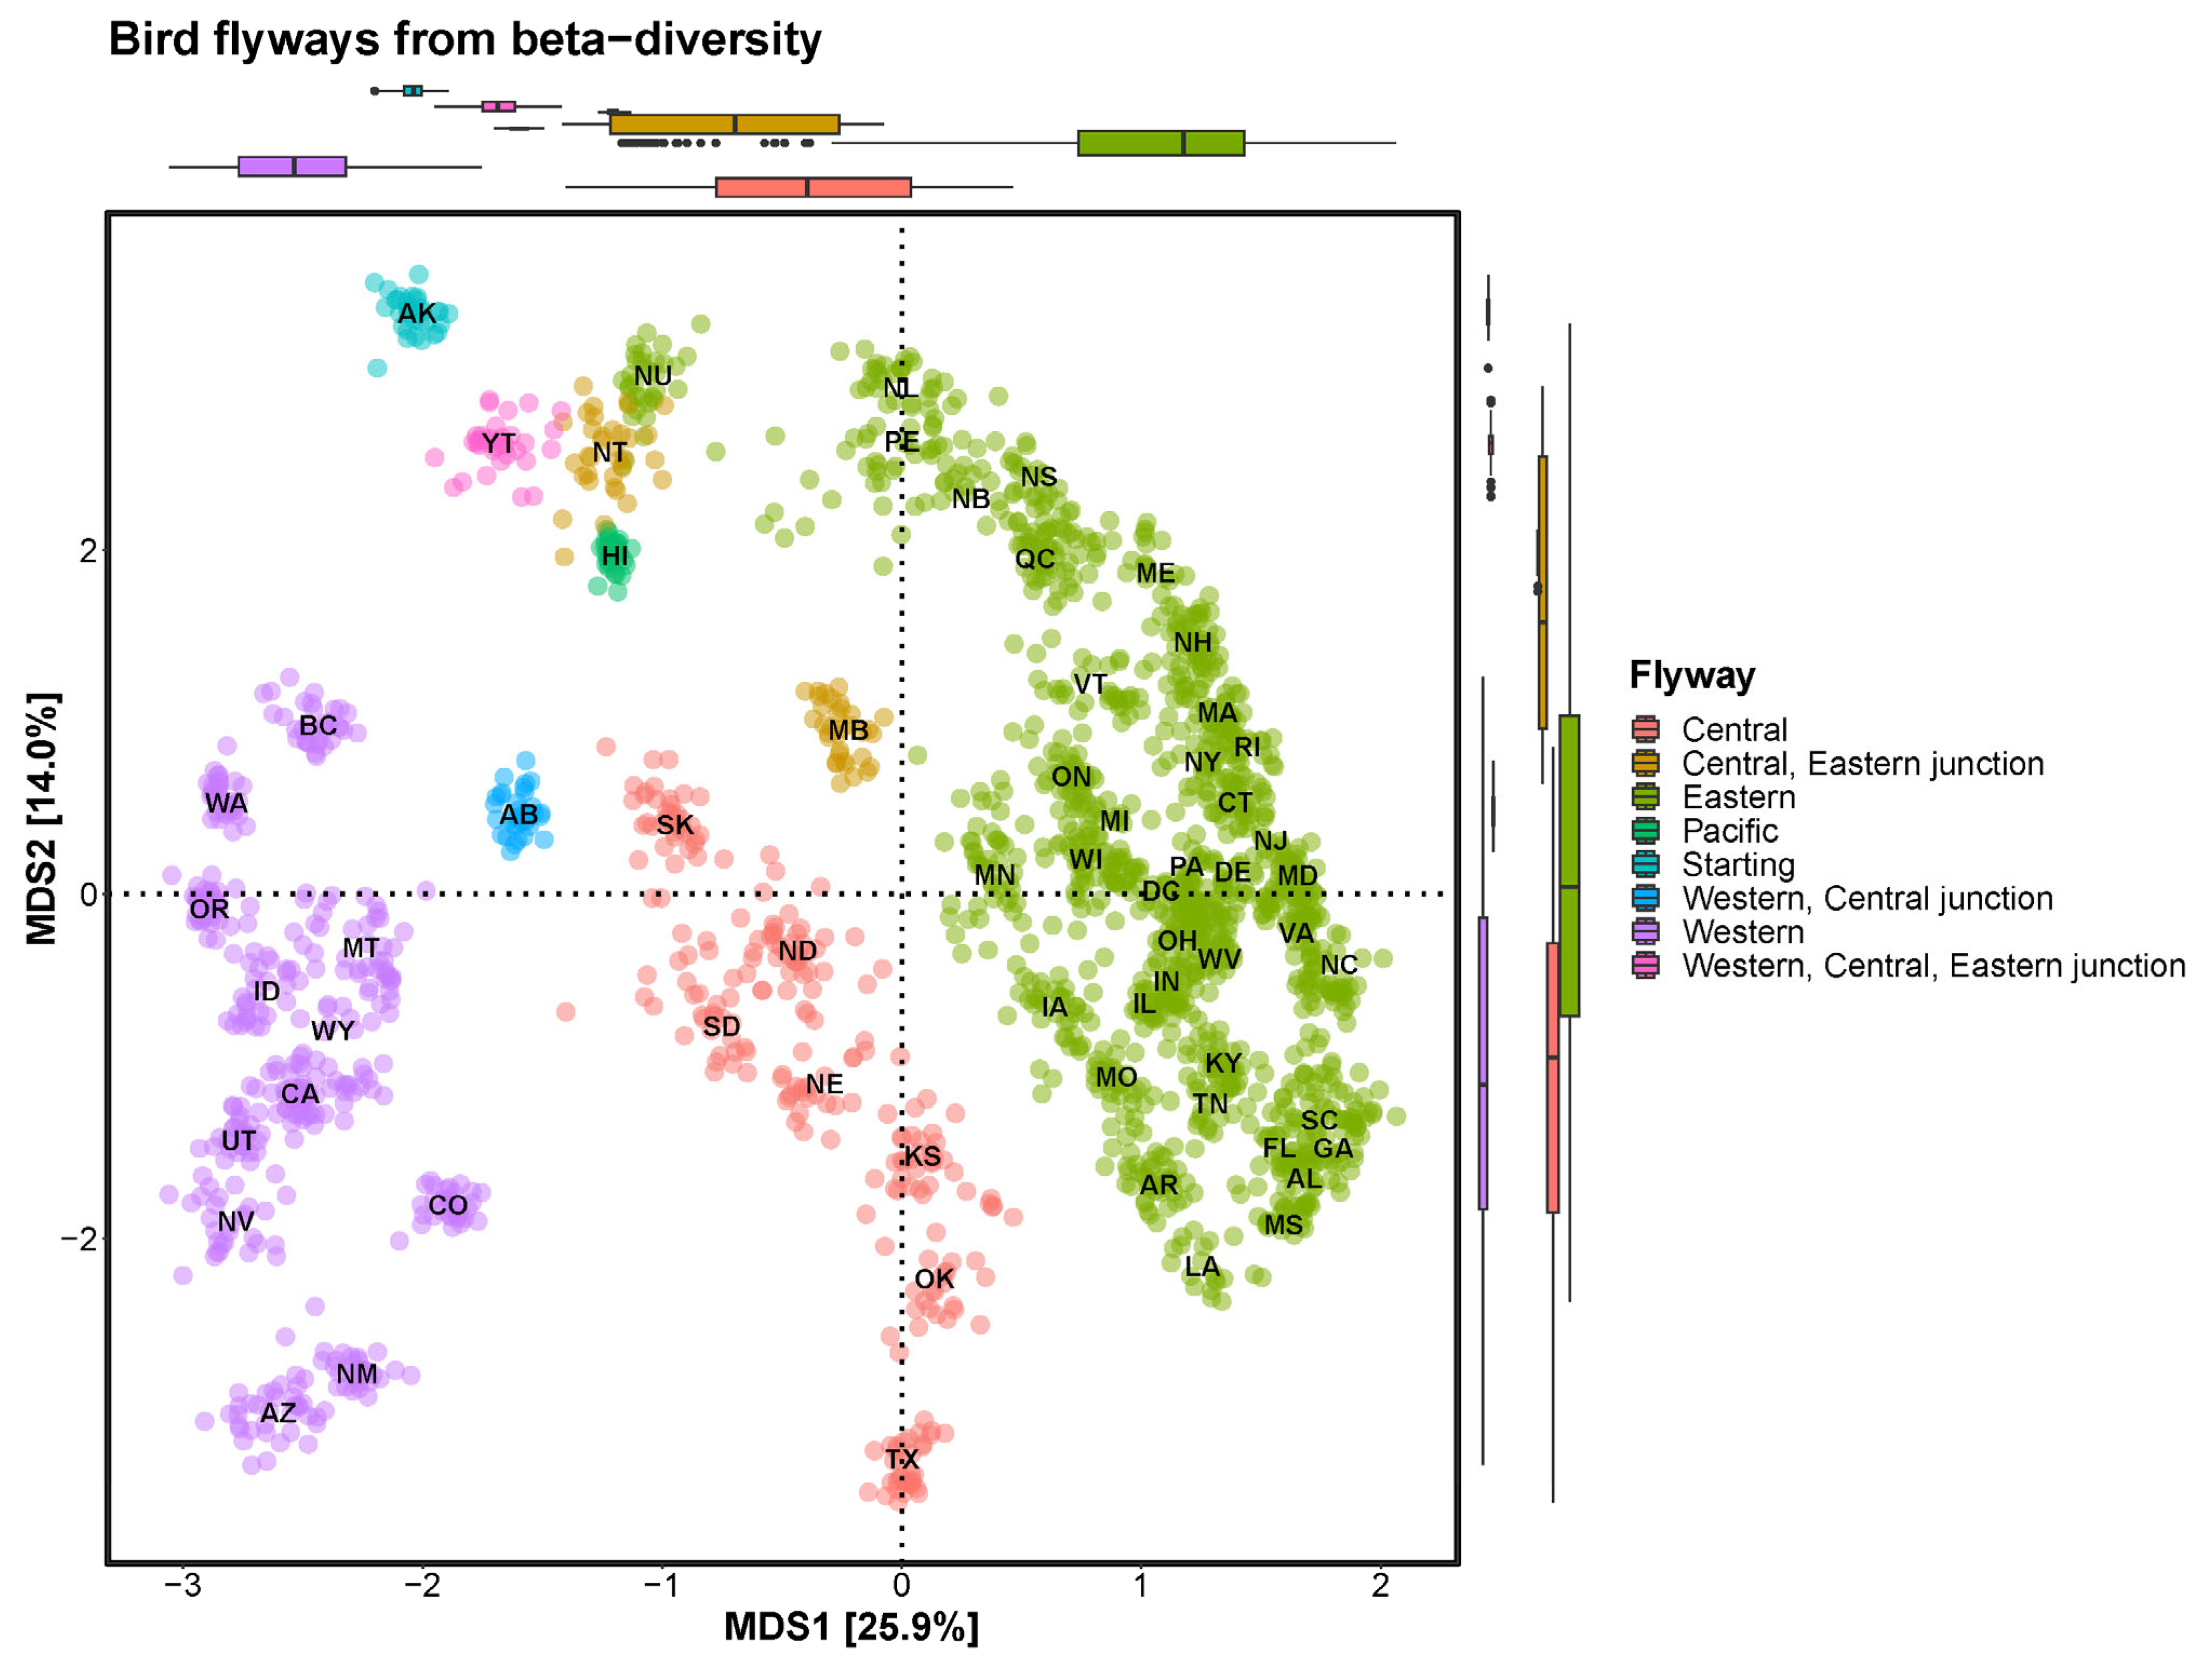
Our analysis delineates three primary migratory pathways on the North American continent, which are distinct from previous descriptions [
42] (
Figure 3). Starting from Alaska (AK) and ending at the Yukon Territory, bird migration can be divided into three main branches, the western, central and eastern flyways. Of these flyways, the western originates from British Columbia, the central from Saskatchewan (SK) and the eastern from Nunavut (NU), and end at Newfoundland and Labrador. Notably, a bifurcation was observed between the western and central flyways in Alberta (AB), and between the central and eastern flyways in the Northwest Territories and Manitoba (MB).
Although the boundary between the western and central flyways is blurred in existing migration routes [
40], our analysis includes a distinct division by state across the North American continent. The central flyway, comprising Saskatchewan (SK)–North Dakota (ND)–South Dakota (SD)–Nebraska (NE)–Kansas (KS)–Oklahoma (OK)–Texas (TX), exhibits a bird composition more similar to that of the eastern flyway than to that of the western flyway. Detailed examination revealed the potential subdivision of the eastern flyway into three travel routes as follows: the known Mississippi flyway (composed of Michigan [MN]–Iowa [IA]–Missouri [MO]–Arkansas [AR]–Louisiana [LA]), the Atlantic flyway formed along the coast and an inland flyway formed between the Mississippi and Atlantic flyways.
Figure 3.
Bird flyways illustrated by beta diversity. The flyways of the North American continent are broadly divided into the Western, Central, and Eastern flyways. The Eastern flyway is further divided into three more detailed flyways.
Figure 3.
Bird flyways illustrated by beta diversity. The flyways of the North American continent are broadly divided into the Western, Central, and Eastern flyways. The Eastern flyway is further divided into three more detailed flyways.
3.3. Top 20 Genera in Flyways
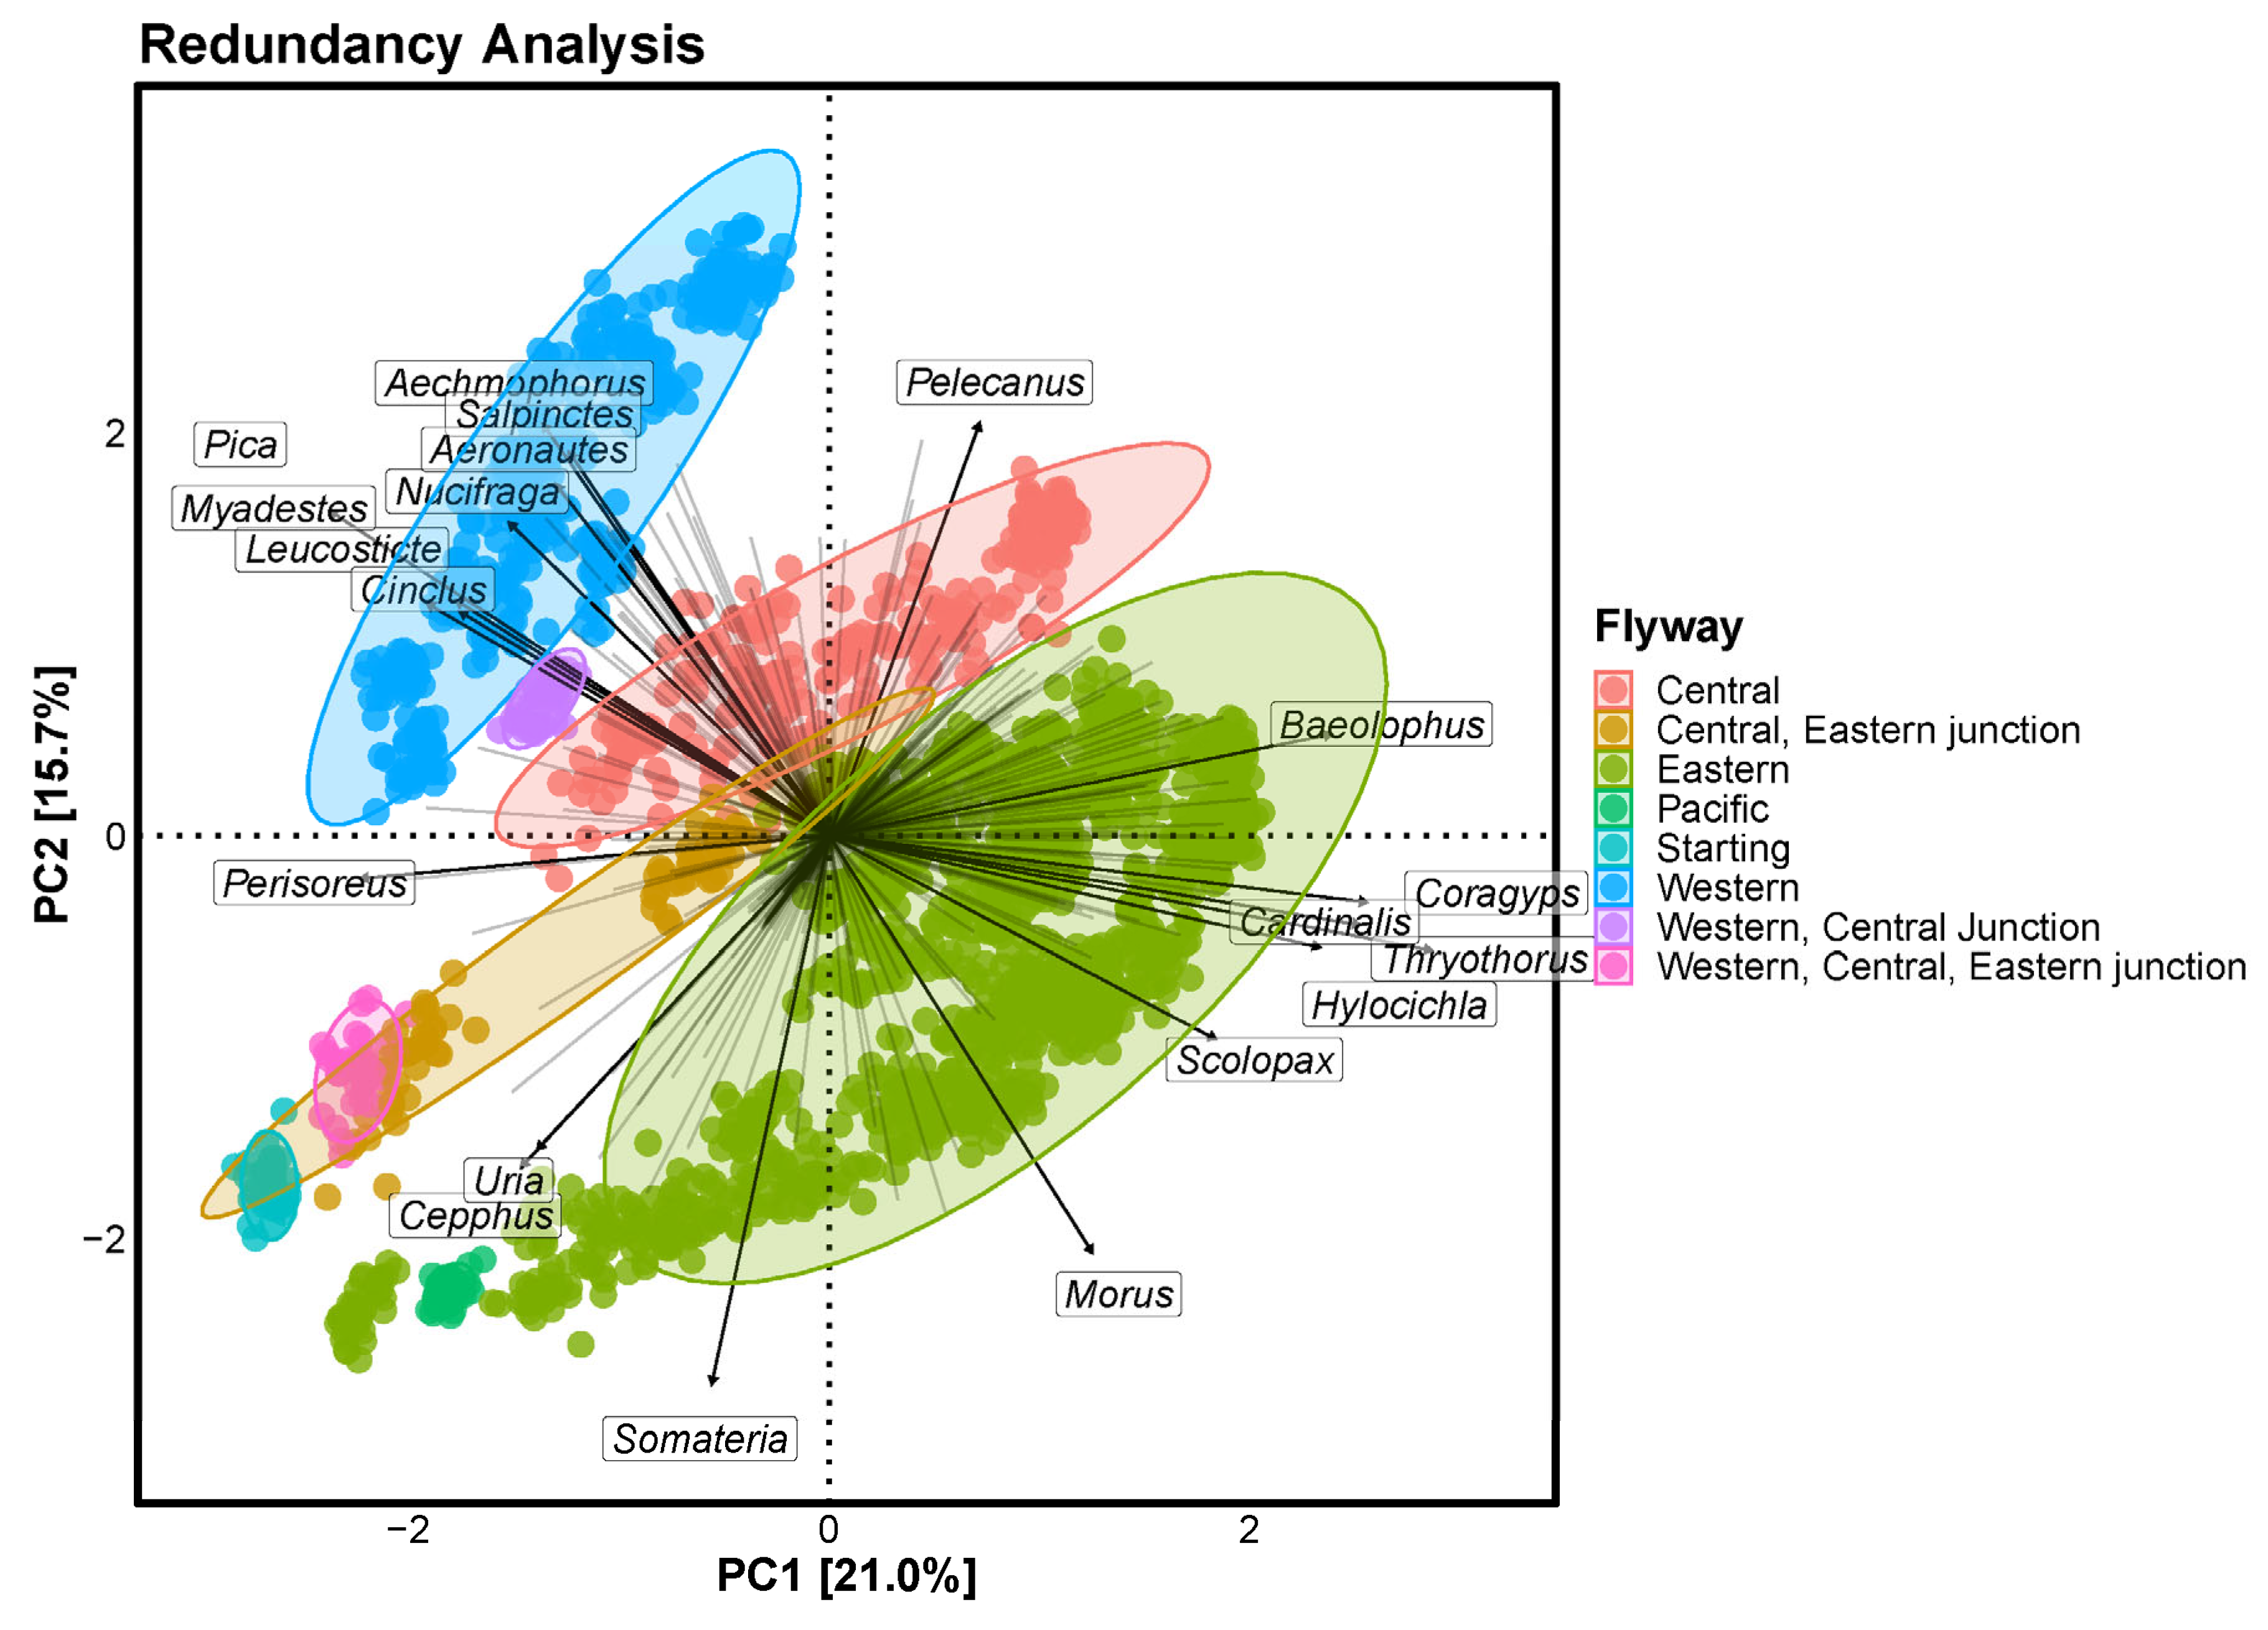
The resultant plot shows directionality in the North American continent, with Uria and Cepphus dominating in the north, Somateria in the northeast and Perisoreus in the northwest. Morus and Scolopax tended to be more abundant in the east of the continent, whereas Hylocichla, Thryothorus, Cardinalis, Coragyps and Baeolophus were more abundant in the southeast. In the west of the continent, Aechmophorus, Salpinctes, Aeronautes, Nucifraga, Pica, Myadestes, Leucosticte and Cinclus were found in greater numbers, with Pelecanus dominating the south.
4. Discussion
The importance of ‘big data’ is increasing in the modern world, allowing for more diverse and profound analytics through the accumulation of extensive datasets over prolonged periods [
43,
44,
45,
46]. The eBird data epitomises this trend by aggregating contributions from countless citizens who report bird sightings from various locales, ranging from backyards to mountains, rivers and coasts, thereby identifying ‘hotspots’ for ongoing data collection [
47] and enriching the compositional data of avian populations in different areas [
48,
49].
We evaluated the completeness of the eBird data by assessing beta diversity patterns, revealing enhanced regional trends using cumulative data extending from 1980 onwards. Our findings can guide future research involving compositional data analysis. Moreover, the continuous accumulation of data from densely populated ‘hotspots’ beyond North America could facilitate validation and analysis in other regions.
Mapping bird migration across the North American continent relied on the most comprehensive and accessible compositional dataset available due to eBird’s widespread adoption by individuals from diverse locations. Rather than relying solely on predictions from existing microecological data for North America, we generated a data-driven map of macroscale bird movements that encompassed all bird species. Our results complement existing bird flyway maps in North America, which often focus on select species and/or taxa.
Although studying the migratory routes of individual species or taxonomic groups typically requires expensive equipment and extensive human resources, our findings highlight the scalability of bird macroecology, including distribution patterns and migration dynamics across North America, using the contributions of a large group of citizen scientists. Integrating micro- and macroecological perspectives is crucial for a comprehensive understanding of bird migration. Moreover, the formation of macroecological communities of ‘big data builders’, such as eBird, in regions beyond North America holds promise for global analyses of bird migration routes based on extensive datasets.
Whether to divide the migratory routes of birds into three or four remains controversial. One limitation of this study was that we could not demonstrate the migratory routes of individual bird species. Each individual bird species may have four, fewer or more migratory routes; therefore, the four previously known migratory routes do not reflect the migratory routes of individual bird species. The results of the present study are different from those of previous studies because they reflect the migration patterns of birds that migrate in large flocks rather than the migration paths of individual species; these results can help in understanding the overall macroscopic flow.
Figure 4.
Redundancy analysis at the genus level. Each arrow indicates an increase in the bird population within a given genus as it progresses.
Figure 4.
Redundancy analysis at the genus level. Each arrow indicates an increase in the bird population within a given genus as it progresses.
5. Conclusions
We have shown that eBird data accumulated over approximately 100 years show specific macroecological patterns since the 1980s. In addition, using data accumulated since the 1980s, we have shown for the first time that the migration paths of large-scale bird communities can be drawn on beta diversity. Our research provides insight into new understanding of bird migration routes, which can be used to conserve bird migration routes or individual birds.
Author Contributions
Conceptualization, C.-E.P.; methodology, C.-E.P.; data curation, C.-E.P.; data analysis, C.-E.P.; visualisation, C.-E.P.; writing—original draft preparation, C.-E.P.; writing—review and editing, H.-C.P.; supervision, H.-C.P. All authors have read and agreed to the published version of the manuscript.
Funding
This research received no external funding.
Institutional Review Board Statement
Not applicable.
Data Availability Statement
The data that support the findings of this study are available from ebird. Restrictions apply to the availability of these data, which were used under license for this study. Data are available
https://ebird.org/data/download/ebd (accessed on 14 February 2025) with the permission of ebird.
Acknowledgments
We would like to express our gratitude to all those who worked hard in the field to collect data, record data, and provide data.
Conflicts of Interest
The authors declare no conflicts of interest.
Abbreviations
The following abbreviations are used in this manuscript:
| US | United States of America |
| CA | Canada |
| AB | Alberta |
| BC | British Columbia |
| MB | Manitoba |
| NB | New Brunswick |
| NL | Newfoundland and Labrador |
| NS | Nova Scotia |
| NT | Northwest Territories |
| NU | Nunavut |
| ON | Ontario |
| PE | Prince Edward Island |
| QC | Quebec |
| SK | Saskatchewan |
| YT | Yukon |
| AK | Alaska |
| AL | Alabama |
| AR | Arkansas |
| AZ | Arizona |
| CA | California |
| CO | Colorado |
| CT | Connecticut |
| DC | District of Columbia |
| DE | Delaware |
| FL | Florida |
| GA | Georgia |
| HI | Hawaii |
| IA | Iowa |
| ID | Idaho |
| IL | Illinois |
| IN | Indiana |
| KS | Kansas |
| KY | Kentucky |
| LA | Louisiana |
| MA | Massachusetts |
| MD | Maryland |
| ME | Maine |
| MI | Michigan |
| MN | Minnesota |
| MO | Missouri |
| MS | Mississippi |
| MT | Montana |
| NC | North Carolina |
| ND | North Dakota |
| NE | Nebraska |
| NH | New Hampshire |
| NJ | New Jersey |
| NM | New Mexico |
| NV | Nevada |
| NY | New York |
| OH | Ohio |
| OK | Oklahoma |
| OR | Oregon |
| PA | Pennsylvania |
| RI | Rhode Island |
| SC | South Carolina |
| SD | South Dakota |
| TN | Tennessee |
| TX | Texas |
| UT | Utah |
| VA | Virginia |
| VT | Vermont |
| WA | Washington |
| WI | Wisconsin |
| WV | West Virginia |
| WY | Wyoming |
References
- Alerstam, T. Optimal bird migration revisited. J. Ornithol. 2011, 152 (Suppl. S1), 5–23. [Google Scholar] [CrossRef]
- Higuchi, H. Bird migration and the conservation of the global environment. J. Ornithol. 2012, 153 (Suppl. S1), 3–14. [Google Scholar] [CrossRef]
- Salewski, V.; Bruderer, B. The evolution of bird migration—A synthesis. Naturwissenschaften 2007, 94, 268–279. [Google Scholar] [CrossRef]
- Berthold, P.; Terrill, S.B. Recent advances in studies of bird migration. Annu. Rev. Ecol. Syst. 1991, 357–378. [Google Scholar] [CrossRef]
- Dufour, P.; de Franceschi, C.; Doniol-Valcroze, P.; Jiguet, F.; Guéguen, M.; Renaud, J.; Crochet, P.A. A new westward migration route in an Asian passerine bird. Curr. Biol. 2021, 31, 5590–5596. [Google Scholar] [CrossRef]
- Kirby, J.S.; Stattersfield, A.J.; Butchart, S.H.; Evans, M.I.; Grimmett, R.F.; Jones, V.R.; Newton, I. Key conservation issues for migratory land-and waterbird species on the world’s major flyways. Bird Conserv. Int. 2008, 18 (Suppl. S1), S49–S73. [Google Scholar] [CrossRef]
- Boere, G.C.; Galbraith, C.A.; Stroud, D.A. (Eds.) Waterbirds Around the World: A Global Overview of the Conservation, Management and Research of the World’s Water-Bird Flyways; The Stationary Office Limited: Edinburgh, UK, 2006. [Google Scholar]
- Bamford, M.; Watkins, D.; Bancroft, W.; Tischler, G.; Wahl, J. Migratory Shorebirds of the East Asian-Australasian Flyway: Population Estimates and Internationally Important Sites; Wetlands International: Canberra, Australia, 2008; p. 237. [Google Scholar]
- Guilherme, J.L.; Jones, V.R.; Catry, I.; Beal, M.; Dias, M.P.; Oppel, S.; Rodrigues, A.S. Connectivity between countries established by landbirds and raptors migrating along the African–Eurasian flyway. Conserv. Biol. 2023, 37, e14002. [Google Scholar] [CrossRef] [PubMed]
- Wilson, R.M. Seeking Refuge: Birds and Landscapes of the Pacific Flyway; University of Washington Press: Seattle, DC, USA, 2011. [Google Scholar]
- Warnock, N.; Page, G.W.; Ruhlen, T.D.; Nur, N.; Takekawa, J.Y.; Hanson, J.T. Management and conservation of San Francisco Bay salt ponds: Effects of pond salinity, area, tide, and season on Pacific Flyway waterbirds. Waterbirds 2002, 25, 79–92. [Google Scholar]
- Johnsgard, P. Wings over the Great Plains: Bird Migrations in the Central Flyway; Zea Books: London, UK, 2012. [Google Scholar]
- Poor, P.J. The value of additional central flyway wetlands: The case of Nebraska’s rainwater basin wetlands. J. Agric. Resour. Econ. 1999, 24, 253–265. [Google Scholar]
- Malone, K.M.; Webb, E.B.; Mengel, D.; Kearns, L.J.; Matteson, S.W.; McKellar, A.E. Secretive marsh bird habitat associations in the Mississippi Flyway: A meta-analysis. Avian Conserv. Ecol. 2021, 16, 12. [Google Scholar] [CrossRef]
- Caithamer, D.F.; Otto, M.; Padding, P.I.; Sauer, J.R.; Haas, G.H. Sea Ducks in the Atlantic Flyway: Population Status and a Review of Special Hunting Seasons; Callaghan Connecticut; United States Fish and Wildlife Service: Washington, DC, USA, 2000. [Google Scholar]
- Sauer, J.R.; Zimmerman, G.S.; Klimstra, J.D.; Link, W.A. Hierarchical model analysis of the Atlantic flyway breeding waterfowl survey. J. Wildl. Manag. 2014, 78, 1050–1059. [Google Scholar] [CrossRef]
- Krementz, D.G.; Asante, K.; Naylor, L.W. Autumn migration of Mississippi Flyway mallards as determined by satellite telemetry. J. Fish Wildl. Manag. 2012, 3, 238–251. [Google Scholar] [CrossRef]
- Johnson, O.W.; Fielding, L.; Fisher, J.P.; Gold, R.S.; Goodwill, R.H.; Bruner, A.E.; Fox, J.W. New insight concerning transoceanic migratory pathways of Pacific golden-Plovers (Pluvialis fulva): The Japan stopover and other linkages as revealed by geolocators. Wader Study Group Bull 2012, 119, 1–8. [Google Scholar]
- McDuffie, L.A.; Christie, K.S.; Taylor, A.R.; Nol, E.; Friis, C.; Harwood, C.M.; Johnson, J.A. Flyway-scale GPS tracking reveals migratory routes and key stopover and non-breeding locations of lesser yellowlegs. Ecol. Evol. 2022, 12, e9495. [Google Scholar] [CrossRef]
- Kardynal, K.J.; Hobson, K.A. The pull of the central flyway? Veeries breeding in western Canada migrate using an ancestral eastern route. J. Field Ornithol. 2017, 88, 262–273. [Google Scholar] [CrossRef]
- McKinnon, E.A.; Love, O.P. Ten years tracking the migrations of small landbirds: Lessons learned in the golden age of bio-logging. Auk 2018, 135, 834–856. [Google Scholar] [CrossRef]
- eBird. eBird: An Online Database of Bird Distribution and Abundance; Cornell Laboratory of Ornithology: Ithaca, NY, USA, 2021; Available online: https://www.ebird.org (accessed on 7 January 2024).
- Callaghan, C.T.; Gawlik, D.E. Efficacy of eBird data as an aid in conservation planning and monitoring. J. Field Ornithol. 2015, 86, 298–304. [Google Scholar] [CrossRef]
- Sullivan, B.L.; Aycrigg, J.L.; Barry, J.H.; Bonney, R.E.; Bruns, N.; Cooper, C.B.; Kelling, S. The eBird enterprise: An integrated approach to development and application of citizen science. Biol. Conserv. 2014, 169, 31–40. [Google Scholar] [CrossRef]
- Johnston, A.; Hochachka, W.M.; Strimas-Mackey, M.E.; Ruiz Gutierrez, V.; Robinson, O.J.; Miller, E.T.; Fink, D. Analytical guidelines to increase the value of community science data: An example using eBird data to estimate species distributions. Divers. Distrib. 2021, 27, 1265–1277. [Google Scholar] [CrossRef]
- Hoffman, P.; Yergeau, F. UTF-16, an Encoding of ISO 10646; ISO: Geneva, Switzerland, 2000. [Google Scholar]
- Yergeau, F. UTF-8, a Transformation format of Unicode and ISO 10646 (No. rfc2044); ISO: Geneva, Switzerland, 1996. [Google Scholar]
- Yergeau, F. UTF-8, a Transformation Format of ISO 10646 (No. rfc3629); ISO: Geneva, Switzerland, 2003. [Google Scholar]
- Harrer, M.; Cuijpers, P.; Furukawa, T.; Ebert, D. Doing Meta-Analysis with R: A Hands-On Guide; Chapman & Hall/CRC: Boca Raton, FL, USA, 2021. [Google Scholar]
- Wickham, H.; Çetinkaya-Rundel, M.; Grolemund, G. R for Data Science; O’Reilly Media, Inc.: Sebastopol, CA, USA, 2023. [Google Scholar]
- McMurdie, P.J.; Holmes, S. Package ‘Phyloseq’. Gan. 2013, Volume 2. Available online: https://s3.jcloud.sjtu.edu.cn/899a892efef34b1b944a19981040f55b-oss01/bioconductor/3.3/bioc/manuals/phyloseq/man/phyloseq.pdf (accessed on 28 July 2025).
- Mc McMurdie, P.J.; Holmes, S. Package ‘Phyloseq’; Technical Report. Stanford University: Stanford, CA, USA, 2019. [Google Scholar]
- Wright, L. Many Models in R: A Tutorial. Centre for Longitudinal Studies; University College: London, UK, 2023. [Google Scholar]
- Wickham, H.; Chang, W.; Wickham, M.H. Package ‘ggplot2’. Create Elegant Data Visualisations Using the Grammar of Graphics. Available online: https://scholar.google.com/scholar?hl=ko&as_sdt=0%2C5&q=Create+elegant+data+visualisations+using+the+grammar+of+graphics&btnG= (accessed on 28 July 2025).
- Wilkinson, L. ggplot2: Elegant graphics for data analysis by Wickham, H. Biometrics 2011, 67, 678–679. [Google Scholar] [CrossRef]
- Kassambara, A. ggplot2: Guide to Create Beautiful Graphics in R. 2013. Available online: https://books.google.co.kr/books?hl=ko&lr=&id=IUbwCQAAQBAJ&oi=fnd&pg=PA3&dq=Guide+to+Create+Beautiful+Graphics+in+R&ots=QICh0SgrBF&sig=blITGUN1Y4CyI2l-WcmGURQHxFI&redir_esc=y#v=onepage&q=Guide%20to%20Create%20Beautiful%20Graphics%20in%20R&f=false (accessed on 28 July 2025).
- Tollefson, M.; Tollefson, M. Graphics with the ggplot2 package: An introduction. In Visualizing Data in R 4: Graphics Using the Base, Graphics, Stats, and Ggplot2 Packages; Springer: Berlin/Heidelberg, Germany, 2021. [Google Scholar]
- Barnett, D.J.; Arts, I.C.; Penders, J. microViz: An R package for microbiome data visualization and statistics. J. Open Source Softw. 2021, 6, 3201. [Google Scholar] [CrossRef]
- Aitchison, J.; Barceló-Vidal, C.; Martín-Fernández, J.A.; Pawlowsky-Glahn, V. Log ratio analysis and compositional distance. Math. Geol. 2000, 32, 271–275. [Google Scholar] [CrossRef]
- Legendre, P.; Oksanen, J.; Ter Braak, C.J. Testing the significance of canonical axes in redundancy analysis. Methods Ecol. Evol. 2011, 2, 269–277. [Google Scholar] [CrossRef]
- McArdle, B.H.; Anderson, M.J. Fitting multivariate models to community data: A comment on distance-based redundancy analysis. Ecology 2001, 82, 290–297. [Google Scholar] [CrossRef]
- Waller, E.K.; Crimmins, T.M.; Walker, J.J.; Posthumus, E.E.; Weltzin, J.F. Differential changes in the onset of spring across US National Wildlife Refuges and North American migratory bird flyways. PLoS ONE 2018, 13, e0202495. [Google Scholar]
- Fosso Wamba, S.F.; Akter, S.; Edwards, A.; Chopin, G.; Gnanzou, D. How ‘big data’ can make big impact: Findings from a systematic review and a longitudinal case study. Int. J. Prod. Econ. 2015, 165, 234–246. [Google Scholar] [CrossRef]
- Sagiroglu, S.; Sinanc, D. Big data: A review. In Proceedings of the International Conference on Collaboration Technologies and Systems (CTS), San Diego, CA, USA, 20–24 May 2013; pp. 42–47. [Google Scholar]
- Katal, A.; Wazid, M.; Goudar, R.H. Big data: Issues, challenges, tools and good practices. In Proceedings of the 2013 Sixth International Conference on Contemporary Computing (IC3), Noida, India, 8–10 August 2013; pp. 404–409. [Google Scholar]
- Fan, J.; Han, F.; Liu, H. Challenges of big data analysis. Natl. Sci. Rev. 2014, 1, 293–314. [Google Scholar] [CrossRef] [PubMed]
- Sullivan, B.L.; Wood, C.L.; Iliff, M.J.; Bonney, R.E.; Fink, D.; Kelling, S. eBird: A citizen-based bird observation network in the biological sciences. Biol. Conserv. 2009, 142, 2282–2292. [Google Scholar] [CrossRef]
- La Sorte, F.A.; Somveille, M. Survey completeness of a global citizen-science database of bird occurrence. Ecography 2020, 43, 34–43. [Google Scholar] [CrossRef]
- Jacobs, C.; Zipf, A. Completeness of citizen science biodiversity data from a volunteered geographic information perspective. Geo-Spat. Inf. Sci. 2017, 20, 3–13. [Google Scholar] [CrossRef]
| Disclaimer/Publisher’s Note: The statements, opinions and data contained in all publications are solely those of the individual author(s) and contributor(s) and not of MDPI and/or the editor(s). MDPI and/or the editor(s) disclaim responsibility for any injury to people or property resulting from any ideas, methods, instructions or products referred to in the content. |
© 2025 by the authors. Licensee MDPI, Basel, Switzerland. This article is an open access article distributed under the terms and conditions of the Creative Commons Attribution (CC BY) license (https://creativecommons.org/licenses/by/4.0/).


