Brief Report

Combining Grass-Legume Mixtures with Soil Amendments Boost Aboveground Productivity on Engineering Spoil Through Selection and Compensation Effects

1
Sichuan Yanjiang Yijin Expressway Co., Ltd., Xichang 615099, China
2
Institute of Soil and Water Conservation, CAS&MWR, Yangling 712100, China
3
University of Chinese Academy of Sciences, Beijing 100049, China
4
College of Soil and Water Conservation Science and Engineering, Northwest A&F University, No. 28 Xinong Road, Yangling 712100, China
5
College of Grassland Agriculture, Northwest A&F University, Yangling 712100, China
*
Author to whom correspondence should be addressed.
Diversity 2025, 17(8), 513; https://doi.org/10.3390/d17080513
Submission received: 7 July 2025 / Revised: 21 July 2025 / Accepted: 23 July 2025 / Published: 25 July 2025
(This article belongs to the Section Plant Diversity)

Abstract

The arid-hot valleys of Sichuan Province contain extensive engineered gravel deposits, where ecological restoration has become the predominant remediation strategy. Accelerating vegetation recovery and continuously improving productivity are important prerequisites for the protection of regional biodiversity. We employed fertilization and sowing cultivation to facilitate ecological restoration. We have conducted continuous ecological experiments for two years using the following experimental treatments, covering indigenous soil, adding organic fertilizer, and applying compound fertilizer and organic fertilizer, with six types of sowing established under each soil treatment: monoculture and pairwise mixed cropping utilizing Elymus dahuricus (EDA), Dactylis glomerata (DGL), and Medicago sativa (MSA). Through the analysis of variance and the calculation of effect factors, our results indicated that compound fertilizer and organic fertilizer adding significantly improved vegetation cover and increased aboveground biomass, and the highest productivity was observed in the mixed sowing treatment of EDA and MSA. The effect coefficient model analysis further showed that the combination of EDA and MSA resulted in the highest selection and compensation effects on aboveground productivity. Two potential mechanisms drive enhanced productivity in mixed grasslands: the strengthening of the selection effect via increased legume nitrogen fixation, and the enhancement of the compensation effect through niche differentiation among species.

Graphical Abstract

1. Introduction

In the western part of Sichuan, located in the transition zone between plateaus and basins, there are numerous road and tunnel engineering projects. The construction of roads in these areas generates substantial amount of tunnel spoil. The dry hot valley region of Sichuan has become a typical area where ecological vulnerability and engineering construction conflicts are pronounced [1]. In this region, average annual evaporation significantly exceeds precipitation, leading to poor soil quality, increased salinity, and low natural vegetation coverage, which complicates ecological restoration efforts [2]. Improving the spoil into a substrate suitable for plant growth while simultaneously achieving ecological restoration and resource utilization goals has become a pressing requirement for sustainable regional development. Existing studies have attempted to combine waste disposal with vegetation recovery, however, research on the ecological utilization of tunnel spoil has largely focused on singular improvement measures or plant selection [3].
The environmental heterogeneity of arid and hot valley regions makes it challenging to balance short-term gains with the stability of long-term productivity in the cultivation of a single species [4]. The combination of species that exhibit faster growth and greater resistance are generally more beneficial for the reconstruction and restoration of vegetation [3]. Multi-species intercropping can promote ecological niche differentiation among species, enhance resource utilization efficiency, and reduce interspecific competition, thereby increasing the productivity and stability of plant communities [5,6]. The total productivity of plants cultivated in a mixed manner will be higher than that of plants cultivated individually [7,8]. In addition to selecting appropriate species combinations, it is necessary to improve the quality of the subsoil. Cover soil can quickly enhance the surface matrix, but the deficiencies in the physical and chemical properties of the deep subsoil are difficult to resolve [9,10,11,12]. Therefore, the implementation of composite measures and the planting of species assemblages that can rapidly restore vegetation are potentially effective ways.
Herbaceous plants have advantages over shrubs such as rapid recovery, lower costs, and higher convenience, and they play a significant role in controlling soil and water erosion [13]. Elymus dahuricus (EDA) and Dactylis glomerata (DGL) are perennial herbs in the Gramineae family, while Medicago sativa (MSA) is a common legume in the western regions [14]. The mixed cultivation of legumes and grasses is an excellent agricultural scheme. C3 plants can rapidly restore their photosynthetic rate after drought relief, making them more adaptable to the local climatic and hydrological conditions [15]. These three locally common plant species are adapted to the hydrological and climatic conditions of the arid and hot river valley environment while also meeting plant productivity demands.
This study combines mixed cultivation and soil fertilization measures: (1) Covering soil (physical improvement, regulating the surface structure of the soil) [11,12], (2) Adding organic fertilizer, (3) Combined use of organic fertilizer and compound fertilizer. Three suitable plants, EDA, DGL and MSA, were sown singly and in combination with each other to systematically analyze the impacts of different plant combinations (the mixing ratio was 1:1) and soil treatments on the aboveground productivity (biomass and vegetation cover). This study aims to identify the optimal planting method under different soil treatments, focusing on maximizing biomass, vegetation cover, and other functional traits to address current challenges in ecological restoration. This research provides a theoretical basis and technical paradigm for the green transformation and ecological resilience enhancement of engineering wastes in the Dry Heat River Stream watershed.

2. Materials and Methods

2.1. Overview of the Research Area

This study was carried out in the Youfang Bay Antipressure Ecological Restoration Experimental Area (28°12′–28°18′ N, 103°35′–103°42′ E) in Leibo County, Liangshan Yi Autonomous Prefecture, Sichuan Province, the experiment lasted two years (2023 and 2024) (Figure 1). The average annual temperature is 20 °C, the annual precipitation is 550–650 mm, the evaporation is 2800–3200 mm, and the rainy season (June-September) concentrates more than 80% of the annual precipitation [16,17]. The local soil is primarily dry acidic, and the pH of the construction waste soil ranges from 7.8 to 8.2, organic matter content < 1.0%, and total salinity of 3–5 g/kg, with obvious characteristics of barrenness and salinization. The gravel and debris from bridge and tunnel construction are deposited in leveled spoil areas, serving as our research site.

2.2. Soil Treatment and Plant Configuration

This study implemented three distinct soil treatments, soil cover (CT): 20 cm thick local tillage soil (1.5% organic matter, 0.12% total nitrogen) was covered on the surface layer of cave slag to simulate rapid surface substrate improvement. Organic fertilizer addition (OF): the organic fertilizer was mixed with cave slag at a 5% mass ratio (0–30 cm depth); Organic fertilizer + compound fertilizer (OF+CF): On the basis of OF treatment, 500 kg/hectare of compound fertilizer (N-P2O5-K2O = 15-15-15) was added as basal fertilizer (Figure 1b). To minimize the influence of confounding variables, five replicate plots were established for each soil treatment. In this study, three suitable plant species were selected: Elymus dahuricus (C3 grass), Dactylis glomerata (C3 grass), and Medicago sativa (legume). The following six configurations were used sowing: monocultures: EDA, DGL, MSA; mixed cultures: EDA + DGL, EDA + MSA, DGL + MSA. The mixed cultures were sown at an equal seed mass ratio of (1:1), with a total seeding rate of 200 kg/hectare.
We established 6 fixed sowing zones (corresponding to 6 plant configurations) within each soil treatment sample area use a random block design. There were 5 replicates per treatment (plant × soil) and a 1.5-m-high fence is arranged around the entire study area for separation, for a total of 120 plots: 4 soil treatments (3 treatment groups and 1 control group) × 6 species combination × 5 replicates. These plots were sown before the rainy season in May 2023, with drip irrigation provided during the sowing period, and thereafter relying entirely on natural rainfall, with no additional irrigation during the rainy season.

2.3. Data Collection and Calculation

In this study, within each plot, a 1m×1m quadrat was randomly designated and placed at least 0.5 m from the margin to avoid edge effect at the end of the grassland growing season in November to assess various plant metrics. The maximum plant height was determined: 10 plants were randomly selected from each quadrat to measure the height from the top of the upright stem to the base (cm). Plant abundance was defined as the total number of surviving individuals within the quadrat. Aboveground productivity was evaluated by harvesting all aboveground biomass within the quadrat, which was then dried to constant weight at 65 °C and weighed (g/m2). Additionally, plant coverage was assessed using a digital photo method, with the percentage of green vegetation cover calculated using ImageJ v1.53 software. Calculation of effect coefficients: Based on the productivity data of mixed cultures and monocultures, the selection effect coefficient (SE) and the compensation effect coefficient (CE) was calculated as follow [18], The logarithmic formula makes it easier to compare changes in biomass because it is compared to 0,
c r = m r m s
where m s represents the biomass of species when sown alone, m r represents the biomass of species when sown as a mixture and c r denotes the competition coefficient.
C E = log c r 1 + c r 2 2
Here, c r 1 and c r 2 represent the c r   of any different species in mixed cultivation. The extent to which mixed sowing surpassed the highest productivity of monoculture sowing is represented by CE. When CE = 0, it indicates that under specific soil treatments, the biomass of species in mixed sowing is equivalent to that in sole sowing, suggesting that there is no difference in productivity between sole and mixed sowing under the same soil treatment conditions. If CE > 0, a compensatory effect occurs in the mixed sowing combination, resulting in higher productivity than sole sowing. Conversely, if CE < 0, the mixed sowing combination not only fails to benefit the vegetation but also introduces an inhibitory effect.
S E = log c r 1 c r 2 2
Here, c r 1 and c r 2 represent the c r   of any different species in mixed cultivation. SE assesses whether the biomass of the inferior species in mixed cultivation is less than half that of the superior species. If SE < 0, it means that there is no significant dominant species between the two species, if SE = 0, it means that the dominant species has a small benefit in additional productivity compared with the inferior species compared with the single seeding, and if SE > 0, it indicates that the dominant species has obtained much greater benefits under the mixed sowing conditions than under the monoculture conditions.

2.4. Data Analysis

Statistical analyses were performed using R 4.3.1. The effects of soil treatment, plant treatment, and their interactions on productivity, coverage, and plant height were compared through analysis of variance (ANOVA) and Tukey’s test (significance level α = 0.05). Soil treatment was treated as a fixed effect, while the sampling area was considered a random effect to analyze the sources of variation in plant height and abundance. Effect coefficients of SE and CE were visualized with the ggplot2 package to identify the dominant species combinations.

3. Results and Analysis

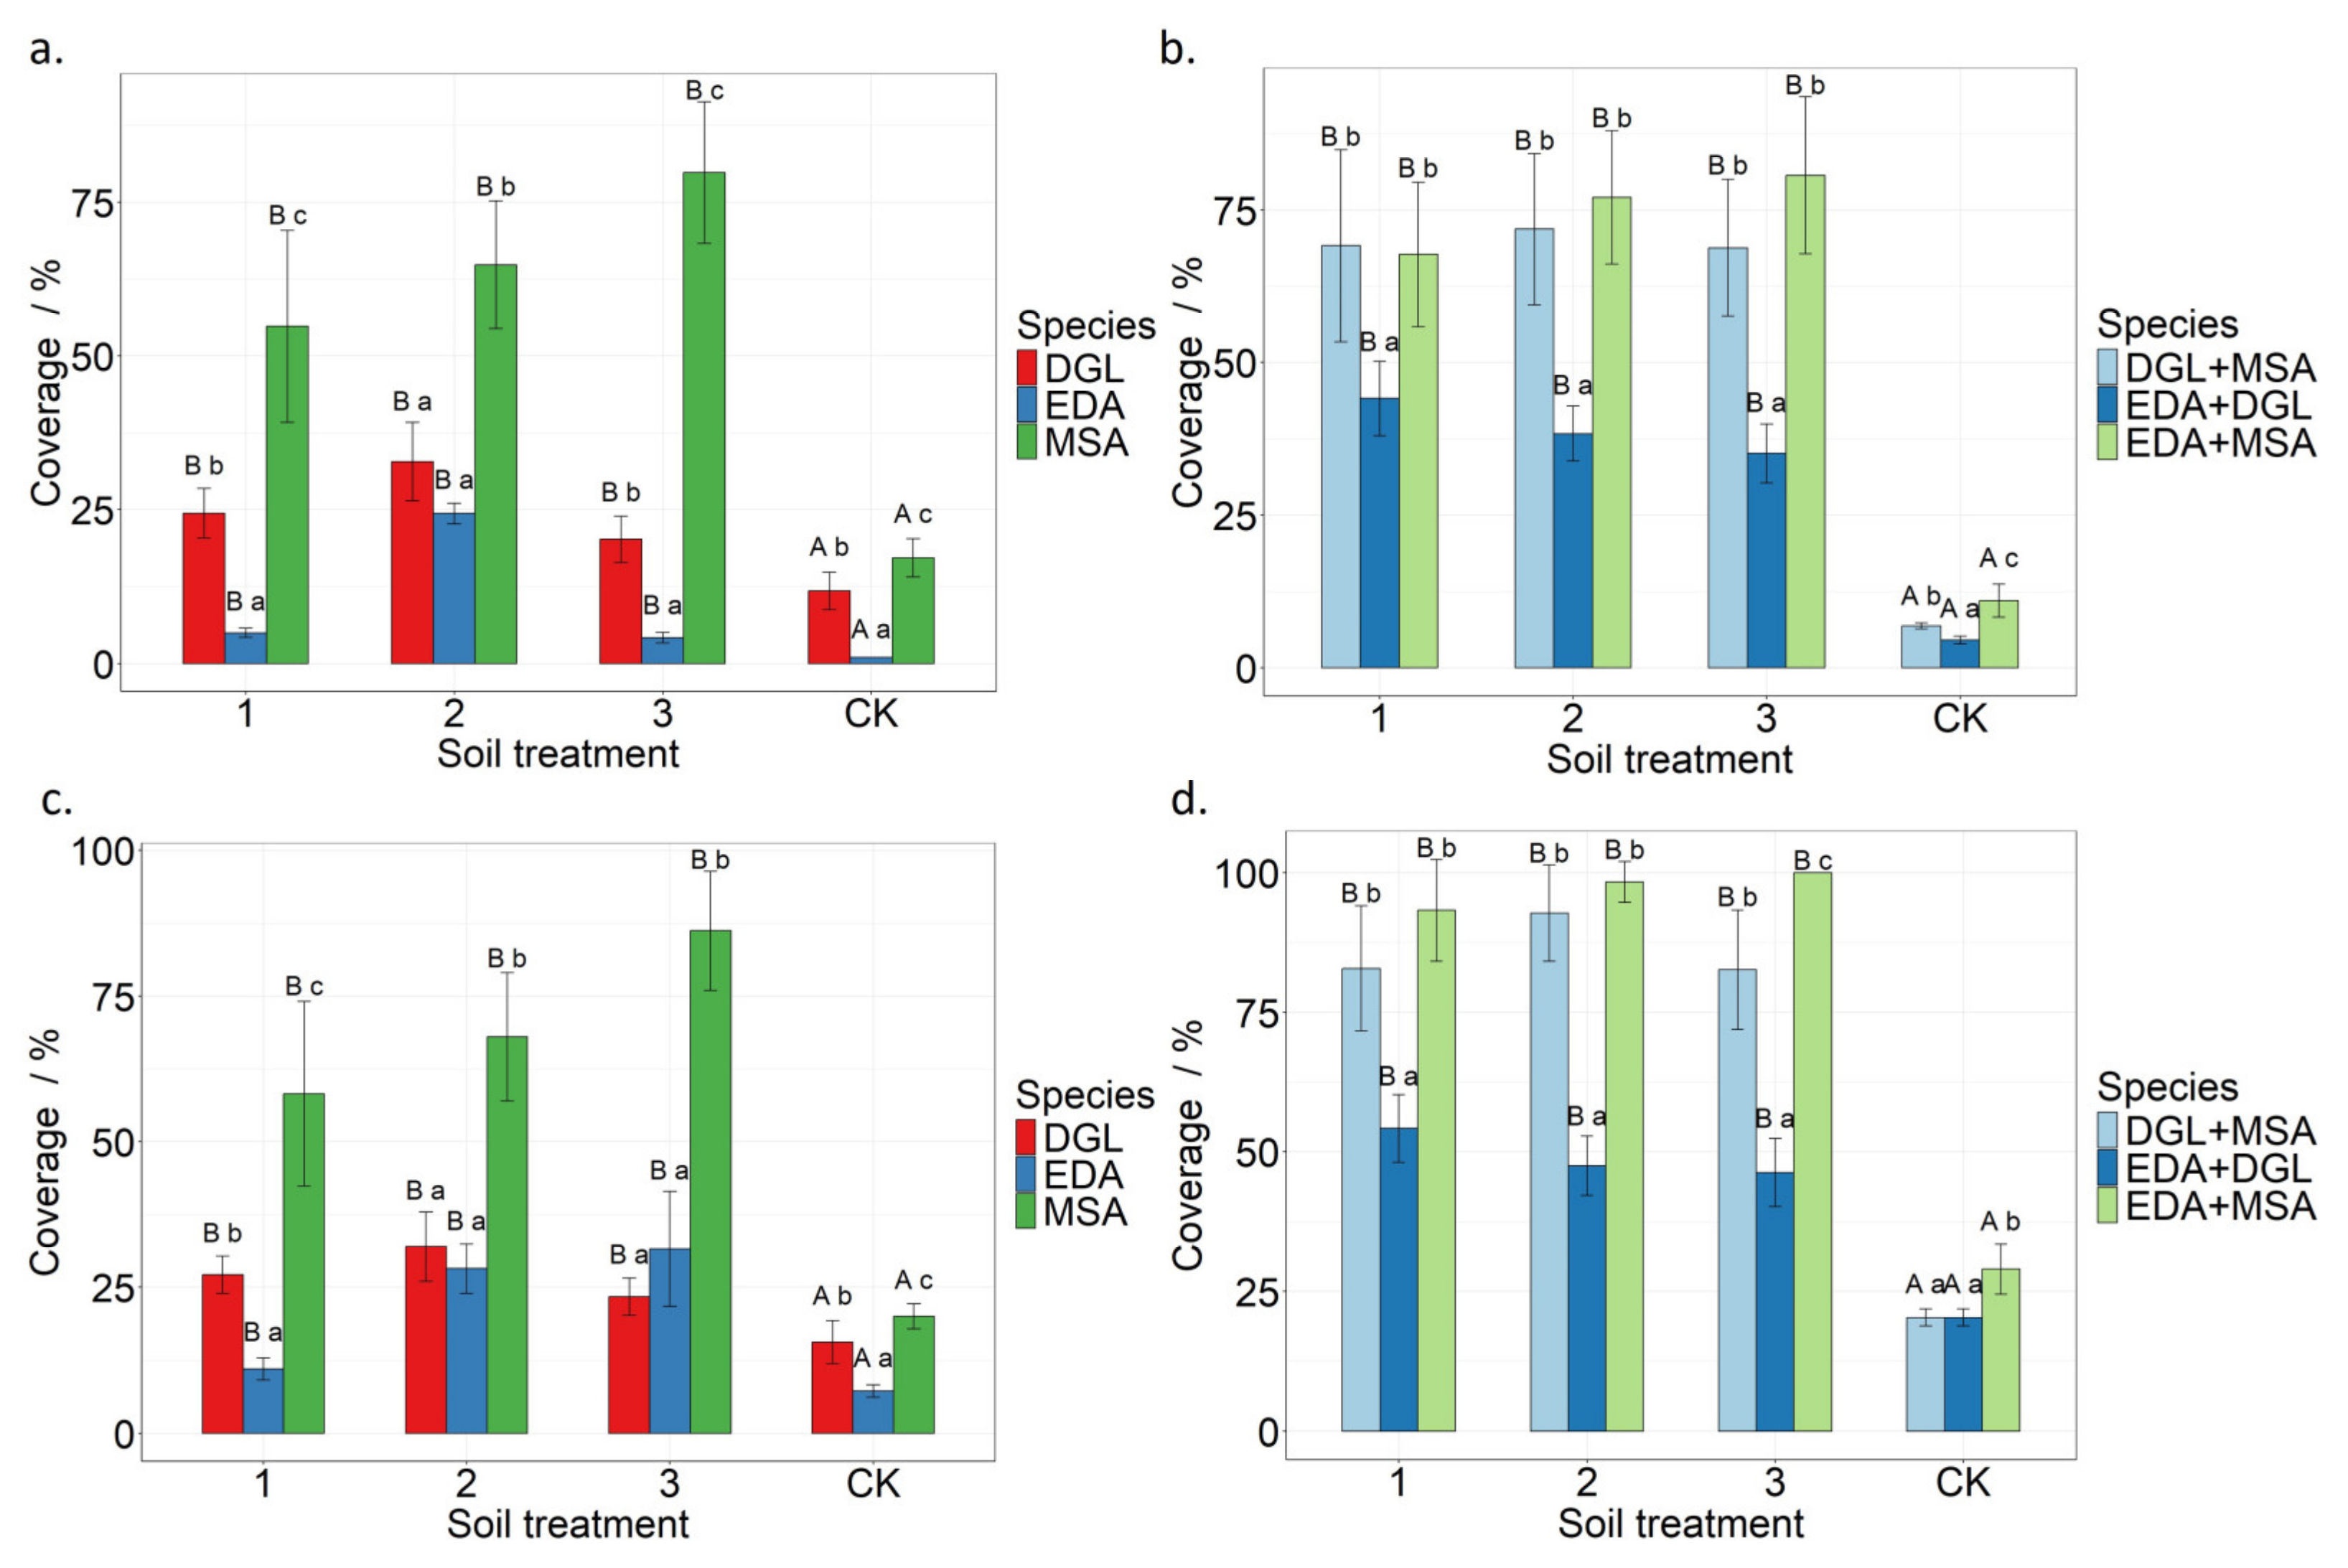
3.1. The Response of Vegetation Coverage to Soil Treatment and Species Configuration

Under the scenario of sowing a single species, both soil treatment groups over the two-year period showed a significant increase in coverage (Figure 2a,c). The MSA performance in handling 3 shows the highest average coverage growth, with 79.8% in the first year and 86.2% in the second year. Meanwhile, the increase in coverage for the control group CK is generally low, with the average over the two years not exceeding 20% (p < 0.05).
Under the mixed planting mode, vegetation coverage significantly increased across all three soil treatments (p < 0.05), but there was no significant difference among the different treatments, and the total average coverage of treatment 3 and treatment 2 was similar. In soil treatment 3, the combination of EDA and MSA achieved a coverage value of 80.66% in first year, representing a 70% increase compared to the control group, and marking the highest average coverage. The coverage of the mixed seeding combination in the control group was significantly lower than that in the monoculture (p < 0.05).
The two-year average coverage for all sampling plots is 43.57%, with the average coverage of the mixed cultivation plots at 55.93% and that of the single cultivation plots at 31.20%. The EDA + MSA of treatment 3 has the highest average coverage at 90.3%, and the coverage in the second year has increased on average by a factor of two compared to the first year.

3.2. The Response of the Maximum Height of the Plant to Soil Treatment

Under monoculture conditions, treatment 3 increased the maximum height of the plants, with the average height of MSA reaching 12.75 cm (an increase of 8.81 cm compared to the control group), which is higher than that of EDA and DGL (Figure 3a). None of the four treatments showed significant differences in soil treatments.
Under the mixed sowing mode, all three treatments significantly increased the maximum height of the plants (p < 0.01), but the differences between treatments were not significant (Figure 3b). The average height of the combination of EDA and MSA was the highest, followed by the combination of DGL and MSA, while the combination of EDA and DGL is the lowest.
The two-year average height of all sample plots is 10.3 cm, with an average height of 12.1 cm for mixed cultivation plots and 8.5 cm for single cultivation plots. The average height of treatment 2 in the EDA + MSA is the highest at 22.3 cm, the height in the second year increased by an average of 1.4 times compared to the first year.

3.3. The Impact of Soil Treatment on Aboveground Biomass

Results show that in monoculture, treatment 3 significantly increased the biomass of MSA (mean 76.14 g/m2, approximately 280% growth compared to the control group), while the biomass of DGL and EDA in monoculture did not show significant changes among different treatments (Figure 4a). Under the mixed sowing mode, the biomass has increased in treatment 3 was particularly pronounced (p < 0.01), with the aboveground biomass of the EDA + MSA combination reaching 140.22 g/m2, and the DGL + MSA combination at 58.07 g/m2 (Figure 4b). Treatment 2 produced the second-highest increase in biomass (Figure 4b).
The two-year average biomass across all plots is 60.6 g, while the average biomass for mixed cultivation plots is 90.6 g, and for single cultivation plots, it is 30.5 g. In the EDA + MSA, the average biomass for treatment 3 is the highest at 253 g. The biomass in the second year has increased by an average of 100% compared to the first year.

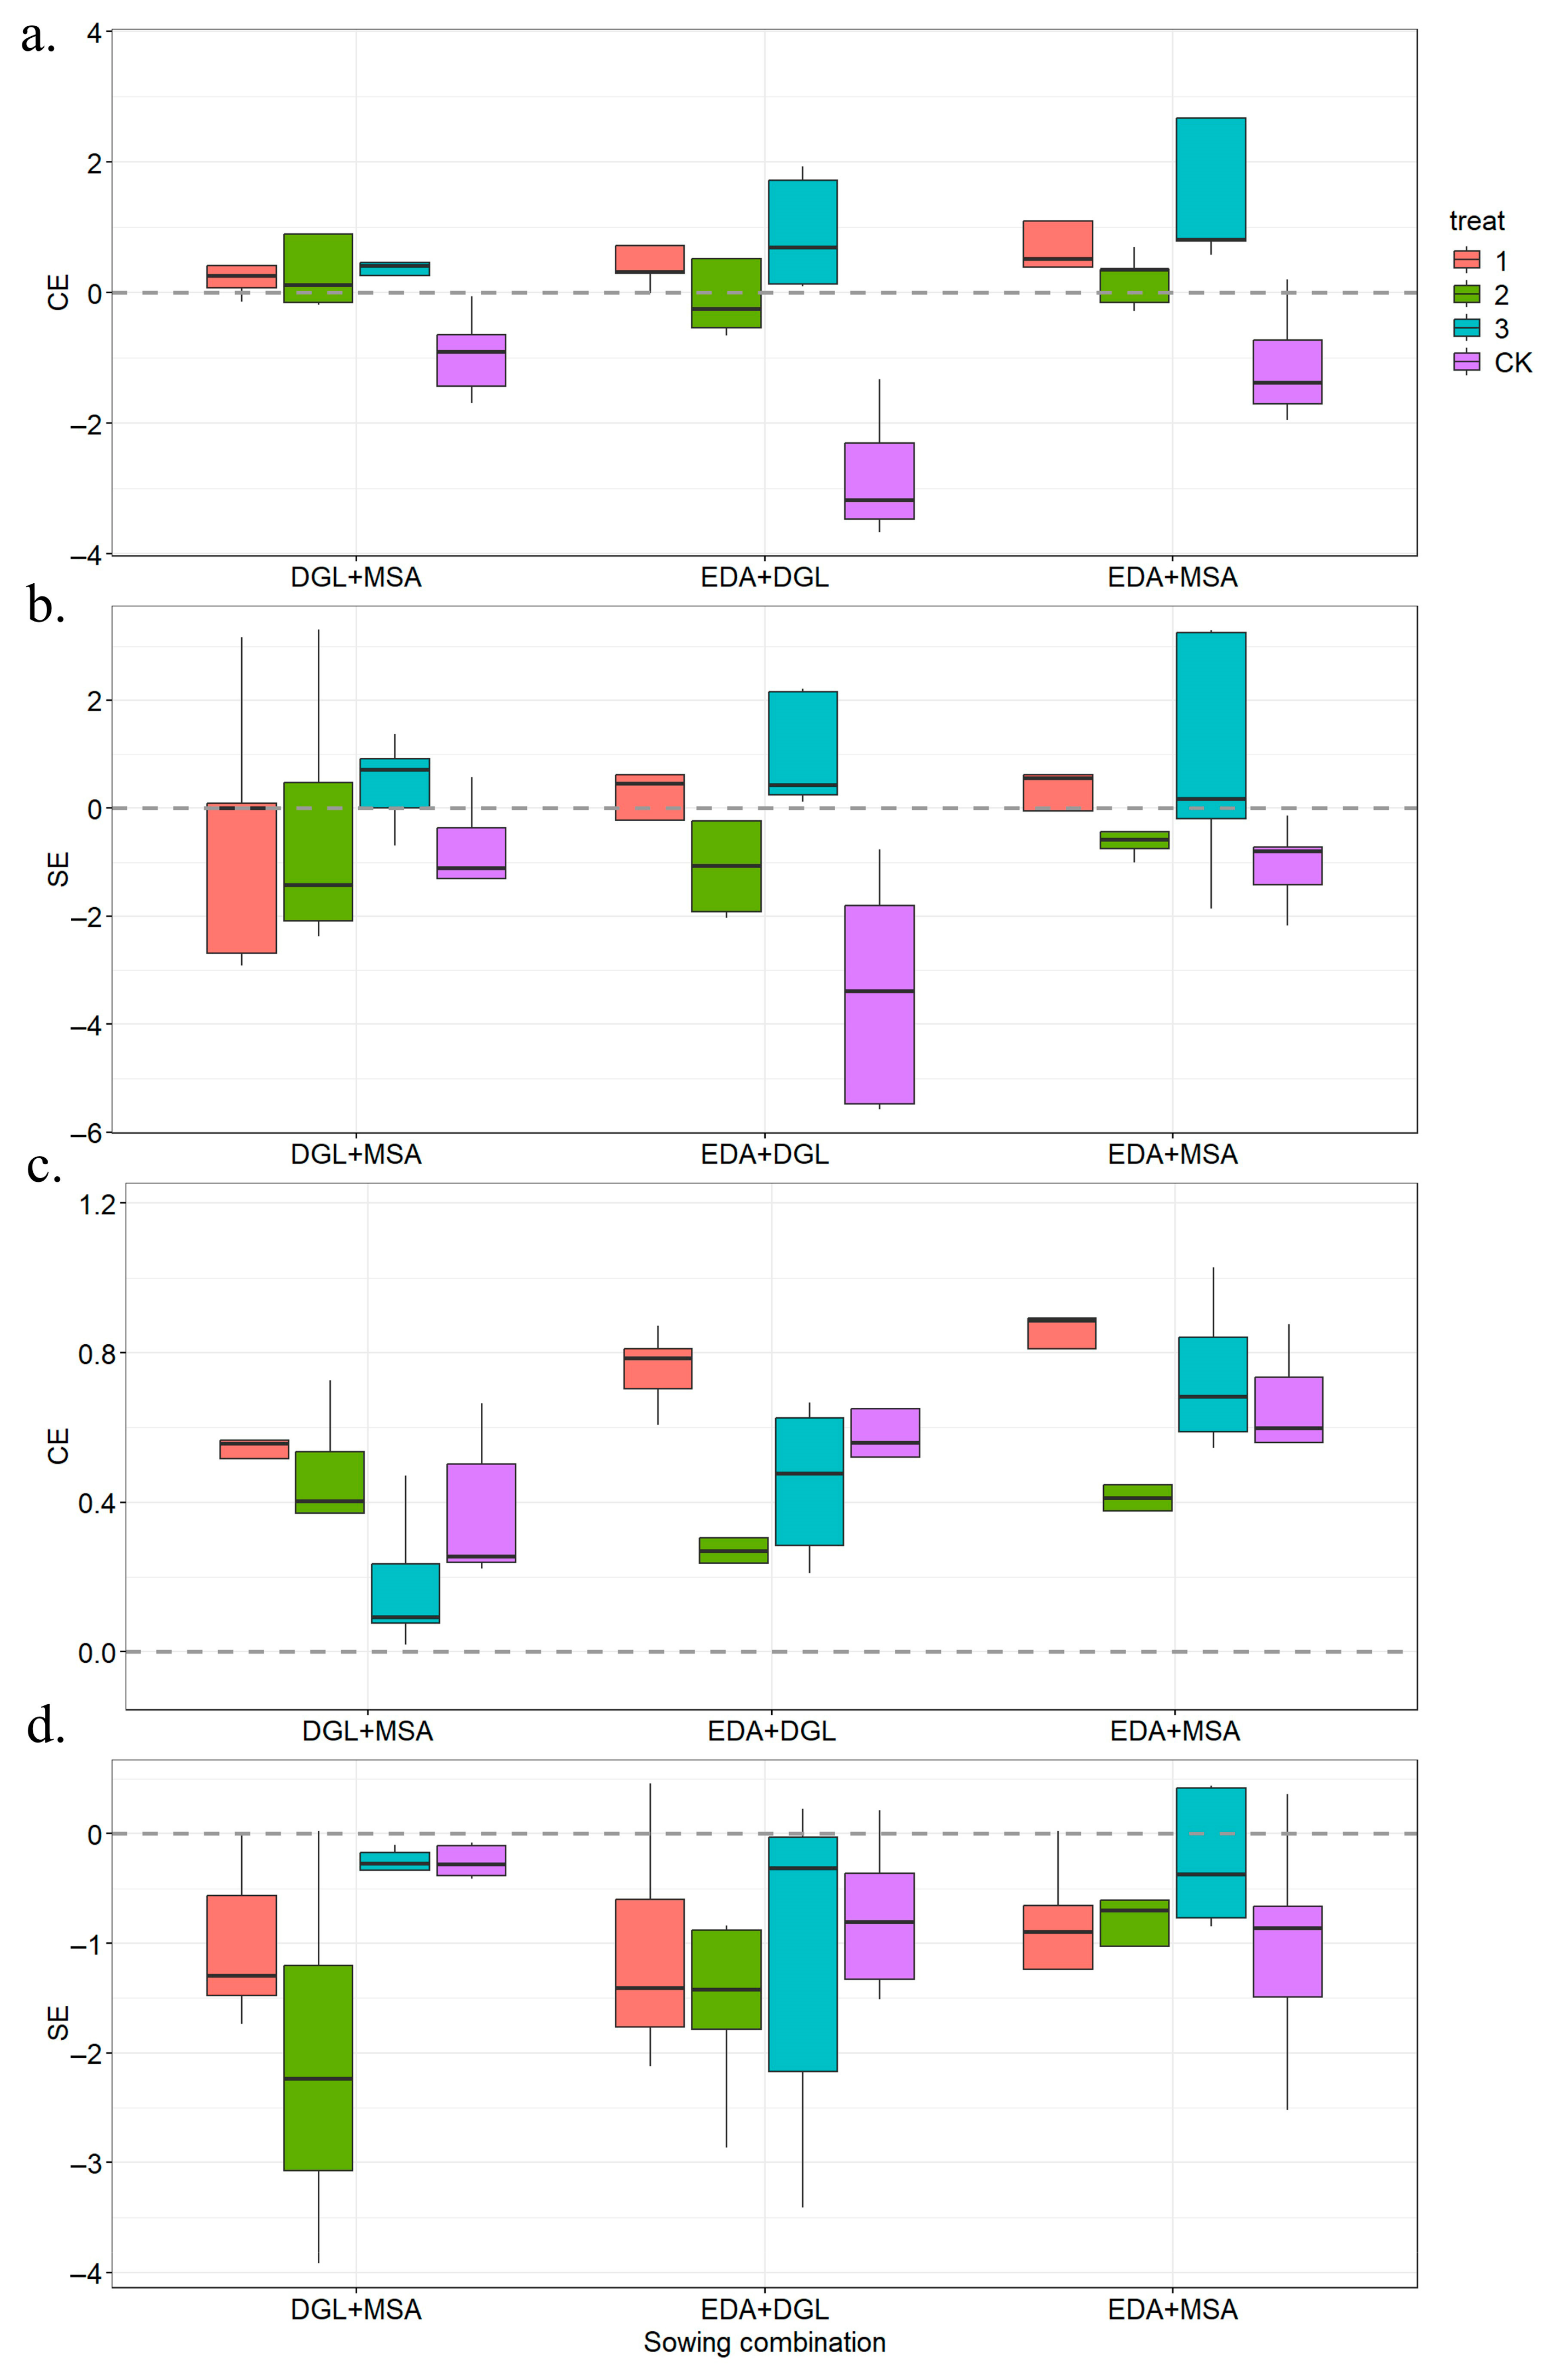
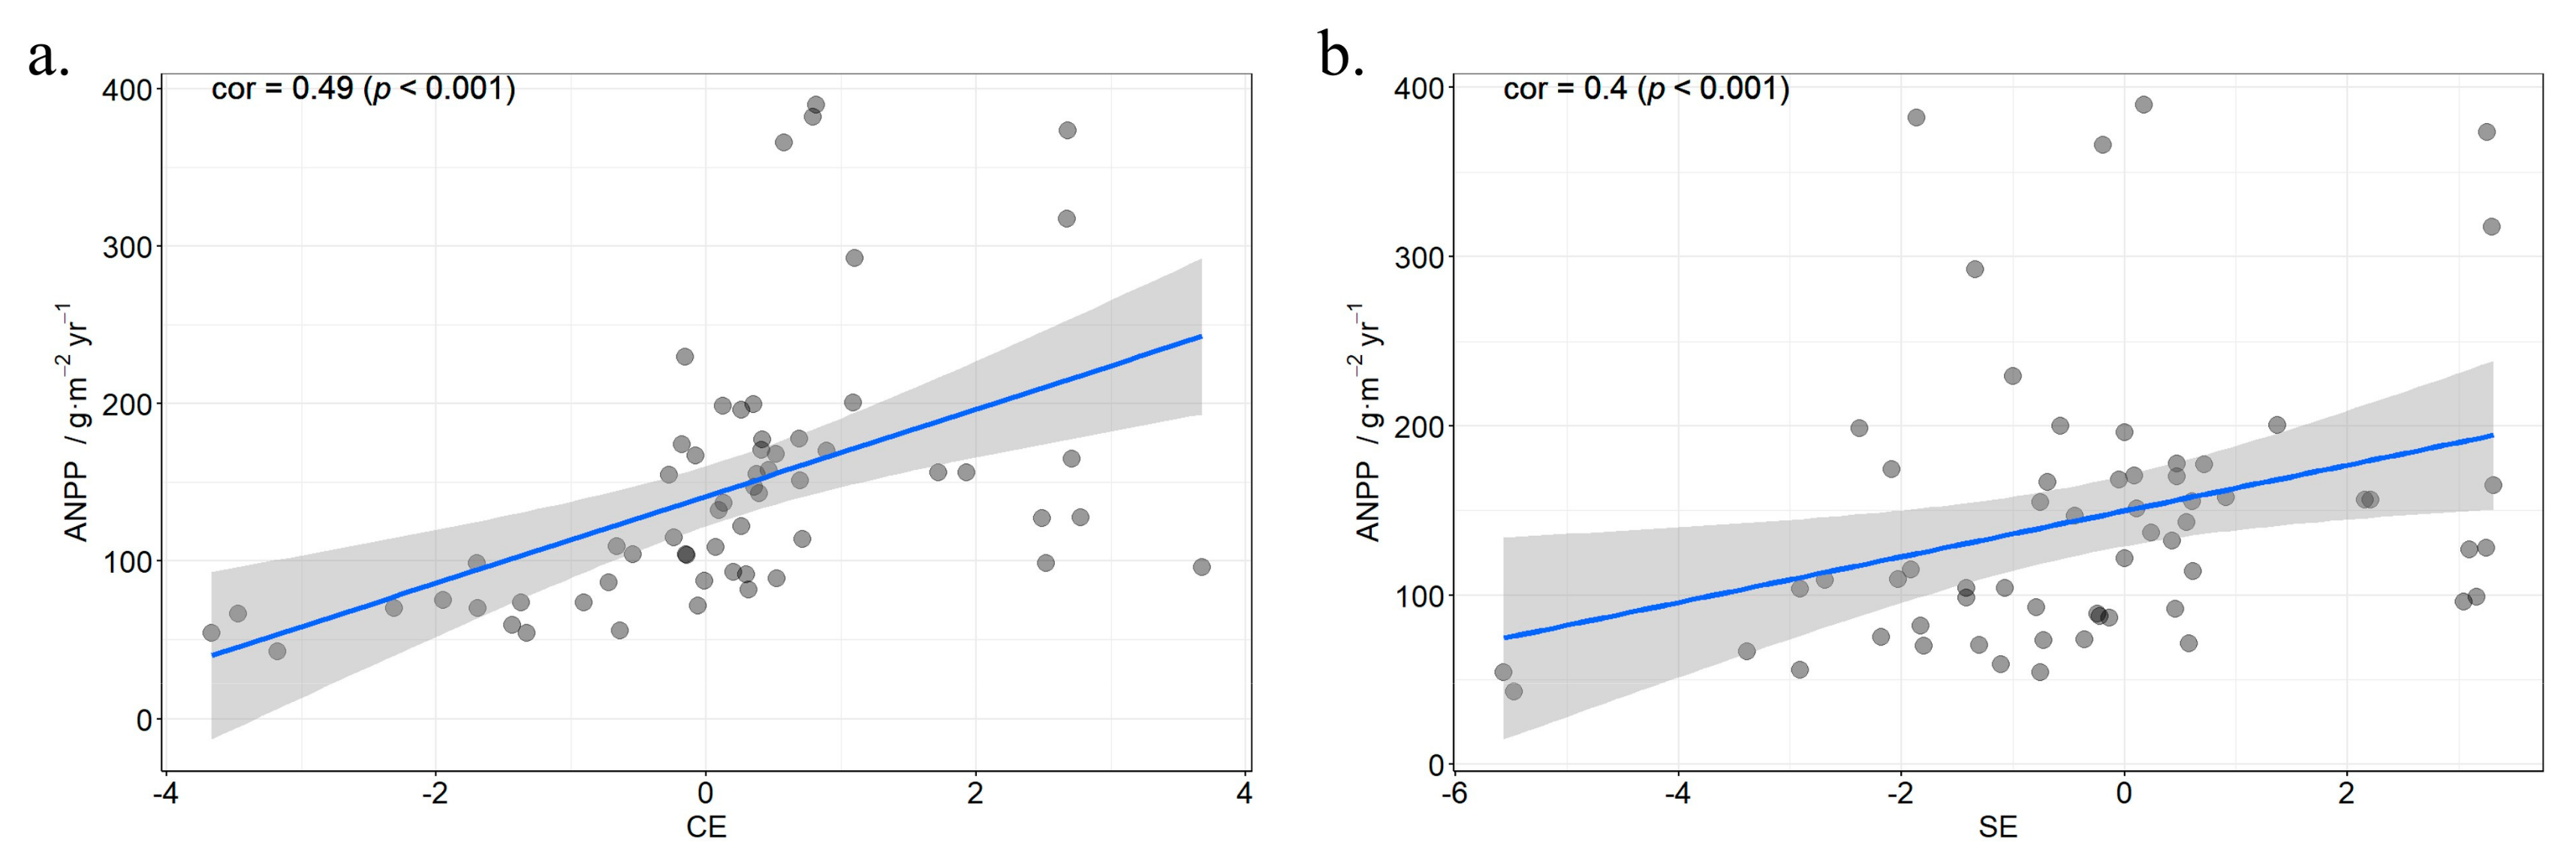
3.4. The Compensatory Effect of Mixed Sowing Combinations and the Selection Effect

The yield advantage in the system can be explained by the selection effect (dominance of high-yield crops) and the compensation effect (niche differentiation and facilitation) [19]. CE is a measure of whether mixed cultivation produces a higher biomass than monoculture, and SE measures how much higher the biomass of the dominant species is compared to the inferior species in mixed cultivation. The compensation effect coefficient (CE) is displayed (Figure 5a), where all control groups have CE values below 0, indicating that the total biomass of the mixed sowing is lower than that of the optimal monoculture species. Treatment 1 and Treatment 2 have CE values slightly above 0, suggesting that covering soil weakly enhances total biomass through niche differentiation. Treatment 3, particularly the combination of EDA and MSA, demonstrates the highest CE value, with its maximum approaching 2, indicating that rapid-acting nutrients and organic matter synergistically strengthen the mutual benefits among species.
The selection effect coefficient (SE) shows that the SE values of the control groups are all below 0, indicating no significant dominant species. The SE value of treatment 3 is significantly the highest, with the combination of EDA and MSA reaching an SE value above 1, and the biomass of MSA increasing by more than 50% compared to monoculture. The SE values for treatment 1 and treatment 2 are significantly lower than that of treatment 3 (p < 0.05). The SE value of the combination of EDA and DGL shows the greatest variation, reflecting the suppression of dominant species formation when resources of the same family of grasses overlap (Figure 5b).
The fitting of the effect coefficients and next year’s productivity revealed that the Pearson correlation coefficient for CE reached 0.49 (p < 0.001), while the Pearson correlation coefficient for SE reached 0.4 (p < 0.01) (Figure 6a,b).

4. Discussion

4.1. The Core Driving Role of Legumes

This study confirmed that MSA showed a high sensitivity to soil improvement in different seeding measures, and its biomass, coverage and plant height reached the maximum values under OF+CF treatment (253.2 g/m2, 90.3% and 20 cm) in two years. These results indicates that selection and complementarity effects influence the positive diversity effect, while species composition and richness explain most of the total variation in biomass production across experimental areas. This study strongly supports the conclusions of highly diverse plant assemblages are better able to spur plant–soil feedbacks and that increasing plant diversity is an important strategy to improve the efficiency of land restoration after destruction [20]. This may be related to the mechanism by which legumes alleviate nitrogen restriction through nitrogen fixation [21]. The addition of compound fertilizers significantly increased the productivity of MSA by providing readily available nutrients. Existing studies have shown that leguminous species in specific soil types positively effect on organic matter levels and induce minor changes in active bacterial populations, stimulating the maximum production potential of leguminous plants [22,23,24]. In the control group, the height of the mixed-seeded plants was even slightly lower than that of the only seed, which is consistent with the hypothesis that species competition dominates under the barren substrate. The mixed planting of the two functional groups exhibited a phenomenon of overproduction, while no overproduction was observed at low fertility levels [25]. Under drought stress, the nitrogen-fixing ability of MSA effectively alleviated the nitrogen limitation experienced by the plants [26], thereby facilitating a shift in the plant’s resource allocation towards the above-ground parts.

4.2. The Optimization Configuration of Mixed Sowing Combinations

The results strongly support that species co-propagation has significant advantages in terms of productivity [5]. Past studies showed that simple soil covering only reduces surface salinity through physical isolation, but has limited improvement on the structural compaction of the deep substrate; whereas the combined use of organic fertilizer and compound fertilizer greatly enhances the output of aboveground biomass [19]. In the extremely high evaporation dry hot valley area, the quick-acting nature of nutrients is crucial for the early establishment of plants. The change of plant composition in the dry and hot valley vegetation area is mainly driven by species replacement [27], and the selection and matching of species is very important.
The combination of EDA and MSA achieves the highest productivity under OF+CF treatment (Figure 4). The core mechanism lies in its complementary functions: The deep roots of MSA and EDA have reduced soil erosion; additionally, they have reduced competition through niche differentiation [28,29]. In contrast, EDA and DGL have intensified resource competition (SE below 0) due to overlapping nitrogen demand, which confirms the view that the complementarity of functional groups determines the advantage of mixing [30,31]. The mixed sowing has increased the possibility of enhancing community stability and productivity through mechanisms such as root complementarity and improved nutrient utilization efficiency [31]. In addition, the “inhibition effect” of the mix-and-mix combination in the control group (lower coverage and biomass than monoculture) suggests that the unmodified substrate cannot meet the minimum resource requirement threshold for multi-species coexistence.
In 2024, both the selection effect and compensation effect within the plot community have weakened to varying degrees, yet the compensation effect remains greater than zero. Existing studies have demonstrated that the potential diversity effects of both mutualistic partners, the multiple scales of diversity for each of these partners, and the additional ecosystem functions that these axes of diversity can influence all point to strong and potentially more complex relationships between the legume–rhizobia mutualism and ecosystem function than the literature currently reflects [32]. The fitting results indicated that the compensation effect and selection effect leaded to the sustained increase on aboveground productivity [33]. Further research is needed to determine the optimal ratio of different species for mixed cultivation and to identify more suitable species to find the optimal ratio and species combination. In addition, the soil and microbial mechanisms of soil biomass regulation in the dry-hot valley region need to be further studied.

5. Conclusions

Leguminous species, particularly MSA, play a dominant role in enhancing productivity and rehabilitating degraded substrates in arid-hot valley ecosystems. Our study demonstrates that productivity is primarily regulated by nutrient inputs, with the combined application of topsoil amendment and organic-inorganic fertilization overcoming the limitations of single treatments. This synergistic strategy significantly boosts aboveground productivity. Furthermore, mixed cultivation of EDA and MSA harnessed compensatory and selection effects, significantly enhancing community productivity. Crucially, this approach enables rapid, low-cost vegetation reconstruction, offering a scalable solution for ecological restoration in fragile environments. These findings provide a scientifically grounded, practical framework for managing engineering residues and restoring degraded ecosystems in arid-hot valleys. By integrating niche differentiation and nitrogen-fixing legumes into restoration protocols, our work advances both theoretical understanding and field-applicable techniques for sustainable land rehabilitation in ecologically vulnerable regions.

Author Contributions

Conceptualization, W.L.; methodology, Z.Z. and F.Y.; software, H.T., Y.W. and Y.Z.; validation, Z.Z., Y.Z. and H.L.; formal analysis, Z.Z.; investigation, Z.Z., F.Y., Y.W., Y.Z. and H.L.; resources, Z.Z.; data curation, F.Y. and Z.Z.; writing—original draft preparation, F.Y.; writing—review and editing, Z.Z.; visualization, Z.Z.; supervision, W.L.; project administration, W.L.; funding acquisition, W.L. All authors have read and agreed to the published version of the manuscript.

Funding

This research and the APC were funded by Sichuan Transportation Technology Project (2018-ZL-15), National Key Research and Development Program of China (2022YFF1302805), and National Natural Science Foundation of China (42277464).

Institutional Review Board Statement

Not applicable.

Data Availability Statement

Data is unavailable due to privacy.

Acknowledgments

The investigators thanks Chongfeng Bu, Fengpeng Han, Han Luo, and Lihui Ma for his assistance in the preparation and review of the manuscript.

Conflicts of Interest

The authors declare that they have no known competing financial interests or personal relationships that could have influenced the work reported in this paper.

References

  1. Du, S.K.; Tang, G.Y.; Liu, Y.G.; Lei, C.Y.; Xu, Y.J.; Ruan, C.M.; Sun, Y.Y.; Zhang, C.H.; Wang, Y. Plant Diversity in Various Sections of Jinsha River Dry-Hot Valley under Different Site Environments. J. Zhejiang AF Univ. 2000, 39, 742–749. [Google Scholar] [CrossRef]
  2. Wang, D.C.; Zhang, X.; Huang, Y.; Wang, X.; Zhang, W.; Cao, Z.J.; Xin, Y.; Qu, M. Comparative Study on Temperature Response of Hydropower Development in the Dry-Hot Valley. GeoHealth 2021, 5, e2021GH000438. [Google Scholar] [CrossRef] [PubMed]
  3. Gastauer, M.; Silva, J.R.; Caldeira Junior, C.F.; Ramos, S.J.; Souza Filho, P.W.M.; Furtini Neto, A.E.; Siqueira, J.O. Mine Land Rehabilitation: Modern Ecological Approaches for More Sustainable Mining. J. Clean. Prod. 2018, 172, 1409–1422. [Google Scholar] [CrossRef]
  4. Poulos, H.M.; Camp, A.E. Topographic Influences on Vegetation Mosaics and Tree Diversity in the Chihuahuan Desert Borderlands. Ecology 2010, 91, 1140–1151. [Google Scholar] [CrossRef]
  5. Feng, Y.H.; Schmid, B.; Loreau, M.; Forrester, D.I.; Fei, S.L.; Zhu, J.X.; Tang, Z.Y. Multispecies Forest Plantations Outyield Monocultures across a Broad Range of Conditions. Science 2022, 376, 865–868. [Google Scholar] [CrossRef]
  6. Zhang, W.P.; Gao, S.N.; Li, Z.X.; Xu, H.S.; Yang, H.; Yang, X.; Fan, H.X.; Su, Y.; Fornara, D.; Li, L. Shifts from Complementarity to Selection Effects Maintain High Productivity in Maize/Legume Intercropping Systems. J. Appl. Ecol. 2021, 58, 2603–2613. [Google Scholar] [CrossRef]
  7. Ranaldo, M.; Carlesi, S.; Costanzo, A.; Barberi, P. Functional Diversity of Cover Crop Mixtures Enhances Biomass Yield and Weed Suppression in a Mediterranean Agroecosystem. Edited by Matt Liebman. Weed Res. 2020, 60, 96–108. [Google Scholar] [CrossRef]
  8. Xie, K.; He, F.; Meng, X.; Yan, A.; Wan, J. Dynamics of Productivity and Nitrogen Contribution in Mixed Legume/Grass Grasslands in Rain-fed Semi-arid Areas in Northwest China. Agronomy 2025, 15, 632. [Google Scholar] [CrossRef]
  9. Bristow, K.L.; Horton, R. Modeling the Impact of Partial Surface Mulch on Soil Heat and Water Flow. Theor. Appl. Climatol. 1996, 54, 85–89. [Google Scholar] [CrossRef]
  10. Luna, L.; Vignozzi, N.; Miralles, I.; Solé-Benet, A. Organic Amendments and Mulches Modify Soil Porosity and Infiltration in Semiarid Mine Soils. Land Degrad. Dev. 2018, 29, 1019–1030. [Google Scholar] [CrossRef]
  11. Wang, P.; Deng, Y.J.; Li, X.Y.; Wei, Z.W.; Hu, X.; Tian, F.; Wu, X.C. Dynamical Effects of Plastic Mulch on Evapotranspiration Partitioning in a Mulched Agriculture Ecosystem: Measurement with Numerical Modeling. Agric. For. Meteorol. 2019, 268, 98–108. [Google Scholar] [CrossRef]
  12. Liu, J.L.; Zhu, Y.; Li, J.Y.; Kong, X.L.; Zhang, Q.; Wang, X.S.; Peng, D.Q.; Zhang, X.Y. Short-Term Artificial Revegetation with Herbaceous Species Can Prevent Soil Degradation in a Black Soil Erosion Gully of Northeast China. Land 2024, 13, 1486. [Google Scholar] [CrossRef]
  13. Xu, C.; Zhang, P.; Chen, L.; Wang, W.Z.; Yang, X.K.; Liu, Z.H.; Mi, Y.H. Effects of Dissolved Organic Carbon Leaching and Soil Carbon Fractions Under Intercropping Dactylis glomerata L.—Medicago sativa L. in Response to Extreme Rainfall. Agronomy 2025, 15, 1485. [Google Scholar] [CrossRef]
  14. Wang, Y.J.; Xie, Z.K.; Malhi, S.; Vera, C.L.; Zhang, Y.B.; Guo, Z.H. Effects of Gravel—Sand Mulch, Plastic Mulch and Ridge and Furrow Rainfall Harvesting System Combinations on Water Use Efficiency, Soil Temperature and Watermelon Yield in a Semi-Arid Loess Plateau of Northwestern China. Agric. Water Manag. 2011, 101, 88–92. [Google Scholar] [CrossRef]
  15. Ward, Y.K.; Tissue, D.T.; Thomas, R.B.; Strain, B.R. Comparative Responses of Model C3 and C4 Plants to Drought in Low and Elevated CO2. Glob. Change Biol. 1999, 5, 857–867. [Google Scholar] [CrossRef]
  16. Chen, K.Q.; Pan, Y.F.; Li, Y.Q.; Cheng, J.Y.; Lin, H.L.; Zhuo, W.H.; He, Y.; Fang, Y.C.; Jiang, Y. Slope Position- Mediated Soil Environmental Filtering Drives Plant Community Assembly Processes in Hilly Shrublands of Guilin, China. Front. Plant Sci. 2023, 13, 1074191. [Google Scholar] [CrossRef] [PubMed]
  17. Xiong, D.H.; Zhou, H.Y.; Yang, Z.; Zhang, X.B. Slope Lithologic Property, Soil Moisture Condition and Revegetation in Dry-Hot Valley of Jinsha River. Chin. Geogr. Sci. 2005, 15, 186–192. [Google Scholar] [CrossRef]
  18. Xi, N.X.; Jonathan, R.D.; John, D.; Paul, K.; Leslie, E.F.; Martin, Z.; Marina, S. Plant–soil microbial interactions as modulators of species coexistence and productivity. Trends Ecol. Evol. 2025, 40, 673–686. [Google Scholar] [CrossRef]
  19. Dou, Z.Y.; Zheng, W.H.; Tian, Y.; Li, S.; Ma, Y.X.; Zheng, W. Comprehensive Comparison of Production Performance of Annual Mixed Legume-Grass Pastures. Pratacult. Sci. 2023, 40, 2639–2650. [Google Scholar] [CrossRef]
  20. Jia, P.; Liang, J.L.; Yang, S.X.; Zhang, S.C.; Liu, J.; Liang, Z.W.; Li, F.M. Plant Diversity Enhances the Reclamation of Degraded Lands by Stimulating Plant–Soil Feedbacks. J. Appl. Ecol. 2020, 57, 1258–1270. [Google Scholar] [CrossRef]
  21. Barbieri, P.; Starck, T.; Voisin, A.S.; Nesme, T. Biological Nitrogen Fixation of Legumes Crops under Organic Farming as Driven by Cropping Management: A Review. Agric. Syst. 2023, 205, 103579. [Google Scholar] [CrossRef]
  22. Fageria, N.K.; Baligar, V.C.; Bailey, B.A. Role of Cover Crops in Improving Soil and Row Crop Productivity. Commun. Soil. Sci. Plant Anal. 2005, 36, 2733–2757. [Google Scholar] [CrossRef]
  23. Girvan, M.S.; Bullimore, J.; Pretty, J.N.; Mark Osborn, A.; Ball, A.S. Soil Type Is the Primary Determinant of the Composition of the Total and Active Bacterial Communities in Arable Soils. Appl. Environ. Microbiol. 2003, 69, 1800–1809. [Google Scholar] [CrossRef] [PubMed]
  24. Vukicevich, E.; Lowery, T.; Bowen, P.; Úrbez-Torres, J.R.; Hart, M. Cover Crops to Increase Soil Microbial Diversity and Mitigate Decline in Perennial Agriculture. A Review. Agron. Sustain. Dev. 2016, 36, 48. [Google Scholar] [CrossRef]
  25. Gross, N.; Suding, K.N.; Lavorel, S.; Roumet, C. Complementarity as a Mechanism of Coexistence between Functional Groups of Grasses. J. Ecol. 2007, 95, 1296–1305. [Google Scholar] [CrossRef]
  26. Zhao, Z.Q.; He, L.P.; Li, G.X.; Ma, S.Y.; Cui, M.; Liu, Y.G.; Yong Chai, Y. Partitioning Beta Diversity of Dry and Hot Valley Vegetation in the Nujiang River in Southwest China. Front. Ecol. Evol. 2023, 11, 1199874. [Google Scholar] [CrossRef]
  27. Gil-Quintana, E.; Larrainzar, E.; Arrese-Igor, C.; González, E.M. Is N-feedback involved in the inhibition of nitrogen fixation in drought-stressed Medicago truncatula? J. Exp. Bot. 2013, 64, 281–292. [Google Scholar] [CrossRef]
  28. Haase, P.; Pugnaire, F.I.; Clark, S.C.; Incoll, L.D. Spatial Patterns in a Two-tiered Semi-arid Shrubland in Southeastern Spain. J. Veg. Sci. 1996, 7, 527–534. [Google Scholar] [CrossRef]
  29. Xiang, L.S.; Miao, L.M.; Yang, F. Drought and Nitrogen Application Modulate the Morphological and Physiological Responses of Dalbergia Odorifera to Different Niche Neighbors. Front. Plant Sci. 2021, 12, 664122. [Google Scholar] [CrossRef]
  30. Homulle, Z.; George, T.S.; Karley, A.J. Root Traits with Team Benefits: Understanding Belowground Interactions in Intercropping Systems. Plant Soil 2022, 471, 1–26. [Google Scholar] [CrossRef]
  31. Gunes, A.; Bagci, E.G.; Inal, A. Interspecific Facilitative Root Interactions and Rhizosphere Effects on Phosphorus and Iron Nutrition Between Mixed Grown Chickpea and Barley. J. Plant Nutr. 2007, 30, 1455–1469. [Google Scholar] [CrossRef]
  32. Taylor, B.N.; Simms, E.L.; Komatsu, K.J. More Than a Functional Group: Diversity within the Legume–Rhizobia Mutualism and Its Relationship with Ecosystem Function. Diversity 2020, 12, 50. [Google Scholar] [CrossRef]
  33. Zheng, L.; Barry, K.E.; Guerrero-Ramírez, N.R.; Craven, D.; Reich, P.B.; Verheyen, K.; Scherer-Lorenzen, M.; Eisenhauer, N.; Barsoum, N.; Bauhus, J.; et al. Effects of plant diversity on productivity strengthen over time due to trait-dependent shifts in species overyielding. Nat. Community 2024, 15, 2078. [Google Scholar] [CrossRef]
Figure 1. Schematic diagram of the study area. (a) location of the study area, the five-pointed star in the picture is the experiment site, (b) no treatment sample plot, (c) soil cover only sample plot, (d) organic fertilizer added, (e) organic fertilizer and compound fertilizer added.
Diversity 17 00513 g001
Figure 2. The plants coverage under different treatments. (a) Average coverage of sole sowing in 2023, (b) Average coverage of mixed sowing in 2023. (c) Average coverage of sole sowing in 2024, (d) Average coverage of mixed sowing in 2024. In the figure, CK represents the control, 1 represents soil covering, 2 represents soil covering with organic fertilizer, and 3 represents soil covering with organic fertilizer and compound fertilizer. (Capital letters in the figure indicate significant differences between different soil treatments (p < 0.05), while lowercase letters indicate significant differences between different sowing methods under the same soil treatment (p < 0.05)). EDA, Elymus dahuricus; DGL, Dactylis glomerata; MSA, Medicago sativa.
Diversity 17 00513 g002
Figure 3. The maximum plant height under different treatments. (a) average maximum height of single-sown plants in 2023, (b) average maximum height of mixed-sown plants in 2024. (c) average maximum height of single-sown plants in 2023, (d) average maximum height of mixed-sown plants in 2024. In the figure, CK represents the control, 1 represents soil covering, 2 represents soil covering with organic fertilizer, and 3 represents soil covering with organic fertilizer and compound fertilizer. (Capital letters in the figure indicate significant differences between different soil treatments (p < 0.05), while lowercase letters indicate significant differences between different sowing methods under the same soil treatment (p < 0.05)). EDA, Elymus dahuricus; DGL, Dactylis glomerata; MSA, Medicago sativa.
Diversity 17 00513 g003
Figure 4. The average biomass of plants under different treatments. (a) average biomass of single-sown plants in 2023. (b) average biomass of mixed-sown plants in 2024. (c) average biomass of single-sown plants in 2023. (d) average biomass of mixed-sown plants in 2024. In the figure, CK represents the control, 1 represents soil covering, 2 represents soil covering with organic fertilizer, and 3 represents soil covering with organic fertilizer and compound fertilizer. (Capital letters in the figure indicate significant differences between different soil treatments (p < 0.05), while lowercase letters indicate significant differences between different sowing methods under the same soil treatment (p < 0.05)). EDA, Elymus dahuricus; DGL, Dactylis glomerata; MSA, Medicago sativa.
Diversity 17 00513 g004
Figure 5. The selection effect and compensation effect of mixed sowing combinations. (a) Compensation effect of mixed sowing combinations in 2023. (b) Selection effect of mixed sowing combinations in 2023. (c) Compensation effect of mixed sowing combinations in 2024. (d) Selection effect of mixed sowing combinations in 2024. In the figure, CK represents the control, 1 represents soil covering, 2 represents soil covering with organic fertilizer, and 3 represents soil covering with organic fertilizer and compound fertilizer. EDA, Elymus dahuricus; DGL, Dactylis glomerata; MSA, Medicago sativa.
Diversity 17 00513 g005
Figure 6. Fitting curve of compensation effect (CE) (a) and selection effect (SE) (b) on productivity. Cor is the Pearson correlation coefficient. The blue line is the fitting line. The grey circles are effect coefficients. The shading is confidence interval.
Diversity 17 00513 g006
Disclaimer/Publisher’s Note: The statements, opinions and data contained in all publications are solely those of the individual author(s) and contributor(s) and not of MDPI and/or the editor(s). MDPI and/or the editor(s) disclaim responsibility for any injury to people or property resulting from any ideas, methods, instructions or products referred to in the content.

