Abstract
In recent decades, fishery stock enhancement has been increasingly utilized as a restoration tool to mitigate population declines and enhance the resilience of marine fisheries. Nevertheless, persistent enhancement efforts risk eroding the evolutionary potential of wild populations via genetic homogenization and maladaptive gene flow. Using long-term monitoring data (2017–2023), we quantified the effects of large-scale Penaeus penicillatus stock enhancement (~108 juveniles/yr) on wild population dynamics and genetic integrity in the Beibu Gulf ecosystem. Temporal genetic changes were assessed using eight highly polymorphic microsatellite loci, comparing founder (2017) and enhanced (2024) populations to quantify stocking impacts. Insignificantly lower expected heterozygosity was observed in the stocked population (He = 0.60, 2024) relative to natural populations (He = 0.62–0.66; p > 0.1), indicating genetic dilution effects from enhancement activities. No significant erosion of genetic diversity was detected post-enhancement, suggesting current stocking practices maintain short-term population genetic integrity. Despite conserved heterozygosity, pairwise Fst analysis detected significant genetic shifts between temporal cohorts (pre-enhancement—2017 vs. post-enhancement—2024; Fst = 0.25, p < 0.05), demonstrating stocking-induced population restructuring. Genetic connectivity analysis revealed that while the enhanced Beihai population (A-BH) maintained predominant self-recruitment (>90%), it experienced substantial stocking-derived gene flow (17% SW → A-BH). The post-stocking period showed both reduced genetic exchange with adjacent populations and increased asymmetric dispersal from A-BH (e.g., 5% to YJ), indicating that hatchery releases simultaneously enhanced population isolation while altering regional genetic structure. Our findings revealed the paradoxical dual effects of stock enhancement and allelic diversity while disrupting natural genetic architecture. This underscores the need for evolutionary-impact assessments in marine resource management.
1. Introduction
While global fisheries and aquaculture provide essential nutrition (17% of animal protein) and livelihoods for 60 million people, unsustainable exploitation (34.2% overfished stocks) and climate impacts (projected 12–24% catch decline by 2100) threaten long-term sectoral sustainability [FAO, 2022] [1,2,3]. Stocking of early-life-stage aquatic organisms (e.g., fish, shrimp) is a common restoration practice aimed at enhancing depleted populations, reestablishing trophic interactions, and rehabilitating degraded ecosystems [4]. Notably, empirical evidence also shows that it strengthens ecosystem resilience against anthropogenic stressors such as overfishing and habitat degradation [5,6]. Inadequate genetic oversight during stocking operations can degrade wild stock integrity through introgression and fitness loss, necessitating improved breeding protocols and monitoring frameworks [7]. Therefore, continuous genetic monitoring is essential to ensure the sustainability and ecological integrity of stock enhancement programs.
Penaeus penicillatus (syn. Fenneropenaeus penicillatus) served as a critically important species for both aquaculture and coastal fisheries in southeastern China during the 1980s. However, a severe population decline was observed in wild stocks beginning in the early 1980s, primarily attributed to overexploitation, habitat degradation, and intensified coastal development [8]. Consequently, P. penicillatus has been designated as an endangered species on China’s Red List of Endangered Species [9]. Previous studies have demonstrated that stock enhancement programs significantly contribute to the long-term population stability of P. penicillatus in Xiamen Bay while simultaneously sustaining the socioeconomic viability of local fishery-dependent communities (Wang et al., 2021) [10].
The Beibu Gulf, a semi-enclosed marine basin in the northwestern South China Sea, constitutes an essential habitat for P. penicillatus. In recent decades, this region has undergone significant ecological degradation, necessitating integrated management strategies that merge sustained resource monitoring with targeted habitat restoration to bolster ecosystem resilience (Luo et al., 2023) [11]. In response to the depletion of marine resources, China and Vietnam established a bilateral stock enhancement initiative in the Beibu Gulf in 2017, involving the systematic release of P. penicillatus juveniles to facilitate fishery replenishment and ecological rehabilitation [12]. While stock enhancement programs have undergone significant expansion in recent decades, comprehensive evaluations of their genetic effects on population structure and diversity dynamics before and after release operations remain notably absent in ecologically and economically critical areas like the Beibu Gulf. This evidence deficiency is particularly relevant to P. penicillatus, a high-value fishery species that has undergone extensive hatchery-based restocking programs in these waters. Evidence from other regions suggests that genetic outcomes vary post-release. Wang et al. (2016) observed that Fenneropenaeus chinensis populations introduced to Bohai Bay retained high levels of genetic diversity (He = 0.8) and sufficient effective population sizes (Ne = 2~21), but nevertheless displayed measurable inbreeding depression (Fis > 0), suggesting a requirement for optimized stocking protocols [13]. Contrastingly, Song et al. (2024) demonstrated negligible population differentiation (Fst = 0.018, p > 0.05) between hatchery-propagated and wild Phascoloma esculenta cohorts in Yueqing Bay, indicating that genetically informed enhancement protocols can effectively maintain population genetic architecture [14]. However, such insights cannot be assumed to generalize across taxa or regions. For P. penicillatus in the Beibu Gulf, empirical data on genetic outcomes of enhancement remain lacking, underscoring the need for species-specific and region-specific assessments.
We employed microsatellite markers (SSRs), which are short tandem repeats of 2–6 nucleotides characterized by high polymorphism and codominant inheritance, to assess the genetic diversity and population structure of P. penicillatus in the Beibu Gulf before and after stock enhancement. SSRs are genome-wide distributed repetitive sequences widely utilized for germplasm identification, parentage analysis, and conservation genetics due to their reliability and resolution [15,16]. Microsatellite analyses (Herkenhoff et al., 2023; Tesfaye et al., 2021; Zhao et al., 2019) have proven effective for quantifying contemporary genetic variation, detecting population substructure, and identifying genetic bottlenecks in stocked populations. These data directly inform broodstock selection and release protocols to maintain evolutionary potential in enhancement programs [17,18,19]. Building on the microsatellite loci developed by Liu Shengnan for P. penicillatus, previous research has assessed temporal genetic variation associated with stock enhancement, providing essential insights into its genetic impacts [20].
This study employs microsatellite marker technology to evaluate the genetic effects of stock enhancement of P. penicillatus in the Beibu Gulf by comparing wild populations from the release area before and after long-term, large-scale release efforts, as well as with populations from other regions of the South China Sea. By generating a clearer understanding of how enhancement activities influence natural genetic diversity and structure, this research aims to inform sustainable stock restoration strategies and provide practical genetic management guidelines for stock enhancement programs worldwide.
2. Materials and Methods
2.1. Sample Collection
The research region is the Beibu Gulf, a partially confined bay, and its surrounding coastal waters, which serves as a conservation zone for the germplasm resources of P. penicillatus [21]. Prior to the large-scale stock enhancement conducted in August 2017, 20 individuals were collected from the natural population in Beihai (P-BH). After seven years, in 2024, we returned to the same location and collected 52 individuals from the same population (A-BH) to assess long-term genetic changes. In addition, during the initial sampling period in 2017, we also collected wild individuals from other regions of the South China Sea, including 28 from Sanya (SY), 29 from Zhanjiang (ZJ), 45 from Yangjiang (YJ), 25 from Zhuhai (ZH), 15 from Shantou (ST), and 30 from Shanwei (SW). The sample collection sizes are presented in Table 1. Figure 1 presents the sampling sites overlaid with regional ocean currents adapted from Zhu et al. (2015) to indicate potential larval dispersal pathways [22]. All fishing methods were trawl fishing. Tissue samples were preserved in 95% ethanol for DNA extraction.

Table 1.
Sample collection information of P. penicillatus.
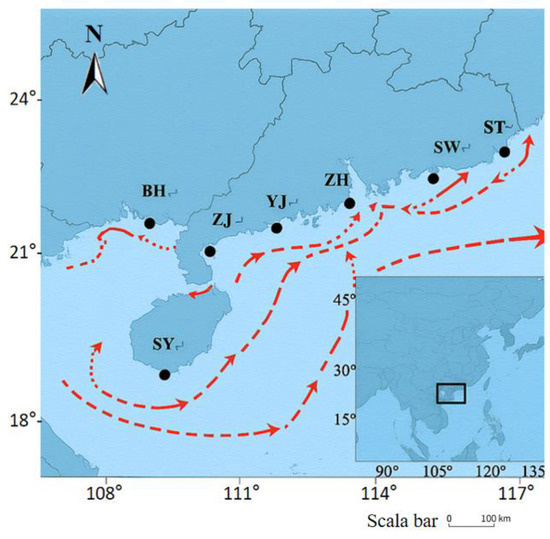
Figure 1.
The black inset box highlights the enlarged the Beibu Gulf area in the northern South China Sea (Coordinates: 108° E–117° E, 18° N–24° N), shows the sampling sites of P. penicillatus in the Beibu Gulf. BH, Beihai; ZH, Zhuhai; ZJ, Zhanjiang; ST, Shantou; YJ, Yangjiang; SW, Shanwei; SY, Sanya. P-BH and A-BH are the same location sampled in different years (2017 and 2024). Red line represents the direction of ocean currents. (Scale bar: 100 km).
2.2. DNA Extraction and Microsatellite PCR
A total of 244 P. penicillatus samples were used to investigate stocking efficiency and population genetics. Eight polymorphic microsatellite loci (CMDX25, CMDX102, CMDX126, CMDX27, CMDX33, CMDX74, CMDX59, and CMDX71), originally developed by Liu et al. for P. penicillatus, were selected for analysis [20]. Genomic DNA was extracted using the TIANGEN Marine Animal DNA Kit (Beijing, China) and was followed by PCR amplification, agarose gel verification, and fragment analysis on an ABI 3730xl Genetic Analyzer (Thermo Fisher, Waltham, MA, USA). The reaction was carried out at primer-specific annealing temperatures [20].
2.3. Data Analysis
Microsatellite allele scoring was performed using GeneMarker v2.2.0 (SoftGenetics, State College, PA, USA) with manual verification and binning of fragment sizes based on reference population data. Genetic diversity in each population was quantified as the number of alleles (Na), allele richness (Ar), observed heterozygosity (Ho), expected heterozygosity (He), and inbreeding coefficient (Fis) as means to determine the genetic variation of P. penicillatus at each locus in 2024 and 2017. They were calculated using Microsatellite Toolkit (Excel) and Genepop V4 [23]. The frequency of null alleles (fn) was calculated with Micro-Checker v2.2.3 [24].
To measure population differentiation, pairwise F-statistics (Fst) were estimated based on microsatellite data using FSTAT v2.9.4 (Goudet, 1995) [25]. Statistical significance of pairwise Fst values was assessed using a permutation approach (≥10,000 randomizations), with p-values subsequently adjusted for multiple comparisons via the Bonferroni method (Rice, 1989) [26]. Significant differentiation among populations was evaluated via exact p-tests employing a Markov chain Monte Carlo approach in ARLEQUIN [27]. For enhanced visualization of differentiation patterns, a heatmap of Fst values and the corresponding exact p-test results are provided (Table S1). In addition, Populations v1.2.30 was applied to generate a neighbor-joining (NJ) cluster tree based on the distance between populations, with the number of samplings set to 1000 times [28,29]. Using the population genetic structure software STRUCTURE 2.3.4 (Evanno, G. et al., 2005), the genetic compositions of 224 samples were calculated and population structure analysis was performed [30]. The number of populations was set from 1 to 10 as the range of the K value test. Each K value runs 10 times. A burn-in period of 10,000 iterations was initially run, followed by 100,000 iterations of Markov chain Monte Carlo (MCMC) replication. Using the web-based program STRUCTURE HARVESTER (Earl et al., 2012), the optimal number of populations (K) was estimated using the ∆K method [31]. The Discriminant Analysis of Principal Components (DAPC) method implemented in the Adegenet package (Jombart, 2008) (https://github.com/thibautjombart/adegenet, accessed on 1 April 2025) for R 4.4.1 (R Core Team, 2017) was used for genetic structure analysis of the sampled populations [32,33].
In order to detect the bottleneck effect of the loss of alleles and the excess or deletion of population heterogeneity when the number of individuals in the population is significantly reduced, BOTTLENECK v1.2.02 is used to detect whether the species has recently experienced the genetic bottleneck effect [34]. A two-phase model (TPM) with 90% single-step mutations and 10% variance among multi-step mutations was tested using 20,000 replications for populations. Contemporary effective population sizes (Ne) were estimated using NeEstimator V2 (Do et al., 2014), which implements a single-sample linkage disequilibrium method [35]. Alleles with frequencies below 0.02 were excluded to minimize bias from rare alleles while maintaining analytical accuracy. Contemporary gene flow and historical gene flow (M) were estimated among populations using BayesAss v1.3 (Wilson & Rannala, 2003) and Migrate-n (Beerli & Felsenstein, 2001; Beerli, 2006), respectively [36,37,38]. Contemporary migration rates were estimated using BayesAss v3 with 10 million MCMC iterations (1 million burn-in), sampling every 100 steps, and tuning parameters set to ensure optimal acceptance rates (α = 0.30 for migration rates, f = 0.50 for inbreeding coefficients). Bayesian inference implemented in MIGRATE v3.7.2 (Beerli, 2008) was employed to estimate historical gene flow and effective population size [39]. Specifically, the program estimated mutation-scaled migration rates (M = mh/μ, where mh is the historical migration rate and μ is the mutation rate per generation) and mutation-scaled effective population sizes (θ = 4 Neμ, where Ne is the historical effective population size) based on coalescent theory.
3. Results
3.1. Genetic Diversity
Microsatellite analysis revealed high polymorphism across populations, with allele numbers ranging from 3 (CMDX25 in ZJ) to 12 (CMDX126 in SW) (Table 2). The post-release A-BH population maintained comparable allelic diversity (total alleles = 51, mean = 6.4/locus) to pre-release groups, suggesting minimal enhancement impact. This was further supported by allelic richness values (Ar = 3.51–6.64) after sample size standardization and consistent heterozygosity patterns. Among the seven pre-release populations, observed heterozygosity (Ho) ranged from 0.04 to 0.96, and expected heterozygosity (He) ranged from 0.19 to 0.88. In the post-release A-BH population, Ho ranged from 0.44 to 0.869 and He from 0.49 to 0.79, both of which fall within the ranges observed in pre-release populations. These results indicate that stock enhancement did not lead to a reduction in heterozygosity and further support the stability of genetic diversity following release. He and Ho represent the genetic diversity potential of populations at a specific locus. The findings indicate relative consistent genetic diversity among the eight populations. ANOVA analysis of He using SPSS 27 software revealed significance levels of p > 0.1 for both [40]. No statistically significant differences in He were observed across all groups. This further confirms that genetic diversity remained stable before and after the stock enhancement release. Although Ho values were generally lower than He values across most populations, no significant heterozygote deficiency was detected (Wilcoxon test, p > 0.1). Moreover, Fis values exhibited no significant directional trends across populations or loci. Notably, Micro-Checker analysis confirmed the absence of null alleles in all populations and loci. Figure 2 shows the average observed heterozygosity (Ho) and expected heterozygosity (He) across the eight populations. Overall, the P. penicillatus populations exhibited relatively consistent levels of genetic diversity before and after stock enhancement, with no significant increases or decreases observed.
Table 2.
Genetic diversity parameters of experimental samples of P. penicillatus.
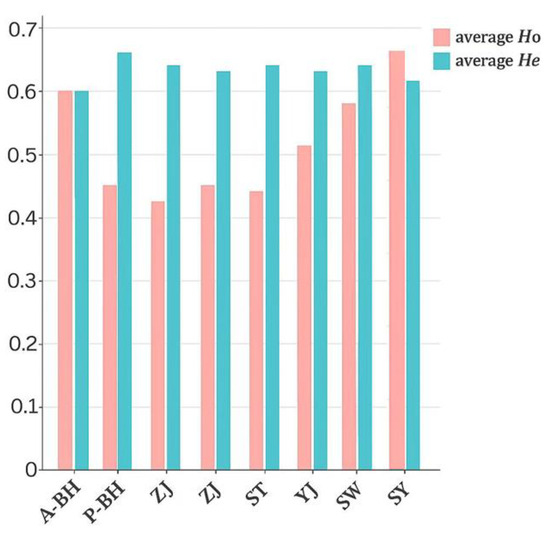
Figure 2.
Trend chart of average Ho and He values at eight sampling sites.
3.2. Genetic Structure
Pairwise genetic differentiation (Fst) was estimated using FSTAT, with values ranging from −0.01 to 0.28. Corresponding genetic distances, calculated with Populations v1.2, ranged from 0.21 to 0.56 (Figure 3). Notably, the post-release population at A-BH exhibited moderate to very strong genetic differentiation from the pre-release population at P-BH (Fst = 0.25, p < 0.05), with a corresponding genetic distance of 0.52. According to the classification proposed by Yuan for P. penicillatus, Fst values less than 0.05 indicate weak differentiation, values between 0.05 and 0.15 indicate moderate differentiation, values of 0.15–0.25 represent strong differentiation, and values greater than 0.25 suggest very strong genetic differentiation [41]. Under this framework, the divergence between A-BH and P-BH is at the threshold of very strong differentiation, implying that stock enhancement may have led to substantial genetic shifts in the local population. In contrast, the genetic differentiation between P-BH and nearby wild populations such as ZH and ZJ was low (Fst = 0.00, −0.01), indicating strong connectivity before release. However, post-release A-BH showed elevated divergence from these same groups (Fst = 0.26 with ZH, 0.28 with ZJ), falling into the category of very strong genetic differentiation, potentially due to the introduction of non-local or genetically distinct hatchery-reared individuals. P-BH also showed moderate differentiation from SW and SY (Fst = 0.16 and 0.17, p < 0.05), with genetic distances of 0.47 and 0.48, respectively. A-BH showed low genetic differentiation from SW and SY (Fst = 0.07 and 0.10, p < 0.05). These findings suggest that long-term stock enhancement programs have reshaped the genetic structure of P. penicillatus populations in the Beibu Gulf. The A-BH population now appears genetically closer to the natural populations of SW and SY, while P-BH clusters more closely with the neighboring populations ZH and ZJ.
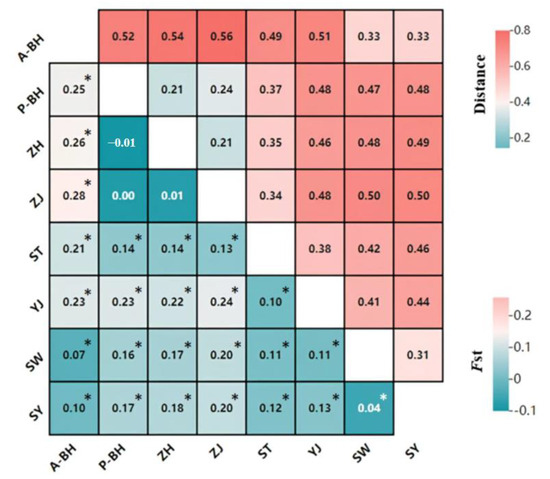
Figure 3.
The lower left corner shows the Fst values for eight populations, while the upper right corner displays the genetic distances between these eight populations (* p < 0.05, specific values in Table S1).
Figure 4 presents the NJ-based phylogenetic relationships among the studied P. penicillatus populations. Our analysis identified three major genetic clusters: Clade 1 comprised A-BH, SW, and SY; Clade 2 included ZH, P-BH, and ZJ; and Clade 3 consisted of ST and YJ. The phylogenetic structure revealed that Clade 2 first clustered with Clade 3, forming a secondary grouping, which subsequently merged with Clade 1 to form the overall topology. This intermediate clustering order (Clade 2 + Clade 3 → Clade 1) indicates a closer genetic relationship between Clades 2 and 3 than between either of them and Clade 1. This hierarchical clustering pattern was supported by both the topology of the neighbor-joining (NJ) tree and the results of pairwise Fst analyses.
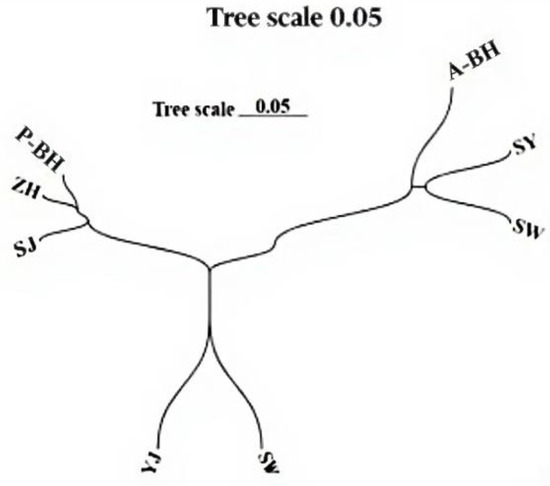
Figure 4.
The NJ tree based on Nei’s genetic distance of P. penicillatus.
Discriminant Analysis of Principal Components (DAPC) further supported the presence of three distinct genetic clusters, consistent with the phylogenetic results. As shown in Figure 5, individuals were clearly assigned to three groups (Clusters 1–3), with minimal overlap and strong within-group cohesion. Cluster 1 corresponded to the A-BH, SW, and SY populations; Cluster 2 contained ZH, P-BH, and ZJ; and Cluster 3 comprised ST and YJ. The separation among clusters along the first two discriminant functions reflects pronounced genetic structuring across the populations. These results confirm the hierarchical clustering pattern observed in the NJ tree and pairwise Fst analyses, highlighting the genetic distinctiveness of the three regional groupings.
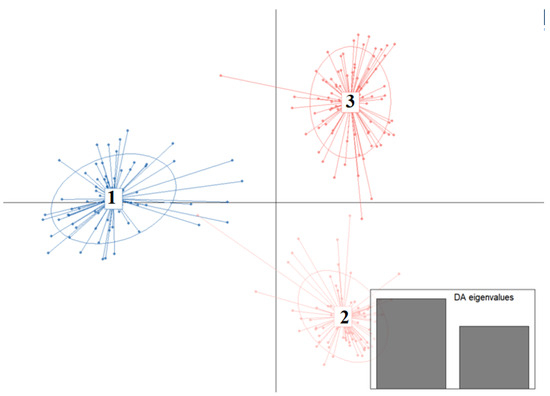
Figure 5.
Discriminant Analysis of Principal Components (DAPC) reveals three genetic clusters among P. penicillatus populations in the Beibu Gulf. The first discriminant function explained the majority of between-group variation, indicating that the clustering is primarily driven by the genetic differences captured along this axis.
We applied STRUCTURE 2.3.4 to analyze the genetic structure of 224 P. penicillatus individuals. According to the model (Evanno et al., 2005) selection criterion (ΔK), the optimal number of clusters was determined to be K = 3 [30]. This was supplemented by checking the line chart (Figure 6) of the average logarithm likelihood value LnP(K). This result was corroborated by graphical visualization in Figure 7 using three colors, which revealed three subgroups. Population assignment patterns showed that (1) P-BH, ZH, and ZJ formed a primary subgroup; (2) A-BH, SW, and SY constituted a secondary subgroup; and (3) ST and YJ were assigned to a third subgroup. This result is also consistent with previous analysis results.
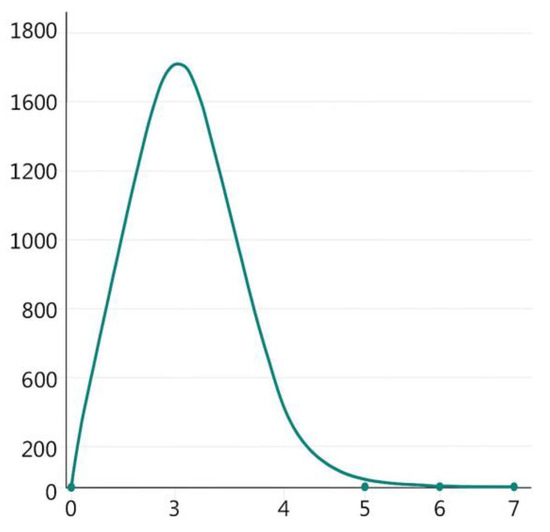
Figure 6.
Relation of the cluster number (K) and estimated value (ΔK).
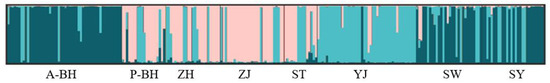
Figure 7.
Clustering the genetic structure of eight populations using STRUCTURE (K = 3).
3.3. Demographic Pattern and Gene Flow
The estimated effective population sizes (Ne) across the eight populations ranged from 2.1 to 250.7 based on the linkage disequilibrium (LD) method (Table 3). The highest Ne was observed in ZH (5.0–250.7), while the lowest was detected in ST (2.1–15.4), potentially indicating localized demographic instability or inbreeding. Importantly, both the P-BH and A-BH populations exhibited overlapping confidence intervals for Ne (P-BH: 8.5–96.4; A-BH: 10.1–39.6), suggesting that the stock enhancement activities did not substantially increase the effective population size in the BH region. While some populations (ST and SY) showed comparatively low Ne values, all populations generally fell within the expected range for shrimp species, indicating an absence of severe recent demographic collapse. According to the study by Ada et al. (2024), the estimated effective population size (Ne) of the endangered Syncaris pacifica ranged from 30.3 to infinity [42]. In comparison, Knibb et al. (2014) reported an Ne range of 4.8 to 262.5 in Fenneropenaeus merguiensis [43]. These comparisons indicate that the Ne estimates observed in P. penicillatus fall within the expected range for shrimp species, suggesting a moderate level of genetic diversity.
Table 3.
Estimated effective population sizes (Ne) for P. penicillatus populations using the linkage disequilibrium (LD) method.
To assess recent demographic contractions, we conducted bottleneck tests under TPM models. No significant heterozygosity excess was observed under the TPM model in multiple populations, and all tested populations exhibited normal L-shaped distributions in the mode-shift indicator analysis, suggesting no detectable recent bottlenecks (Figure 8).
Figure 8.
L-shaped mode-shift distributions indicate absence of recent bottlenecks in eight groups of P. penicillatus.
Bayesian analysis revealed low recent gene flow among populations, with most individuals assigned to their original populations (Figure 9a). The post-enhancement group (A-BH) showed strong genetic self-recruitment, suggesting the formation of a relatively closed genetic unit. In contrast, the pre-enhancement population (P-BH) exhibited a more admixed profile, indicating higher historical connectivity with nearby populations. Gene exchange between A-BH and P-BH was minimal, implying that stock enhancement did not immediately homogenize the genetic composition of the two. These results suggest that enhancement activities may alter local population structure and reduce gene flow with native stocks, warranting continued genetic monitoring (special values in Table S2). Historical gene flow values using Migrate-n ranged from 0.01 to 0.94. Migrate-n analysis revealed consistently high historical gene flow among all populations in the Beibu Gulf (Figure 9b). The Beihai populations before and after stocking (A-BH, P-BH) and the surrounding local populations have all maintained strong genetic connectivity, indicating that genetic differentiation has been limited historically, reflecting a historically open gene flow network (special values in Table S3).
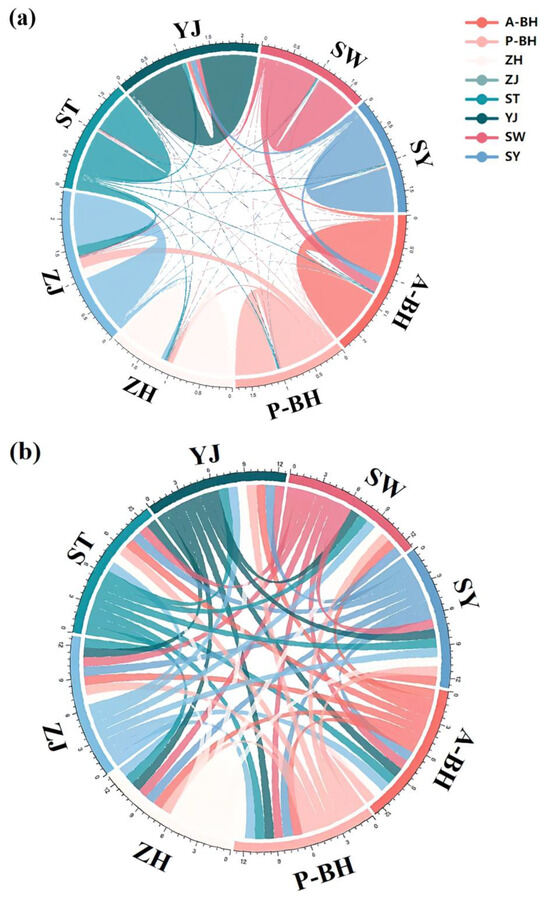
Figure 9.
Recent and historical gene flow patterns among P. penicillatus populations inferred using BayesAss3 and Migrate-n. (a) shows contemporary gene flow before stocking, in which the BH population exhibited frequent gene flow with the ZH and ZJ populations. After stocking, the BH population showed frequent gene flow with the SW and SY populations, and may have formed a relatively independent gene pool. (b) shows historical connectivity gene flow. Whether before or after stocking, the BH population exhibits frequent gene flow with other populations.
4. Discussion
The South China Sea’s biogeographic position and favorable environmental conditions sustain globally important fishery yields while maintaining high marine biodiversity [44]. The Beibu Gulf, once among Southeast Asia’s most productive marine ecosystems, now faces significant biodiversity loss and ecosystem function impairment due to compounded human impacts [45]. Notably, the biomass of P. penicillatus declined sharply between 2016 and 2017, falling to approximately 20% of its historical baseline (1961–1962) [46]. To mitigate stock collapse, P. penicillatus enhancement was initiated in 2017, though potential introgression risks necessitate genetic-impact assessments alongside traditional stock recovery metrics [47]. To monitor stocking effects, we compared pre- and post-release wild populations using microsatellite genotyping to assess the retention of genetic diversity and changes in genetic structure.
4.1. Genetic Diversity
Genetic diversity preservation must be central to stock enhancement assessments to safeguard evolutionary potential while meeting fishery objectives [48,49]. Expected heterozygosity (He) is a widely used metric for evaluating genetic diversity within populations [14]. In our study, the post-stocking A-PH group showed only a marginal reduction in expected heterozygosity (ΔHe = −0.02), which was not statistically significant (p > 0.1). This suggests that enhancement activities had minimal detectable impacts on overall genetic diversity, a finding consistent with studies on other marine species. For example, Song et al. [50] reported a non-significant decline in He and stable genetic diversity in Phascolosoma esculenta following stock enhancement, while Zhang et al. [51] observed similar results in Portunus trituberculatus in the Yangtze River Estuary. Collectively, these studies indicate that stock enhancement may cause minor reductions in genetic diversity, but the effects are often negligible at current release scales. In the case of P. penicillatus in the Beihai marine region, we observed a slight but non-significant reduction in genetic diversity post-enhancement. Notably, consistent deficits between observed and expected heterozygosity (mean Fis = 0.18 ± 0.03) in the absence of null alleles suggest possible cryptic population structure or localized selection pressures. Despite these deficits, the He values (0.60–0.73) in our study fall within the upper range of genetic diversity reported for P. penicillatus (He ≈ 0.7) [52]. For comparison, Litopenaeus vannamei—a species recognized for high genetic diversity—exhibits He values ranging from 0.23 to 0.92 and observed heterozygosity (Ho) from 0.11 to 0.99 [53]. This suggests that P. penicillatus populations in the Beibu Gulf, both pre- and post-enhancement, retain relatively high genetic diversity, reinforcing their resilience to short-term stocking pressures.
Our results demonstrate that P. penicillatus populations in the Beibu Gulf maintained relatively stable genetic diversity before and after stock enhancement. This finding aligns with previous studies in the region. Liu et al. (2019) assessed the genetic diversity of P. penicillatus using nine microsatellite loci and found no significant difference between hatchery-released and wild populations [52]. Similarly, Zhang et al. (2023) reported no significant differences in genetic diversity between released and recaptured Penaeus japonicus populations in the Beibu Gulf based on microsatellite markers [54]. Genetic diversity stability after stock enhancement is not restricted to the shrimp species of this region. Premachandra et al. (2022) observed that while haplotype sharing occurred in Australian Penaeus plebejus stock enhancement programs, overall genetic diversity and population structure remained stable over time based on mitochondrial control region data, suggesting minimal genetic disruption [55]. However, contrasting results exist for other species and locations. Zhang et al. [56] documented reduced genetic diversity in Anabarilius grahami populations at release sites and surrounding areas in Lake Fuxian following restocking. Similarly, microsatellite analyses of Acanthopagrus schlegelii stock enhancement in Jeju Island, South Korea, revealed post-release genetic diversity declines [57]. These studies collectively indicate that stock enhancement can potentially reduce genetic diversity in native populations, depending on species-specific and environmental factors.
Long-term genetic monitoring reveals that P. penicillatus populations in the Beibu Gulf have maintained stable diversity levels throughout the enhancement program, indicating effective mitigation of common genetic risks. This successful conservation of genetic variability likely reflects adequate effective population sizes preventing drift-induced diversity loss; strategic broodstock management maintaining representative allelic diversity; and natural connectivity facilitating compensatory gene flow.
4.2. Genetic Structure
Most animal species exhibit detectable genetic differentiation among populations, reflecting the interplay between dispersal capacity and historical population dynamics [58]. Genetic stock identification resolved three management units for P. penicillatus (A-BH/SW/SY|P-BH/ZH/ZJ|YJ/ST) with distinct gene pools, requiring separate conservation strategies despite spatial overlap. Wang et al. identified two distinct genetic lineages of Mytilus coruscus along the Chinese coastline, while Li et al. reported that Moerella iridescens populations were structured into three genetic clusters across the same region [59,60]. The genetic distinctiveness of these clusters was clearly supported across all analytical approaches.
Prior to stock enhancement, the P-BH population showed close genetic clustering with ZH and ZJ (Cluster 2), representing the natural genetic composition of the Beihai region. The low genetic differentiation (mean Fst = 0.00 ± 0.01) was likely maintained by the dominant westward-flowing coastal currents in the northern South China Sea (Figure 1). Post-enhancement genetic patterns revealed a striking divergence. The artificially enhanced A-BH population consistently clustered with SW and SY populations across all analyses (neighbor-joining, STRUCTURE, DAPC; Cluster 1), demonstrating that stocked individuals originated from hatchery broodstock genetically distinct from local Beihai lineages (P-BH, ZH, ZJ). This conclusion aligns with the Beibu Gulf’s cyclonic circulation (Figure 1), which naturally promotes northward larval dispersal along the Guangdong coast (explaining ZH-ZJ-P-BH connectivity), and the biologically implausible genetic affinity between A-BH and distant SW/SY populations without anthropogenic translocation. The stark contrast between hydrographic connectivity patterns and genetic clustering provides conclusive evidence of hatchery-induced population restructuring. As Shan et al. demonstrated, translocation of non-local hatchery juveniles is a primary driver of such genetic changes [61]. Our findings are further supported by Hsu et al., who showed that aquaculture-origin individuals can be identified even without hatchery genetic records [62]. To mitigate such impacts, studies suggest collecting broodstock across multiple spawning events, as collecting eggs across multiple spawning events can enhance the effective number of breeders, reduce genetic divergence between hatchery-released and wild populations, and help preserve the broader genetic diversity and resources of wild stocks [63].
Synthesis of genomic clustering and biophysical modeling reveals that the contemporary P. penicillatus population structure in the Beibu Gulf is now dominated by stocking, overriding natural connectivity patterns historically maintained by regional currents. The A-BH stock has undergone complete genetic displacement from its ancestral composition (formerly clustered with ZH/ZJ/P-BH wild populations), now mirroring the allelic profile of hatchery-source stocks (SW/SY). These findings necessitate immediate adoption of genetically informed enhancement protocols, including (a) broodstock sourcing restricted to natal biogeographic units; (b) pre-release genetic screening to prevent maladaptive introgression; and (c) longitudinal genomic monitoring to quantify wild–hatchery introgression rates and adaptive divergence.
4.3. Gene Flow and Effective Population Size
The genetic structure of P. penicillatus populations in the Beibu Gulf reflects a complex interaction of oceanographic currents, historical gene flow, and contemporary stock enhancement efforts. All surveyed populations retained effective population sizes (Ne) within biologically sustainable thresholds, indicating no imminent risk of genetic depletion [42,43]. Despite stable effective population size (Ne) metrics, stock enhancement activities have induced detectable alterations in both genetic differentiation and interpopulation connectivity among P. penicillatus populations in the Beibu Gulf. Heterozygosity excess tests revealed no significant evidence of recent genetic bottlenecks in any population, with all groups maintaining characteristic L-shaped allele frequency distributions consistent with stable demographic histories. Wang et al. estimated the Ne size of Cynoglossus semilaevis and found that inbreeding and bottleneck effects contributed to a reduction in Ne. In contrast, our study detected no significant signs of inbreeding or recent bottlenecks, indicating that stock enhancement did not exert a detectable genetic impact on the effective population size of the studied populations [64].
Prior to release, Migrate-n analysis demonstrated historically high levels of gene flow among nearly all populations, reflecting the influence of persistent regional current systems (Figure 1). Coastal circulation in the northern South China Sea, including the westward-flowing China Coastal Current and the cyclonic gyre in the Beibu Gulf, likely facilitates larval dispersal and genetic exchange among the ZH, ZJ, and BH sites [22]. This indicates that BH maintained extensive gene flow with surrounding populations prior to release, which is further supported by the minimal pairwise Fst values and shared genetic assignment patterns among these populations. However, after stocking, the BH population exhibited distinctly altered genetic characteristics and was genetically closer to the geographically distant SW and SY populations, forming a distinct cluster in NJ, STRUCTURE, and DAPC analyses. This provides additional evidence that the genetic shift resulted from the introduction of hatchery-reared juveniles derived from genetically distinct, likely SW-SY native populations, broodstock.
Importantly, the post-stocking BH population showed strong genetic self-assignment and minimal admixture with other populations, possibly indicating the formation of a relatively closed genetic unit. These patterns emerged despite the presence of natural ocean currents that would otherwise facilitate gene flow, underscoring the dominant role of artificial inputs over natural connectivity. Nonetheless, the contrast between the high historical gene flow detected via Migrate-n and the restricted contemporary gene flow revealed by Bayesian assignment in the post-stocking BH population suggests that stock enhancement can disrupt established genetic exchange networks. In the future, it will be necessary to employ other technical approaches or collect more samples to monitor gene flow to protect the unique gene pools in different regions.
5. Conclusions
Microsatellite analysis of 224 P. penicillatus individuals revealed no significant genetic diversity impacts from stocking activities in the Beibu Gulf. While natural population genetic diversity remained stable, detectable shifts in genetic structure underscore the need for proactive management. To optimize stock enhancement, we recommend (1) optimizing hatchery broodstock management systems to implement genetic provenance tracking of offspring for targeted release zones; (2) restricting cross-basin translocation of larvae to preserve population-specific genetic architecture, while strategically diversifying fry procurement across ecologically distinct habitats; and (3) establishing longitudinal genetic monitoring of wild stocks using multi-locus genomic analyses with high-resolution markers (e.g., SNPs or RAD-seq). Collectively, these measures will counteract anthropogenic homogenization pressures, preserve trophic-level interactions, and develop evolutionarily resilient enhancement frameworks for sustainable fishery management.
Supplementary Materials
The following supporting information can be downloaded at: https://www.mdpi.com/article/10.3390/d17080511/s1, Table S1: Special values of Fst; Table S2: Contemporary gene flow with 95% confidence intervals for P. penicillatus using BayesAss; Table S3: Historical gene flow (M) with 95% confident intervals estimates for P. penicillatus using Migrate-n.
Author Contributions
Conceptualization, D.S., C.C. and D.Z.; Methodology, C.Y., M.L., C.C., D.Z. and B.S.; Software, Y.W., M.L. and C.C.; Validation, L.W., C.Y. and M.L.; Formal analysis, Y.W. and Q.X.; Investigation, Y.L., J.Z. and D.Z.; Resources, L.W., Y.L., C.Y. and Q.X.; Data curation, Y.W., L.W., Y.L., Q.X., J.Z. and B.S.; Writing—original draft, Y.W. and B.S.; Writing—review & editing, Y.W. and B.S.; Supervision, D.S.; Project administration, D.S.; Funding acquisition, D.S. and J.Z. All authors have read and agreed to the published version of the manuscript.
Funding
Asia Cooperation Fund Project—Modern fishery cooperation between China and neighboring countries around the South China Sea; Central Public-interest Scientific Institution Basal Research Fund, CAFS (No. 2023TD93, 2018YB05).
Institutional Review Board Statement
Not applicable.
Data Availability Statement
The data presented in this study are available in this article.
Acknowledgments
We are grateful to Xiaoling Chen for her help in our sequencing work.
Conflicts of Interest
The authors declare no conflicts of interest. The funders had no role in the design of the study; in the collection, analysis, or interpretation of the data; in the writing of the manuscript; or in the decision to publish the results.
References
- FAO. The State of World Fisheries and Aquaculture 2022: Towards Blue Transformation; Food and Agriculture Organization of the United Nations: Rome, Italy, 2022. [Google Scholar]
- Han, H.; Chen, Z. The impact of socio-economic factors on the decline of fishery resources. Int. J. Mar. Sci. 2024, 14, 74. [Google Scholar] [CrossRef]
- Yin, J.; Xue, Y.; Xu, B.; Lin, J.; Zhang, M.; Liu, Y.; Wang, Q.; Chen, L.; Zhou, H.; Li, X.; et al. Potential impacts of ocean warming on energy flow and fisheries production in an overexploited ecosystem: Implication for effective fisheries management. Ecol. Indic. 2024, 158, 111433. [Google Scholar] [CrossRef]
- Basheer, V.S.; Ravi, C.; Sarkar, U.K. Conservation of genetic resources: Restoration of fish stocks. In Sustainable Management of Fish Genetic Resources; Springer Nature: Singapore, 2024; pp. 237–248. [Google Scholar]
- Simić, V.; Miljanović, B.; Petrović, A.; Radenković, M.; Stojković Piperac, M.; Veličković, T.; Jakovljević, M.; Simić, S. Inland fisheries in Serbia: Historical aspect, fish resources, management, and conservation. In Ecological Sustainability of Fish Resources of Inland Waters of the Western Balkans: Freshwater Fish Stocks, Sustainable Use and Conservation; Springer International Publishing: Cham, Switzerland, 2024; pp. 113–200. [Google Scholar]
- Bell, J.D.; Bartley, D.M.; Lorenzen, K. Restocking and stock enhancement of coastal fisheries: Potential, problems and progress. Fish. Res. 2006, 80, 1–8. [Google Scholar] [CrossRef]
- Masuda, T.; Shimono, Y.; Kishi, D.; Koizumi, I. Evaluation of genetic consequences of stocking on the southern-margin populations of white-spotted charr. Ecol. Evol. 2024, 14, e70140. [Google Scholar] [CrossRef]
- Zhang, G.L.; Li, Z.B.; Wang, Z.L.; Lin, X.Y.; Wu, N. Study status and perspective of Fenneropenaeus penicillatus. Mod. Fish. Inform. 2010, 2010, 7–10. (In Chinese) [Google Scholar]
- Liang, H.F. Shrimp and Crab Biology; China Agriculture Press: Beijing, China, 2013. (In Chinese) [Google Scholar]
- Wang, J.Q.; Shih, Y.J.; Huang, L.M.; Li, J.; Li, W.W.; Shih, C.-H.; Chu, T.-J. Evaluating the effects related to restocking and stock replenishment of Penaeus penicillatus in the Xiamen Bay, China. J. Mar. Sci. Eng. 2021, 9, 1122. [Google Scholar] [CrossRef]
- Luo, Z.; Yang, C.; Wang, L.; Liu, Y.; Shan, B.; Liu, M.; Sun, D. Spatial and temporal distribution characteristics and diversity changes of fish resources in the coastal waters of the northern Gulf of Beibu. South J. Agric. 2023, 54, 1847–1857. (In Chinese) [Google Scholar]
- Information Office of the Ministry of Agriculture and Rural Affairs (MARA). China and Vietnam jointly hold joint stocking and conservation activities for fishery resources in the Gulf of Beibu Gulf. China Fish. 2017, 6, 4–5. (In Chinese) [Google Scholar]
- Wang, M.; Wang, W.; Xiao, G.; Liu, K.; Hu, Y.; Tian, T.; Kong, J.; Jin, X. Genetic diversity analysis of spawner and recaptured populations of Chinese shrimp (Fenneropenaeus chinensis) during stock enhancement in the Bohai Bay based on an SSR marker. Acta Oceanol. Sin. 2016, 35, 51–56. [Google Scholar] [CrossRef]
- Song, C.; Chen, P.; Lu, W.; Zhang, H.; Han, Q. Genetic diversity of a Phascolosoma esculenta population following stock enhancement in Yueqing Bay, East China Sea. Glob. Ecol. Conserv. 2024, 54, e03058. [Google Scholar] [CrossRef]
- Goldstein, D. Microsatellites: Evolution and Applications; Oxford University Press: Oxford, UK, 1999. [Google Scholar]
- Jarne, P.; Lagoda, P.J. Microsatellites, from molecules to populations and back. Trends Ecol. Evol. 1996, 11, 424–429. [Google Scholar] [CrossRef]
- Herkenhoff, M.E.; Bajay, M.M.; Costamilan, C.A.D.V.L. Genetic structure and biodiversity in wild Centropomus parallelus and in wild and recently domesticated Centropomus undecimallis populations. Life 2023, 13, 1595. [Google Scholar] [CrossRef]
- Tesfaye, G.; Curto, M.; Meulenbroek, P.; Englmaier, G.K.; Tibihika, P.D.; Alemayehu, E.; Getahun, A.; Meimberg, H. Genetic diversity of Nile tilapia (Oreochromis niloticus) populations in Ethiopia: Insights from nuclear DNA microsatellites and implications for conservation. Ecol. Evol. 2021, 21, 113. [Google Scholar] [CrossRef]
- Zhao, Y.; Zhu, X.; Li, Z.; Xu, W.; Dong, J.; Wei, H.; Li, Y.; Li, X. Genetic diversity and structure of Chinese grass shrimp, Palaemonetes sinensis, inferred from transcriptome-derived microsatellite markers. BMC Genet. 2019, 20, 75. [Google Scholar] [CrossRef]
- Liu, S. Development of Microsatellite Markers and Their Application in Stock Enhancement of Penaeus penicillatus. Master’s Thesis, Tianjin Agricultural University, Tianjin, China, 2019. (In Chinese). [Google Scholar]
- Sheng, Q.; Ru, H.; Li, Y.; Ni, Z.H. Current Status and Analysis of the Distribution Pattern of National Aquatic Germplasm Resource Conservation Areas in China. J. Fish. China 2019, 43, 62–80. (In Chinese) [Google Scholar]
- Zhu, Y. Study on the Deep Western Boundary Current in the South China Sea. Ph.D. Thesis, Ocean University of China, Qingdao, China, 2015. (In Chinese). [Google Scholar]
- Rousset, F. Genepop’007: A complete re-implementation of the genepop software for Windows and Linux. Mol. Ecol. Resour. 2008, 8, 103–106. [Google Scholar] [CrossRef] [PubMed]
- Van Oosterhout, C.; Hutchinson, W.F.; Wills, D.M. MICRO-CHECKER: Software for identifying and correcting genotyping errors in microsatellite data. Mol. Ecol. Notes 2004, 4, 535–538. [Google Scholar] [CrossRef]
- Goudet, J. FSTAT (version 1.2): A computer program to calculate F-statistics. J. Hered. 1995, 86, 485–486. [Google Scholar] [CrossRef]
- Rice, W.R. Analyzing tables of statistical tests. Evolution 1989, 43, 223–225. [Google Scholar] [CrossRef]
- Excoffier, L.; Lischer, H.E.L. Arlequin suite ver 3.5: A new series of programs to perform population genetics analyses under Linux and Windows. Mol. Ecol. Resour. 2010, 10, 564–567. [Google Scholar] [CrossRef]
- Populations, version 1.2.30; Free Software Under GNU GPL; Olivier Langella: Gif-sur-Yvette, France, 1999. Available online: https://bioinformatics.org/ (accessed on 8 August 2024).
- Saitou, N.; Nei, M. The neighbor-joining method: A new method for reconstructing phylogenetic trees. Mol. Biol. Evol. 1987, 4, 406–425. [Google Scholar] [CrossRef]
- Evanno, G.; Regnaut, S.; Goudet, J. Detecting the number of clusters of individuals using the software STRUCTURE: A simulation study. Mol. Ecol. 2005, 14, 2611–2620. [Google Scholar] [CrossRef]
- Earl, D.A.; Holdt, B.M. STRUCTURE HARVESTER: A website and program for visualizing STRUCTURE output and implementing the Evanno method. Conserv. Genet. Resour. 2012, 4, 359–361. [Google Scholar] [CrossRef]
- Jombart, T. adegenet: A R package for the multivariate analysis of genetic markers. Bioinformatics 2008, 24, 1403–1405. [Google Scholar] [CrossRef]
- R Core Team. R: A Language and Environment for Statistical Computing; R Foundation for Statistical Computing: Vienna, Austria, 2013. [Google Scholar]
- Piry, S.; Luikart, G.; Cornuet, J.M. BOTTLENECK: A computer program for detecting recent reductions in the effective population size using allele frequency data. J. Hered. 1999, 90, 502–503. [Google Scholar] [CrossRef]
- Do, C.; Waples, R.S.; Peel, D.; Macbeth, G.M.; Tillett, B.J.; Ovenden, J.R. NeEstimator V2: Re-implementation of software for the estimation of contemporary effective population size (Ne) from genetic data. Mol. Ecol. Resour. 2014, 14, 209–214. [Google Scholar] [CrossRef] [PubMed]
- Wilson, G.A.; Rannala, B. Bayesian inference of recent migration rates using multilocus genotypes. Genetics 2003, 163, 1177–1191. [Google Scholar] [CrossRef] [PubMed]
- Beerli, P.; Felsenstein, J. Maximum likelihood estimation of migration matrix and effective population sizes in n subpopulations by way of a coalescent approach. Proc. Natl. Acad. Sci. USA 2001, 98, 4563–4568. [Google Scholar] [CrossRef]
- Beerli, P. Comparison of Bayesian and maximum-likelihood inference of population genetic parameters. Bioinformatics 2006, 22, 2011. [Google Scholar] [CrossRef]
- Beerli, P.; Mashayekhi, S.; Sadeghi, M.; Khodaei, M.; Shaw, K. Population Genetic Inference with MIGRATE. Curr. Protoc. Bioinform. 2019, 68, e87. [Google Scholar] [CrossRef]
- IBM Corp. IBM SPSS Statistics for Windows; Version 25.0; IBM Corp.: Armonk, NY, USA, 2017. [Google Scholar]
- Yuan, Y. Development of Microsatellites and Analysis of Genetic Diversity in Male and Female Populations of Penaeus penicillatus. Master’s Thesis, Jimei University, Xiamen, China, 2016. (In Chinese). [Google Scholar]
- Ada, A.M.; Vandergast, A.G.; Fisher, R.N.; Suárez, A.V.; Bohonak, A.J. Conservation genetics of the endangered California freshwater shrimp (Syncaris pacifica): Watershed and stream networks define gene pool boundaries. Conserv. Genet. 2024, 25, 1021–1033. [Google Scholar] [CrossRef]
- Knibb, W.; Whatmore, P.; Lamont, R.; Nguyen, N.H.; Nguyen, T.T.T.; Moore, S. Can genetic diversity be maintained in long-term mass-selected populations without pedigree information?—A case study using banana shrimp Fenneropenaeus merguiensis. Aquaculture 2014, 428, 71–78. [Google Scholar] [CrossRef]
- Chen, Z.Z.; Lin, Z.J.; Qiu, Y.S. Evaluation of sustainability of fisheries resources for South China Sea based on the AHP. J. Nat. Resour. 2010, 25, 249–257. [Google Scholar]
- Su, L.; Chen, Z.Z.; Zhang, K.; Xu, Y.W.; Qiu, Y.S. Establishment of quality status evaluation system of fishery resources in Beibu Gulf based on bottom trawl survey data. J. Guangdong Ocean Univ. 2021, 41, 10–16. (In Chinese) [Google Scholar]
- Liu, L.; Lin, L.; Li, C.H.; Liu, Y.; Xu, S.N.; Zhou, Y.B. Effect assessment of marine fishery stock enhancement: A review of the literature. Guangdong Agr. Sci. 2014, 41, 133–137+143. (In Chinese) [Google Scholar]
- Blankenship, H.L.; Leber, K.M. A responsible approach to marine stock enhancement. Am. Fish. Soc. Symp. 1995, 15, 167–175. [Google Scholar]
- Bell, J.D.; Leber, K.M.; Blankenship, H.L.; Loneragan, N.R.; Masuda, R. A new era for restocking, stock enhancement and sea ranching of coastal fisheries resources. Rev. Fish. Sci. 2008, 16, 1–9. [Google Scholar] [CrossRef]
- Berg, E.E.; Hamrick, J.L. Quantification of genetic diversity at allozyme loci. Can. J. For. Res. 1997, 27, 415–424. [Google Scholar] [CrossRef]
- Zhang, X.; Sun, D.; Liu, Y.; Wang, Y.; Zhou, Q. Genetic Diversity and Population Structure of Portunus trituberculatus in Released and Wild Populations Based on Microsatellite DNA Markers from the Yangtze Estuary. Sustainability 2023, 15, 11142. [Google Scholar]
- Jarosz, D.F.; Taipale, M.; Lindquist, S. Protein homeostasis and the phenotypic manifestation of genetic diversity: Principles and mechanisms. Annu. Rev. Genet. 2010, 44, 189–216. [Google Scholar] [CrossRef]
- Liu, S.; Sun, D.; Liu, Y.; Yang, C.; Shan, B.; Zhou, W. Evaluation of stock enhancement effectiveness for Penaeus penicillatus in the Beibu Gulf using microsatellite markers. J. Ocean Univ. China (Nat. Sci. Ed.) 2019, 49 (Suppl. S2), 37–45. (In Chinese) [Google Scholar]
- Zhou, Y.; Wang, X.; Li, J.; Zhang, H.; Liu, P. Development of SSR Markers from Genomic Data for Litopenaeus vannamei and Analysis of Genetic Diversity in Different Cultured Populations. J. Fish. China 2023, 47, 108602. [Google Scholar]
- Zhang, M.; Zhao, Y.; Shan, B.; Chen, D.; Huang, W.; Liu, M.; Lin, X. Microsatellite-Marker-Based Evaluation of Stock Enhancement for Kuruma Prawn Penaeus japonicus in Beibu Gulf, South China Sea. Fishes 2023, 8, 568. [Google Scholar] [CrossRef]
- Premachandra, H.K.A.; Becker, A.; Taylor, M.D.; Knibb, W. Eastern King Prawn (Penaeus plebejus) Stock Enhancement—Genetic Evidence That Hatchery-Bred Prawns Have Survived in the Wild After Release. Front. Genet. 2022, 13, 975174. [Google Scholar] [CrossRef]
- Zhang, Y.W.; Pan, X.F.; Wang, X.A.; Fan, W.; Yang, J.X. Restocking of Anabarilius grahami in Lake Fuxian, Southwest China: Morphological and Genetic Effects. Zool. Res. 2020, 41, 741–747. [Google Scholar] [CrossRef]
- An, H.-S.; Hong, S.-W.; Lee, J.-U.; Park, J.-Y.; Kim, K.-K. Genetic diversity of wild and farmed black sea bream (Acanthopagrus schlegelii) populations in Jeju. Anim. Cells Syst. 2010, 14, 37–44. [Google Scholar] [CrossRef]
- Bohonak, A.J. Dispersal, Gene Flow, and Population Structure. Q. Rev. Biol. 1999, 74, 21–45. [Google Scholar] [CrossRef]
- Wei, X.; Fu, Z.; Li, J.; Ye, Y. Genetic Diversity and Structure Revealed by Genomic Microsatellite Markers of Mytilus unguiculatus in the Coast of China Sea. Animals 2023, 13, 1609. [Google Scholar] [CrossRef]
- Li, X.; Gao, S.; Zhao, M.; Zhang, Y.; Liu, Y. SSR Marker-Based Genetic Resource Assessment of the Rainbow Clam Moerella iridescens along the Coasts of China: Implications for Strategy of Conservation Management. Front. Mar. Sci. 2022, 9, 843312. [Google Scholar] [CrossRef]
- Shan, B.; Liu, Y.; Song, N.; Ji, D.; Yang, C.; Zhao, Y.; Gao, T.; Sun, D. Genetic Diversity and Population Structure of Black Sea Bream (Acanthopagrus schlegelii) Based on Mitochondrial Control Region Sequences: The Genetic Effect of Stock Enhancement. Reg. Stud. Mar. Sci. 2020, 35, 101188. [Google Scholar] [CrossRef]
- Hsu, T.-H.; Huang, C.-W.; Lin, C.-H.; Lee, H.-T.; Pan, C.-Y. Tracing the Origin of Fish without Hatchery Information: Genetic Management of Stock Enhancement for Mangrove Red Snapper (Lutjanus argentimaculatus) in Taiwan. Fish. Aquat. Sci. 2020, 23, 13. [Google Scholar] [CrossRef]
- Gonzalez, E.B.; Taniguchi, N.; Umino, T. Can Ordinary Single-Day Egg Collection Increase the Effective Population Size in Broodstock Management Programs? Breeder-Offspring Assignment in Black Sea Bream (Acanthopagrus schlegelii) through Two-Hourly Intervals. Aquaculture 2010, 308, 12–19. [Google Scholar] [CrossRef]
- Wang, W.; Cui, Y.; Jiang, L.; Wang, Y.; Wang, H.; Li, H. Estimation of Effective Population Size of Cynoglossus semilaevis. J. Fish. China 2019, 43, 997–1004. (In Chinese) [Google Scholar]
Disclaimer/Publisher’s Note: The statements, opinions and data contained in all publications are solely those of the individual author(s) and contributor(s) and not of MDPI and/or the editor(s). MDPI and/or the editor(s) disclaim responsibility for any injury to people or property resulting from any ideas, methods, instructions or products referred to in the content. |
© 2025 by the authors. Licensee MDPI, Basel, Switzerland. This article is an open access article distributed under the terms and conditions of the Creative Commons Attribution (CC BY) license (https://creativecommons.org/licenses/by/4.0/).