Article

Biodiversity Assessment of Syrphid Flies (Diptera: Syrphidae) Within China

College of Biological Resource and Food Engineering, Qujing Normal University, Qujing 655011, China
*
Authors to whom correspondence should be addressed.
Diversity 2025, 17(7), 471; https://doi.org/10.3390/d17070471
Submission received: 28 May 2025 / Revised: 3 July 2025 / Accepted: 5 July 2025 / Published: 8 July 2025

Abstract

Syrphid flies (Syrphidae) are among the most significant groups of insect pollinators with approximately 6300 described species worldwide. Within China, more than 15% species have been reported but their diversity and distribution pattern are not well understood. Based on recent collections and published literature records, this study aimed to assess the species diversity, richness, evenness, and distribution pattern of Syrphidae in China. Biodiversity was measured using various indices such as Simpson’s diversity index, the Shannon–Wiener diversity index, Simpson’s reciprocal index, the Shannon equitability index, and the Margalef index. The results indicated that most of the indices showed highest values within Sichuan, Shaanxi, Yunnan, Taiwan, Tibet, and Gansu provinces. However, the lowest values of most of these indices were seen in Tianjin, Chongqing, and Hongkong. The ranges of these values were 0.69–5.55, 0.67–1.00, and 1.44–46.26 for the Shannon–Wiener index, Simpson’s index, and the Margalef index, respectively. Based on UMAP (Uniform Manifold Approximation and Projection) clustering approaches, all provinces of China were divided into two groups where group 1 showed 16 provinces having similar values to each other in a UMAP1 and UMAP2 plot, whereas 17 provinces were categorized into group 2. This clustering was further refined by a hierarchical clustering dendrogram where group 2 was further refined into two subgroups, where three provinces were separated into one small group including Hongkong, Chongqing, and Tianjin because of the lowest values of most of the indices. These results provide significant insights into the species richness and distribution of syrphid flies and inform strategies to help maintain these pollinators to support sustainable agriculture.

1. Introduction

Insects (class Insecta) are the largest biological group, with over one million described species worldwide [1]. The diversifications of insects are responsible for their central positions in ecosystems, such as bioindicators [2], pollinators [3,4], decomposers [5], etc. China, with its vast geographical area and a high proportion of montane areas, has wide biodiversity resources [6]. In general, biodiversity in China is far more than that in other countries with similar latitude [7].
Syrphidae, commonly known as flower flies or hoverflies, are the most abundant family of the insect order Diptera, with around 6300 known species worldwide in 209 genera [8,9]. The family is separated into four subfamilies and 15 tribes [10]. To date, 964 species of Syrphidae in 120 genera from China have been reported [11,12]. There are several characteristics of these flies which make them conspicuous and easy to distinguish from other insects, including their morphology, colour patterns, and way of flying [4,13]. Adults and larvae inhabit nearly all biome types, particularly parks, gardens, forests, meadows, and near human settlements [14]. Adult hoverflies utilize pollen, nectar, and honeydew as food resources [15] and are considered to be one of the most important flower-visiting insects in ecosystems [16]. Larval stage depicts diverse food specializations, including phytophagy, saprophagy, mycetophagy, zoophagy, and ant association [17,18]. These factors make hoverflies important pollinators as well as biological insect pest control agents, thus providing vital ecosystem services. They are also important for maintaining natural habitat biodiversity [14].
Species diversity is the principal functional unit of biodiversity, and species richness is a significant indication of this diversity [19]. Studying species diversity is crucial for understanding a community composition, maintaining its structure, and assuring its stability [20,21,22]. Greater diversity increases the resilience and stability of ecosystems [23,24]. Species diversity can be characterized as the variability of living organisms in habitats [25]. It can also be interpreted as diversity among species and within species of a certain ecosystem [26,27]. Insect diversity and abundance differ in geographic and temporal scales [28]. Diversity indices are various indices used to measure the pattern of community structure, to infer information on species rarity and commonness, and to compare various habitat types and specific habitat [29,30]. The diversity indices that are most commonly applied include Simpson’s diversity index, the Shannon–Wiener diversity index, Simpson’s reciprocal index, the Shannon equitability index, and the Margalef index [3,25,31,32].
Records reveal that the richness and abundance of hoverflies are under threat with a decline due to climate change and human disturbance [8,33,34,35]. Knowledge of the patterns of biodiversity and their macro-scale drivers is critical for biodiversity assessment and conservation [36,37]. Although insects have a higher number of species than vertebrates or plants, relatively few studies have been performed to address the species richness pattern of insects [38]. Therefore, it is important to document and expand the distribution of hoverflies for ecological studies, conservation efforts, and biological control programs in both natural and agricultural ecosystems.

2. Materials and Methods

The distribution data were collected by visiting fields using yellow pan and Malaise traps on a monthly basis from 2019–2020 in Shangri-La Alpine Garden, 27°90′ N, 99°64′ E, Shangri-La city, Yunnan Province. This garden is located on the southeastern edge of the Qinghai–Tibet Plateau at elevations above 3200 m. It consists of rugged mountainous terrain with steep slopes and deep valleys. It also exhibits cold but temperate climates in alpine areas, with subtropical dry climates in valleys [39]. In order to identify the specimens, they were placed in ethyl acetate and then pinned. The identification of specimens was based on the literature [4,40,41,42]. For the data regarding other provinces, the literature was reviewed, and all the collection information was compiled [11,12,17,43,44]. After obtaining the species distribution and collection data, the species richness and diversity within each province were assessed.
Different biodiversity indices have been used to assess the biodiversity of species [3]. Each of these indices focuses on different aspects of biodiversity (Table 1).
The details of these indices are as follows:
(i) Species richness (R) was calculated using Shannon’s species richness index [45]. R is calculated using the following formula:
R = S
Here, R denotes Shannon’s species richness index and S is the number of species. In this index, R, the species count, is measured only without considering abundance and evenness. Communities with higher R values have a greater number of species.
(ii) The Shannon–Wiener diversity index (H′) measures species diversity by taking into account species richness within a community as well as species evenness. A higher value of H′ indicates a greater diversity, and a lower value indicates a lower diversity. A range of values exists between 0 and ln(S), where 0 indicates no diversity (i.e., only one species is present), and ln(S) symbolizes the theoretical maximum value of H′. H′ is calculated using the following formula [46]:
H = ( p i ln p i )
The Shannon–Wiener diversity index is represented by H′, ln is the natural logarithm, i is the relative to the total number of individuals, and pi represents the proportion of species individuals.
(iii) Simpson’s index (D) determines the likelihood that two individuals will belong to the same species based on their random selection. This index ranges from 0 to 1, with lower values indicating high diversity and higher values indicating low diversity. D is calculated using the following formula [49]:
D = i = 1 S ( n i N ) 2
In this equation, ni represents the number of species i among the total number of species N and S represents the number of individuals among the total number of species.
(iv) In a similar manner, Simpson’s reciprocal index is a form of Simpson’s index that measures the diversity of a community based on the presence of more diverse species. Simpson’s reciprocal index is calculated using the following formula:
S i m p s o n s   R e c i p r o c a l   I n d e x = 1 D
In this equation, D refers to Simpson’s index and greater values of Simpson’s reciprocal index indicate higher diversity.
(v) Margalef’s richness index (R′) measures species richness by examining how many specimens are collected for each species at each collection sites. This index is useful for comparing species abundance in those cases where sample sizes are different. R′ is calculated using the following formula [48]:
R = S 1 ln N
Here, R′ represents Margalef’s richness index, S represents the number of species observed, N represents the total number of individuals, and ln shows the natural logarithm. An increased value of R′ indicates that there were a greater number of species observed.
(vi) The Shannon equitability index (E) evaluates the proportion of individuals evenly distributed among species in a community. A distribution close to 0 indicates an uneven distribution, whereas a distribution close to 1 indicates a more even distribution among the species of a community. E is calculated using the following formula [47]:
E = H H m a x
In this equation, E is the Shannon equitability index, H′ is the Shannon–Wiener diversity index, and Hmax represents the maximum value of H′ that can be achieved when all species in a community have the same abundance.

3. Results

3.1. Species Richness of Hoverflies Throughout China

We collected 715 hoverfly specimens during the year 2019–2020 from Yunnan Province which were identified to the species level in the genera Betasyrphus Matsumura, 1917 (B. serarius), Chrysotoxum Meigen, 1803 (C. shirakii), Episyrphus Matsumura and Adachi, 1917 (E. cretensis), Eupeodes Osten-Sacken, 1877 (E. corollae), Helophilus Meigen, 1822 (H. continuus, H. pendulus, and H. virgatus), Neoascia Williston, 1887 (N. anassa), Pseudovolucella Shiraki, 1930 (P. mimica), Scaeva Fabricius, 1805 (S. lunata and S. pyrastri), Syrphus Fabricius, 1775 (S. ribesii, S. torvus, and S. vitripennis), Volucella Geoffroy, 1762 (V. inanoides), Xanthandrus Verrall, 1901 (X. talamaui), and Xylota Meigen, 1822 (X. segnis). Based on our results and the literature, 972 Syrphidae species are present in China. The majority of syrphid species were found in Sichuan (258 species) and Shaanxi (256 species), followed by Yunnan (183 species), Taiwan (173 species), Gansu (142 species), Tibet (142 species), Hebei (134 species), and Xinjiang (126 species) (Figure 1). We assessed the Land Use Land Cover (LULC) composition using MODIS LULC data and found that grassland areas ranged from 1.20% in Taiwan to 40% in Qinghai. Cropland areas varied between 0.81% in Inner Mongolia and 39% in Shandong, while urban areas ranged from a minimum of 0.16% in Inner Mongolia to a maximum 9% in Shanghai.

3.2. Biodiversity Indices

Table 2 summarizes biodiversity indices by region and indicates overall ecological diversity and species richness of sites across the study regions. Sichuan and Shaanxi are the most species-rich regions and each have over 250 Syrphidae species. The species richness is also high in Yunnan and Taiwan with over 170 species reported from each region. In contrast, Tianjin, Anhui, Chongqing, and Hong Kong have the lowest species richness with less than 20 species found in each region. The Shannon–Wiener index varied from 0.69 to 5.55, reflecting that a region with higher values is one with a higher diversity of species (Sichuan, Yunnan, Taiwan, Gansu, and Tibet). Margalef’s index shows the highest values were in Sichuan (46.28) and Shaanxi (45.99), emphasizing their species richness. Furthermore, all sites have high values of Simpson’s indexes (0.99–1.00) and Shannon equability indices (1.00), showing that all species are evenly distributed and none dominant. Overall, Table 2 suggest that regions like Sichuan, Shaanxi, and Yunnan are centers of biodiversity while areas such as Tianjin, Chongqing, and Hong Kong contain relatively fewer species.
The heatmap shows species similarity between sites, with low similarity (0) to high similarity (1) indicated with blue to red colors. Most off-diagonal values are in blue color; this suggests a generally low to moderate degree of similarity between sites. Clusters of high similarities are few and their values between 0.3 and 0.4 show some regional trends or shared species in these sites. Three provinces, Heilongjiang, Jilin, and Liaoning, have relatively high similarity to each other, and this may be driven by the same environment, or topographic proximity. Likewise, Jiangsu, Shanghai, and Zhejiang have relatively high similarity, forming another group. Hong Kong and Hainan share lower similarities with most other regions (Figure 2).

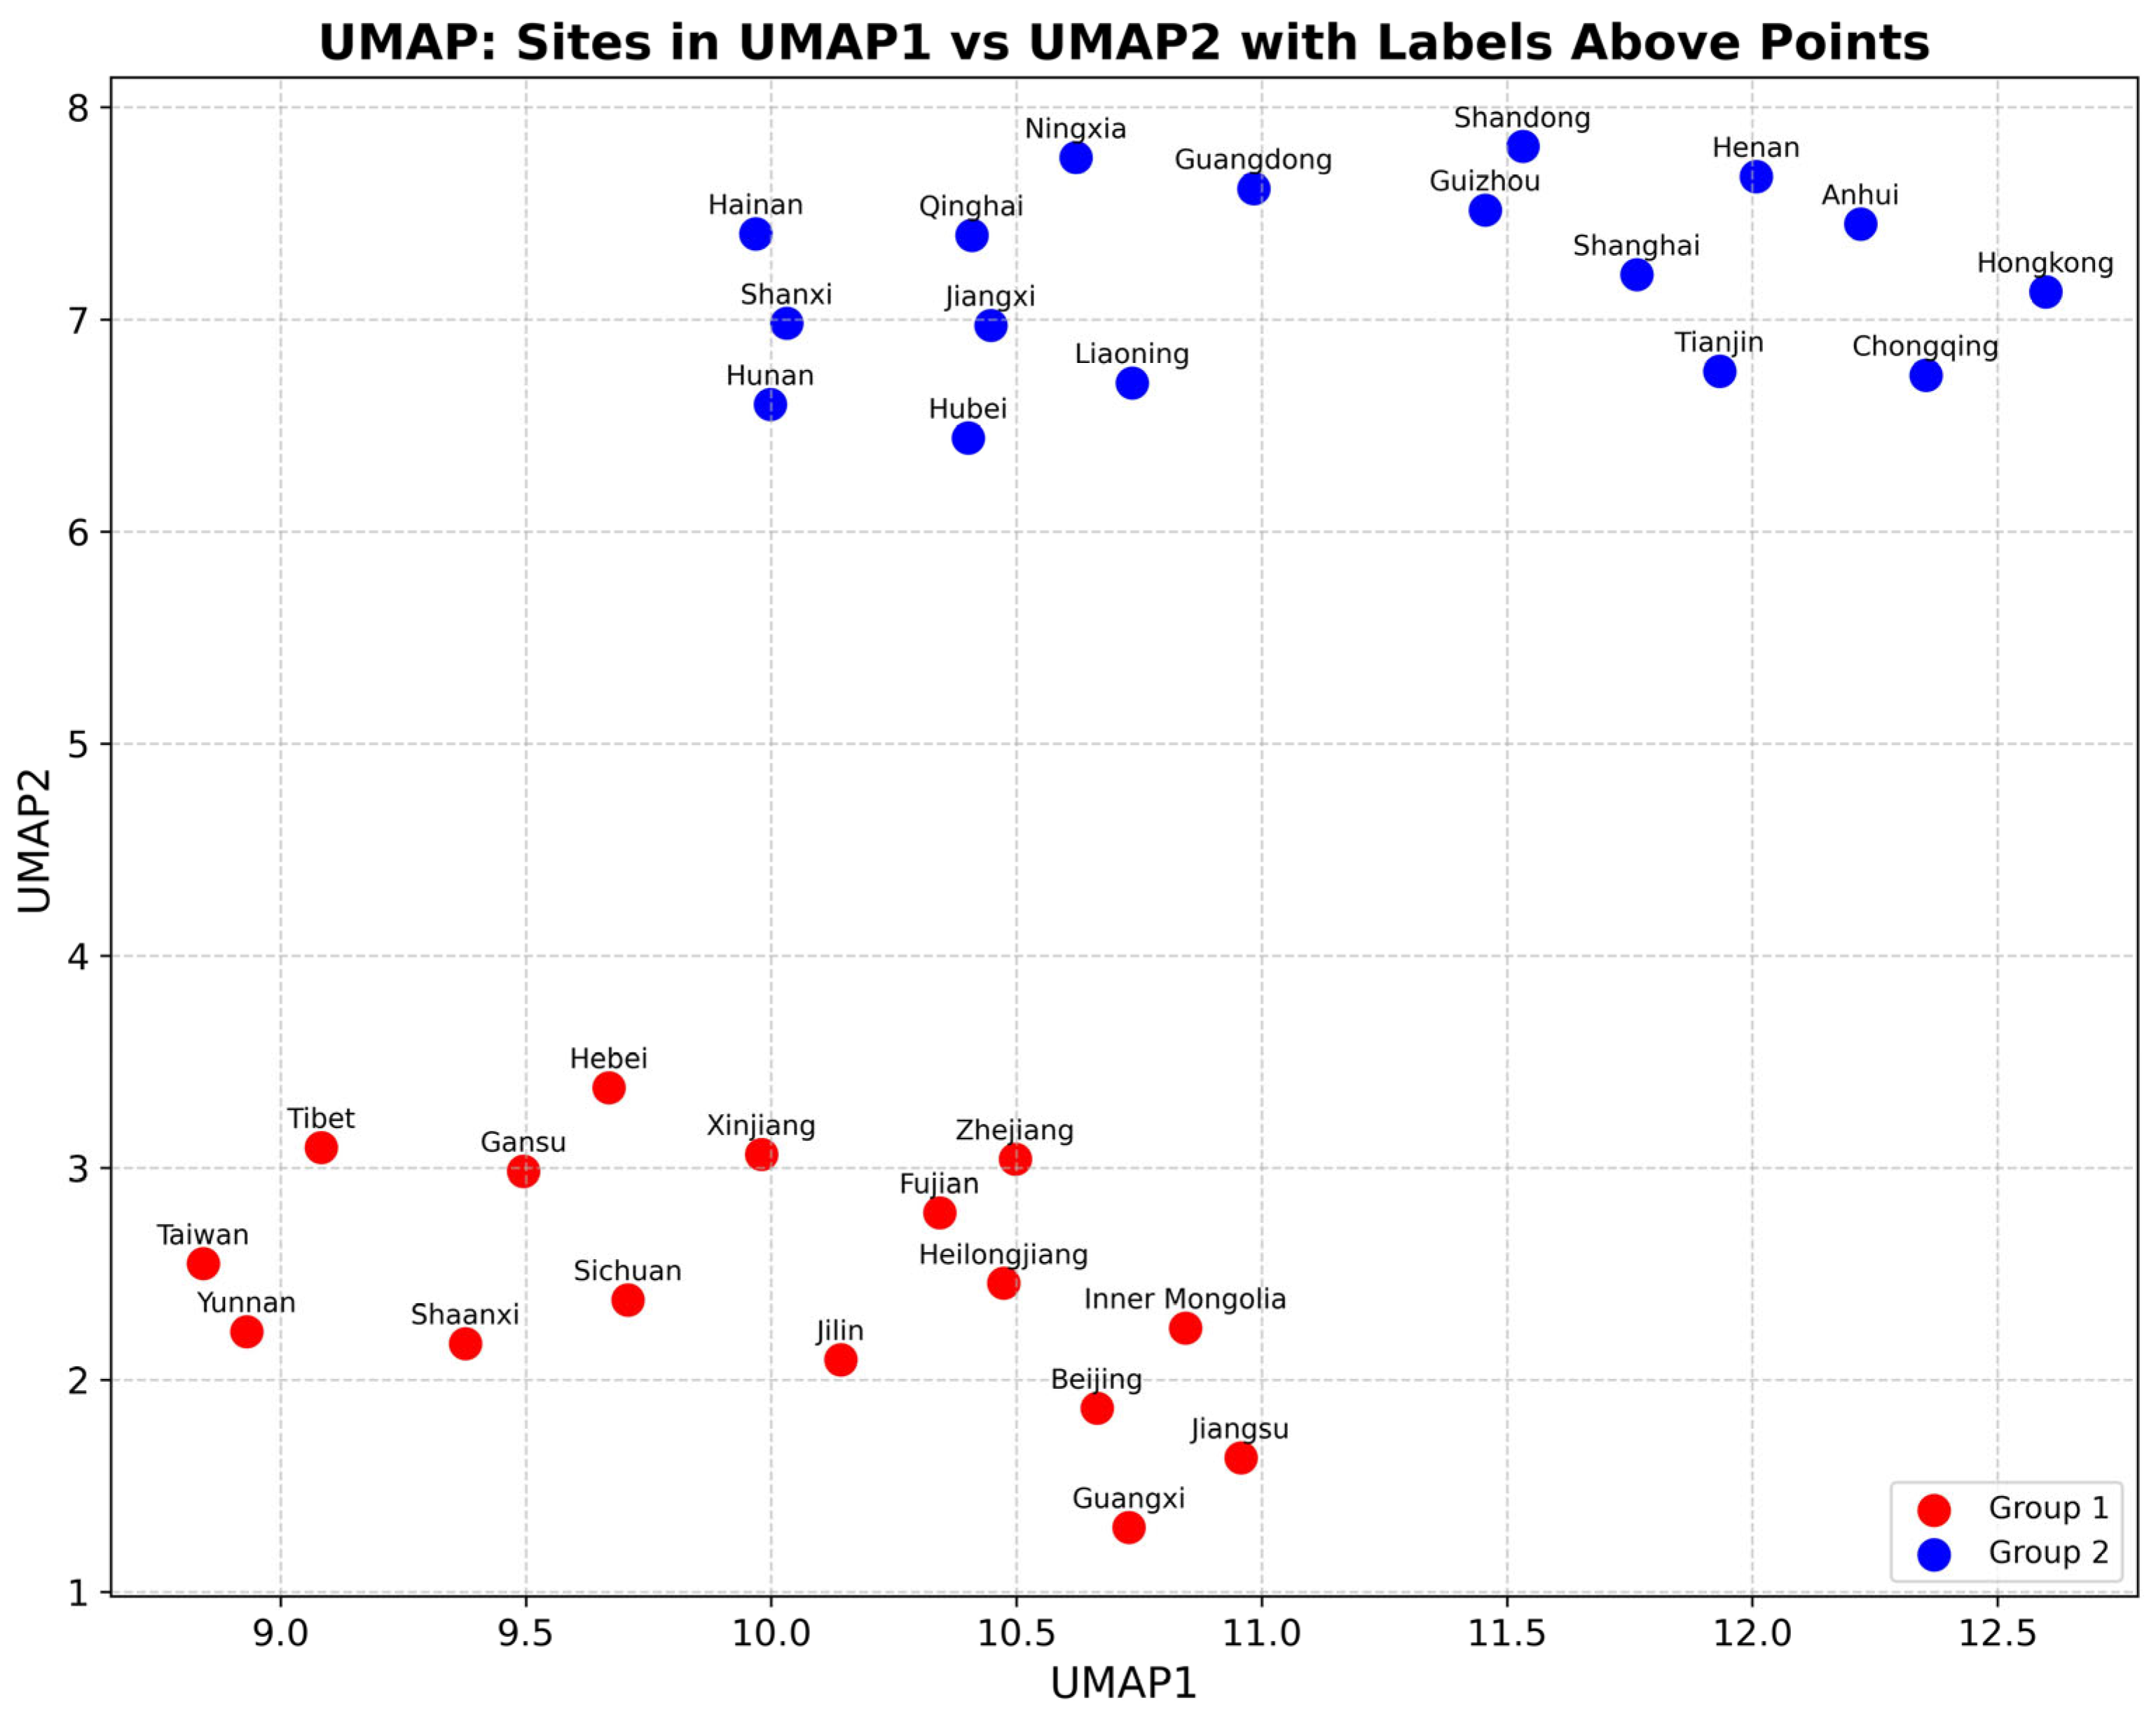
3.3. Habitat Clustering Based on UMAP Analysis

A UMAP (Uniform Manifold Approximation and Projection) analysis categorized the results into two groups indicated by red and blue markers. The UMAP space contains group 1 (red markers) in the lower area (UMAP1 = 9–11, UMAP 2 = 1–4). A distinct cluster is formed in the lower section by regions such as Tibet, Gansu, Xinjiang, Zhejiang, Beijing, and Jiangsu. The UMAP space contains group 2 (blue markers) in the upper area (UMAP1 = 9–12, UMAP 2 = 6–8). This group includes Shandong, Henan, Guangdong, Shanghai, and Hong Kong, which forms a separate cluster. Each group can clearly be distinguished from the other, with minimal overlap (Figure 3).

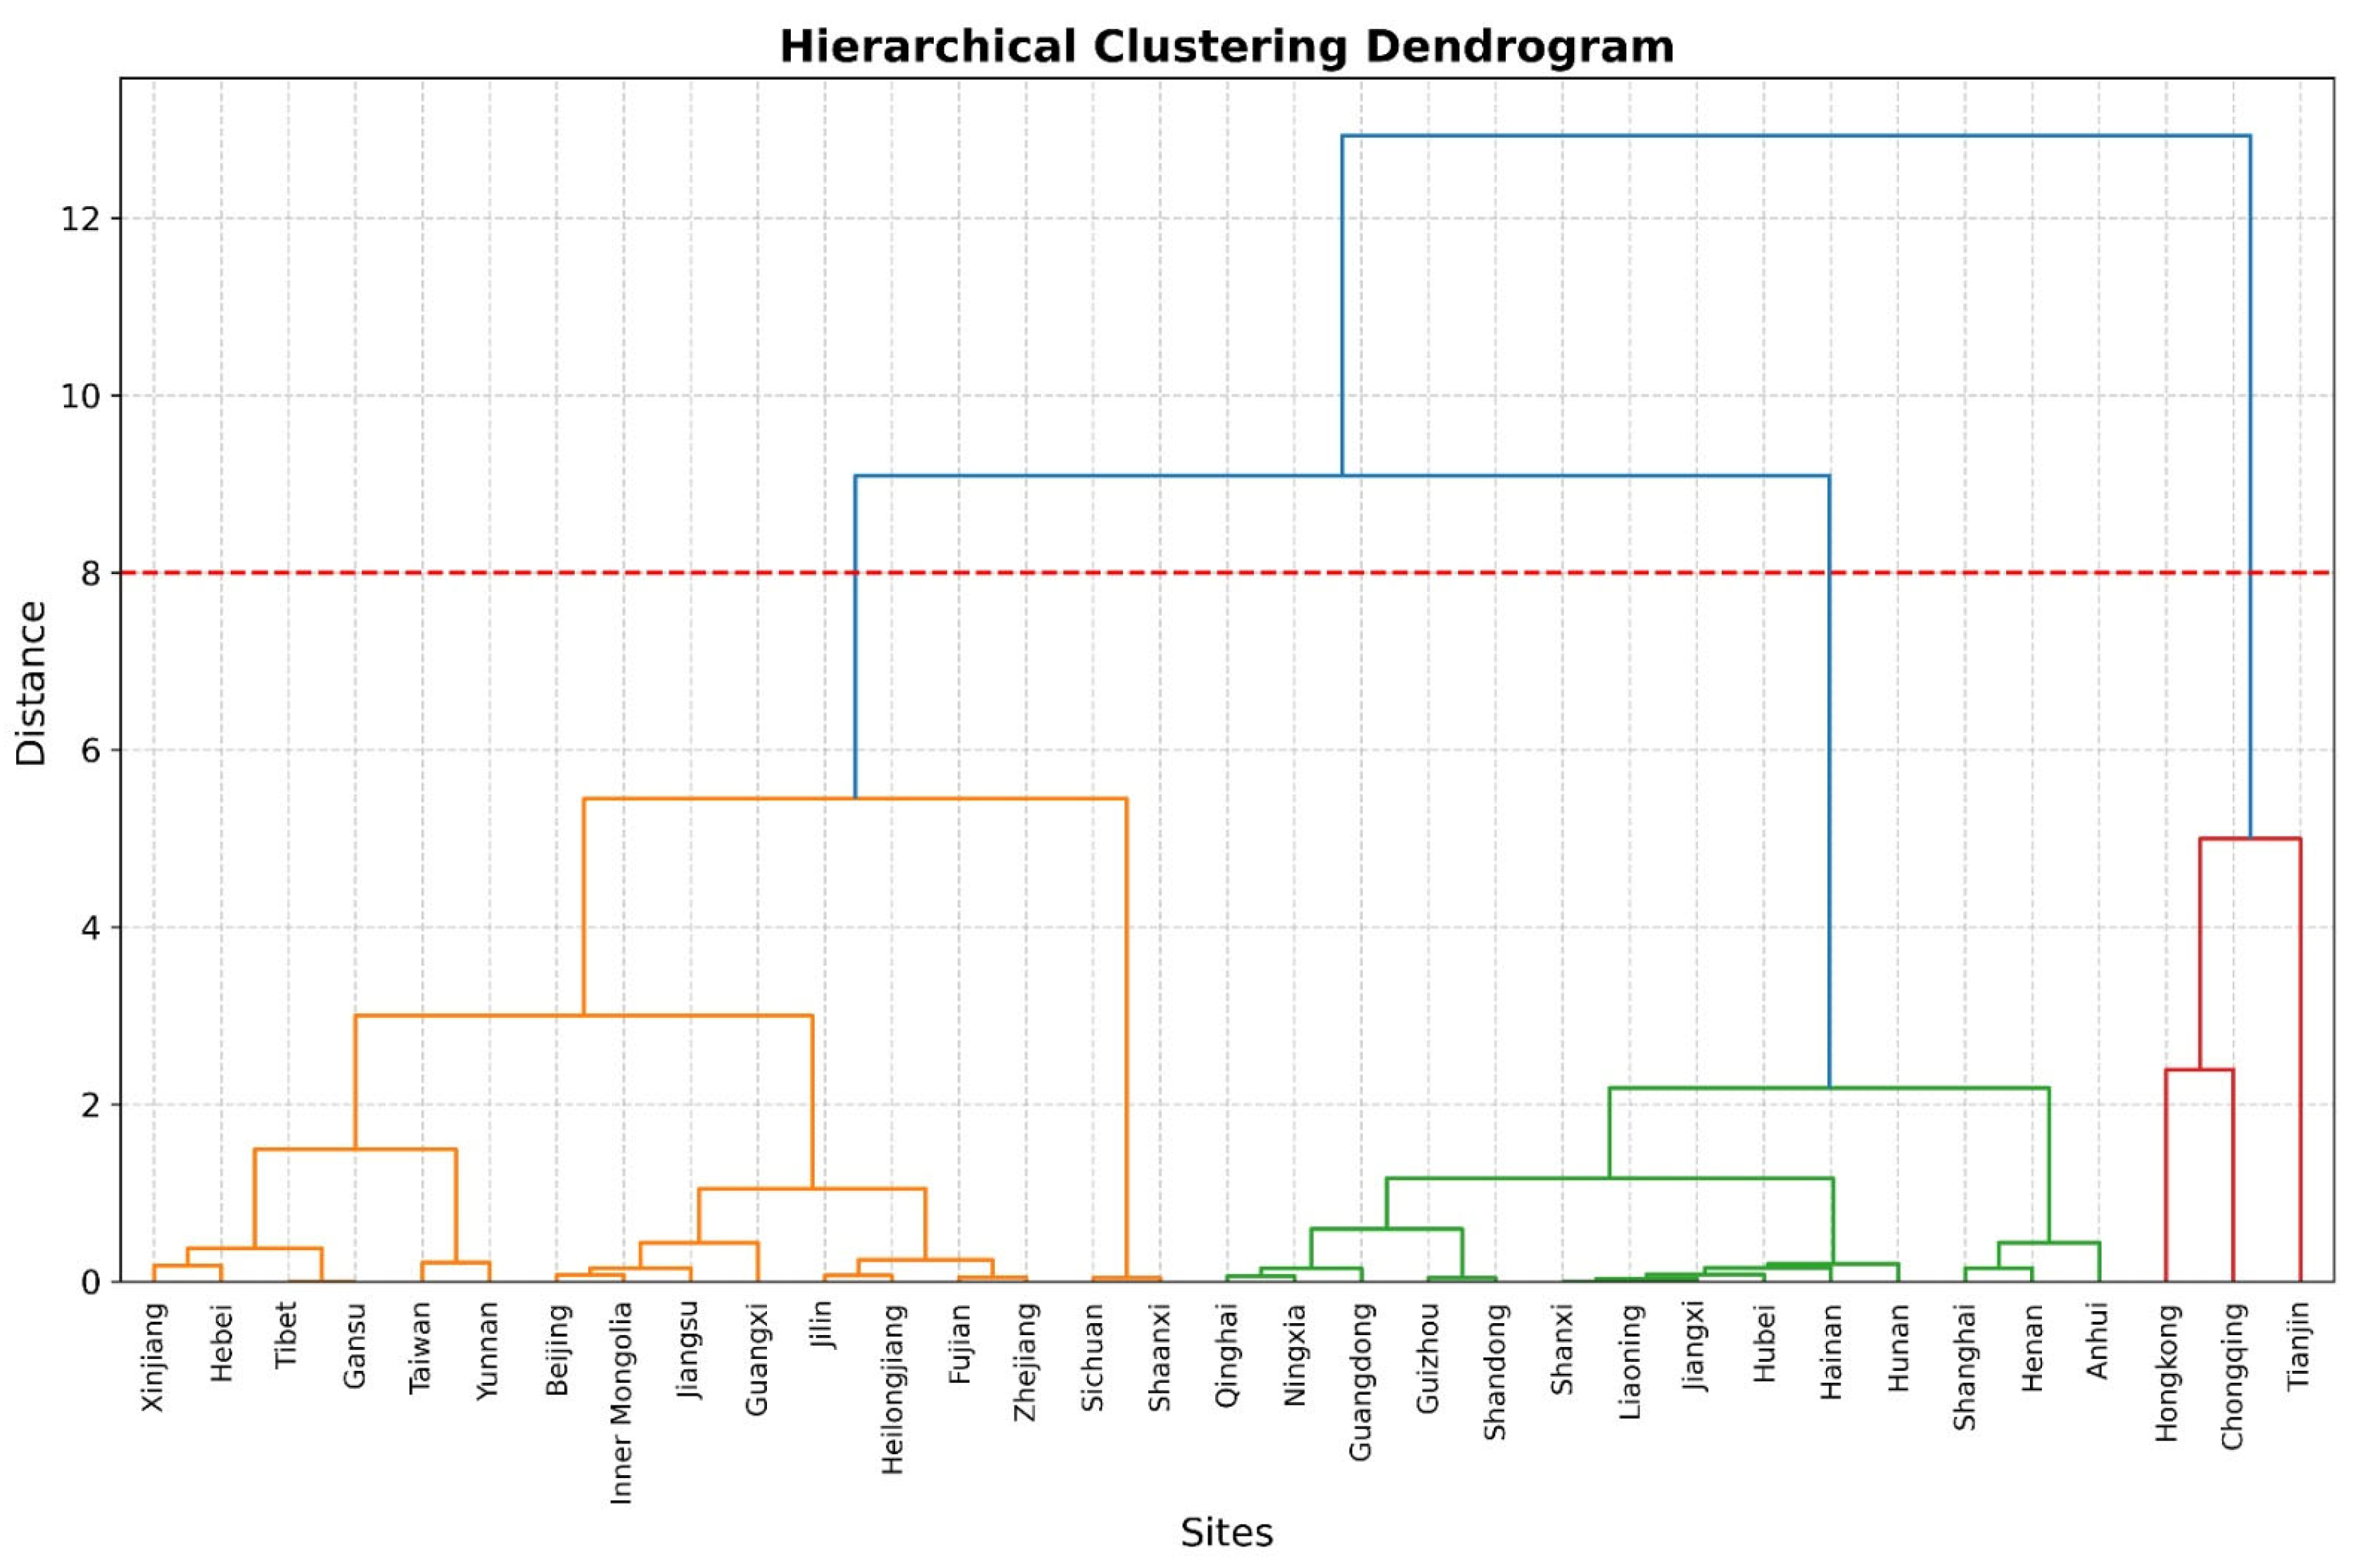
3.4. Hierarchical Habitat Clustering

The dendrogram produced through hierarchical clustering represents the clustering structure based on site similarities. The dendrogram reveals three main clusters, each with distinct branch colors (orange, green, and red), representing different groups of sites that exhibit varying levels of clustering. Clade A includes sites such as Xinjiang, Hebei, Tibet, Gansu, Yunnan, and Taiwan, indicating high similarity between these regions. For clade B, the sites include Qinghai, Ningxia, Guangdong, and Guizhou, reflecting these regions being quite similar to each other. Clade C highlights that Tianjin, Chongqing, and Hong Kong are closely related sites in the same cluster (Figure 4).

4. Discussion

In this study, multiple diversity indices were used to assess the biodiversity and community structure of syrphid flies across China. As relying on a single index can lead to overlooking of a key ecological dynamic, all five indices were employed here for this study (Table 1). Based on the values of these indices, two provinces, Sichuan and Shaanxi, showed the highest richness and diversity indices, indicating well-balanced and stable communities in these provinces. In contrast, three areas, Tianjin, Chongqing, and Hong Kong, showed lower richness and diversity, which suggest the potential ecological limitations or sampling gaps within these regions. However, a perfect evenness of species was found in all those provinces because of the value equal to 1 for all provinces. Thus, our results show the hotspot regions and support the known conservation hotspot regions.
Based on the Syrphidae collection and literature, significant diversity was observed in China. As determined by the Shannon–Wiener diversity index, Simpson’s reciprocal index, and the Margalef index, Sichuan, Shaanxi, Yunnan, Taiwan, Tibet, and Gansu exhibited the highest level of richness, diversity, and equitable distribution. However, Tianjin, Chongqing, Hong Kong, Anhui, Henan, and Shanghai showed lower values for these indices. Previous studies have found similar results to ours such as that species diversity is rich in Taiwan (scale insects, thrips, and cixiid species) [50,51,52] and Yunnan (Sphecids wasps, lac insects, and thrips) [52,53,54].
China is identified as an important hotspot region for hoverflies because of the presence of 972 species in 120 genera in both the Palearctic and Oriental regions. Taxonomically and ecologically important genera have been identified, such as Volucella, Helophilus, Chrysotoxum, Eupeodes, Syrphus, etc. [55]. Elevated species richness in Sichuan (258) and Shaanxi (256) also relates to the complex topography, transitional climatic conditions, and diverse vegetation zones providing various microhabitats in these provinces [56,57]. Diversity was also high in southern and south-western areas including Yunnan and Taiwan, presumably due to their subtropical climates and rich floras. Notably, our results are consistent with previous reports demonstrating that montane and subtropical regions are regions of high hoverfly diversity owing to environmental heterogeneity and continuity of habitat [58]. In addition to contributing to the national checklist of Syrphidae, the compiled dataset highlights the necessity of conservation efforts targeting biodiversity hotspots, particularly in provinces such as Sichuan, Shaanxi, and Yunnan.
UMAP analysis showed the biogeographic patterns of the Syrphidae distribution in different regions of China (Figure 3). The close proximity of provinces within the space of UMAP showed that the species distribution in these provinces are similar possibly due to the shared continental climate [59]. Such separations between the provinces in the UMAP space as group 1 (bottom of the plot) and group 2 (top of the space of the UMAP space) (Figure 3) demonstrate the importance of biogeographical gradients in controlling species richness and community composition [59,60]. This same pattern is further supported in Table 2, where even high Margalef and Shannon–Wiener indices reveal exceptional species richness in Sichuan, Shaanxi, and Yunnan as biodiversity hotspots potentially caused by complex topography and ecological heterogeneity [61]. Meanwhile, the diversity is much lower in Tianjin, Chongqing, and Hong Kong, which could be caused by urbanization and habitat fragmentation. Simpson′s and Shannon equability indices were consistently high within each individual region, indicative of a balanced community structure where species are evenly distributed and no single species dominates (a common pattern of mature ecosystems [53]. The species richness we found was significantly lower than that in other even temperate and tropical areas [29,30,54]. These results (i) highlight the role of regional ecological characteristics in the assembly of insect assemblages, and (ii) justify prioritizing conservation in high-diversity interior provinces.
There are significant differences in insect diversity across regions, primarily due to differences in climatic conditions, resource availability, and habitat complexity, with precipitation, temperature, and plant diversity playing a vital role in shaping insect communities [62]. There are a variety of ecological niches that are based on the biotic and abiotic features [63]. Because of these characteristics, ecosystems with stable environment conditions and complex vegetative structures usually have a greater insect diversity than other types of ecosystems [64]. Greater diversity of Syrphidae significantly contributes to the environment and agriculture primarily through enhanced pollination services and biological pest control [65]. A more diverse syrphid community ensures more robust and stable ecosystem functions, leading to better crop yields and reduced reliance on chemical pesticides. Understanding the distribution patterns of syrphid flies is essential for future management, as it allows the identification of optimal sites for habitat restoration and conservation.

5. Conclusions

This study provides an overview of the biodiversity pattern of Syrphidae species in China. By combining data gained through field surveys, records from the literature, as well as multivariate analysis, all biodiversity assessments of this fauna were explored. One thousand species from 120 genera were used to perform various biodiversity determinations (Shannon–Wiener, Simpson’s, Margalef’s, and equitability) which indicated Sichuan, Shaanxi, and Yunnan regions are important syrphid diversity hotspots with high species richness and evenness. The UMAP clustering separately defined the two main ecological groups based on geographic and environmental differences among the regions. For example, hierarchical clustering and heatmap analyses further accentuated regional similarities, whereby the provinces with similar topography (e.g., Heilongjiang, Jilin, and Liaoning in the northeast; Jiangsu, Zhejiang, and Shanghai in the east) were closely clustered together. On the other hand, we observed extremely low species richness and biodiversity in areas like Tianjin, Chongqing, and Hong Kong, which could be attributed to the urbanization or lack of habitats. This study highlights the outstanding importance of mountains and subtropical areas for hoverfly diversity and sets a geographic benchmark for future management, biodiversity monitoring, and pollinator biogeographical studies in China.

Author Contributions

Conceptualization, N.H.B. and H.C.; methodology, M.N. and L.M.; software, M.N.; validation, N.H.B., M.N. and H.C.; formal analysis, M.N. and L.M.; investigation, H.C. and L.M.; resources, H.C.; data curation, N.H.B. and L.M.; writing—original draft preparation, N.H.B. and M.N.; writing—review and editing, H.C.; visualization, H.C.; supervision, H.C.; project administration, H.C.; funding acquisition, H.C. All authors have read and agreed to the published version of the manuscript.

Funding

This research was funded by the National Foreign Experts Individual Category Program (Grant No. Y20240138), the High-Level Talent Recruitment Plan of Yunnan Province (‘High-End Foreign Experts’ Program), the Yunnan Provincial Department of Science and Technology “Yunnan Talent Program” Plan (Grant No. 202403AM140021), the Canping Pan Academician Workstation in Yunnan Province (Grant No. 202505AF350086), and the Program for Innovative Research Team in Qujing Normal University.

Institutional Review Board Statement

Not applicable.

Data Availability Statement

All the data generated or analyzed during this study are included in this published article.

Acknowledgments

The authors are grateful to Shahzad Munir (Yunnan Agricultural University, Yunnan, China) for his comments on our manuscript.

Conflicts of Interest

The authors declare no conflicts of interest.

References

  1. Liu, T.; Liu, H.; Yang, Y. Uncovering the determinants of biodiversity hotspots in China: Evidence from the drivers of multiple diversity metrics on insect assemblages and implications for conservation. Sci. Total Environ. 2023, 880, 163287. [Google Scholar] [CrossRef]
  2. Chowdhury, S.; Dubey, V.K.; Choudhury, S.; Das, A.; Jeengar, D.; Sujatha, B.; Kumar, A.; Kumar, N.; Semwal, A.; Kumar, V. Insects as bioindicator: A hidden gem for environmental monitoring. Front. Environ. Sci. 2023, 11, 1146052. [Google Scholar] [CrossRef]
  3. Aslam, S.; Naeem, M.; Hussain, S.; Riasat, M.; Rafi, M.A.; Zia, A.; Rafique, M.K.; Bashir, N.H.; Chen, H. Biodiversity of Non-Apis Bees (Hymenoptera: Apoidea) in the Potohar Region of Pakistan. Diversity 2024, 17, 4. [Google Scholar] [CrossRef]
  4. Rego, C.; Smit, J.; Aguiar, A.; Cravo, D.; Penado, A.; Boieiro, M. A pictorial key for identification of the hoverflies (Diptera: Syrphidae) of the Madeira Archipelago. Biodivers. Data J. 2022, 10, e78518. [Google Scholar] [CrossRef]
  5. Redak, R. Introduction to and Importance of Insects. In Forest Entomology and Pathology: Volume 1: Entomology; Springer International Publishing: Cham, Switzerland, 2023; pp. 1–17. [Google Scholar]
  6. Du, C.; Chen, J.; Jiang, L.; Qiao, G. High correlation of species diversity patterns between specialist herbivorous insects and their specific hosts. J. Biogeogr. 2020, 47, 1232–1245. [Google Scholar] [CrossRef]
  7. Mi, X.; Feng, G.; Hu, Y.; Zhang, J.; Chen, L.; Corlett, R.T.; Hughes, A.C.; Pimm, S.; Schmid, B.; Shi, S. The global significance of biodiversity science in China: An overview. Natl. Sci. Rev. 2021, 8, nwab032. [Google Scholar] [CrossRef]
  8. Mohammadi-Khoramabadi, A.; Dousti, A.F.; Gharaei, B. Diversity of Hoverflies (Diptera, Syrphidae) in Darab damask rose rain-fed plain, Fars province, Iran. J. Entomol. Soc. Iran 2024, 44, 279–290. [Google Scholar] [CrossRef]
  9. Sai Teja, K.S.; Ganiger, P. Wasp mimicking Monoceromyia eumenioides (Saunders, 1842) (Diptera: Syrphidae) visiting flowers of the tropical tree plant, Bridelia retusa (L.) A. Juss. from India. Orient. Insects 2023, 57, 421–431. [Google Scholar] [CrossRef]
  10. Young, A.D.; Lemmon, A.R.; Skevington, J.H.; Mengual, X.; Ståhls, G.; Reemer, M.; Jordaens, K.; Kelso, S.; Lemmon, E.M.; Hauser, M. Anchored enrichment dataset for true flies (order Diptera) reveals insights into the phylogeny of flower flies (family Syrphidae). BMC Evol. Biol. 2016, 16, 143. [Google Scholar] [CrossRef]
  11. Huo, K.-K.; Zhao, L.; Mengual, X.; Li, G.; Liu, X.; Zhao, L.-J.; Chen, Z.-N. Biema Huo & Zhao gen. nov., a new flower fly genus (Diptera, Syrphidae) from China. Eur. J. Taxon. 2022, 852, 98–116. [Google Scholar]
  12. Huo, K.K. Syrphidae. In Species Catalogue of China. Volume 2. Animals. Insecta. Diptera (3). Cyclorrhaphous Brachycera (i); Science Press: Beijing, China, 2020; pp. 30–181. [Google Scholar]
  13. Ball, S.; Morris, R. Britain’s Hoverflies: A Field Guide; Princeton University Press: Princeton, NJ, USA, 2015. [Google Scholar]
  14. Babošová, M.; Ivanič Porhajašová, J. The diversity, spatial structure, and significance of the Syrphidae population in the territory of the Listové Lake Nature Reserve. J. Cent. Eur. Agric. 2024, 25, 1014–1023. [Google Scholar] [CrossRef]
  15. Doyle, T.; Hawkes, W.L.; Massy, R.; Powney, G.D.; Menz, M.H.; Wotton, K.R. Pollination by hoverflies in the Anthropocene. Proc. R. Soc. B Biol. Sci. 2020, 287, 20200508. [Google Scholar] [CrossRef]
  16. Mitra, B. Diversity of flower-visiting flies (Insecta: Diptera) in India and their role in pollination. Rec. Zool. Surv. India 2010, 110, 95–107. [Google Scholar] [CrossRef]
  17. Mengual, X. New Flower Fly Records (Diptera: Syrphidae: Syrphinae) from China, Korea, and Malaysia. Proc. Entomol. Soc. Wash. 2022, 124, 302–315. [Google Scholar] [CrossRef]
  18. Speight, M.C.; Lebard, T. Chrysogaster coerulea Strobl in Czerny & Strobl, 1909, espèce nouvelle pour la France (Diptera: Syrphidae). Rev. Fr. Ent. Gén. 2022, 4, 176–183. [Google Scholar]
  19. Niu, Y.; Ren, G. Patterns of Species Richness and Its Endemism of Beetles in the Beijing–Tianjin–Hebei Region of China. Diversity 2024, 16, 496. [Google Scholar] [CrossRef]
  20. Levine, J.M.; HilleRisLambers, J. The importance of niches for the maintenance of species diversity. Nature 2009, 461, 254–257. [Google Scholar] [CrossRef]
  21. Sonne, J.; Rahbek, C. Idiosyncratic patterns of local species richness and turnover define global biodiversity hotspots. Proc. Natl. Acad. Sci. USA 2024, 121, e2313106121. [Google Scholar] [CrossRef]
  22. Arese Lucini, F.; Morone, F.; Tomassone, M.S.; Makse, H.A. Diversity increases the stability of ecosystems. PLoS ONE 2020, 15, e0228692. [Google Scholar] [CrossRef]
  23. van Klink, R.; Bowler, D.E.; Gongalsky, K.B.; Shen, M.; Swengel, S.R.; Chase, J.M. Disproportionate declines of formerly abundant species underlie insect loss. Nature 2024, 628, 359–364. [Google Scholar] [CrossRef]
  24. Li, Y.; Liu, Q.; Zhang, X.; Mao, B.; Yang, G.; Shi, F.; Bi, J.; Ma, Z.; Tang, G. Effects of Environmental Factors on the Diversity of Grasshopper Communities along Altitude Gradients in Xizang, China. Insects 2024, 15, 671. [Google Scholar] [CrossRef] [PubMed]
  25. Kumar, P.; Dobriyal, M.; Kale, A.; Pandey, A.; Tomar, R.; Thounaojam, E. Calculating forest species diversity with information-theory based indices using sentinel-2A sensor’s of Mahavir Swami Wildlife Sanctuary. PLoS ONE 2022, 17, e0268018. [Google Scholar] [CrossRef] [PubMed]
  26. Leinster, T.; Cobbold, C.A. Measuring diversity: The importance of species similarity. Ecology 2012, 93, 477–489. [Google Scholar] [CrossRef] [PubMed]
  27. Tomar, V.; Kumar, P.; Rani, M.; Gupta, G.; Singh, J. A satellite-based biodiversity dynamics capability in tropical forest. Electron. J. Geotech. Eng. 2013, 18, 1171–1180. [Google Scholar]
  28. Ahmad, Z.; Naeem, M.; Azad, R.; Hussain, I.; Bibi, R.; Zaman, M.; Akbar, R.; Zafeer, N.; Elgezouly, R.O.E.; Mustafa, G. Multivariate diversity analysis and systematics of hemipteran insects of family Reduviidae. J. King Saud Univ. Sci. 2022, 34, 101722. [Google Scholar] [CrossRef]
  29. Pavoine, S.; Bonsall, M.B. Measuring biodiversity to explain community assembly: A unified approach. Biol. Rev. 2011, 86, 792–812. [Google Scholar] [CrossRef]
  30. Mouchet, M.A.; Villéger, S.; Mason, N.W.; Mouillot, D. Functional diversity measures: An overview of their redundancy and their ability to discriminate community assembly rules. Funct. Ecol. 2010, 24, 867–876. [Google Scholar] [CrossRef]
  31. Bollarapu, M.J.; Ramarao, K. Biodiversity measures-mathematical evaluation of various indices. Oecon. Copernic. 2021, 12, 46–59. [Google Scholar]
  32. Thukral, A.K.; Bhardwaj, R.; Kumar, V.; Sharma, A. New indices regarding the dominance and diversity of communities, derived from sample variance and standard deviation. Heliyon 2019, 5, e02606. [Google Scholar] [CrossRef]
  33. Barendregt, A.; Zeegers, T.; van Steenis, W.; Jongejans, E. Forest hoverfly community collapse: Abundance and species richness drop over four decades. Insect Conserv. Divers. 2022, 15, 510–521. [Google Scholar] [CrossRef]
  34. Klymko, J.; Schlesinger, M.D.; Skevington, J.H.; Young, B.E. Low extinction risk in the flower fly fauna of northeastern North America. J. Insect Conserv. 2023, 27, 657–668. [Google Scholar] [CrossRef]
  35. Hailay Gebremariam, G. A Systematic Review of Insect Decline and Discovery: Trends, Drivers, and Conservation Strategies over the past Two Decades. Psyche J. Entomol. 2024, 2024, 5998962. [Google Scholar] [CrossRef]
  36. Sobral-Souza, T.; Santos, J.P.; Maldaner, M.E.; Lima-Ribeiro, M.S.; Ribeiro, M.C. EcoLand: A multiscale niche modelling framework to improve predictions on biodiversity and conservation. Perspect. Ecol. Conserv. 2021, 19, 362–368. [Google Scholar] [CrossRef]
  37. Zarnetske, P.L.; Read, Q.D.; Record, S.; Gaddis, K.D.; Pau, S.; Hobi, M.L.; Malone, S.L.; Costanza, J.M.; Dahlin, K.; Latimer, A.M. Towards connecting biodiversity and geodiversity across scales with satellite remote sensing. Glob. Ecol. Biogeogr. 2019, 28, 548–556. [Google Scholar] [CrossRef]
  38. Zhao, Z.; Feng, X.; Zhang, Y.; Wang, Y.; Zhou, Z.; Liu, T. Species richness and endemism patterns of Sternorrhyncha (Insecta, Hemiptera) in China. ZooKeys 2023, 1178, 279. [Google Scholar] [CrossRef]
  39. Zhu, H. Biogeography of Shangri-la flora in southwestern China. Phytotaxa 2015, 203, 231–244. [Google Scholar]
  40. Van Steenis, J.; Hippa, H.; Mutin, V.A. Revision of the oriental species of the genus Sphegina Meigen, 1822 (Diptera: Syrphidae). Eur. J. Taxon. 2018, 489, 1–198. [Google Scholar] [CrossRef]
  41. Speight, M. StN key for the identification of the genera of European Syrphidae. Syrph Net Database Eur. Syrphidae (Diptera) 2020, 105, 1–46. [Google Scholar]
  42. Van Veen, M. Hoverflies of Northwest Europe: Identification Keys to the Syrphidae; KNNV Publishing: Utrecht, The Netherlands, 2004; Volume 254, p. 256. [Google Scholar]
  43. Zhao, L.; Liu, X.; Smit, J.T.; LI, G.; Liu, H.; Dang, L.-h.; Huo, K. A new species of the genus Psilota Meigen, 1822 (Diptera: Syrphidae) from China. Zootaxa 2022, 5154, 225–238. [Google Scholar] [CrossRef]
  44. Tian, J.; Huo, K.; Zhang, C.-T.; Ren, B.-Z. Microdon dentigiganteum sp. nov. and other Microdontinae species (Diptera: Syrphidae) from Northeast China. Zootaxa 2019, 4712, 065–076. [Google Scholar] [CrossRef]
  45. DeJong, T.M. A comparison of three diversity indices based on their components of richness and evenness. Oikos 1975, 26, 222–227. [Google Scholar] [CrossRef]
  46. Krippendorff, K. Mathematical theory of communication. In Encyclopedia of Communication Theory; Sage: Los Angeles, CA, USA, 2009; pp. 614–618. [Google Scholar]
  47. Pielou, E.C. The measurement of diversity in different types of biological collections. J. Theor. Biol. 1966, 13, 131–144. [Google Scholar] [CrossRef]
  48. Ulanowicz, R.E. Information theory in ecology. Comput. Chem. 2001, 25, 393–399. [Google Scholar] [CrossRef] [PubMed]
  49. Roswell, M.; Dushoff, J.; Winfree, R. A conceptual guide to measuring species diversity. Oikos 2021, 130, 321–338. [Google Scholar] [CrossRef]
  50. Wei, J.; Niu, M.; Feng, J. Diversity and distribution patterns of scale insects in China. Ann. Entomol. Soc. Am. 2016, 109, 405–414. [Google Scholar] [CrossRef]
  51. Luo, Y.; Bourgoin, T.; Zhang, J.-L.; Feng, J.-N. Distribution patterns of Chinese Cixiidae (Hemiptera, Fulgoroidea), highlight their high endemic diversity. Biodivers. Data J. 2022, 10, e75303. [Google Scholar] [CrossRef]
  52. Mirab-balou, M. Thysanoptera (Insecta) of China: An updated checklist. J. Insect Biodivers. Syst. 2025, 11, 469–541. [Google Scholar] [CrossRef]
  53. Bashir, N.H.; Wang, W.; Liu, J.; Wang, W.; Chen, H. First record of the lac-producing species Kerria nepalensis Varshney (Hemiptera, Kerriidae) from China, with a key to Chinese species. ZooKeys 2021, 1061, 1–9. [Google Scholar] [CrossRef]
  54. Bashir, N.H.; Yue, D.; Jiang, H.; Ma, L.; Li, Q. Taxonomic study of the subtribe Pemphredonina Dahlbom, 1835 (Hymenoptera: Crabronidae) with a new species and six new records from China. J. Asia-Pac. Entomol. 2021, 24, 1055–1065. [Google Scholar] [CrossRef]
  55. Ricarte, A.; Nedeljković, Z.; Marcos-García, M.Á. An exploratory survey and assessment of the hoverfly diversity (Diptera: Syrphidae) from the Pyrenees of Girona, Spain. Rev. Suisse Zool. 2021, 128, 381–398. [Google Scholar] [CrossRef]
  56. Lu, S.; Zhou, S.; Yin, X.; Zhang, C.; Li, R.; Chen, J.; Ma, D.; Wang, Y.; Yu, Z.; Chen, Y. Patterns of tree species richness in Southwest China. Environ. Monit. Assess. 2021, 193, 97. [Google Scholar] [CrossRef] [PubMed]
  57. Li, W.; Shi, M.; Huang, Y.; Chen, K.; Sun, H.; Chen, J. Climatic change can influence species diversity patterns and potential habitats of Salicaceae plants in China. Forests 2019, 10, 220. [Google Scholar] [CrossRef]
  58. Schirmel, J.; Albrecht, M.; Bauer, P.M.; Sutter, L.; Pfister, S.C.; Entling, M.H. Landscape complexity promotes hoverflies across different types of semi-natural habitats in farmland. J. Appl. Ecol. 2018, 55, 1747–1758. [Google Scholar] [CrossRef]
  59. Lopez-Collado, J.; Jacinto-Padilla, J.; Rodríguez-Aguilar, O.; Hidalgo-Contreras, J. Bioclimatic similarity between species locations and their environment revealed by dimensionality reduction analysis. Ecol. Inform. 2024, 79, 102444. [Google Scholar] [CrossRef]
  60. Milošević, D.; Medeiros, A.S.; Piperac, M.S.; Cvijanović, D.; Soininen, J.; Milosavljević, A.; Predić, B. The application of Uniform Manifold Approximation and Projection (UMAP) for unconstrained ordination and classification of biological indicators in aquatic ecology. Sci. Total Environ. 2022, 815, 152365. [Google Scholar] [CrossRef]
  61. Li, C.; Qiao, W.; Gao, B.; Chen, Y. Unveiling spatial heterogeneity of ecosystem services and their drivers in varied landform types: Insights from the Sichuan-Yunnan ecological barrier area. J. Clean. Prod. 2024, 442, 141158. [Google Scholar] [CrossRef]
  62. Outhwaite, C.L.; McCann, P.; Newbold, T. Agriculture and climate change are reshaping insect biodiversity worldwide. Nature 2022, 605, 97–102. [Google Scholar] [CrossRef]
  63. González-Salazar, C.; Stephens, C.R.; Marquet, P.A. Comparing the relative contributions of biotic and abiotic factors as mediators of species’ distributions. Ecol. Modell. 2013, 248, 57–70. [Google Scholar] [CrossRef]
  64. Lewinsohn, T.M.; Novotny, V.; Basset, Y. Insects on plants: Diversity of herbivore assemblages revisited. Annu. Rev. Ecol. Evol. Syst. 2005, 36, 597–620. [Google Scholar] [CrossRef]
  65. Dunn, L.; Lequerica, M.; Reid, C.R.; Latty, T. Dual ecosystem services of syrphid flies (Diptera: Syrphidae): Pollinators and biological control agents. Pest Manag. Sci. 2020, 76, 1973–1979. [Google Scholar] [CrossRef]
Figure 1. Species richness of Syrphidae based on number of species records from China.
Diversity 17 00471 g001
Figure 2. Heatmap showing the relationship between different diversity indices used to measure Syrphidae species diversity in China.
Diversity 17 00471 g002
Figure 3. UMAP plot sites in UMAP1 and UMAP2 with clusters and enlarged boundaries of Syrphidae in China.
Diversity 17 00471 g003
Figure 4. Dendrogram resulting from the hierarchical clustering which shows the clustering structure based on site similarities.
Diversity 17 00471 g004
Table 1. Biodiversity indices used for assessing the biodiversity aspects of syrphid flies in China and their importance.
IndexFocusImportance
Shannon’s species richness index (R)RichnessIt simply counts the number of species [45]
Shannon–Wiener diversity index (H′)Richness and evennessIt gives a balanced overview of diversity [46]
Shannon equitability indexEvennessBased on evenness values, it gives a dominance comparison between the sites [47]
Margalef indexRichness vs. size of sampleIt focuses on biodiversity assessment while correcting the biasness present within the sample [48]
Simpson index (D)DominanceThis is sensitive to common species present between different sites [49]
Simpson reciprocal indexOverall biodiversityThis assesses the overall biodiversity which is easy to interpret [3]
Table 2. Biodiversity indices assessment for each province.
GroupSiteSpecies RichnessNo. of GeneraShannon–Wiener IndexSimpson’s IndexSimpson’s Reciprocal IndexMargalef’s IndexShannon Equitability Index
1Heilongjiang105434.650.991.0122.351
Jilin108404.680.991.0122.851
Inner Mongolia95384.550.991.0120.641
Hebei134534.900.991.0127.151
Beijing92464.520.991.0120.121
Shaanxi256685.551.001.0045.991
Gansu142554.960.991.0128.451
Xinjiang126444.840.991.0125.851
Jiangsu88424.480.991.0119.431
Zhejiang115494.740.991.0124.031
Sichuan258755.551.001.0046.281
Yunnan183655.210.991.0134.941
Tibet142504.960.991.0128.451
Fujian113494.730.991.0123.691
Taiwan173665.150.991.0133.381
Guangxi77374.340.991.0117.501
2Liaoning55324.010.981.0213.481
Tianjin220.690.502.001.441
Shanxi55354.010.981.0213.481
Shandong33223.500.971.039.151
Henan22163.090.951.056.791
Ningxia44243.780.981.0211.361
Qinghai46213.830.981.0211.751
Anhui17132.830.941.065.651
Shanghai25163.220.961.047.461
Jiangxi54333.990.981.0213.291
Hunan60304.090.981.0214.411
Hubei57354.040.981.0213.851
Chongqing321.100.671.501.821
Guizhou32213.470.971.038.941
Guangdong41253.710.981.0310.771
Hainan51233.930.981.0212.721
Hongkong631.790.831.202.791
Disclaimer/Publisher’s Note: The statements, opinions and data contained in all publications are solely those of the individual author(s) and contributor(s) and not of MDPI and/or the editor(s). MDPI and/or the editor(s) disclaim responsibility for any injury to people or property resulting from any ideas, methods, instructions or products referred to in the content.

