Article

Climate-Driven Range Shifts of the Endangered Cercidiphyllum japonicum in China: A MaxEnt Modeling Approach

1
Characteristic Forest Industry Development Research Center, Huangshan University, Huangshan 245041, China
2
College of Life Science, China West Normal University, Nanchong 637002, China
3
College of Life and Environmental Sciences, Huangshan University, Huangshan 245041, China
*
Authors to whom correspondence should be addressed.
These authors contributed equally to this work and should be regarded as co-first authors.
Diversity 2025, 17(7), 467; https://doi.org/10.3390/d17070467
Submission received: 27 May 2025 / Revised: 1 July 2025 / Accepted: 2 July 2025 / Published: 5 July 2025
(This article belongs to the Section Plant Diversity)

Abstract

The relict tree Cercidiphyllum japonicum, a Tertiary paleoendemic with significant ecological and timber value, prefers warm–cool humid climates and acidic soils. Using MaxEnt and ArcGIS, we modeled its distribution under current and future climate scenarios (SSP, Shared Socioeconomic Pathways). High-suitability areas (>0.6 probability) under current conditions are mainly concentrated in the Sichuan Basin and the Yellow–Yangtze transition zones. By 2050, projections show northwestward expansions (14.32–18.76% increase in area) and eastward movement toward Central China under both SSP1-2.6 and SSP5-8.5 scenarios. However, by 2090, habitat loss could exceed 22% under SSP5-8.5. The main environmental drivers of its distribution are minimum coldest-month temperature (bio6, 38.7%), annual precipitation (bio12, 29.1%), and temperature range (bio7, 18.5%). Precipitation seasonality and thermal extremes are expected to become more significant constraints in the future. Conservation strategies should focus on the following: (1) protecting refugia in the Daba–Wushan mountains, (2) facilitating assisted migration to northwestern high-latitude regions, and (3) preserving microclimates. This study offers a framework for evidence-based conservation of paleoendemic species under climate change.

1. Introduction

Cercidiphyllum japonicum, as a national second-class protected wild plant, belongs to the genus Cercidiphyllum Sieb.et Zucc., family Cercidiphyllaceae. Cercidiphyllaceae has only one genus and two species. “One genus” is Cercidiphyllum, and “two species” are Cercidiphyllum japonicum and Cercidiphyllum magnificum [1]. Among them, C. japonicum is a dioecious deciduous tree endemic to China. The height of the tree is generally 10~20 m. The shape of the tree is tall; the wood is excellent; and the shade tolerance is strong. The saplings tend to grow tall under low light conditions in the forest, while adult trees require certain light conditions. It is deep-rooted, wind-resistant, wet-resistant, slow-growing, and has few fruits. It is mostly grown in large valleys and low-humidity or hillside mixed forests at an altitude of 650~2700 m. It is distributed in Sichuan, Gansu, Shanxi, Hunan, Shaanxi, Henan, Anhui, and other provinces [2,3]. The distribution area is mostly located in areas with cold winter and cool summer, heavy rainfall, and high humidity. C. japonicum is endemic to China and does not naturally occur outside the country. Natural populations are sparse and scattered, often with low seed-setting rates, small seeds, poor germination, and few female individuals, making natural regeneration difficult. Therefore, in 1989, it was listed in the “China Rare and Endangered Protected Plants List”, and then in 1998, it was listed by the State Council as a national Class II key protected wild plant [4]. Cercidiphyllum japonicum species are precious and useful. The fruits and leaves of C. japonicum contain catechol, which can be used to treat convulsion diseases [2]. It is a large deciduous tree with fine wood structure, straight texture, and hard texture. It is an important precious timber tree species in the world. In addition, the leaves of C. japonicum are heart-shaped, with early germination, and late defoliation. The leaves show a variety of colors at different maturity stages. The color is gorgeous, and the tree posture is beautiful. It is a landscaping tree species with high ornamental value [5]. Given its limited distribution, ecological importance, and regeneration challenges, C. japonicum has high scientific and conservation value.
Currently, the species is threatened by habitat loss due to human activities such as logging, agricultural expansion, and infrastructure development. Its reproductive constraints, habitat fragmentation, and climate change further endanger its survival. Conservation measures include its legal protection under Chinese law, establishment of nature reserves, and ex situ conservation initiatives such as seed banks and botanical garden cultivation. In recent years, the potential distribution of species has become a research hotspot in various fields for the most studied vegetation population structure and dynamics [6,7,8]. From a large geographical perspective, climate is one of the main factors limiting the biogeographical range of species [9,10]. The common models of ecological niche modeling include BIOCLIM, DOMAIN, GARP, and MaxEnt [11]. The MaxEnt model is a Java-based species spatial distribution prediction platform developed by S. J. Philips et al. in 2004 [12,13]. The MaxEnt model, grounded in maximum entropy theory, analyzes species-environment systems by processing georeferenced occurrence data alongside regional environmental variables [14,15]. This approach quantifies habitat suitability in target regions while elucidating how environmental factors influence species’ spatial distribution patterns [16,17]. Compared with most other models, the MaxEnt model has stronger stability and higher prediction accuracy [18,19]. In addition, the MaxEnt model has been widely accepted in the world since it was proposed [20,21]. It also has the following advantages: (1) The software can be downloaded directly from the website, and the acquisition method is relatively simple; (2) the model can still predict with less data [4,22]; (3) model analysis requires only two sets of data: the latitude and longitude information of the distribution point and the environmental variables of the region. The data can be obtained directly from the relevant database, and the data information source is simple and reliable [23,24].
Most of the current studies on C. japonicum focused on the relationship between seedling regeneration and environment [25], spatial genetic structure of canopy trees [26], seed germination, genetic characteristics [27], population structure analysis in the region [28,29], and so on. However, few studies have explored its potential suitable habitat distribution under current environmental conditions. Given the sparse natural populations and scattered distribution of C. japonicum, this study aims to predict its potential suitable habitat in China using the MaxEnt model combined with GIS technology and to analyze the key environmental factors influencing its distribution. The main objectives of this study are as follows:
(1)
to predict the potential suitable distribution areas of C. japonicum in China;
(2)
to identify the key environmental factors affecting its distribution;
(3)
to provide theoretical support and scientific basis for the conservation, population restoration, and management of C. japonicum.

2. Materials and Methods

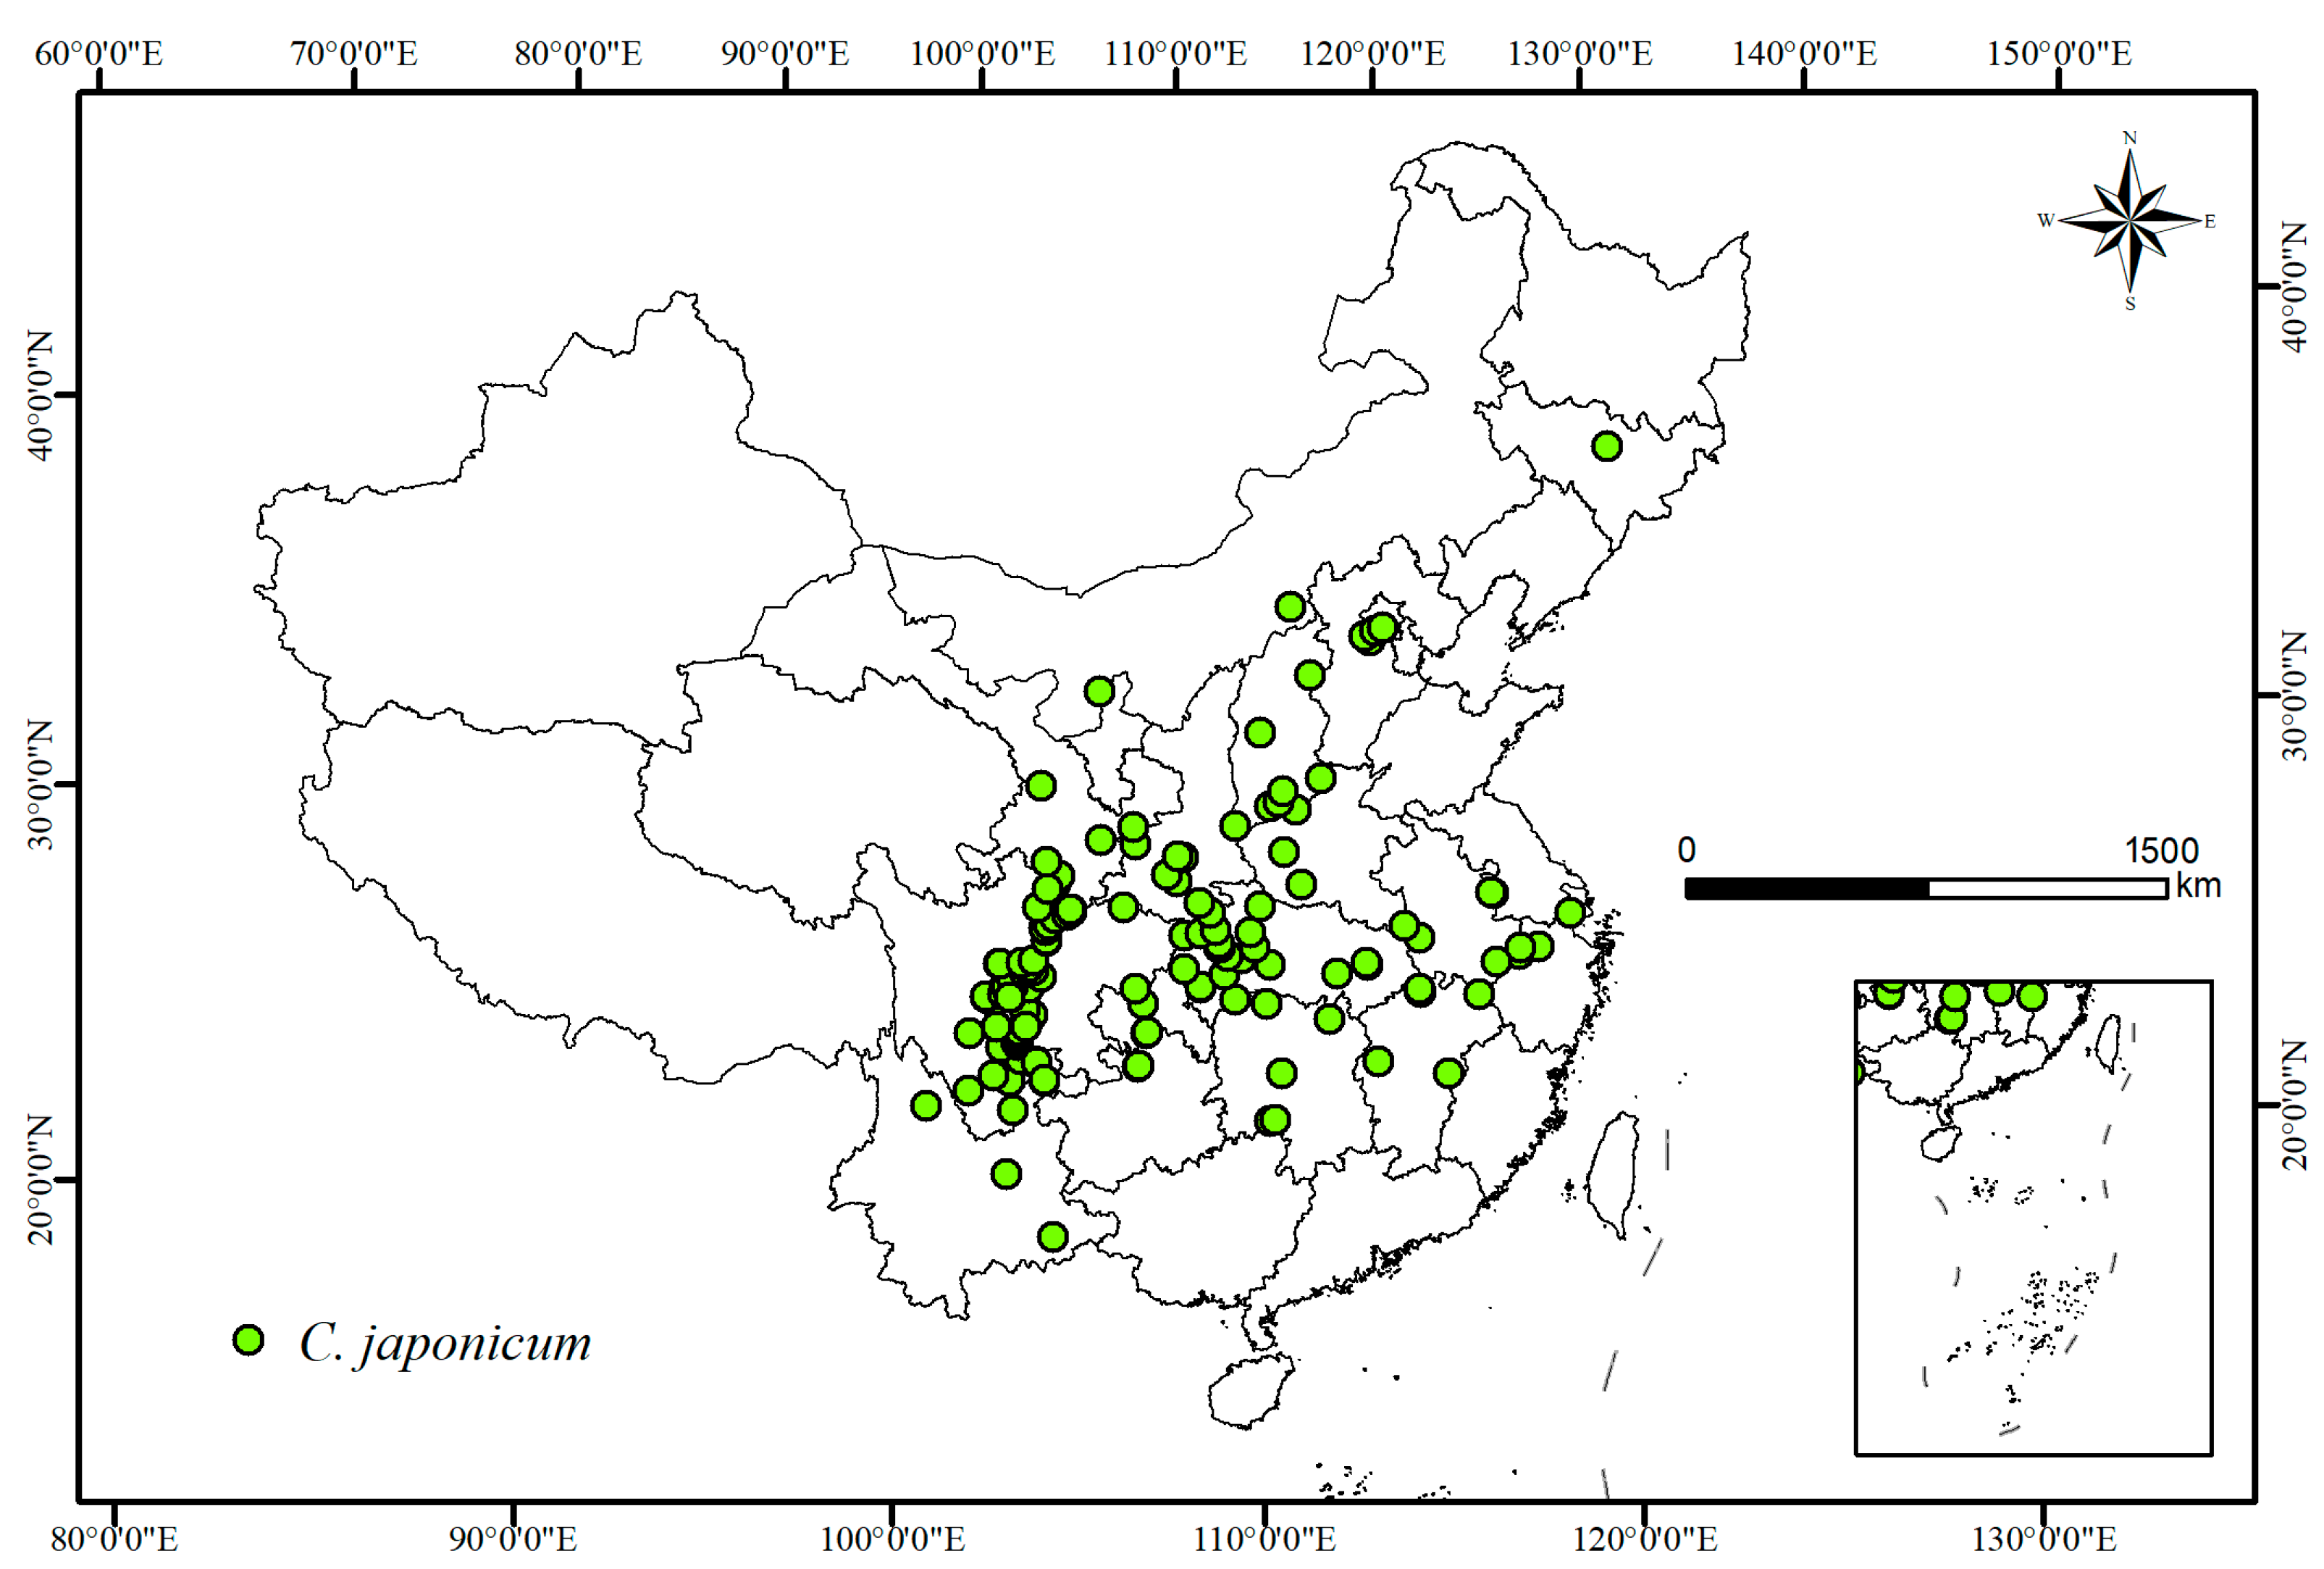
2.1. Species Data Sources and Processing

The distribution of C. japonicum has been recorded in Sichuan, Gansu, and many other places in China. In order to more fully grasp the distribution of C. japonicum in China, the authors of this study downloaded the information of C. japonicum from the Global Biodiversity Information Facility (GBIF, https://www.gbif.org/, accessed on 12 January 2022), retrieved the relevant records one by one, and screened out the records with inaccurate location. The retrieved distribution data were accessed on Google Earth (http://www.earthol.com/, accessed on 12 January 2022) to determine the detailed latitude and longitude information of all distribution points. Excessive collection of specimens in the same area causes spatial autocorrelation of species [30]. In order to reduce the over-fitting simulation of the distribution point formation, the software ArcGIS 3.0 was used to process the obtained points by a buffer analysis method [31,32]. The spatial resolution of the environmental data is 2.5 arc minutes (about 4.5 km), and each 1.5 km radius is used to form a buffer range. When the distribution point is in the same buffer range, or the buffer area coincides, the next effective distribution point is retained. After the above data processing, 184 valid distribution records were obtained (Figure 1). Later, the data was organized into Excel tables including longitude and latitude and finally saved as *.CSV format files that MaxEnt (Version 3.4.1) software can support.

2.2. Environmental Factors

In order to simulate the adaptive habitat of C. japonicum, the influence of environment on species distribution was discussed in this study. Environmental factors were obtained from multiple sources. Soil variables were acquired from the Food and Agriculture Organization of the United Nations (FAO, https://www.fao.org/soils-portal/en/, accessed on 12 January 2022). Physical/solar radiation variables were sourced from the World Ozone and Ultraviolet Radiation Data Center (WOUDC, https://woudc.org/home.php, accessed on 12 January 2022). Climate variables were retrieved from the WorldClim database (version 2.0, http://www.worldclim.org/, accessed on 12 January 2022). Topographic variables were obtained from the National Oceanic and Atmospheric Administration (NOAA, https://www.noaa.gov/, accessed on 12 January 2022). Human variables (Human Footprint) can be downloaded from the Center for International Earth Science Information Network (CIESIN, http://www.ciesin.org/, accessed on 12 January 2022). A total of 19 climate variables (bio1–bio19) were obtained, primarily related to temperature and rainfall (Table 1). In order to eliminate the autocorrelation effect between climate variables, MaxEnt 3.4.4 software (American Museum of Natural History, for USA, state of New York) was used for the folding knife test [33], which can clarify the contribution rate of variables to the model (Table 1). Combining the contribution rate and the correlation coefficient |r| < 0.8 variables, 9 climate variables were left from the 19 climate environment variables. Finally, the remaining nine variables, together with the elevation factor, soil factors, solar radiation factor, and human factor, constitute the environmental discussion factors of C. japonicum (Table 2) into the MaxEnt model for modeling and data analysis.
In addition to the current climate conditions, for future habitat prediction analysis, this study also extracted climate data for two future periods of the 2050s (2041s–2060s) and the 2090s (2081s–2100s). The data were from the Climate Change, Agriculture and Food Security website (CCAFS, https://ccafs.cgiar.org/, accessed on 25 January 2022). The latest Coupled Model Intercomparison Project Phase 6 (CMIP6) considers a combination scenario based on the Shared Socio-Economic Path (SSP) and the Typical Concentration Path (RCP) on the issue of climate change: collectively referred to as Shared Socio-Economic Scenarios (SSPs). SSPs add three new radiative forcing scenarios to the four RCPs in CMIP5. In order to explore the response of C. japonicum to climate change, according to the peak time of carbon emissions in China under SSPs, three scenarios of SSP1-2.6, SSP2-4.5, and SSP5-8.5 were selected to simulate the adaptive distribution of C. japonicum in the 2050s and 2090s.

2.3. MaxEnt Modeling

When using MaxEnt software for data simulation, the distribution points of C. japonicum and the final selected environmental discussion factors were imported into the software. In order to avoid the instability caused by randomly selected data, the initial data processing of the model was repeated 10 times. Each time, 75% of the C. japonicum distribution data was selected as the training data for the establishment of the prediction model, and the remaining 25% was used for the validation and test data of the model. The knife-cutting method was used to test the contribution of each climate variable to the distribution of C. japonicum, and the simulation results were output as ASCII grid layers. Finally, the average value of 10 operations is used as the basis for data evaluation. MaxEnt software modeling used the receiver operating characteristic (ROC) curve, and the area under the ROC curve (AUC) was used as an effective method to evaluate the accuracy of the species distribution model simulation. Estimation criteria: 0.5 ≤ AUC < 0.6, the simulation results failed; 0.6 ≤ AUC < 0.7, the simulation results were poor; 0.7 ≤ AUC < 0.8, the simulation results were general; 0.8 ≤ AUC < 0.9, the simulation results were accurate; 0.9 ≤ AUC < 1, the simulation results were very accurate.

2.4. Classification of Suitable Grades

After the operation of MaxEnt software is completed, the .asc file is generated and imported into ArcGIS software for data extraction, and the results obtained by simulation are reclassified. According to the division method of evaluation probability in IPCC (Intergovernmental Panel on Climate Change) report, the distribution values are divided as follows: p < 0.1, 0.1 ≤ p < 0.3, 0.3 ≤ p < 0.5, 0.5 ≤ p, which are divided into four grades. Corresponding to the inappropriate area, low suitability area, medium suitability area, and high suitability area, different suitable zones were marked with different colors to complete the mapping.

3. Results

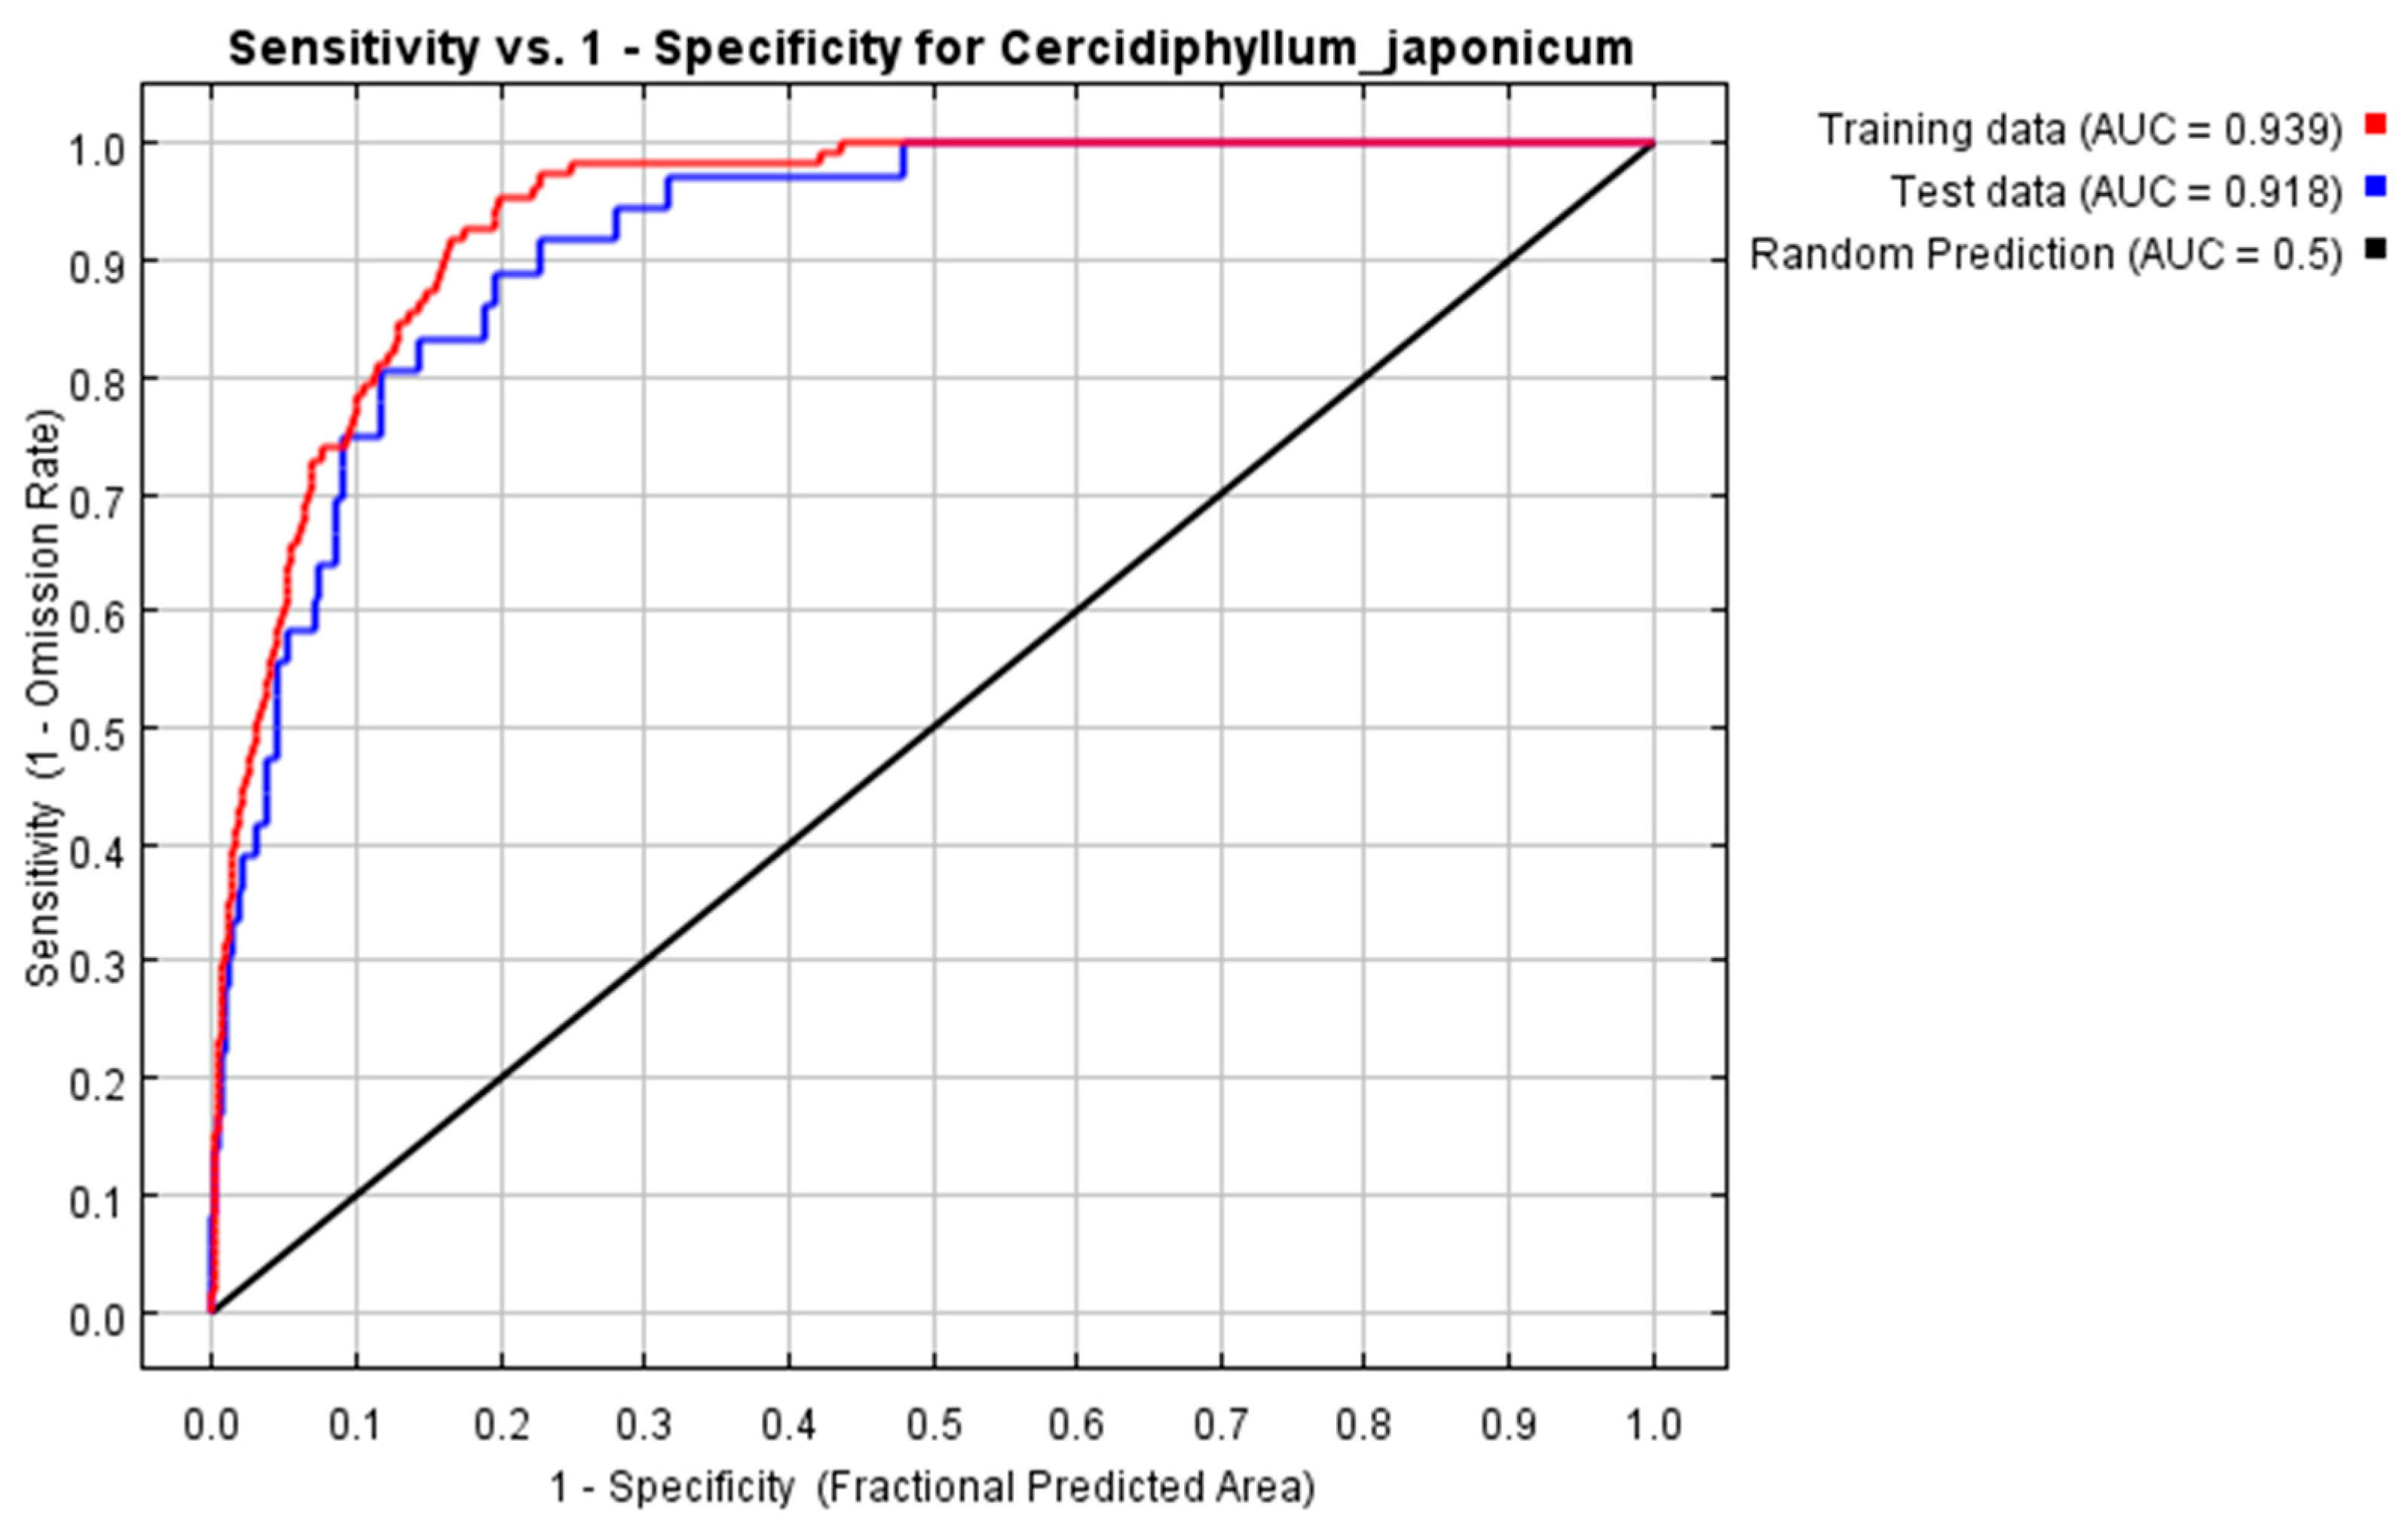
3.1. Model Optimization Results and Accuracy Evaluation

The performance of the species distribution model was evaluated using the ROC curve, with the AUC value as an indicator of predictive accuracy [34]. In the initial run using all 19 bioclimatic variables, the model showed high accuracy (AUC > 0.9 for both training and test sets; Figure 2). In the second run, after selecting the top nine climatic variables and incorporating additional environmental factors (e.g., soil, topography, and anthropogenic variables), the model’s performance further improved, with an average test AUC of 0.946 and a standard deviation of 0.025 (Figure 3). These results confirm the robustness and high reliability of the MaxEnt model in predicting the potential distribution of C. japonicum.

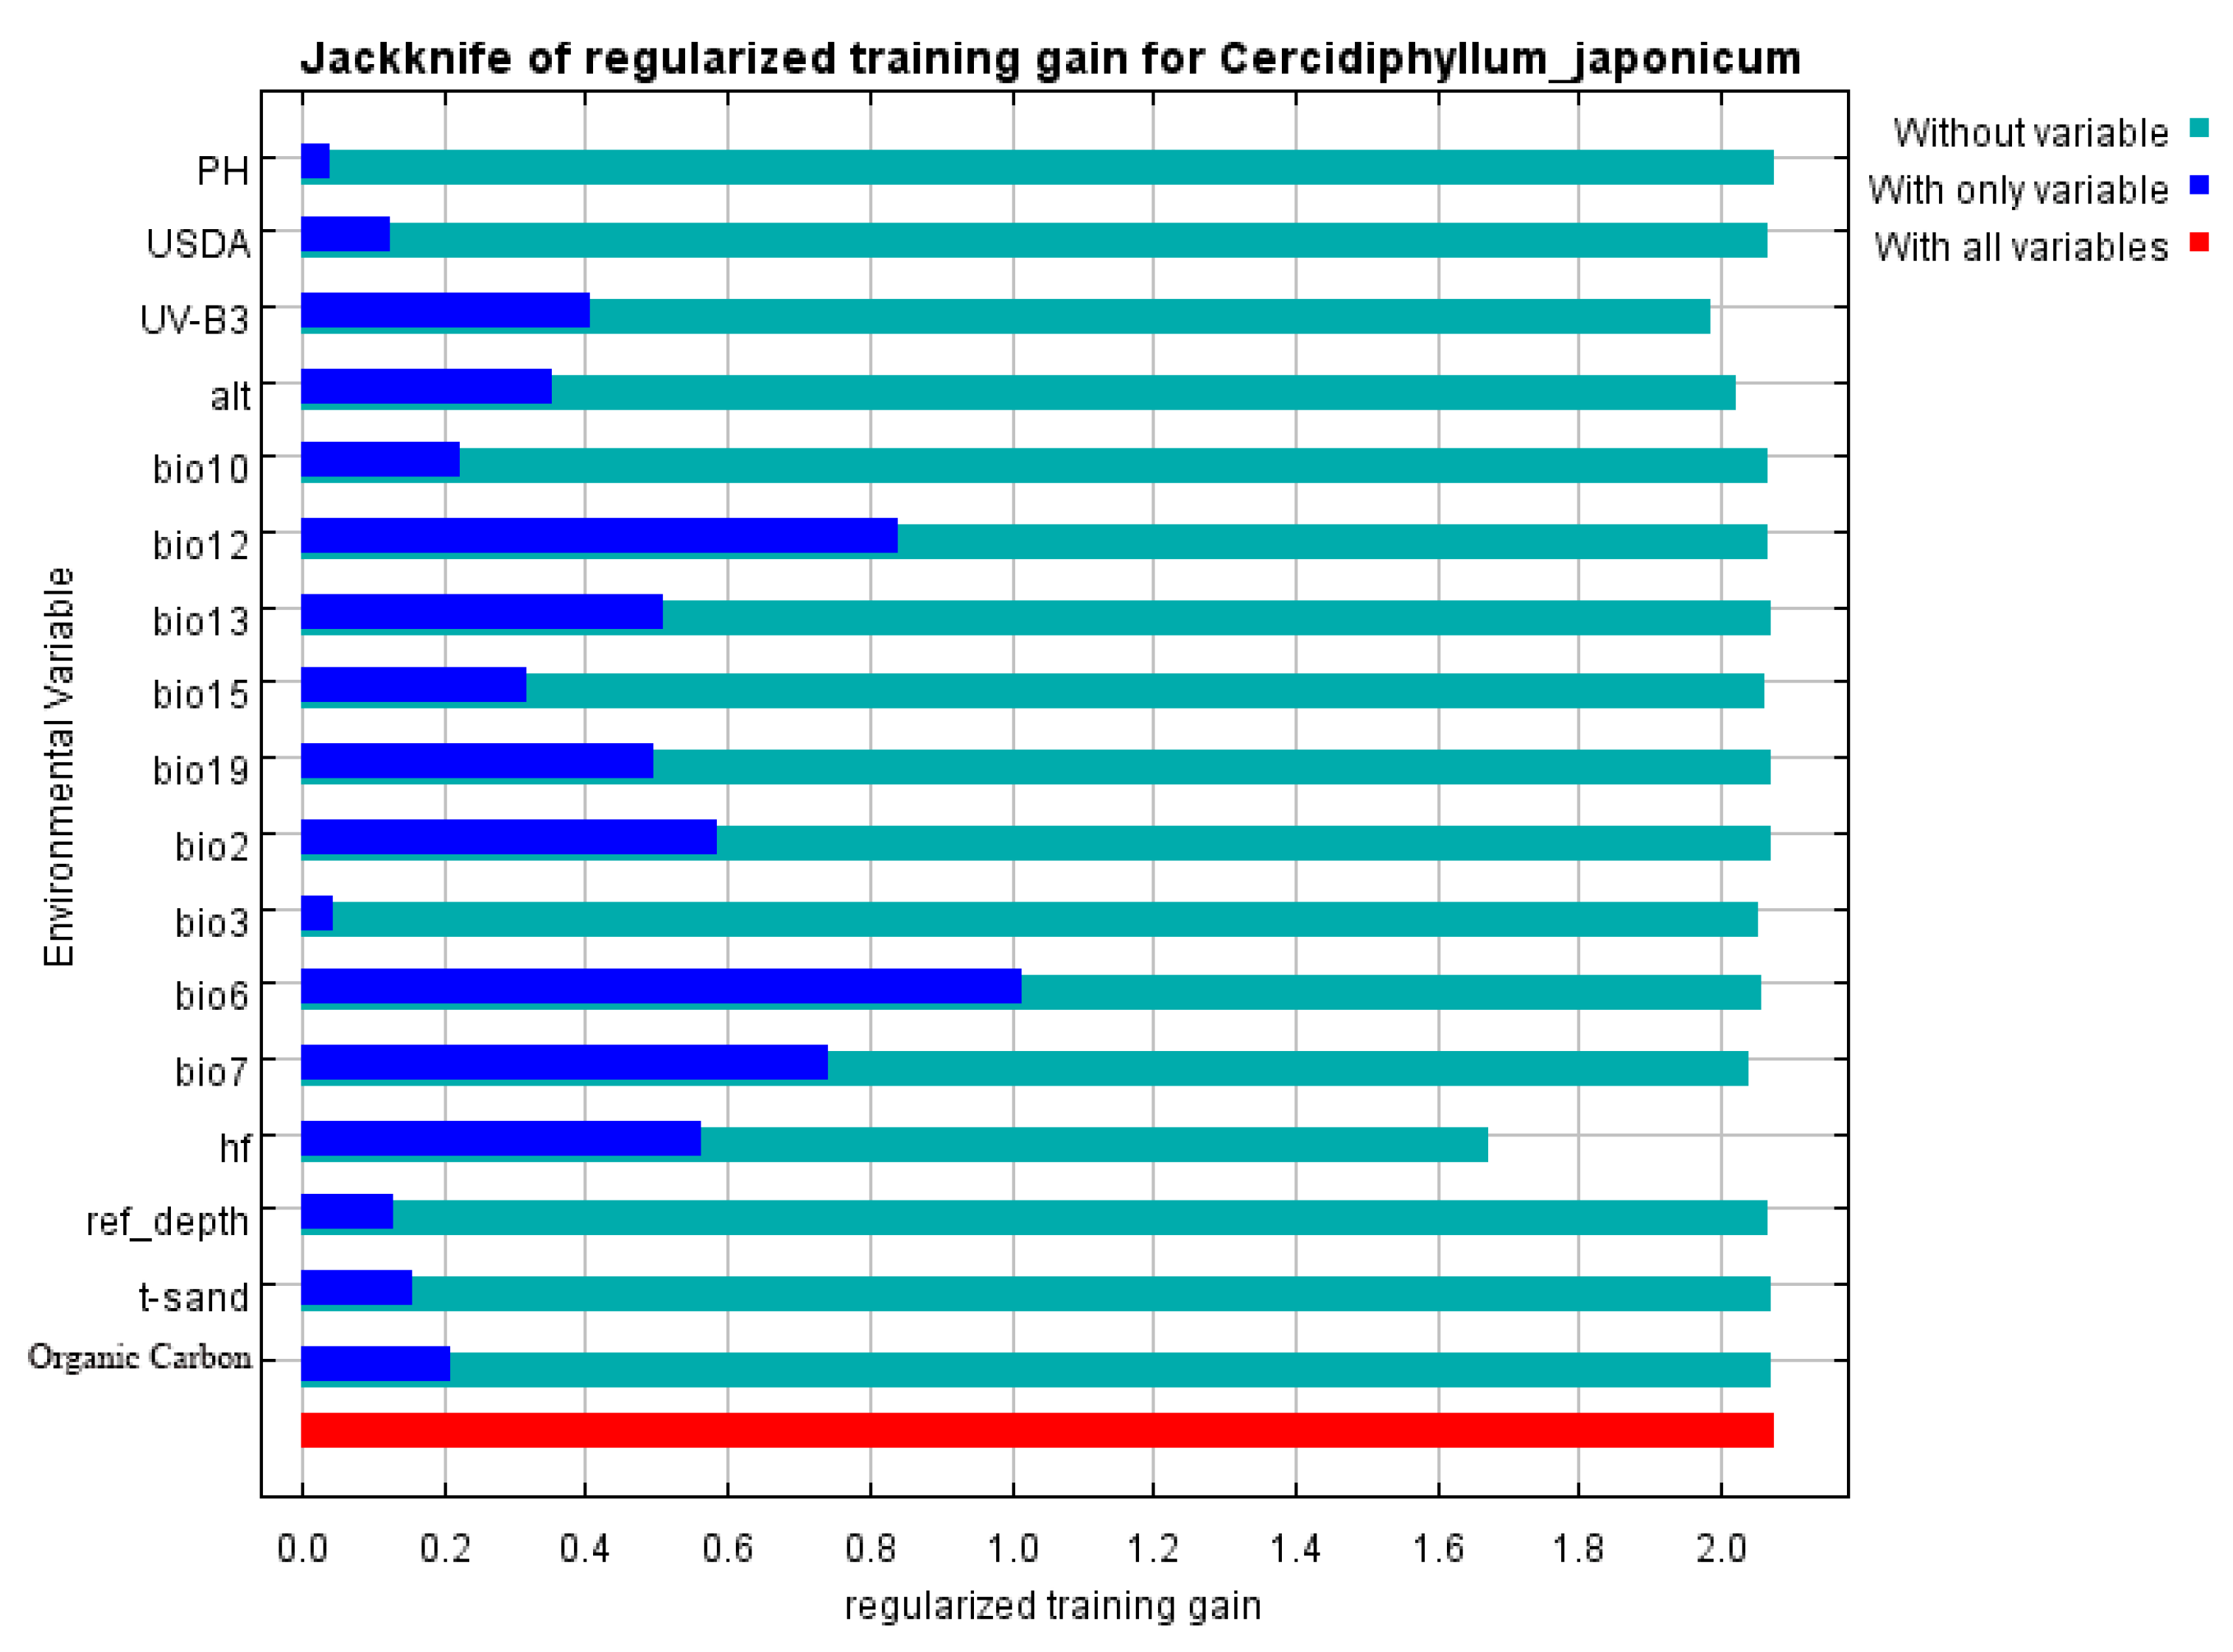
3.2. Contribution Rate of Environmental Variables

The 17 environmental variables were input into the MaxEnt model, and a 10-fold cross-validation was performed to evaluate the model performance for C. japonicum. The MaxEnt model identified Annual Precipitation (bio12) and Minimum Temperature of Coldest Month (bio6) as the most influential variables, contributing 34% and 19.5%, respectively (Table 3). Together with six other variables—such as human footprint, altitude, and UV-B radiation—the top eight predictors accounted for 98% of the model’s explanatory power. These results suggest that climatic factors play a dominant role in shaping the distribution of C. japonicum, followed by anthropogenic influences.

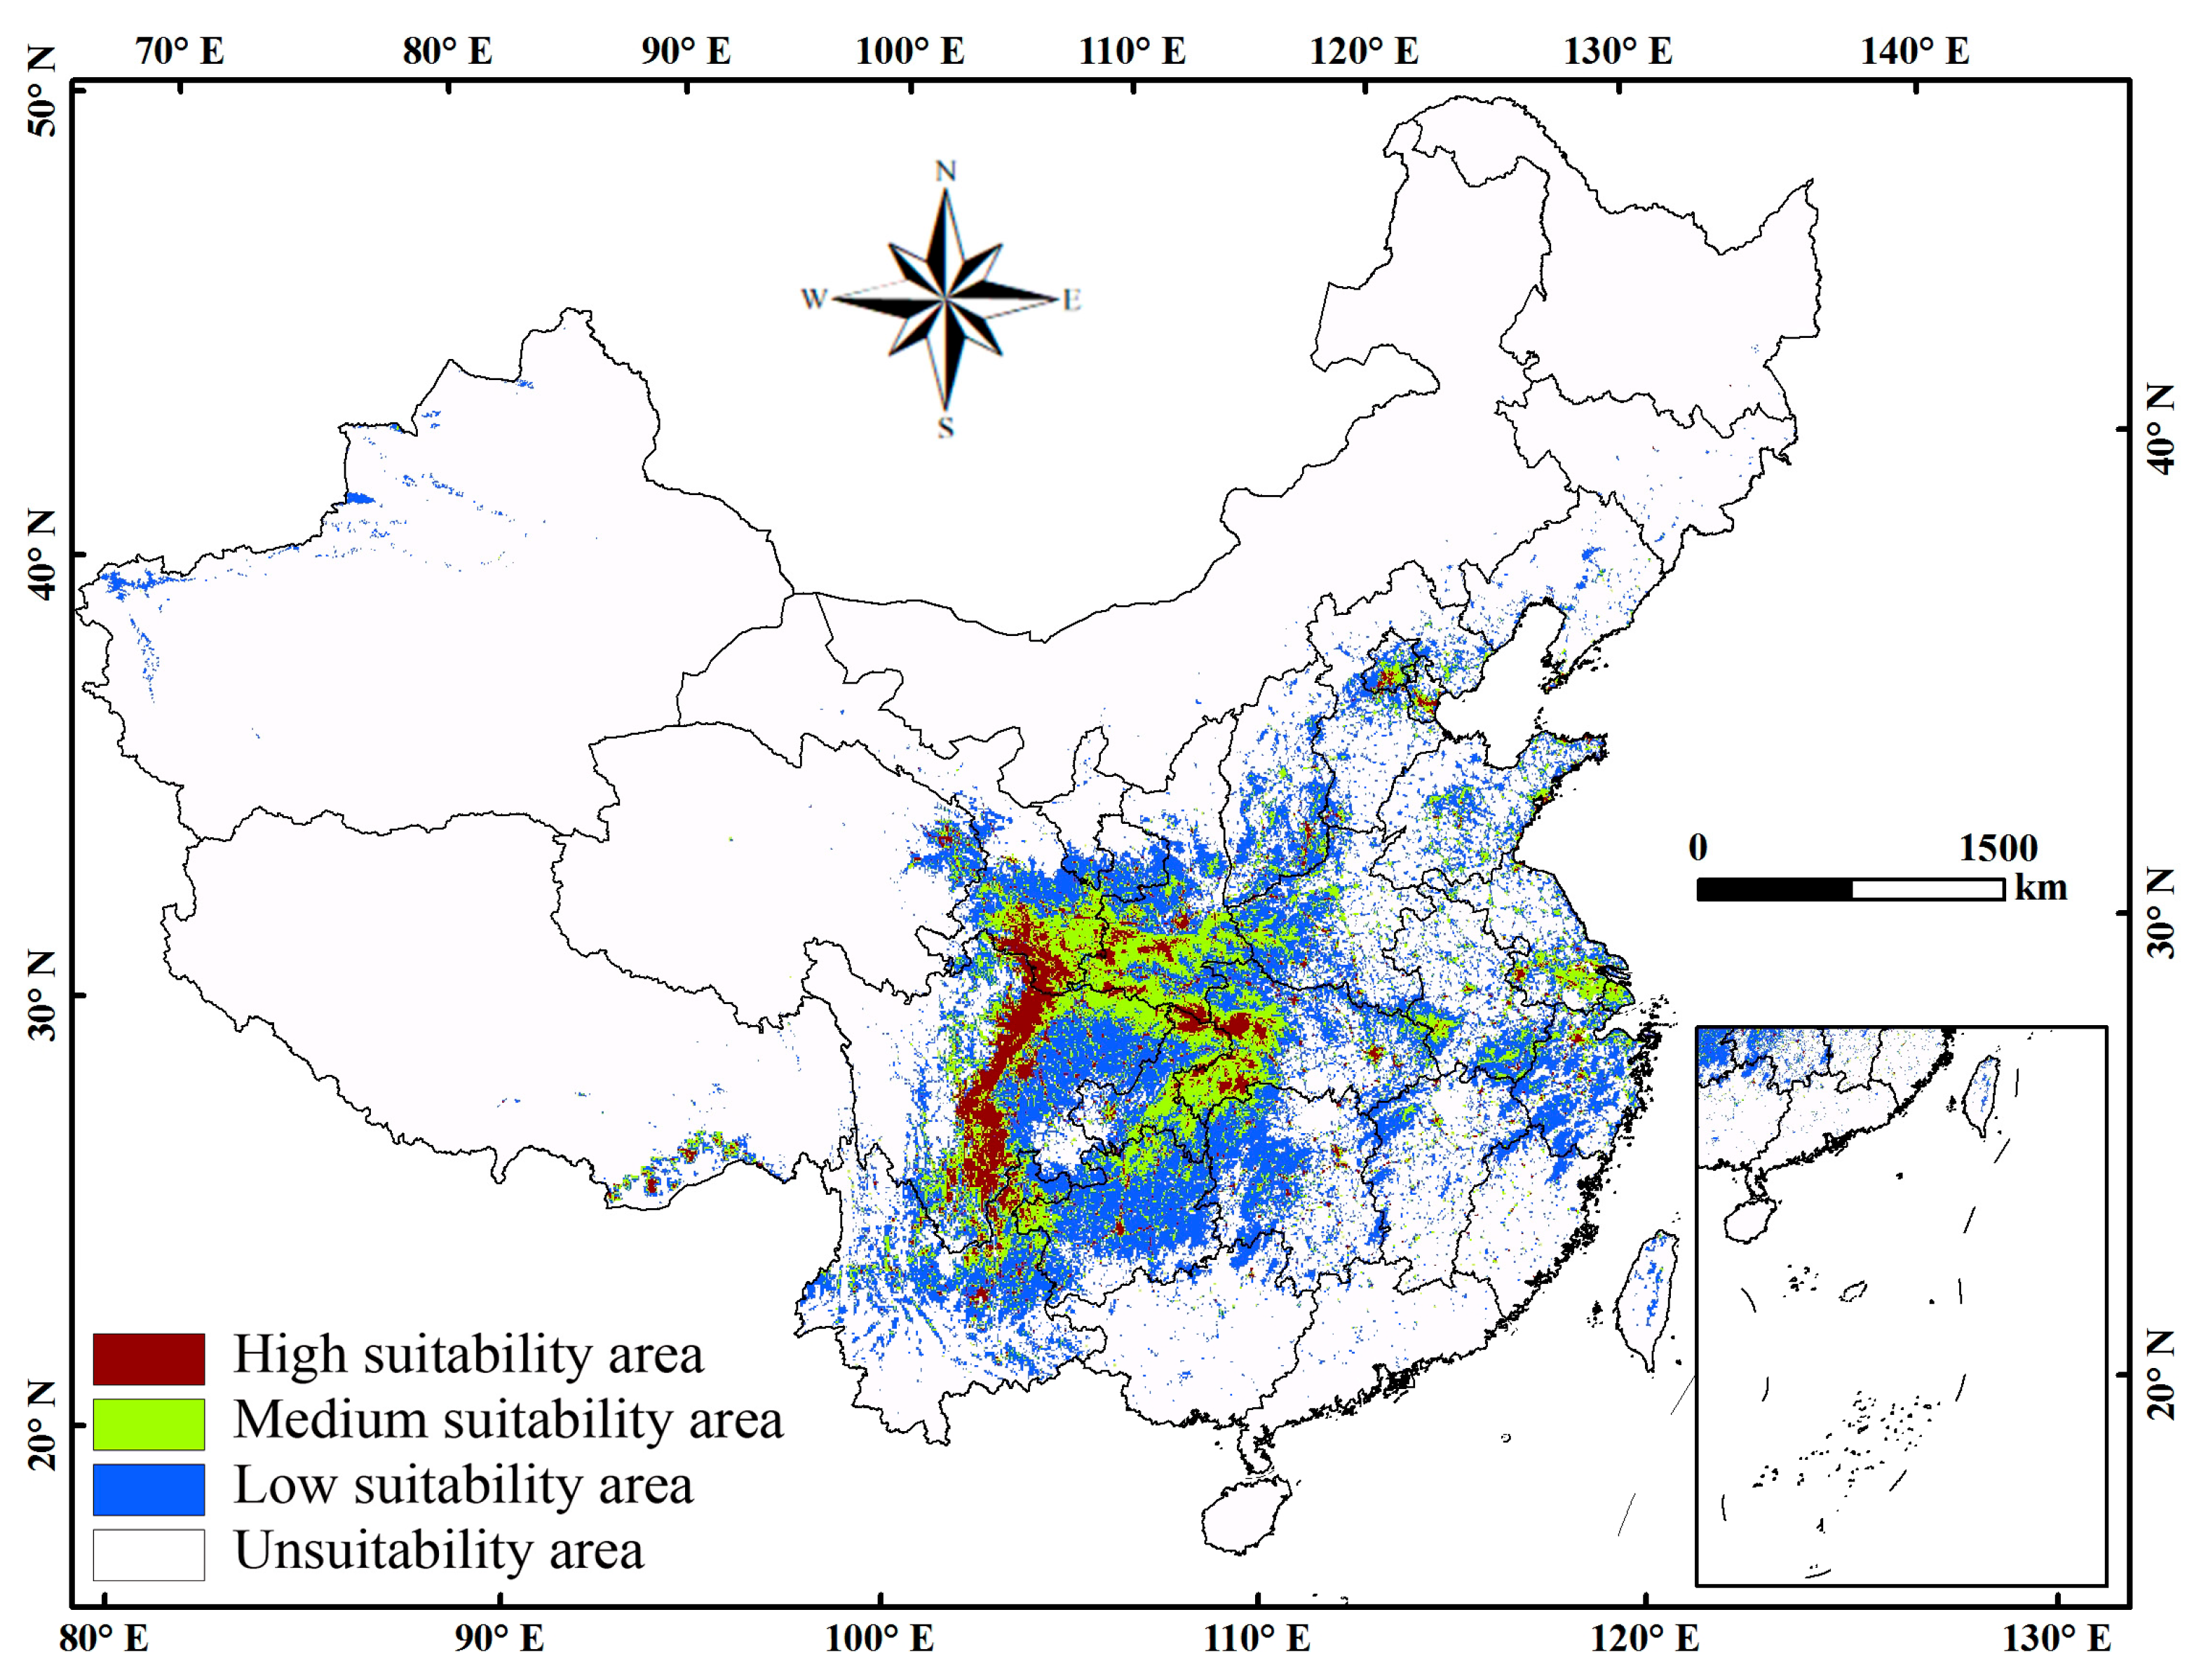
3.3. Current Distribution of C. japonicum Under Present Climate

The MaxEnt model predicted four suitability categories for C. japonicum distribution in China: high, medium, low, and unsuitable areas (Figure 4). The total suitable habitat covers approximately 95,071 km2, accounting for 0.989% of China’s land area (Table 4). The Sichuan Basin and regions between the Yellow and Yangtze River Basins dominate the distribution. Sichuan Province has the largest suitable area (15,417 km2), followed by Yunnan Province (8089 km2). Notably, Shanghai has a small suitable area (294 km2) but the highest suitability proportion within its province (87.76%).
High suitability zones are limited, covering only 10,275 km2 (0.107% of the country), mainly concentrated in the Sichuan Basin, which accounts for about one-third of this area. Other smaller high suitability areas occur in Gansu, Shaanxi, Hubei, Yunnan, and Chongqing. Medium suitability areas (24,959 km2) are roughly twice the size of high suitability zones, with a similar geographic distribution.
Low suitability areas cover the largest portion of suitable habitats (59,851 km2), primarily in Sichuan, Yunnan, Guizhou, Hunan, and Henan. Among provinces, Sichuan has the highest proportion of high suitability habitat (13.92%), followed by Tianjin (12.11%) and Chongqing (10.28%). Some regions, including Xinjiang, Inner Mongolia, Hainan, and Hong Kong, have no high suitability areas.

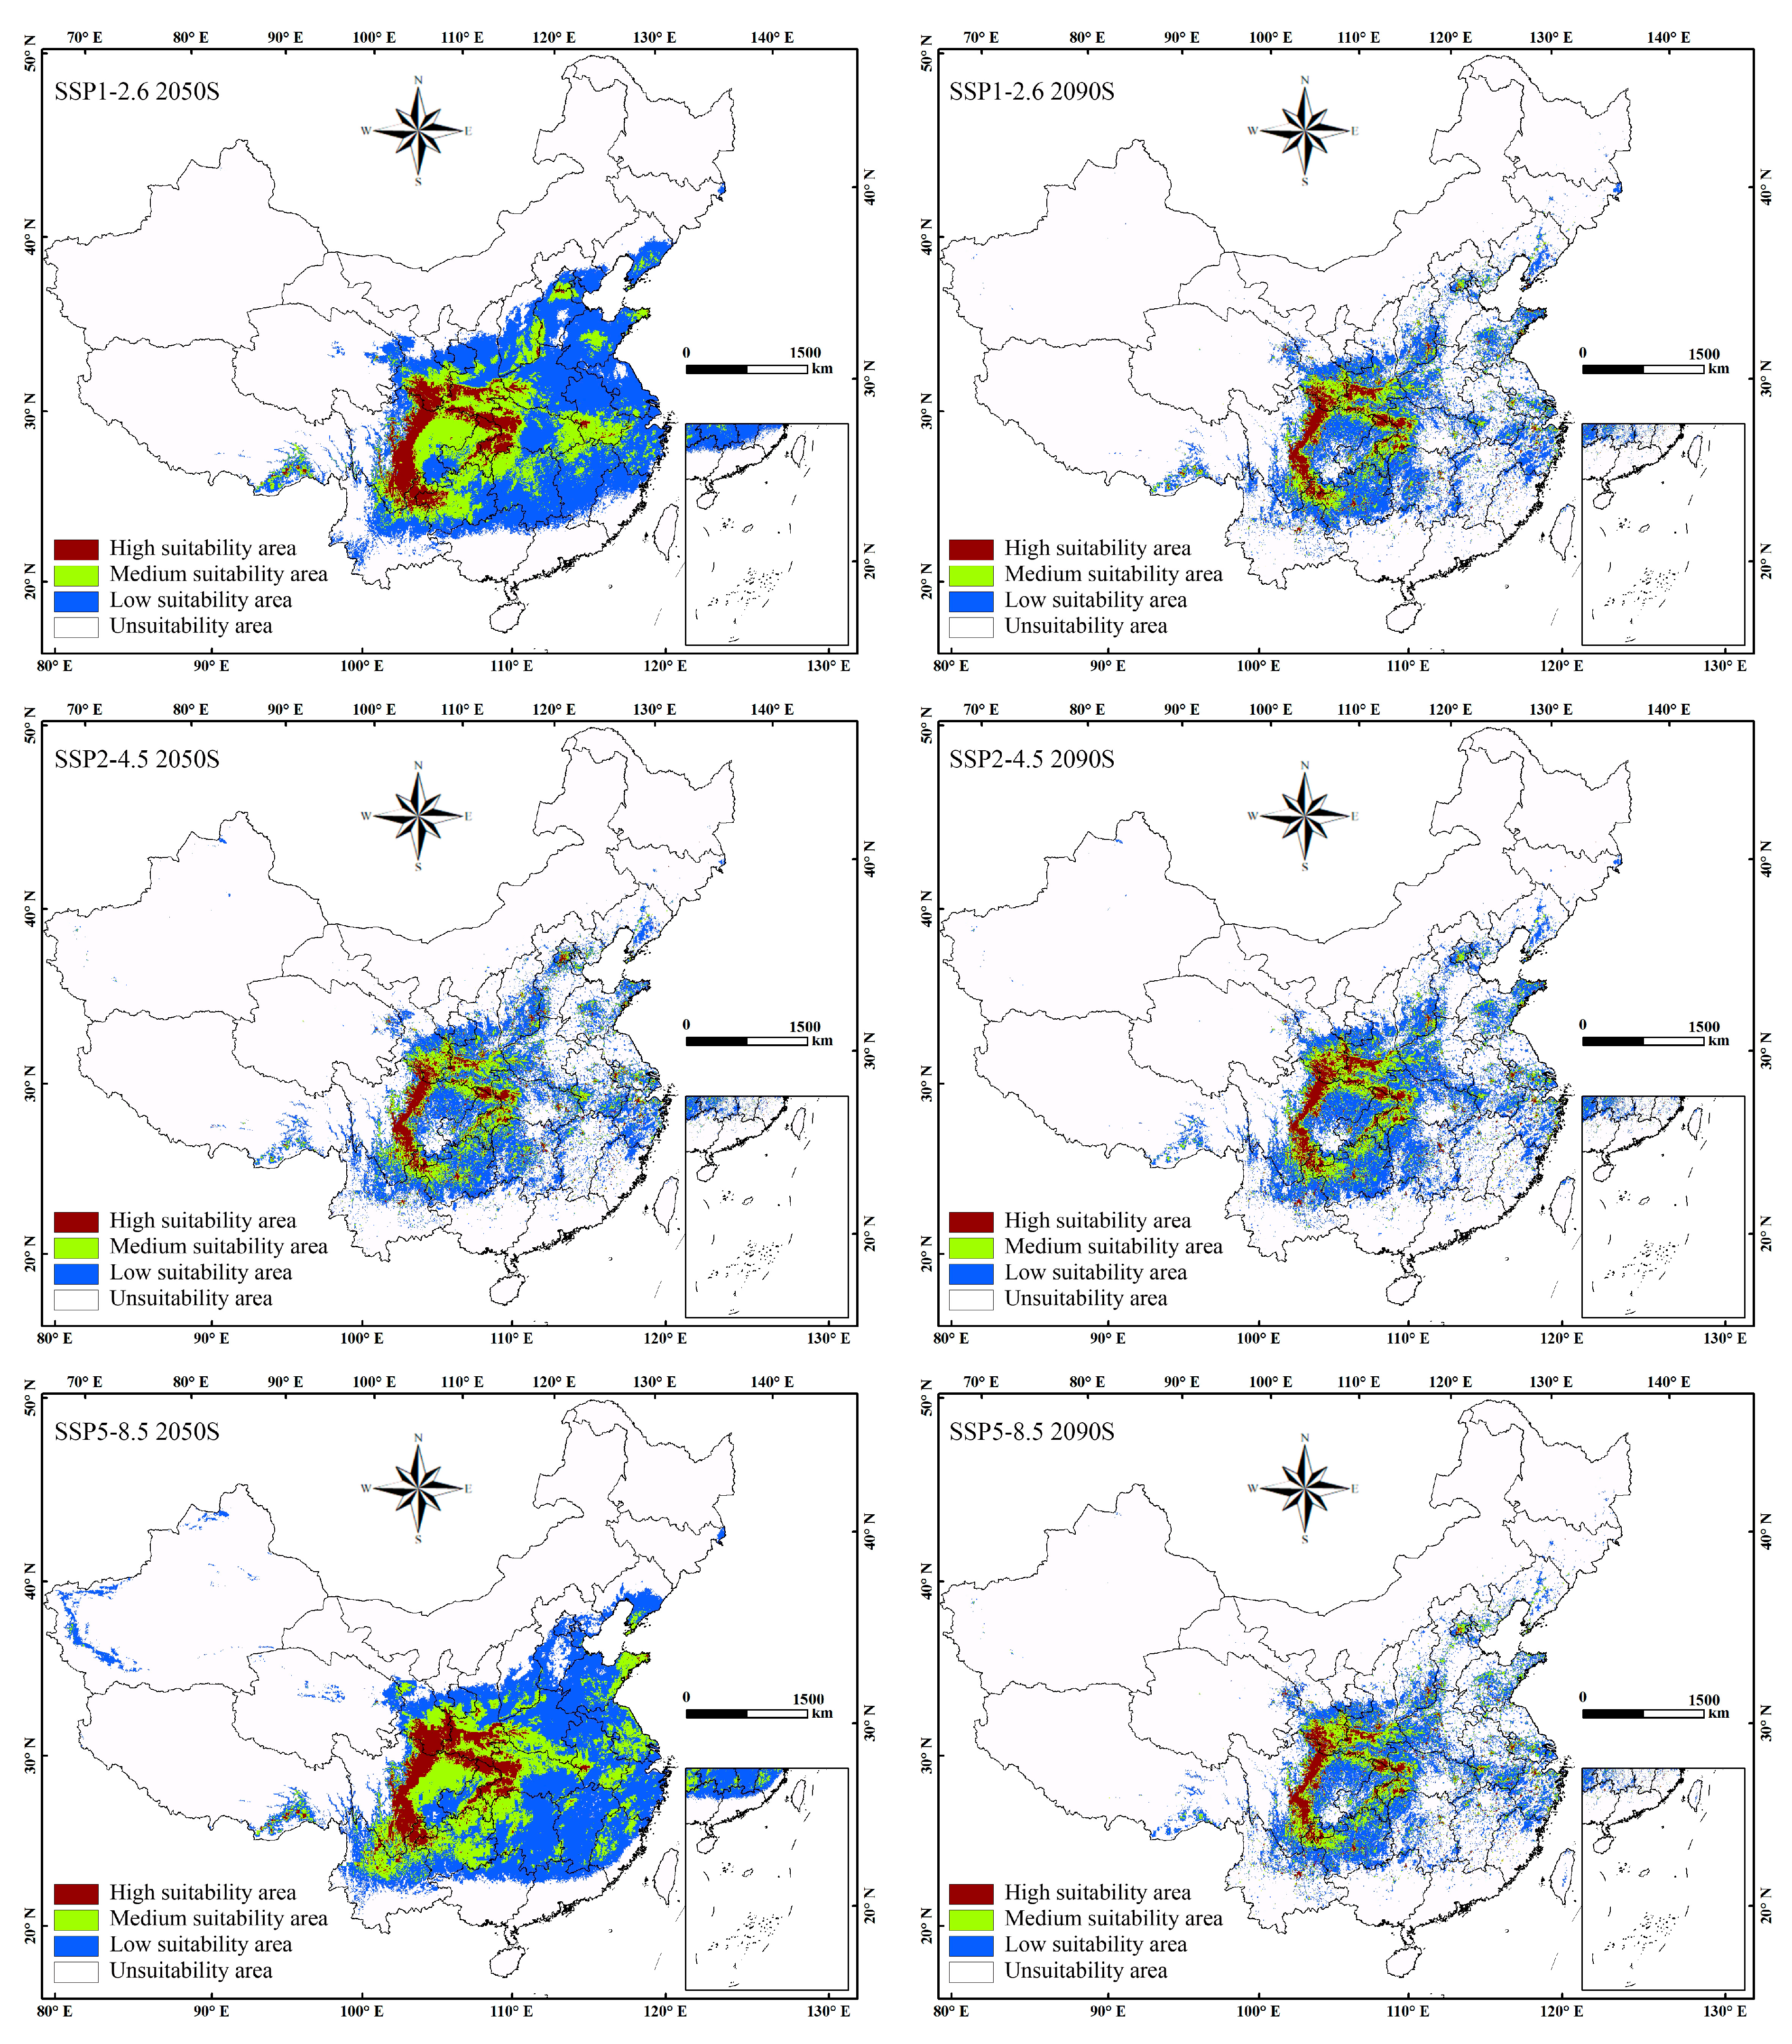
3.4. Potential Distribution of C. japonicum in Future Period

This study predicted the potential future distribution of C. japonicum under three climate change scenarios (SSP1-2.6, SSP2-4.5, and SSP5-8.5) for the 2050s and 2090s (Figure 5). Under the 2050s scenarios SSP1-2.6 and SSP5-8.5, the total suitable area notably expands, primarily in the Sichuan Basin and the Yunnan–Guizhou Plateau. These regions are characterized by mild temperature variations, abundant precipitation, and favorable conditions for plant growth.
Specifically, the high suitability area under SSP1-2.6 in the 2050s increases by 63.7% to 16,821 km2, with Sichuan remaining the core region. Moderate and low suitability areas also expand significantly, increasing by 72.7% and 58.3%, respectively, spreading further into East and Central South China. The total suitable area grows by approximately 62.7% compared to current conditions. The SSP5-8.5 scenario shows a similar pattern, with total suitable area increasing by 67.5%, including a slight expansion into Xinjiang.
In contrast, the 2090s projections show declines in suitable habitat across all scenarios, particularly under SSP5-8.5, where the high suitability area decreases by 2.4%. SSP1-2.6 exhibits only a minor increase in high suitability area (177 km2) with moderate and low suitability areas shrinking by 18.8% and 1.7%, respectively. Despite these declines, Sichuan continues to be the primary area of suitable habitat, followed by Shaanxi, Hubei, and Gansu, with lower suitability zones extending into Central and East China (Table 5).

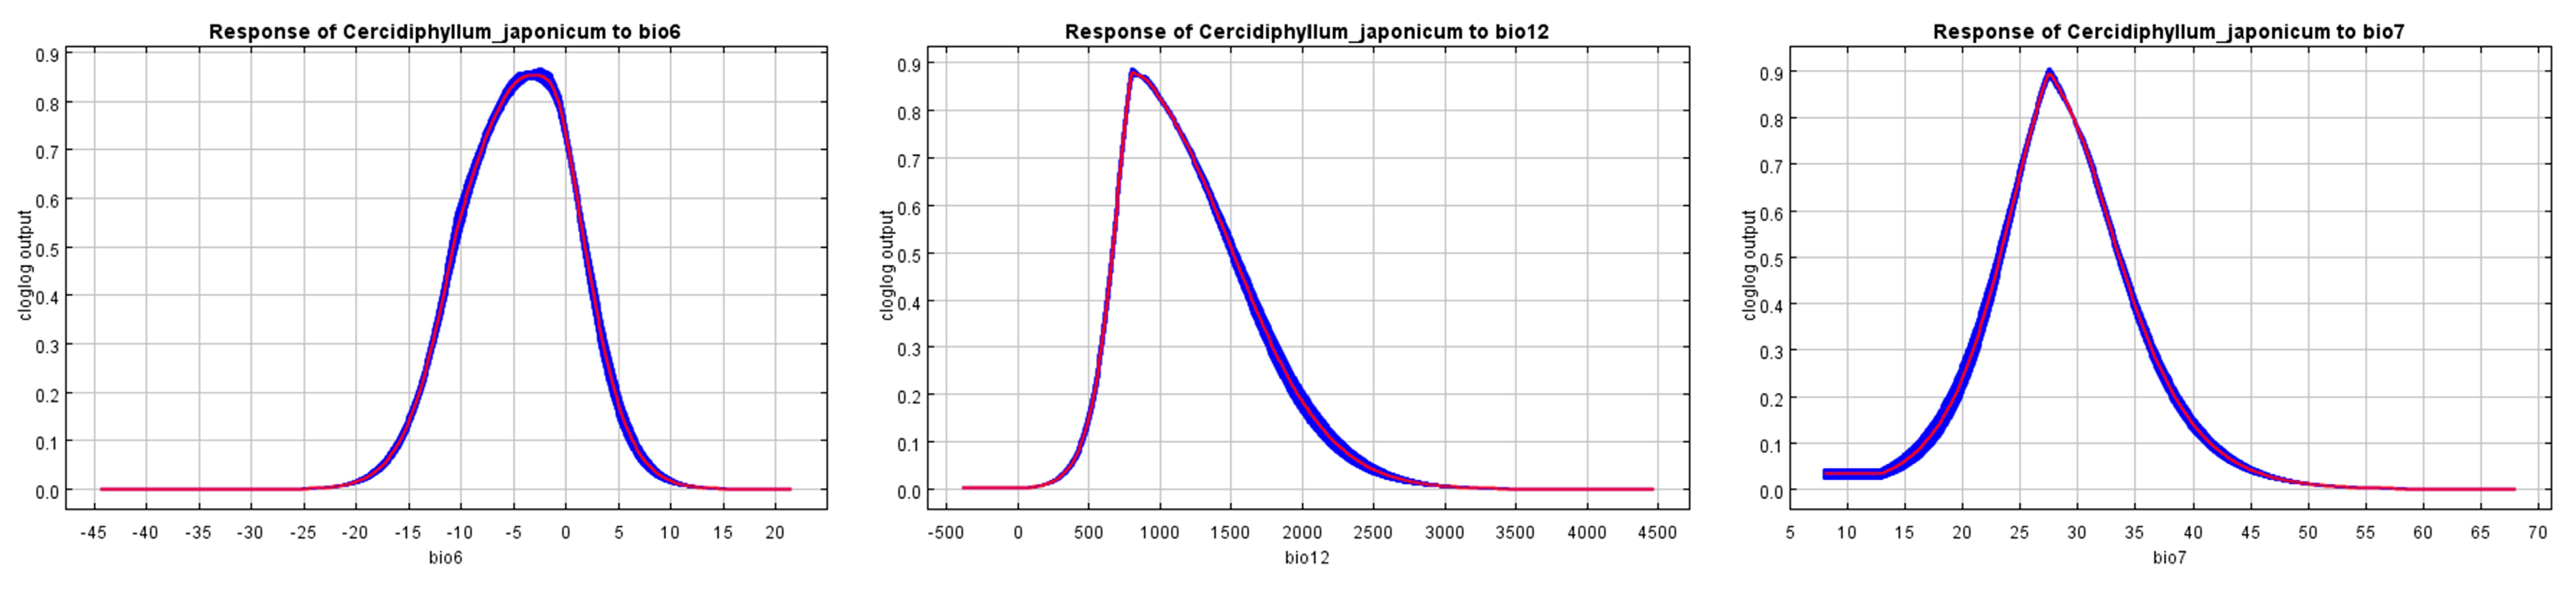
3.5. Environmental Variable Analysis

After screening, a total of 17 environmental variables—including 9 key climatic variables, as well as topographic, soil, chemical, and anthropogenic factors—were used in the MaxEnt model. The importance of each variable on the distribution of C. japonicum was evaluated using the jackknife test. In the jackknife plot, red, blue, and green bars represent model performance with all variables, with only the specific variable, and without the specific variable, respectively (Figure 6). Among these, the three variables with the greatest individual influence on the potential distribution are Minimum Temperature of Coldest Month (bio6), Annual Precipitation (bio12), and Temperature Annual Range (bio7). All three showed training gains above 0.65, indicating strong predictive power.
The response curves (Figure 7) illustrate how species suitability changes with key environmental variables. Based on the IPCC threshold for suitability (0.33–1), optimal ranges were identified for the three most influential variables: Minimum Temperature of Coldest Month, Annual Precipitation, and Temperature Annual Range (bio7) (Table 6). The curves show sharp peaks, indicating that C. japonicum has a narrow ecological tolerance. Suitable temperature ranges for the coldest month and annual temperature variation are approximately −12.2 °C to 3.1 °C and 21.3 °C to 35.9 °C, respectively. The species thrives best in moderate climates, with an optimal annual precipitation of around 813 mm, within a range of 611 to 1732 mm. These findings confirm that C. japonicum prefers temperate, humid environments and is sensitive to extreme temperature fluctuations.

3.6. The Centroid Variation in the Potential Distribution of C. japonicum

Future centroid shifts in C. japonicum under the three SSP scenarios reveal a tendency toward higher latitudes (Figure 8 and Table 7). Under SSP1-2.6, the centroid moves modestly southeast by the 2050s and then slightly back toward the current position by the 2090s. The SSP2-4.5 scenario produces the largest displacement, with a pronounced northeast shift by mid-century followed by a further move toward the northeast by the end of the century. Under SSP5-8.5, the centroid consistently shifts northwest in both time periods but remains closer to its current location compared to SSP2-4.5. These patterns indicate that, regardless of emission pathway, C. japonicum’s core habitat is likely to migrate toward cooler, higher-latitude regions over the coming decades.

4. Discussion

In this study, we employed the MaxEnt model to evaluate the current and future potential distribution of C. japonicum across China, based on verified occurrence records and key environmental variables. The model performed exceptionally well, with an AUC of 0.946, indicating strong predictive power consistent with previous research on rare and relict tree species under climate change scenarios [35,36,37,38].
The results indicate that C. japonicum currently occupies four distinct habitat classes—high, medium, low suitability, and unsuitable areas—with suitable habitats primarily concentrated in the Sichuan Basin and transitional regions between the Yellow and Yangtze River basins [39]. These findings are in line with earlier studies demonstrating that subtropical humid climates and favorable edaphic conditions strongly influence the distribution of shade-tolerant relict trees [37,40].
Projections under future scenarios suggest that suitable areas could expand by the 2050s under SSP1-2.6 and SSP5-8.5, but contract markedly by the 2090s, particularly under high-emission pathways. Such patterns have also been observed for other vulnerable or endemic tree species, which initially benefit from moderate warming but ultimately face habitat loss under extreme conditions [37,41]. The centroid shift trajectories confirm a general poleward and elevational migration trend, supporting biogeographic expectations that species will track suitable climate envelopes [42,43,44]. Interestingly, under SSP1-2.6, the displacement direction reverses between “Contemporary to 2050s” and “2050s to 2090s”, suggesting that local topographic complexity and microclimatic buffering could modify expected shifts.
Of the 19 bioclimatic variables considered, 9 were identified as critical, with Min Temperature of Coldest Month, Annual Precipitation, and Temperature Annual Range exerting the greatest influence on potential distribution. These hydrothermal variables underscore the species’ reliance on mild winters and sufficient precipitation [35,45]. Similar results have been reported for other cold-tolerant or relict trees, which often exhibit narrow climatic tolerances, making them particularly sensitive to shifts in temperature and precipitation regimes [46,47].
Nonetheless, the MaxEnt model inherently simplifies species–environment relationships by focusing on individual variables and does not fully capture the complex interplay among soil characteristics, UV-B radiation, and human disturbance, all of which can substantially affect habitat suitability [36,46,48]. For example, recent studies on Wasmannia auropunctata and Mentha pulegium demonstrate how anthropogenic pressures and solar radiation can alter distribution predictions. Furthermore, the low natural regeneration capacity and limited seed dispersal of C. japonicum are likely to exacerbate vulnerability, a pattern similarly documented for Karomia gigas and Zanthoxylum bungeanum under changing climates [37,45].
Therefore, future research should integrate additional drivers—such as habitat heterogeneity, land-use dynamics, and species interactions—into predictive models to refine projections of distributional shifts [41,49,50,51]. Combining high-resolution genomic resources [40,49], long-term ecological monitoring [46], and improved downscaled climate models will be vital for informing conservation and management strategies for relict trees like C. japonicum as they confront accelerated environmental change.

5. Conclusions

Based on the distribution information of C. japonicum and the selected environmental factors, this study successfully predicted the current and future suitability distribution of C. japonicum by combining ArcGIS technology and MaxEnt model. At present, the suitable areas of C. japonicum are mainly concentrated in the Sichuan Basin, and between the Yellow River Basin and the Yangtze River Basin, with the majority of Sichuan and Yunnan distribution areas. In the 2050s, the areas classified as highly, moderately, and lowly suitable under the two climate concentration scenarios, SSP1-2.6 and SSP5-8.5, are projected to increase significantly compared with the current period. In the highly suitable area, expansion was observed in the southwest region, while the medium and low suitability areas extended into East China and Central South regions along the middle and lower reaches of the Yangtze River. The Sichuan Basin, North China Plain, Middle and Lower Reaches of the Yangtze River Plain, Shandong Hills, and Southeast Hills comprised extensive areas of C. japonicum suitability. By the 2090s, reductions of varying degrees were projected across the current suitable areas. The center of mass moved to the high latitudes of the northwest and northeast. Simulation results showed that Min Temperature of Coldest Month (bio6), Annual Precipitation (bio12), Temperature Annual Range (bio5–bio6) (bio7) were important environmental variables affecting the distribution of C. japonicum. Under the condition of continuous warming of the climate, the suitable area of C. japonicum was shrinking. Limited by its own physiology, morphology, and environmental constraints, the resources of C. japonicum were at risk of extinction. Using the species distribution model to predict the distribution trend of C. japonicum, it was of great significance to formulate and take protective measures in advance for the protection of rare and endangered C. japonicum.

Author Contributions

Conceptualization, B.N. and D.X.; methodology, Y.J.; software, Y.J.; formal analysis, Y.J.; investigation, J.C. and L.Z.; data curation, J.C. and L.Z.; writing—original draft preparation, Y.J.; writing—review and editing, H.Z.; visualization, H.Z. and L.Z.; supervision, B.N. and D.X. All authors have read and agreed to the published version of the manuscript.

Funding

This work was funded by the First-class University Level Biology Subject (YLXK202101), Anhui Provincial Department of Education Natural Science Project (KJHS2019B13), and Forestry Research Innovation Project of Anhui Province (Biocontrol and Application of endophytic Bacteria in Pine nematode Disease).

Institutional Review Board Statement

Not applicable.

Data Availability Statement

The occurrence data have been published on Figshare: https://figshare.com/s/98f9b83715b37ab3209e (accessed on 30 April 2025).

Conflicts of Interest

The authors declare no conflicts of interest.

References

  1. Zhu, S.; Yin, P.; Yap, Z.; Qiu, Y. Chloroplast genomes of two extant species of Tertiary relict Cercidiphyllum (Cercidiphyllaceae): Comparative genomic and phylogenetic analyses. Mitochondrial Dna. Part B Resources 2019, 4, 1551–1552. [Google Scholar] [CrossRef]
  2. Zhang, J.; Zhang, B.; Qian, Z. Functional diversity of Cercidiphyllum japonicum, communities in the Shennongjia Reserve, central China. J. For. Res. 2015, 26, 171–177. [Google Scholar] [CrossRef]
  3. Sun, Z.; Kumar, R.M.S.; Li, J.; Yang, G.; Xie, Y. In Silico search and biological validation of MicroR171 family related to abiotic stress response in mulberry (Morus alba). Hortic. Plant J. 2022, 8, 184–194. [Google Scholar] [CrossRef]
  4. Song, N.; Zhang, J. Multivariate Analysis of the Endangered Medicinal Species Cercidiphyllum Japonicum Communities in the Shennongjia Re-serve, Central China. Cerne 2018, 24, 180–189. [Google Scholar] [CrossRef]
  5. Guan, B.; Chen, W.; Gong, X.; Wu, T.; Cai, Q.; Liu, Y.; Ge, G. Landscape connectivity of Cercidiphyllum japonicum, an endangered species and its implications for conservation. Ecol. Inform. 2016, 33, 51–56. [Google Scholar] [CrossRef]
  6. Song, X.; Yang, T.; Zhou, C.; Luo, S.; Dong, M.; Yan, X.; Lv, W.; Zheng, F.; Zhou, C.; Wei, Y. Differences in microbiome composition and transcriptome profiles between male and female Paederus fuscipes harbouring pederin-producing bacteria. Insect Mol. Biol. 2022, 31, 457–470. [Google Scholar] [CrossRef] [PubMed]
  7. Brunel, N.; Meza, F.; Ros, R.; Santibáñez, F. Effects of topsoil loss on wheat productivity in dryland zones of Chile. J. Soil. Sci. Plant Nut. 2011, 11, 129–137. [Google Scholar] [CrossRef]
  8. Guo, Y.; Li, X.; Zhao, Z.; Wei, H.; Gao, B.; Gu, W. Prediction of the potential geographic distribution of the ectomycorrhizal mushroom Tricholoma matsutake under multiple climate change scenarios. Sci. Rep.-Uk 2017, 7, 46221. [Google Scholar] [CrossRef]
  9. Merow, C.; Smith, M.J.; Silander, J.A., Jr. A practical guide to MaxEnt for modeling species’ distributions: What it does, and why inputs and settings matter. Ecography (Copenhagen) 2013, 36, 1058–1069. [Google Scholar] [CrossRef]
  10. Zhao, Z.; Xiao, N.; Shen, M.; Li, J. Comparison between optimized MaxEnt and random forest modeling in predicting potential distribution: A case study with Quasipaa boulengeri in China. Sci. Total Environ. 2022, 842, 156867. [Google Scholar] [CrossRef]
  11. Imani Wa Rusaati, B.; Won Kang, J. MaxEnt modeling for predicting the potential distribution of Lebrunia bushaie Staner (Clusiaceae) under different climate change scenarios in Democratic Republic of Congo. J. Asia-Pac. Biodivers. 2024, 17, 1–6. [Google Scholar] [CrossRef]
  12. Leng, W.; He, H.S.; Bu, R.; Dai, L.; Hu, Y.; Wang, X. Predicting the distributions of suitable habitat for three larch species under climate warming in Northeastern China. Forest Ecol. Manag. 2008, 254, 420–428. [Google Scholar] [CrossRef]
  13. Adams-Phillips, L.; Barry, C.; Giovannoni, J. Signal transduction systems regulating fruit ripening. Trends Plant Sci. 2004, 9, 331–338. [Google Scholar] [CrossRef]
  14. Wiśniewski, P.; Märker, M. Comparison of Topsoil Organic Carbon Stocks on Slopes under Soil-Protecting Forests in Relation to the Adjacent Agricultural Slopes. Forests 2021, 12, 390. [Google Scholar] [CrossRef]
  15. Iturbide, M.; Gutiérrez, J.M.; Alves, L.M.; Bedia, J.; Cerezo-Mota, R.; Cimadevilla, E.; Cofiño, A.S.; Di Luca, A.; Faria, S.H.; Gorodetskaya, I.V.; et al. An update of IPCC climate reference regions for subcontinental analysis of climate model data: Definition and aggregated datasets. Earth Syst. Sci. Data 2020, 12, 2959–2970. [Google Scholar] [CrossRef]
  16. Tu, W.; Xiong, Q.; Qiu, X.; Zhang, Y. Dynamics of invasive alien plant species in China under climate change scenarios. Ecol. Indic. 2021, 129, 107919. [Google Scholar] [CrossRef]
  17. Naasko, K.I.; Naylor, D.; Graham, E.B.; Couvillion, S.P.; Danczak, R.; Tolic, N.; Nicora, C.; Fransen, S.; Tao, H.; Hofmockel, K.S.; et al. Influence of soil depth, irrigation, and plant genotype on the soil microbiome, metaphenome, and carbon chemistry. Mbio 2023, 14, e175823. [Google Scholar] [CrossRef] [PubMed]
  18. Wei, X.; Xu, D.; Liu, Q.; Wu, Y.; Zhuo, Z. Predicting the potential distribution range of Batocera horsfieldi under CMIP6 climate change using the MaxEnt model. J. Econ. Entomol. 2024, 117, 187–198. [Google Scholar] [CrossRef]
  19. Liu, D.; Zeng, Y.; Qiu, C.; Lin, Q. Molecular Cloning and Adversity Stress Expression Analysis of SPDS Genes in Mulberry (Morus notabilis). Russ. J. Plant Physiol. 2021, 68, 1186–1193. [Google Scholar] [CrossRef]
  20. Li, H.; Wang, Q.; Li, M.; Zang, X.; Wang, Y. Identification of urban waterlogging indicators and risk assessment based on MaxEnt Model: A case study of Tianjin Downtown. Ecol. Indic. 2024, 158, 111354. [Google Scholar] [CrossRef]
  21. Lihui, M.; Xiaoli, L.; Jie, C.; Youke, W.; Jingui, Y. Effects of Slope Aspect and Rainfall on Belowground Deep Fine Root Traits and Aboveground Tree Height. Front. Plant Sci. 2021, 12, 684468. [Google Scholar] [CrossRef] [PubMed]
  22. Gao, H.; Qian, Q.; Liu, L.; Xu, D. Predicting the Distribution of Sclerodermus sichuanensis (Hymenoptera: Bethylidae) under Climate Change in China. Insects 2023, 14, 475. [Google Scholar] [CrossRef] [PubMed]
  23. Shishir, S.; Mollah, T.H.; Tsuyuzaki, S.; Wada, N. Predicting the probable impact of climate change on the distribution of threatened Shorea robusta forest in Purbachal, Bangladesh. Glob. Ecol. Conserv. 2020, 24, e1250. [Google Scholar] [CrossRef]
  24. Vanhaelewyn, L.; Prinsen, E.; Van Der Straeten, D.; Vandenbussche, F. Hormone-controlled UV-B responses in plants. J. Exp. Bot. 2016, 67, 4469–4482. [Google Scholar] [CrossRef]
  25. Jain, M.; Bansal, J.; Rajkumar, M.S.; Sharma, N.; Khurana, J.P.; Khurana, P. Draft genome sequence of Indian mulberry (Morus indica) provides a resource for functional and translational genomics. Genomics 2022, 114, 110346. [Google Scholar] [CrossRef]
  26. He, D.; Jiang, M.; Wei, X. A dendroclimatic investigation of radial growth—climate relationships for the riparian species Cercidiphyllum japonicum in the Shennongjia area, central China. Trees (Berlin, West) 2012, 26, 503–512. [Google Scholar] [CrossRef]
  27. Tatsumi, C.; Azuma, W.A.; Ogawa, Y.; Komada, N. Nitrogen Availability and Microbial Communities of Canopy Soils in a Large Cercidiphyllum japonicum Tree of a Cool-Temperate Old Growth Forest. Microb. Ecol. 2021, 82, 919–931. [Google Scholar] [CrossRef]
  28. Zhu, S.; Chen, J.; Zhao, J.; Comes, H.P.; Li, P.; Fu, C.; Xie, X.; Lu, R.; Xu, W.; Feng, Y.; et al. Genomic insights on the contribution of balancing selection and local adaptation to the long-term survival of a widespread living fossil tree, Cercidiphyllum japonicum. New Phytol. 2020, 228, 1674–1689. [Google Scholar] [CrossRef]
  29. Gerber, R.; Piscart, C.; Roussel, J.; Georges, R.; Houet, T.; Royer, J.; Bergerot, B. Landscape models can predict the distribution of aquatic insects across agricultural areas. Landsc. Ecol. 2023, 38, 2917–2929. [Google Scholar] [CrossRef]
  30. Sharma, R.; Khan, S.; Kaul, V. Predicting the potential habitat suitability and distribution of “Weed-Onion” (Asphodelus tenuifolius Cavan.) in India under predicted climate change scenarios. J. Agric. Food Res. 2023, 14, 100697. [Google Scholar] [CrossRef]
  31. Deng, X.; Xu, D.; Liao, W.; Wang, R.; Zhuo, Z. Predicting the distributions of Scleroderma guani (Hymenoptera: Bethylidae) under climate change in China. Ecol. Evol. 2022, 12, e9410. [Google Scholar] [CrossRef] [PubMed]
  32. Liu, Z.; Zhang, Q.; Wu, X.; Yu, W.; Guo, S. Insecticidal Mechanism of Wintergreen Oil Against the Health Pest Paederus fuscipes (Coleoptera: Staphylinidae). J. Med. Entomol. 2018, 55, 155–162. [Google Scholar] [CrossRef] [PubMed]
  33. Liu, S.; Chen, T.; Ye, D.; Chen, Q.; Ni, J.; Rao, M. Prediction of distributional patterns of four major Camellia oilseed species in China under climate and land use changes. Ecol. Indic. 2023, 155, 110996. [Google Scholar] [CrossRef]
  34. Ab Lah, N.Z.; Yusop, Z.; Hashim, M.; Mohd Salim, J.; Numata, S. Predicting the Habitat Suitability of Melaleuca cajuputi Based on the MaxEnt Species Distribution Model. Forests 2021, 12, 1449. [Google Scholar] [CrossRef]
  35. Zhuo, Z.; Xu, D.; Pu, B.; Wang, R.; Ye, M. Predicting distribution of Zanthoxylum bungeanum Maxim. in China. Bmc Ecol. 2020, 20, 46. [Google Scholar] [CrossRef]
  36. Soilhi, Z.; Sayari, N.; Benalouache, N.; Mekki, M. Predicting current and future distributions of Mentha pulegium L. in Tunisia under climate change conditions, using the MaxEnt model. Ecol. Inform. 2022, 68, 101533. [Google Scholar] [CrossRef]
  37. Mapunda, K.K.; Andrew, S.M. Predicting the distribution of critically endangered tree species Karomia gigas under climate change in Tanzania. Ecol. Eng. 2023, 195, 107065. [Google Scholar] [CrossRef]
  38. Kirillov, V.; Massalova, V.; Pathak, A.; Ivashchenko, A.; Kabanova, S.; Rakhimzhanov, A.; Stikhareva, T. Insights into ex situ conservation and MaxEnt-based habitat suitability modeling of Prunus ulmifolia Franch. (Rosaceae Juss.): A Central Asian relict species. Trees For. People 2025, 20, 100901. [Google Scholar] [CrossRef]
  39. Curty, C.; Engel, N. Detection, isolation and structure elucidation of a chlorophyll a catabolite from autumnal senescent leaves of Cercidiphyllum japonicum. Phytochemistry 1996, 42, 1531–1536. [Google Scholar] [CrossRef]
  40. Xia, Z.; Dai, X.; Fan, W.; Liu, C.; Zhang, M.; Bian, P.; Zhou, Y.; Li, L.; Zhu, B.; Liu, S.; et al. Chromosome-level Genomes Reveal the Genetic Basis of Descending Dysploidy and Sex Determination in Morus Plants. Genom. Proteom. Bioinf 2022, 20, 1119–1137. [Google Scholar] [CrossRef]
  41. Islam, K.N.; Rana, L.R.S.; Islam, K.; Hossain, M.S.; Hossain, M.M.; Hossain, M.A. Climate change and the distribution of two Ficus spp. in Bangladesh—Predicting the spatial shifts. Trees For. People 2021, 4, 100086. [Google Scholar] [CrossRef]
  42. Chakraborty, A.; Joshi, P.K.; Sachdeva, K. Predicting distribution of major forest tree species to potential impacts of climate change in the central Himalayan region. Ecol. Eng. 2016, 97, 593–609. [Google Scholar] [CrossRef]
  43. Cajigas Gandia, A.; Alonso Bosch, R.; Mancina, C.A.; Herrel, A. Climatic variation along the distributional range in Cuban Anolis lizards: Species and ecomorphs under future scenarios of climate change. Glob. Ecol. Conserv. 2023, 42, e2401. [Google Scholar] [CrossRef]
  44. Lin, L.; Xiao-Long, J.; Kai-Qi, G.; Amy, B.; Min, D. Climate change impacts the distribution of Quercus section Cyclobalanopsis (Fagaceae), a keystone lineage in East Asian evergreen broadleaved forests. Plant Diversity 2023, 45, 552–568. [Google Scholar] [CrossRef] [PubMed]
  45. Swart, C.; Donaldson, J.; Barker, N. Predicting the distribution of Encephalartos latifrons, a critically endangered cycad in South Africa. Biodivers. Conserv. 2018, 27, 1961–1980. [Google Scholar] [CrossRef]
  46. Zhao, H.; Xian, X.; Guo, J.; Yang, N.; Zhang, Y.; Chen, B.; Huang, H.; Liu, W. Monitoring the little fire ant, Wasmannia auropunctata (Roger 1863), in the early stage of its invasion in China: Predicting its geographical distribution pattern under climate change. J. Integr. Agric. 2023, 22, 2783–2795. [Google Scholar] [CrossRef]
  47. Ries, G.; Heller, W.; Puchta, H.; Sandermann, H.; Seidlitz, H.K.; Hohn, B. Elevated UV-B radiation reduces genome stability in plants. Nature 2000, 406, 98–101. [Google Scholar] [CrossRef] [PubMed]
  48. Oishy, M.N.; Shemonty, N.A.; Fatema, S.I.; Mahbub, S.; Mim, E.L.; Raisa, M.B.H.; Anik, A.H. Unravelling the effects of climate change on the soil-plant-atmosphere interactions: A critical review. Soil. Environ. Health 2025, 3, 100130. [Google Scholar] [CrossRef]
  49. Zheng, S.; Zhu, Y.; Liu, C.; Fan, W.; Xiang, Z.; Zhao, A. Genome-wide identification and characterization of genes involved in melatonin biosynthesis in Morus notabilis (wild mulberry). Phytochemistry 2021, 189, 112819. [Google Scholar] [CrossRef]
  50. Gao, H. Method of improving the conversion of Cadmium-containing plant biomass energy under the background of soil pollution. Energy Rep. 2022, 8, 10803–10811. [Google Scholar] [CrossRef]
  51. Hu, X.; Zhang, C.; Shu, Z.; Zhang, Y.; Li, B.; Chu, C. Habitat analysis and conservation priorities for the endangered spotted linsang in China. Glob. Ecol. Conserv. 2024, 56, e3320. [Google Scholar] [CrossRef]
Figure 1. Geographical distribution points of C. japonicum. The green dots represent occurrence records of C. japonicum.
Diversity 17 00467 g001
Figure 2. ROC curve verification of 19 bioclimatic variables.
Diversity 17 00467 g002
Figure 3. ROC curve of potential distribution prediction for C. japonicum.
Diversity 17 00467 g003
Figure 4. Current suitable climatic distribution of C. japonicum in China. The probability of occurrence is illustrated by a color scale: red indicates high suitability, green indicates medium suitability, blue indicates low suitability, and white denotes unsuitable areas. The inset map displays the geographic location of the study area within China, providing spatial context for the main distribution map.
Diversity 17 00467 g004
Figure 5. Potential distribution of C. japonicum in the future (2050s and 2090s) under three climate change scenarios: SSP1-2.6, SSP2-4.5, and SSP5-8.5. Suitability levels are represented by a color gradient (red: high, green: medium, blue: low, white: unsuitable).
Diversity 17 00467 g005
Figure 6. Importance of environmental variables to C. japonicum by the jackknife test.
Diversity 17 00467 g006
Figure 7. Response curves of the environmental variables that contributed most to the MaxEnt models. Red, the mean response across 10 replicate MaxEnt runs. Blue, the mean +/− one standard deviation.
Diversity 17 00467 g007
Figure 8. The change in the centroid of the potential distribution area of C. japonicum in China.
Diversity 17 00467 g008
Table 1. Percentage contribution and permutation importance of screened climate variables in the MaxEnt model for C. japonicum. These metrics are calculated by MaxEnt software to evaluate the relative influence of each variable on the species distribution prediction.
Bio-Climatic VariablesAbbreviationPercent
Contribution/%
Permutation
Importance/%
Annual Precipitation Bio12 38.4 33.8
Min Temperature of Coldest Month Bio6 19.5 0.1
Temperature Annual Range (bio5–bio6) Bio7 12.9 10.5
Mean Temperature of Warmest Quarter Bio10 10.1 10.4
Mean Temperature of Driest Quarter Bio9 8.7 0
Isothermality (bio2/bio7) (×100) Bio3 4.3 4.7
Precipitation of Coldest Quarter Bio19 1.7 7.6
Precipitation Seasonality (Coefficient of Variation) Bio15 1.3 2.1
Temperature Seasonality (SD ×100) Bio4 0.8 3.8
Precipitation of Wettest Month Bio13 0.8 12.8
Mean Temperature of Coldest Quarter Bio11 0.7 0.1
Temperature Mean Diurnal Range (Mean of Monthly [max temp–min temp]) Bio2 0.3 5.6
Precipitation of Warmest Quarter Bio18 0.3 5.7
Precipitation of Driest Quarter Bio17 0.1 1.2
Max Temperature of Warmest Month Bio5 0.1 0
Precipitation of Driest Month Bio14 0.1 1.2
Mean Temperature of Wettest Quarter Bio8 0.1 0.3
Annual Mean Temperature Bio1 0 0.1
Precipitation of Wettest Quarter Bio16 0 0
Table 2. Environmental variables used to predict the distribution of C. japonicum.
Variable ClassificationEnvironmental VariablesUnitAbbreviation
Bio-climatic variables Mean Temperature of Warmest Quarter mmBio10
Annual Precipitation mmBio12
Precipitation of Wettest Month mmBio13
Precipitation Seasonality (Coefficient of Variation) mmBio15
Precipitation of Coldest Quarter mmBio19
Mean Diurnal Range (Mean of Monthly [max temp–min temp]) °CBio2
Isothermality (bio2/bio7) (×100)%Bio3
Min Temperature of Coldest Month°CBio6
Temperature Annual Range (bio5–bio6) °CBio7
Soil variablesSoil Reference DepthmRef-depth
Soil Acidity and AlkalinityN/ApH
Upper Soil Sediment Content%wt.T-sand
Organic Carbon Content%wt.TOC
Soil Evaluation IndicatorsN/AUSDA
Terrain variablesAltitudemAlt
physical/solar radiation variableUltraviolet-B RadiationnmUV-B
Human variablesHuman FootprintN/AHf
Table 3. Contribution percentage and ranking importance of environmental variables affecting the distribution of C. japonicum.
Variable ClassificationAbbreviationPercent
Contribution/%
Permutation
Importance/%
Annual Precipitation Bio12 34 9.3
Min Temperature of Coldest Month Bio6 19.5 14.9
Human Footprint hf 15 15
Altitude alt 12.6 23.7
Ultraviolet-B Radiation UV-B 7.5 16.3
Temperature Annual Range (Bio5–Bio6) Bio7 5.7 9.6
Isothermality (Bio2/Bio7) (×100) Bio3 2.5 0.8
Soil Reference Depth Ref-depth 1.2 0.5
Organic Carbon Content TOC 0.4 0.5
Mean Temperature of Warmest Quarter Bio10 0.4 1.2
Precipitation Seasonality (Coefficient of Variation) Bio15 0.3 1.1
Precipitation of Coldest Quarter Bio19 0.2 1
Soil Evaluation Indicators USDA 0.2 0.9
Upper Soil Sediment Content T-sand 0.2 1.2
Soil Acidity and Alkalinity PH 0.1 0.1
Mean Diurnal Range (Mean of Monthly [max temp–min temp]) Bio2 0.1 3.2
Precipitation of Wettest Month Bio13 0.1 0.6
Table 4. Predicted suitability for C. japonicum in China under current climate conditions.
ProvinceHigh Suitable Area (km2)Medium
Suitable Area (km2)
Low
Suitable Area (km2)
No Suitable Area (km2)Percentage of High Suitable Areas in
Province (%)
Percentage of Total Suitable Areas in China (%)
Sichuan36504296747110,81113.916 58.781
Gansu14192324335416,8245.932 29.668
Shanxi10803430289943319.199 63.109
Hubei9772746344029529.659 70.816
Yunnan6341673578211,6573.211 40.965
Chongqing4581506191158110.278 86.961
Guizhou3061535555118023.328 80.400
Hunan213754463355681.907 50.143
Henan1811116350444891.948 51.679
Jiangsu180912127631863.241 42.636
Xizang16835472664,6010.255 1.895
Zhejiang139551266819932.598 62.755
Shaanxi130576273957461.414 37.482
Qinghai128260107039,6340.311 3.548
Shandong115603212359931.302 32.160
Anhui107818223145411.390 41.003
Jiangxi89289201764011.012 27.228
Tianjin8514818828112.108 59.972
Beijing812004113008.165 69.758
Hebei49370190489810.433 20.550
Fujian256063655080.401 11.575
Liaoning2010154183200.223 7.370
Guangxi154877811,2070.125 6.980
Shanghai12172110413.582 87.761
Ningxia86645725030.264 17.502
Jilin238712,1710.016 0.750
Taiwan2917316310.110 10.138
Guangdong11914586370.011 1.875
Heilongjiang101031,2780.003 0.035
Hainan00015610.000 0.000
Inner Mongolia006874,3020.000 0.091
Xinjiang06948100,2040.000 0.943
Hong Kong000520.000 0.000
China10,27524,94559,851458,0350.107 0.989
Table 5. Predicted suitable areas for C. japonicum under current and future climatic conditions.
Predicted Area (km2)Comparison with Current Distribution (%)
DecadeScenariosHigh Suitable Medium Suitable Low Suitable High SuitableMedium SuitableLow Suitable
current 10,27524,94559,851
2050sSSP1-2.616,82143,08694,73863.70872.72458.290
SSP2-4.510,16023,67462,092−1.119−5.0953.744
SSP5-8.516,40547,25995,57359.65989.45259.684
2090sSSP1-2.610,45220,26658,8441.722−18.757−1.682
SSP2-4.510,66321,91961,8273.776−12.1313.301
SSP5-8.510,02921,08656,258−2.394−15.470−6.003
Table 6. A suitable range of environmental variables for the potential distribution of C. japonicum.
Environmental VariablesSuitable Range Optimum Value
Min Temperature of Coldest Month (bio6)/°C−12.225–3.132−3.175
Annual Precipitation (bio12)/mm611.111–1732.320813.131
Temperature Annual Range (bio5–bio6) (bio7)/°C21.343–35.94027.456
Table 7. Under climate change scenarios, the centroid displacement trajectory of C. japonicum suitable habitats.
ScenePeriod of TimeAngle/°DirectionDisplacement/km
SSP1-2.6Contemporary to 2050s115.06 Northwest127.19
2050s to 2090s288.92 Southeast118.46
Contemporary to 2090s168.45 Northwest15.78
SSP2-4.5Contemporary to 2050s17.47 Northeast138.74
2050s to 2090s107.23 Northwest317.18
Contemporary to 2090s130.89 Northwest345.65
SSP5-8.5Contemporary to 2050s127.76 Northwest159.50
2050s to 2090s135.19 Northwest154.47
Contemporary to 2090s20.60 Northeast21.84
Disclaimer/Publisher’s Note: The statements, opinions and data contained in all publications are solely those of the individual author(s) and contributor(s) and not of MDPI and/or the editor(s). MDPI and/or the editor(s) disclaim responsibility for any injury to people or property resulting from any ideas, methods, instructions or products referred to in the content.

