Article

Phylogeography of the Endangered Endemic Perkinsiodendron macgregorii Based on Chloroplast Genome Data

1
Henan Key Laboratory of Tea Plant Biology, College of Tea and Food Science, Xinyang Normal University, Xinyang 464000, China
2
Dabie Mountain Laboratory, College of Tea and Food Science, Xinyang Normal University, Xinyang 464000, China
3
College of Tea and Food Science, Xinyang Normal University, Xinyang 464000, China
4
College of Life Science, Xinyang Normal University, Xinyang 464000, China
*
Author to whom correspondence should be addressed.
Diversity 2025, 17(7), 439; https://doi.org/10.3390/d17070439
Submission received: 12 May 2025 / Revised: 17 June 2025 / Accepted: 19 June 2025 / Published: 20 June 2025
(This article belongs to the Section Biodiversity Conservation)

Abstract

:
Perkinsiodendron macgregorii, an endangered Chinese endemic tree with high ornamental and ecological value, faces extinction threats due to its poor natural regeneration and habitat degradation. Despite the urgent need for its conservation, the genetic architecture and population differentiation mechanisms of this taxon remain poorly understood, hindering science-based protection strategies. We conducted comprehensive chloroplast genomic analyses of 134 individuals from 13 natural populations to inform science-based conservation. The chloroplast genome (158,538–158,641 bp) exhibited conserved quadripartite organization, with 113 functional genes and elevated GC contents in IR regions (42.99–43.02%). Population-level screening identified 741 SNPs and 678 indels, predominantly in non-coding regions (89.8%), with three distinct phylogeographic clades revealing north-to-south genetic stratification. The northern clade (Clade A) demonstrates the highest haplotype diversity and nucleotide diversity, followed by the southern clade (Clade C), while the central clade (Clade B) exhibits signals of genetic erosion (Tajima’s D > 3.43). Based on the genetic diversity distribution and phylogenetic tree of extant P. macgregorii, we inferred that the northern populations represent ancestral groups, while the Wuyi Mountains region and Nanling Mountains region served as glacial refugia. It is imperative to implement in situ conservation in these two regions. Additionally, ex situ conservation should involve collecting seed from representative populations across all three clades and establishing isolated cultivation lines for each clade. These findings establish a genomic framework for conserving endangered plants.

1. Introduction

Perkinsiodendron macgregorii (formerly classified under Halesia), a monotypic-genus plant endemic to China, is a rare and endangered species within the family Styracaceae (Ericales, asterids) [1]. This family encompasses other Chinese endemics such as Sinojackia xylocarpa, Rehderodendron macrocarpum, Changiostyrax dolichocarpa, and Melliodendron xylocarpum. Under the APG IV system [2], P. macgregorii is classified into its own genus, Perkinsiodendron, distinct from its North American congeners Halesia carolina and H. diptera, which form a separate clade in molecular phylogenies [3]. Morphological comparisons by Fritsch et al. [4] revealed significant differences in stem, fruit, and floral traits between P. macgregorii and both North American Halesia species and Rehderodendron, prompting its reclassification as the sole member of Perkinsiodendron. This taxonomic revision aligns with phylogenomic analyses based on 79 chloroplast protein-coding genes [5]. The species is morphologically characterized by its elongated or ellipsoid drupes with four fleshy wings, resembling star fruit, hence its vernacular names “false star fruit” and “mountain star fruit”. Additionally, P. macgregorii exhibits abundant white blossoms, a robust root system, and resilience to wind and drought, making it a valuable ornamental tree. Its distribution spans the subtropical regions of China, including the Hunan, Guizhou, Jiangxi, Fujian, Zhejiang, Guangxi, and Guangdong provinces [3]. Despite its ecological and horticultural potential, habitat degradation and poor natural regeneration have led to its classification as a rare and endangered species [6]. Previous studies have focused on cultivation techniques and habitat suitability modeling [7], yet critical knowledge gaps persist regarding its population structure and genetic differentiation patterns, hindering the formulation of science-based conservation strategies.
The chloroplast genome, a semiautonomous genetic system, features a conserved circular double-stranded DNA architecture (typically 120–160 kb) in terrestrial plants. Its structural organization comprises four functional modules: the large single-copy (LSC) and small single-copy (SSC) regions flanked by inverted repeat (IR) regions. Compared to nuclear genomes, chloroplast genomes exhibit marked regional heterogeneity in their evolutionary rates, primarily shaped by differential selective pressures across functional domains. Coding regions, constrained by strong purifying selection to preserve photosynthetic functionality, demonstrate high stability, whereas non-coding regions and intergenic spacers (e.g., trnH-psbA) accumulate elevated variation due to relaxed selection. The IR regions further exhibit reduced evolutionary rates through gene conversion mechanisms [8]. This structural–functional–evolutionary interplay positions chloroplast genomes as ideal molecular markers for resolving plant phylogeny and adaptive evolution [9]. Currently, chloroplast genomes are widely applied in reconstructing deep phylogenetic relationships [10], identifying species via DNA barcoding [11], modeling population genetic dynamics through coalescent theory integrated with ecological niche modeling [10], and detecting hybridization–introgression events [12]. Breakthroughs have been achieved in phylogeographic studies of medicinal plants [13] and in tracing the domestication origins of crops [14].
The chloroplast genome has emerged as a critical tool for conserving rare and endangered plants due to its maternal inheritance, low recombination rate, and moderate nucleotide substitution rates [15]. Advances in sequencing technologies and genome assembly methods have enabled the widespread application of chloroplast genomic sequences as DNA markers for resolving phylogenetic relationships across varying divergence levels [16,17,18]. Chloroplast genomes harbor abundant polymorphisms at interspecific and intraspecific scales, including single-nucleotide polymorphisms (SNPs), insertion/deletion variations (indels), and simple sequence repeats (SSRs), which are instrumental in characterizing genetic diversity and divergence among endangered taxa [19,20]. These markers facilitate the reconstruction of population structures [21,22] and the identification of populations exhibiting the highest diversity and unique haplotypes [23,24], thereby providing a scientific basis for developing effective conservation strategies.
In this study, we sampled 134 individuals from 13 natural populations of P. macgregorii across its primary distribution range in China. The chloroplast genomes were sequenced and assembled to address three objectives: (1) elucidating the structural variation and genetic diversity of P. macgregorii chloroplast genomes; (2) reconstructing the phylogeographic structure and investigating genetic divergence across extant populations; and (3) proposing priority conservation areas and management strategies based on genetic diversity patterns.

2. Materials and Methods

2.1. Sample Collection

A total of 134 individuals from 13 natural populations of Perkinsiodendron macgregorii were sampled across its distribution range (Table S1). Each sampled plant represents an independent biological individual, and DNA was extracted separately from each. Fresh, healthy leaves were collected from each plant, desiccated in silica gel, and stored at −80 °C for subsequent DNA extraction. Total genomic DNA was isolated from each individual sample using a modified CTAB protocol, and its integrity was assessed via 1% (w/w) agarose gel electrophoresis. The DNA from each sample was sheared into 350 bp fragments using ultrasonication. Sequencing libraries for each individual were prepared using the Illumina Novaseq X-plus platform and sequenced on an Illumina HiSeq PE150 system to generate raw paired-end reads. Raw reads were filtered to remove adapter-contaminated sequences, low-quality reads (Phred score < Q20), and reads with >5% ambiguous bases (“N”), yielding high-quality clean reads for downstream analysis.

2.2. Chloroplast Genome Assembly and Physical Map Construction

Clean reads were subjected to de novo chloroplast genome assembly using GetOrganelle [25] with optimized parameters: k-mer values (-k) set to ‘21, 45, 65, 85, 105’ to enhance SPAdes performance. The reference genome ‘embplant_pt’ (plant chloroplast genome) was employed for guidance. For incompletely assembled genomes, SAMtools v1.20 [26] was used to generate bam files at breakpoints for read-depth validation. CPStools [27] was applied to identify and linearly adjust the quadripartite structure (LSC, SSC, IRs) of the chloroplast genomes. Fully assembled sequences were annotated using the online platform CPGAVAS2 [28], with tRNA genes further verified using tRNAscan-SE v1.21 [29].

2.3. Variant Identification and Statistical Analysis

Sequence alignment was performed using MAFFT v7.49 [30] with manual refinement in Se-Al v2.0 [31]. Single-nucleotide polymorphisms (SNPs) and insertion/deletion variants (indels) were analyzed to assess intra- and interspecific variations across the 134 chloroplast genomes. SNPs and indels were quantified using DnaSP v6.12 [32] and MEGA v7.0 [33], with the chloroplast genome of sample JX13 designated as the reference to determine variant positions, frequencies, and orientations. Variant counts in protein-coding and non-coding regions were calculated using CPStools [27], and the results were visualized using R v4.3.1. To evaluate the evolutionary rates across all protein-coding genes, synonymous substitution rates (dS) and nonsynonymous substitution rates (dN) were estimated using the maximum likelihood model implemented in the codeml program of PAML v4.9 [34].

2.4. Codon Usage Bias and Evolutionary Rate Analysis

To minimize redundancy, identical sequences were removed, retaining 25 distinct chloroplast genomes for the codon usage analysis. Shared protein-coding genes were extracted using CPStools, excluding sequences shorter than 300 bp and redundant entries, resulting in 53 coding DNA sequences (CDSs). Relative synonymous codon usage (RSCU) values were computed with CodonW v1.4.4 [35]. RSCU quantifies the deviation of codon usage from random expectation, where values of >1.0 indicate preferential usage, and values of <1.0 reflect underrepresentation compared to synonymous alternatives.
For the evolutionary rate analysis, aligned CDSs were processed using PAML’s codeml to calculate dN and dS. The results were visualized in R, version 4.4. Selection pressures were inferred based on the ω ratio (dN/dS): (1) ω < 1 (dN < dS) indicates purifying selection, suppressing deleterious nonsynonymous mutations; (2) ω = 1 (dN = dS) reflects neutral evolution; and (3) ω > 1 (dN > dS) signifies positive selection, favoring adaptive nonsynonymous substitutions.

2.5. Comparative Analysis of Chloroplast Genome Structure in P. macgregorii Populations

Boundary variations across 25 divergent chloroplast genomes were analyzed and visualized using IRscope [36] (https://irscope.shinyapps.io/irapp/ (accessed on 13 January 2025)). Whole-genome alignments were performed with mVISTA [37] under the shuffle-LAGAN model to assess sequence conservation. Nucleotide diversity (Pi) was calculated using the formula: P i = i < j k i j n 2 L , where kij is the number of nucleotide differences between sequences i and j, n is the number of accessions, and L is the aligned sequence length excluding gaps and missing data. This computes the average number of pairwise nucleotide differences per site across all accessions. Calculations were performed via a sliding window analysis in DnaSP v6.12 [32], with a window length of 600 bp and step size of 200 bp.

2.6. Phylogenetic and Population Structure Analysis

The full chloroplast genomes of the 134 individuals were aligned using MAFFT v7.49. Phylogenetic consensus trees were reconstructed via maximum likelihood (ML) and Bayesian inference (BI). The ML analysis was conducted in IQ-TREE v2.0 [38] with the best-fit substitution model selected using ModelFinder under the Bayesian information criterion. Branch support was evaluated using 1000 ultrafast bootstrap replicates. The BI analysis employed MrBayes v3.2.6 [39], utilizing four Markov chains (two heated, two cold) for 10 million generations, sampling every 1000 generations. The first 25% of the trees were discarded as burn-in, and posterior probabilities (PPs) were calculated from the remaining trees.
Haplotype networks were generated in PopART v1.7 [40] using the TCS algorithm based on the chloroplast haplotypes extracted with DnaSP v6.12. The population structure was assessed using STRUCTURE v2.3.4 [41] with K values ranging from 2 to 10 (10 iterations per K). The parameters included a burn-in of 10,000 followed by 100,000 MCMC replicates. The optimal K was determined via the ΔK method in Structure Harvester, and cluster alignment was performed using CLUMPP. A principal component analysis (PCA) was implemented in PLINK v1.9 [42], with the results visualized using the ggbiplot package in R v4.1.
Genetic diversity indices—polymorphic sites (S), haplotype number (H), haplotype diversity (Hd), and nucleotide diversity (Pi)—were calculated in DnaSP v6.12. Population differentiation was evaluated using Tajima’s D, Fu’s Fs, pairwise FST, and AMOVAs (Analyses of Molecular Variance) in Arlequin v3.5 [43], while Nei’s DA genetic distances were computed in MEGA v7.0.

3. Results

3.1. Structural Features of 134 Chloroplast Genomes in P. macgregorii

The chloroplast genomes of 134 P. macgregorii individuals from 13 natural populations ranged in size from 158,538 to 158,641 bp. The large single-copy (LSC) region spanned 88,122–88,207 bp, the inverted repeat (IR) regions 26,059–26,087 bp, and the small single-copy (SSC) region 18,236–18,300 bp. The overall GC content ranged from 37.22% to 37.25%, with IR regions exhibiting higher GC contents (42.99–43.02%) compared to LSC (35.18–35.21%) and SSC (30.56–30.63%) regions. A total of 114 functional genes were annotated, including 80 protein-coding genes (PCGs), four ribosomal RNA (rRNA) genes (exclusively located in IR regions), and 30 transfer RNA (tRNA) genes, categorized into replication-, photosynthesis-, and metabolism-related functional groups (Table S2). Seven PCGs (ndhB, rpl2, rpl23, rps12, rps7, ycf2, ycf15), four rRNA genes (rrn16, rrn23, rrn4.5, rrn5), and seven tRNA genes (trnI-CAU, trnL-CAA, trnV-GAC, trnI-GAU, trnA-UGC, trnR-ACG, trnN-GUU) were duplicated. Nine PCGs (ndhB, ndhA, petB, petD, atpF, rpl16, rpl2, rps16, rpoC1), and six tRNA genes (trnK-UUU, trnG-GCC, trnL-UAA, trnV-UAC, trnI-GAU, trnA-UGC) contained one intron, while three genes (clpP, rps12, ycf3) harbored two introns.
A comparative analysis of 25 divergent chloroplast genomes revealed structural variations at the LSC/IRb/SSC/IRa boundaries due to IR expansion/contraction (Figure S1). The JSB boundary exhibited population-specific differences: in samples YC11 and NY2, a 38 bp segment of ndhF extended into the IRb region, whereas ndhF was entirely localized to the SSC region in other genomes. The SSC length varied between 18,237 and 18,316 bp, demonstrating greater structural variation compared to the conserved IR regions. The IR regions showed minimal size variation, underscoring their evolutionary stability.

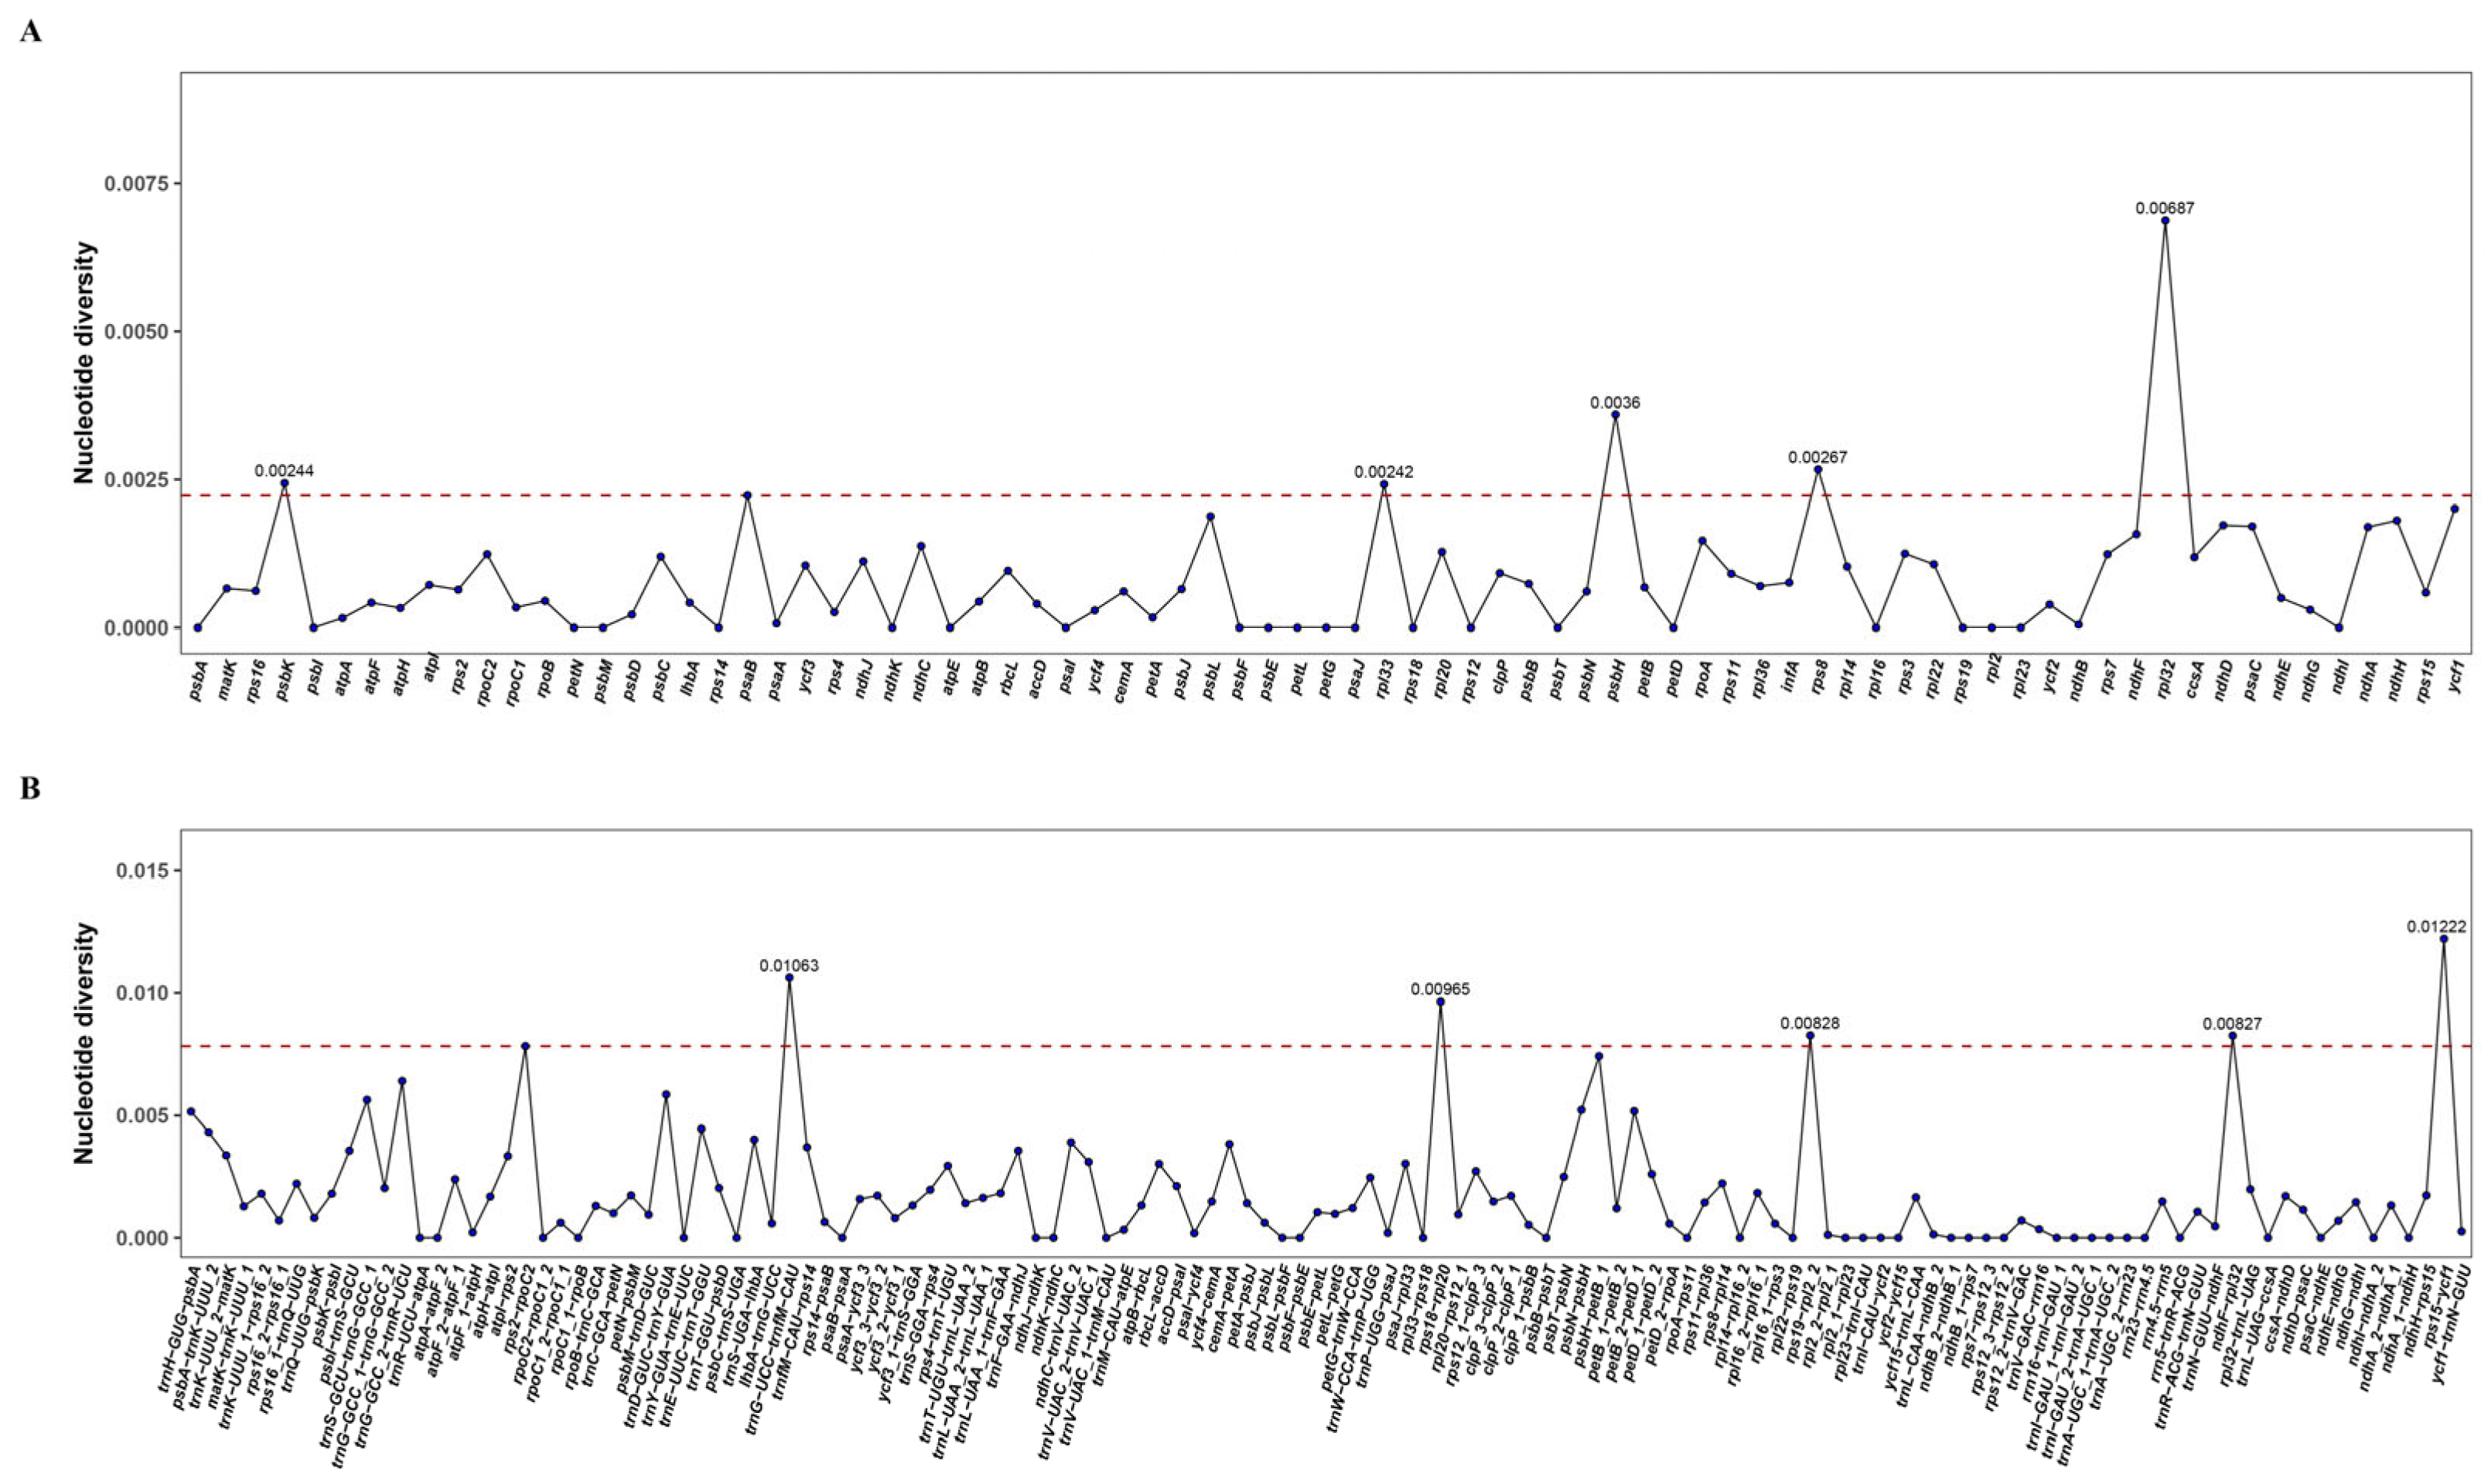
3.2. Chloroplast Genome Variation in P. macgregorii

Alignment of the 134 P. macgregorii chloroplast genomes (total length: 158,956 bp) identified 678 indels (Table 1), with 77.65% localized in the LSC region (497 in LSC, 22 in IRs, 131 in SSC). A total of 741 polymorphic sites were detected, including two singleton variants and 739 parsimony informative sites. Most polymorphisms occurred in the LSC (508, 68.6%), followed by the SSC (21.2%) and IRs (10.2%), with 83.89% of variants located in non-coding regions. The nucleotide diversity (Pi) varied significantly across the regions: the SSC exhibited the highest diversity (Pi = 0.00201), while the IRs showed the lowest (Pi = 0.00031), yielding an overall Pi of 0.00109. The SNP density was markedly reduced in the IRs compared to the LSC and SSC. The psaJ-rpl33 intergenic spacer harbored the highest indel count (84), followed by trnN-GUU-ndhF (63) (Table S3).
The nucleotide diversity analysis using CPStools revealed higher Pi values in non-coding regions than in coding regions. The five most variable intergenic spacers were rps15-ycf1, trnG-UCC-trnfM-CAU, rps18-rpl20, rps19-rpl2_2, and ndhF-rpl32. Among the coding regions, rpl32, psbH, rps8, psbK, and rpl33 displayed the highest Pi values (Figure 1). RNA genes showed negligible diversity, except for trnD-GUC (Pi = 0.00514) and trnS-GCU (Pi = 0.00174). Protein-coding genes exhibited the highest SNP count in ycf1 (52 SNPs: 12 nonsynonymous, 40 synonymous). The SNP density peaked in rps32 and rps8 (12.44 SNPs/kb), followed by rpl33 (9.80 SNPs/kb) (Table 2). These short yet hypervariable genes (rps32, rps8, rpl33) provide robust markers for population structure analyses and marker-assisted selection.
Whole-genome alignments of the 25 divergent chloroplast genomes, performed using mVISTA, demonstrated high sequence similarity across the populations (Figure S2). The genomic coordinates were partitioned as follows: LSC (1–88 kb), IRb (88–114 kb), SSC (114–133 kb), and IRa (133–158 kb). The IR regions were highly conserved, whereas the LSC and SSC exhibited reduced sequence homogeneity, particularly in non-coding regions. The coding genes ycf1, atpA, and ndhF showed lower consistency due to their elevated indel frequencies.

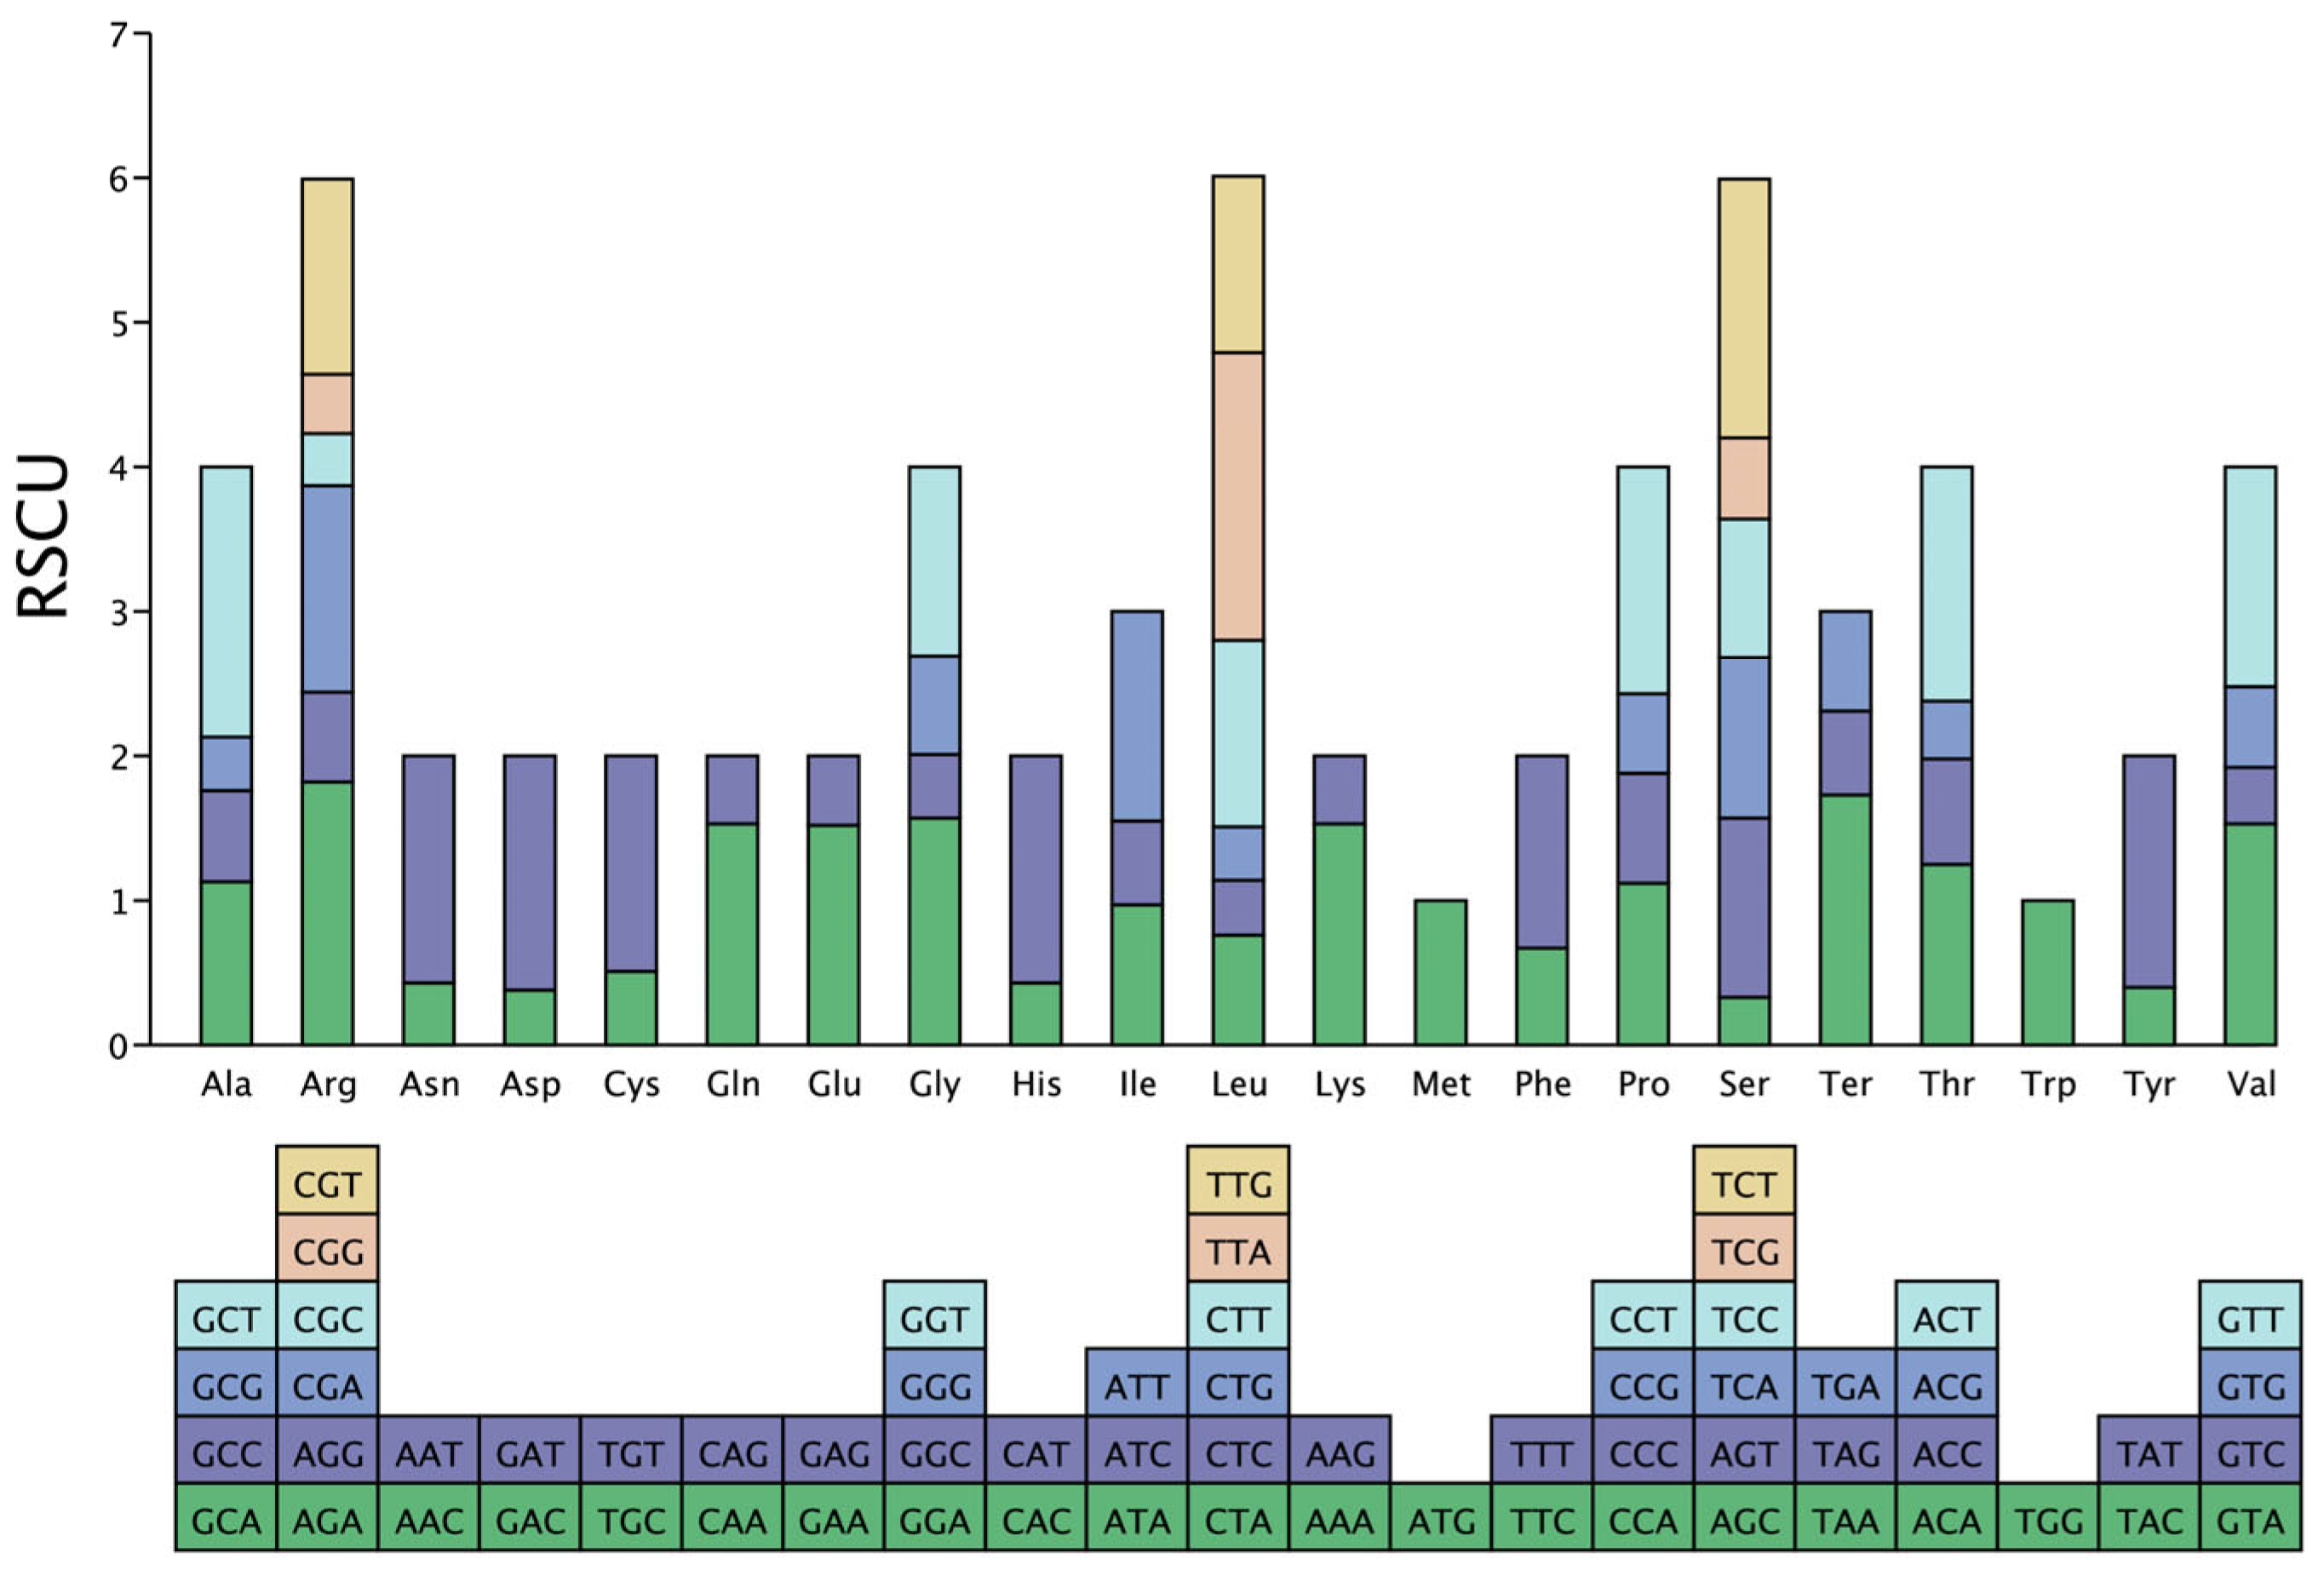
3.3. Codon Usage Bias in P. macgregorii Chloroplast Genomes

The relative synonymous codon usage (RSCU) was analyzed for 52 protein-coding genes (>300 bp) across 25 divergent chloroplast genomes. Serine codons (2719 occurrences) were the most abundant, followed by those for leucine (1962), while cysteine codons (158) were the least frequent (Table S4). Among the 64 codons examined, all amino acids except methionine (ATG) and tryptophan (TGG) (RSCU = 1.00) exhibited codon usage bias (Figure 2). Thirty-one codons showed preferential usage (RSCU > 1), with leucine TTA (RSCU = 1.99) and alanine GCT (RSCU = 1.87) displaying the strongest bias. Conversely, 31 codons were underrepresented (RSCU < 1). Codons with RSCU > 1 predominantly terminated in A/T, whereas those with RSCU < 1 favored C/G endings.

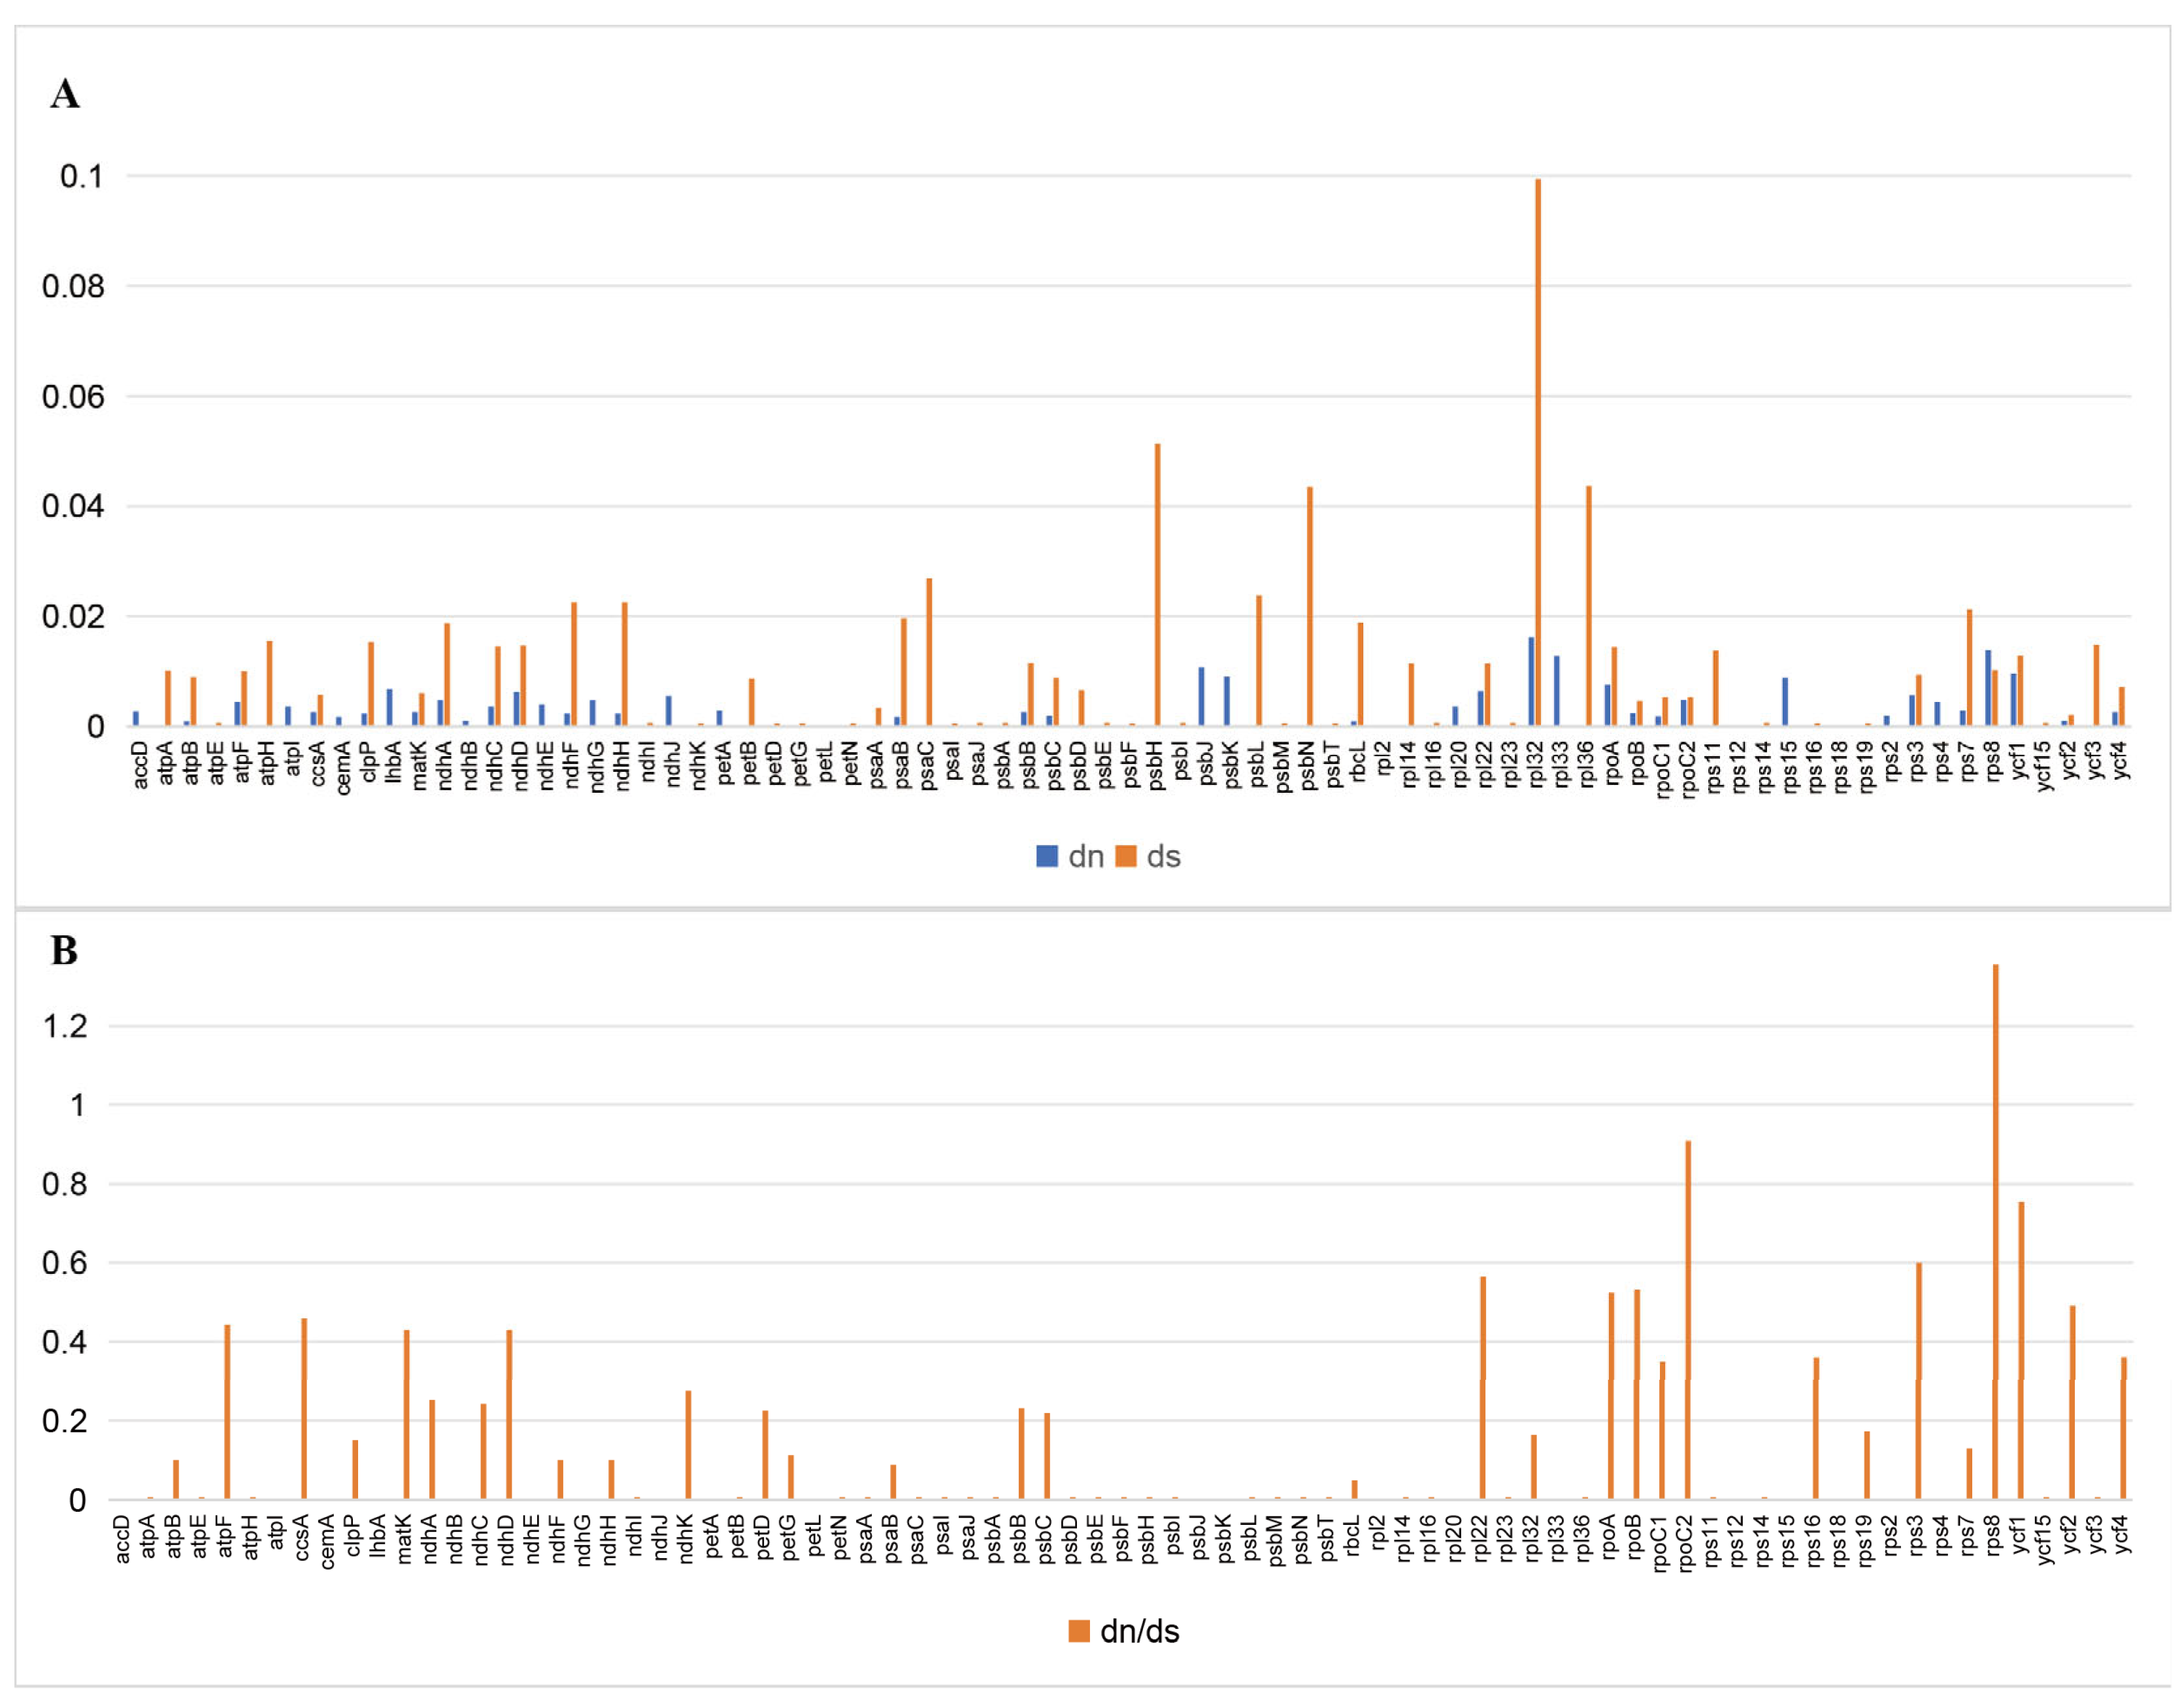
3.4. Adaptive Evolution of Chloroplast Protein-Coding Genes

Synonymous (dS) and nonsynonymous (dN) substitution rates were calculated for 79 protein-coding genes to assess their evolutionary pressures. All the genes exhibited higher dS than dN, indicating predominant purifying selection (Figure 3). The ribosomal gene rpl32 showed the highest dS value (0.0994), exceeding the cumulative dS value of other genes, followed by psbH (0.0513) and rpl36 (0.0513). Notable dN values (>0.01) were observed in rpl32 (0.0162), rps8 (0.0138), rpl33 (0.0127), and psbJ (0.0107). Photosynthesis-related genes (psa, psb) displayed minimal dN values, with only psbJ, psbK, psbB, psbC, and psaB exhibiting nonsynonymous substitutions. Among all the genes, 98% underwent purifying selection (dN/dS < 1), while rps8 demonstrated positive selection (dN/dS = 1.3559).

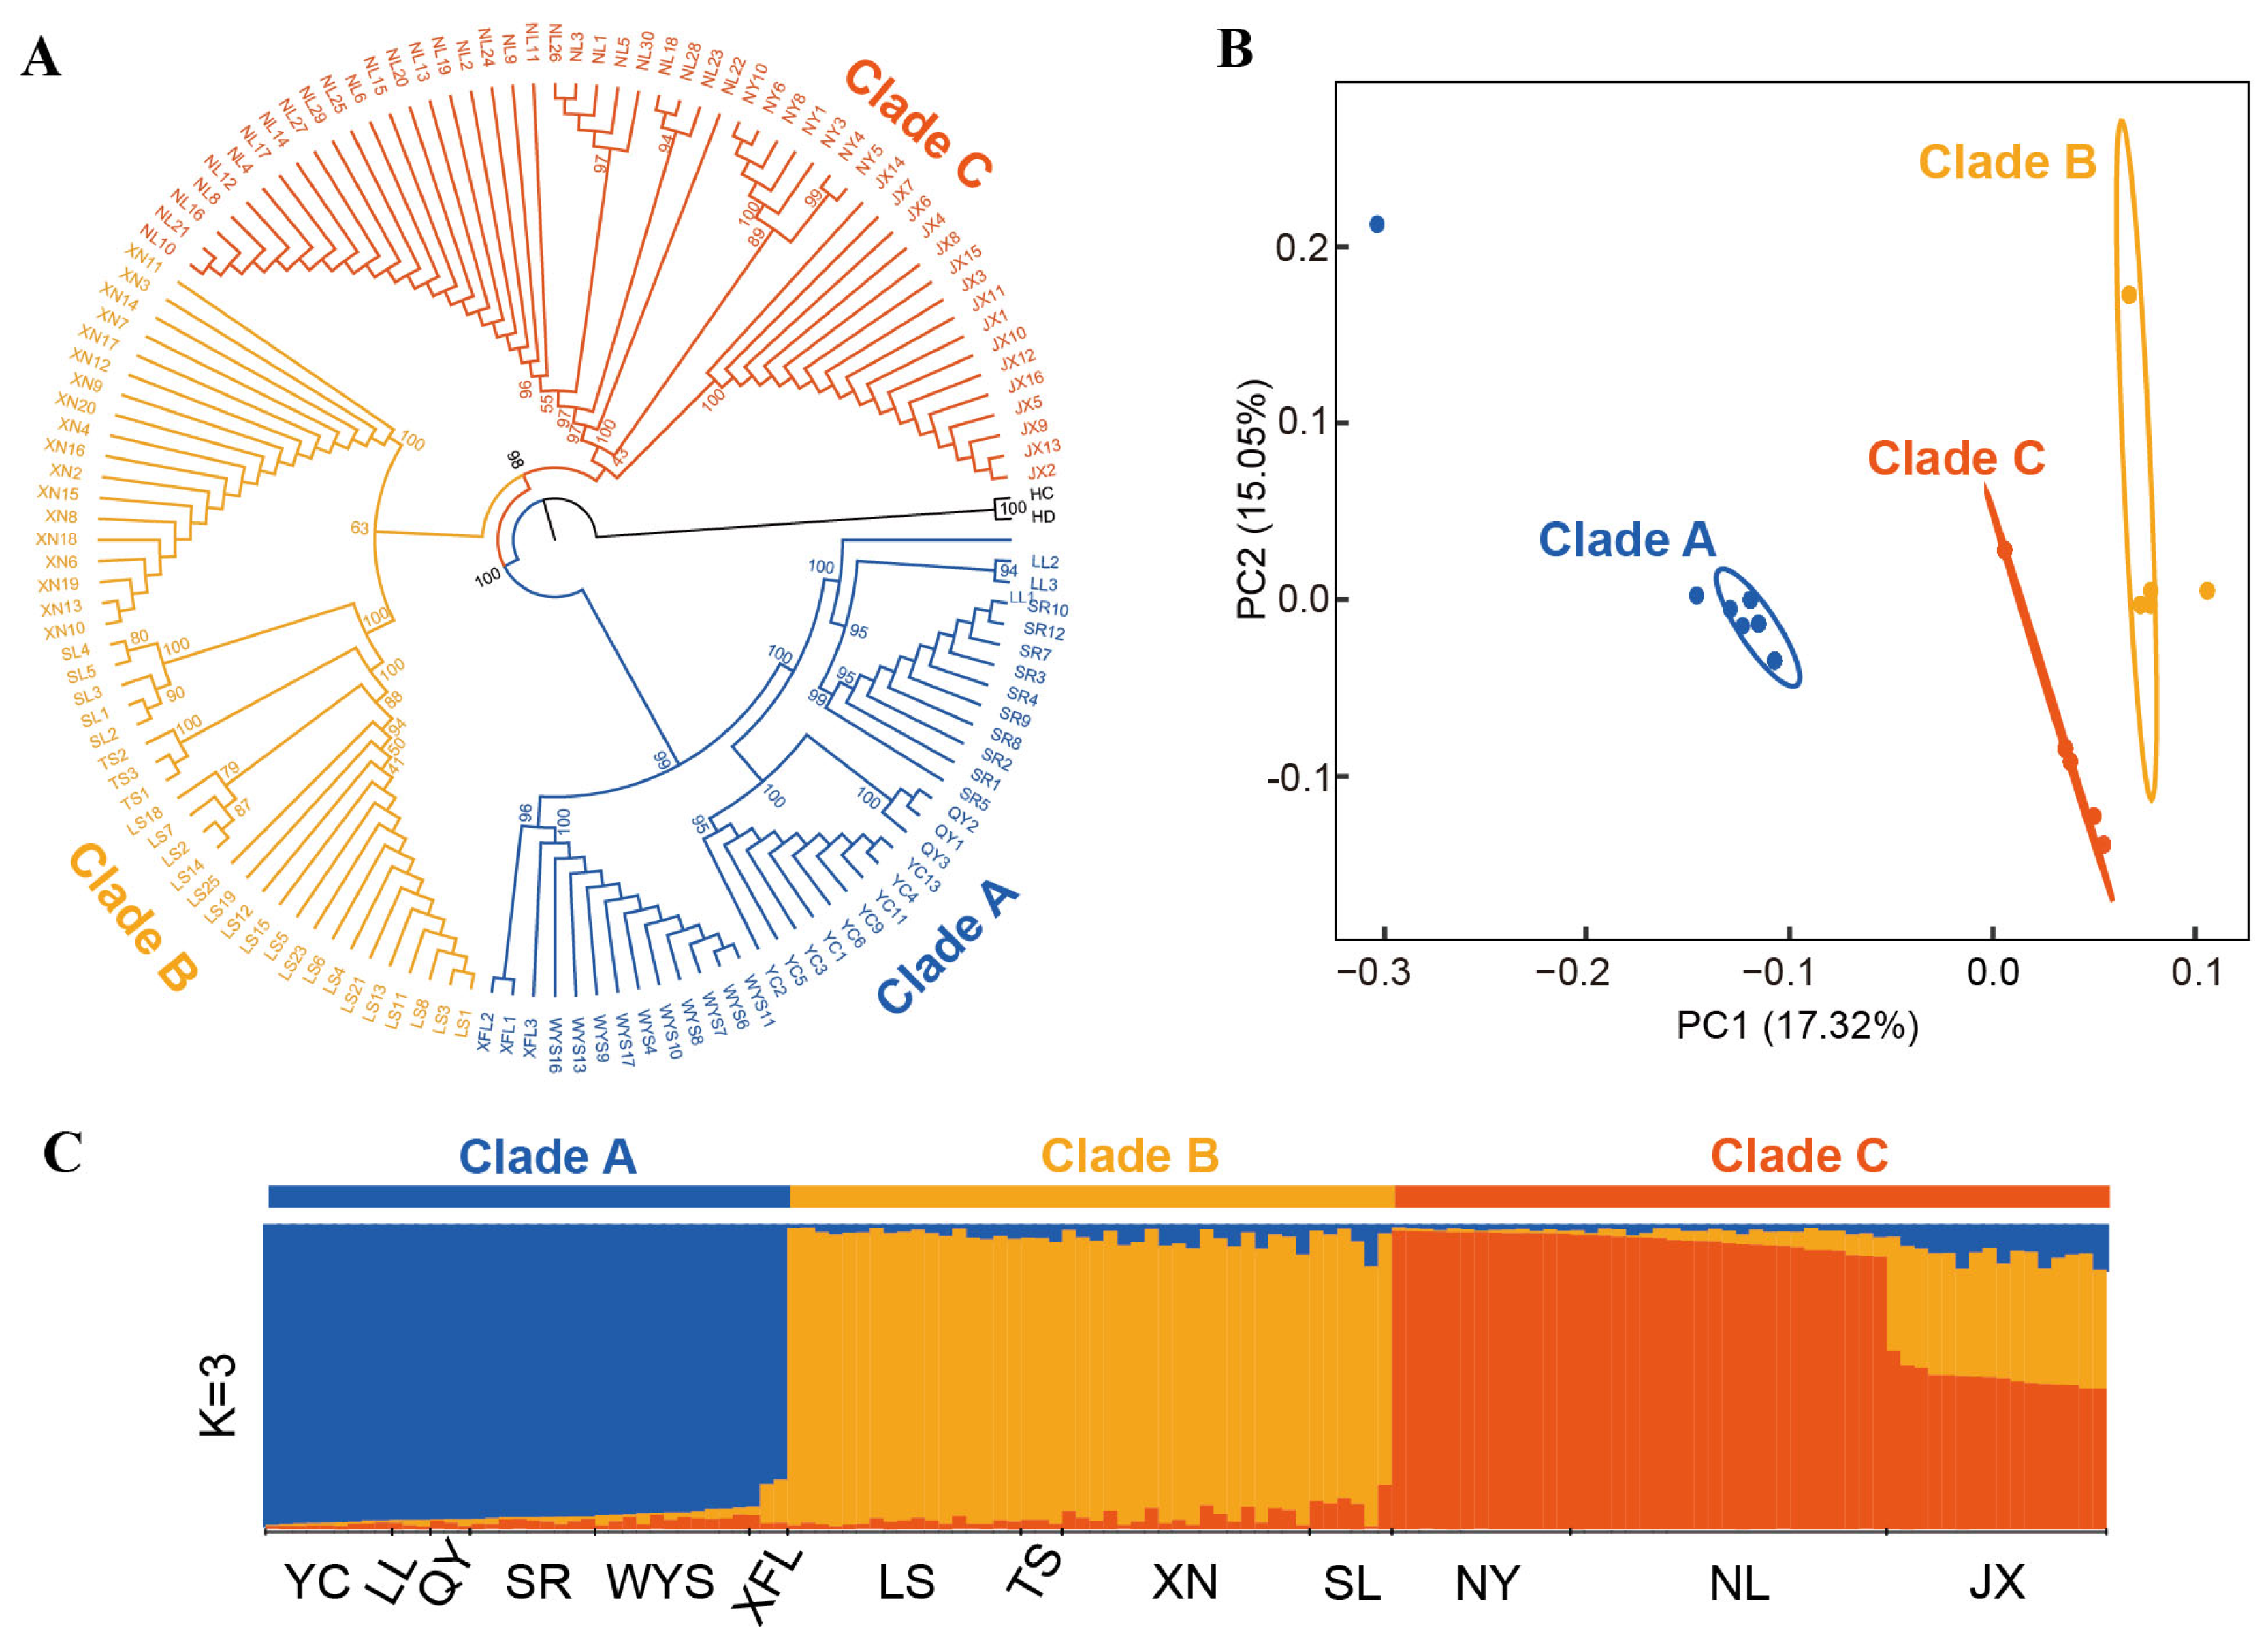
3.5. Phylogenetic Relationships and Population Structure of P. macgregorii Populations

Maximum likelihood (ML) and Bayesian inference (BI) trees constructed from whole-chloroplast-genome (WCG) datasets resolved the P. macgregorii populations into three strongly supported clades (Figure 4 and Figure S3), corresponding to northern (Clade A), central (Clade B), and southern (Clade C) geographical groups (Figure 4 and Figure 5). Clade A comprises six populations (QY, LL, SR, WYS, XFL, YC) distributed in mountainous regions of northern Jiangxi/western Zhejiang and Fujian, harboring seven haplotypes (Table S5). Clade B includes four populations (TS, LS, XN, SL) from southern Hunan/eastern Zhejiang and Fujian, also containing seven haplotypes. Clade C encompasses three populations (JX, NL, NY) in Hunan/northern Guangdong and Guangxi, with seven haplotypes, including the NL population exhibiting the highest haplotype diversity (four haplotypes; Figure S4).
A principal component analysis (PCA) based on the whole-chloroplast-genome sequences further corroborated the tripartite genetic structure, with distinct clustering of the three clades (Figure 4). The first two principal components explained 17.32% (PC1) and 15.05% (PC2) of the variance. PC1 highlighted moderate genetic divergence between Clades B and C but pronounced differentiation between Clades A and B, despite their geographical proximity. A Delta K analysis identified K = 3 as the optimal genetic cluster number (Figure S5), indicating three ancestral genetic components. This population subdivision aligns with the phylogenetic topology and PCA results, demonstrating concordance across these analytical frameworks (Figure 4).

3.6. Genetic Diversity and Differentiation Among Clades

Population genetic analyses revealed distinct patterns of genetic diversity and differentiation across the three clades of P. macgregorii. Clade A, comprising 38 individuals and seven haplotypes, exhibited the highest haplotype diversity (Hd = 0.79943), whereas Clade B showed the lowest (Hd = 0.73150) (Table 3). Clade B displayed the highest nucleotide diversity (Pi = 0.00068), while Clade C had the lowest (Pi = 0.00061). Clade A harbored the greatest genetic variation (292 SNPs, 375 indels), contrasting with Clade B, which showed minimal variation (241 SNPs, 192 indels) (Table 4).
Tajima’s D values were positive for all clades, indicating a significant departure from the neutral evolution model. Notably, Tajima’s D for Clades B and C reached statistical significance (p < 0.05), suggesting stronger historical population size reductions and elevated risks of inbreeding and genetic diversity loss compared to Clade A. Extremely high Fu’s Fs values across all clades further supported the hypothesis of severe bottleneck effects, implying rapid demographic declines in the species’ evolutionary history.
The pairwise FST values (0.16–0.19; Table 5) fell within the high differentiation range (FST > 0.15), reflecting strong genetic isolation among the clades. However, low Nei’s DA values (0.00065–0.00072) indicated limited sequence divergence. This paradox—low sequence divergence coupled with high population differentiation—was corroborated by an AMOVA, which attributed 51.19% of the total genetic variance to inter-clade differences (Table 6).

4. Discussion

4.1. Genetic Diversity in P. macgregorii Chloroplast Genome

The conserved nature and low recombination rate of chloroplast genomes allow them to preserve ancestral genetic signatures, making them ideal systems for investigating long-term evolutionary processes in plant species [44]. Our chloroplast genomic analyses of extant P. macgregorii populations revealed higher nucleotide diversity (Pi = 0.00109) than that found for numerous angiosperms, including Prunus mume (Pi = 0.00011) [45], Pueraria montana (Pi = 0.00055) [46], Lycium barbarum (Pi = 0.00015) [47], Bretschneidera sinensis (Pi = 0.00026) [19], Leonurus cardiaca (Pi = 0.00042) [48], Rosa rugosa (Pi = 0.00054) [49], Viola argenteria (Pi = 0.00081) [50], and Silene cordifolia (Pi = 0.00089) [50], while approximating the levels found in Rhododendron rex (Pi = 0.0018) [51]. A divergence time estimation using a Bayesian relaxed molecular clock approach with fossil calibration indicated that P. macgregorii originated approximately 4 million years ago (Ma) in the Pliocene [5]. This persistence through cyclical glacial–interglacial cycles to the present may account for the elevated nucleotide diversity observed in P. macgregorii chloroplast genomes, as extended evolutionary timeframes facilitate greater accumulation of mutations.
Due to the generally low nucleotide diversity of complete chloroplast genomes, some studies have focused specifically on hypervariable segments to investigate genetic structure, diversity, and phylogenetic relationships [52,53]. The highly variable regions in P. macgregorii are located in intergenic spacers, specifically rps15-ycf1 (0.01222) and trnG-trnM (0.01063). These hypervariable regions differ across species but consistently reside within intergenic spacers. For example, in Toona ciliata populations, the psbA-trnH fragment exhibits the highest nucleotide diversity (0.0303). In Pueraria montana populations, the psbZ-trnS and ccsA-ndhD regions show peak nucleotide diversity values of 0.0027 and 0.0032, respectively. Within the protein-coding genes of the Halesia chloroplast genome, rpl32, rps8, and rpl33 exhibit high SNP densities. Similar hypervariable regions have been reported in Camellia sect. Camellia (rpl33) [54] and Prunus mume (rpl33) [45]. These compact, polymorphic regions represent promising molecular markers for ecotype identification and conservation prioritization [55].
Furthermore, due to functional constraints on core metabolic pathways, photosynthesis-related genes undergo purifying selection [56]. In contrast, the rps8 gene (encoding ribosomal protein S8) in the Halesia chloroplast genome was found to be under positive selection (dN/dS = 1.36). The rps8 gene, encoding a core component of the chloroplast ribosomal small subunit, facilitates ribosome assembly, mRNA binding, and protein synthesis, with potential roles in stress adaptation [57,58]. Although positive selection on the rps8 gene in chloroplast genomes is relatively rare, ribosomal protein genes of the rps class have been reported to be under positive selection in other species—notably, rps11 in Taxus wallichiana [59] and rps4 in Ranunculus [60]. The positive selection acting on rps8 may be associated with the species’ adaptation to local environmental pressures. Future genotype–phenotype association analyses will be required to determine which specific environmental stressors are linked to rps8.

4.2. P. macgregorii Genetic Divergence and Diversity

The Quaternary glaciation commenced approximately 200–300 Ma and concluded 10,000–20,000 years ago, with multiple episodes of temperature increase occurring throughout this period [61]. Plant distributions were influenced by alternating cycles of glacial and interglacial periods. During glacial periods, plant species on the Asian continent migrated southward, while a trend of northward movement was observed during interglacial periods [62]. Refugia are areas where plant species congregated and persisted during the harsh climatic conditions of glacial periods. Following post-glacial warming, plants subsequently dispersed from these refugia to recolonize their habitats [63]. Consequently, refugia typically exhibit higher levels of intraspecific genetic diversity [64]. Phylogenetic and population structure analyses revealed three distinct geographic clades of P. macgregorii: northern (Clade A), central (Clade B), and southern (Clade C). Based on the phylogenetic tree and the geographical distribution of these three clades, we infer that Clade A represents the ancestral population of P. macgregorii. With the onset of glacial conditions, the species expanded southward, giving rise to Clades B and C. Further analyses of nucleotide diversity across the three clades showed that regions of high variation were largely conserved. However, Clade A exhibited the highest nucleotide diversity within these shared regions, followed by Clade C, with Clade B showing the lowest diversity (Figure S6). Concurrently, Clade A possessed the highest haplotype diversity (Hd = 0.799), followed by Clade C and Clade B. Therefore, based on the characteristic signatures of glacial refugia [65], we proposed that the Wuyi Mountains region (harboring Clade A) may have served as a primary glacial refugium for P. macgregorii. Notably, within Clade B, the XN population is geographically disjunct, located southwest of the main cluster comprising the TS, LS, and SL populations. We hypothesize that this geographical disjunction stems from a dual isolation mechanism driven by Quaternary environmental dynamics. First, tectonic events during the Middle to Late Pleistocene, particularly the continued uplift of the Wuyi Mountains following the Himalayan orogeny [66], likely facilitated the southwestward migration of P. macgregorii individuals originating from the Wuyi refugium. This migration wave potentially established the progenitor population that gave rise to the present-day XN population (Clade B). Second, subsequent repeated glacial–interglacial cycles caused populations to undergo expansion and contraction within mountainous habitats, creating significant geographical barriers. This process isolated the migrating XN population from its source populations in the Wuyi region and other Clade B populations (TS, LS, SL). Consequently, the Nanling Mountains region (harboring Clade C) might represent a secondary refugium. The Wuyi and Nanling Mountain regions are widely recognized as glacial refugia [67,68]. Characterized by mild climates, complex topography, and exceptionally high biodiversity, these areas preserve numerous ancient, relict, and rare species [69,70].
The three clades of P. macgregorii exhibit high genetic differentiation. To further investigate the relationship between genetic differentiation among populations and climatic or geographical distance, we conducted IBE (Isolation by Environment) and IBD (Isolation by Distance) analyses using pairwise population genetic differentiation, 19 climatic factors, and geographical distances. However, we found no significant correlation between genetic differentiation in P. macgregorii populations and either climatic or geographical distance (Figure S7). Beyond climate and geographical distance, historical isolation events can play a decisive role in population divergence. For instance, in the genus Populus, geographic isolation resulting from the severing of the Bering Land Bridge and the uplift of the Qinghai–Tibet Plateau led to prolonged isolation and limited gene flow among populations [71]. Such historical events can fragment a large and diverse ancestral population into multiple isolated units, subsequently maintaining high diversity levels within each unit through their independent evolutionary trajectories, even if these units show no apparent correlation with environment or geographic distance. Similarly, in other systems like Fouquieria columnaris and the montane plant Corydalis hendersonii, historical isolation, refugia effects, and expansion–contraction cycles profoundly influenced population structures, resulting in a lack of direct correlation between the intrapopulation nucleotide diversity and the contemporary climate or geographical distance [52]. For P. macgregorii, inhabiting complex mountainous terrain, glacial–interglacial cycling caused its habitat to expand and subsequently fragment into several refugia. Consequently, the observed pattern of genetic differentiation among extant P. macgregorii populations might be associated with this habitat fragmentation and the bottleneck effects revealed in our results.

4.3. Genetic Conservation Strategies

Revealing a species’ genetic divergence and diversity aids in identifying its diversity conservation hotspots and formulating rational conservation strategies [72]. In studies on the genetic diversity and population dynamics of Ginkgo biloba, in situ conservation within its three glacial refugia through the establishment of nature reserves was proposed [73]. Research on Taxus identified the Qinling–Daba–Wushan Mountain corridor as being crucial for maintaining the genetic and ecological integrity of yew species, prompting recommendations for ecological corridors to facilitate migration and gene flow [74]. Based on the geographic genetic structure and diversity patterns of existing P. macgregorii populations, we propose dual strategies of in situ and ex situ conservation. Priority should be given to in situ conservation of the Clade A (Wuyi Mountains) and Clade C (Nanling Mountains) populations by designating targeted conservation subunits or stations within existing protected-area networks. Ecological corridors should be prioritized in Clade B’s distribution zone and its potential connectivity areas with Clades A/C to protect native vegetation and minimize large-scale development. Concurrently, ex situ conservation should involve collecting seed stocks from representative populations across all three clades (A, B, C) and establishing isolated cultivation lines for each clade in controlled environments, such as botanical gardens or arboreta, while maintaining detailed pedigree documentation. Additionally, systematic seed collections from all three clades should undergo long-term cryopreservation in national or regional seed banks.

Supplementary Materials

The following supporting information can be downloaded at: https://www.mdpi.com/article/10.3390/d17070439/s1, Figure S1: Comparison of the border positions of LSC, SSC, and IR regions among the 25 P. macgregorii chloroplast genomes; Figure S2: Visualization of alignment of 25 P. macgregorii chloroplast genomes; Figure S3: The BI tree constructed based on the whole chloroplast genome dataset; Figure S4: The haplotypes and classification of the 134 P. macgregorii chloroplast genomes; Figure S5: The Delta K of structure analysis; Figure S6: Percentage of variable characters (SNPs) in homologous loci Across three clades of the P. macgregorii chloroplast genome. (A) Protein-coding region; (B) non-coding region. The homologous loci are oriented according to their locations in the chloroplast genomes; Figure S7: Isolation-by-distance analyses (IBD) (A) and solation-by-environment analyses (IBE) (B) for P. macgregorii populations; Table S1:Experimental materials and collection sites; Table S2: Genes contained in the P. macgregorii chloroplast genome; Table S3: Highly SNP and indel loci in No-Coding regions of 134 chloroplast genome accessions; Table S4: Codon usage in P. macgregorii chloroplast genome; Table S5: Haplotypes of 134 P. macgregorii.

Author Contributions

Conceptualization, M.-H.Y. and Y.-R.D.; methodology, Y.-R.D.; software, J.-Y.Z.; validation, L.-M.Y., J.-M.S. and K.-X.X.; formal analysis, L.Z.; investigation, M.-H.Y.; resources, M.-H.Y.; data curation, K.-X.X.; writing—original draft preparation, M.-H.Y. and Y.-R.D.; writing—review and editing, M.-H.Y., K.-X.X. and L.Z.; visualization, J.-Y.Z., L.-M.Y. and J.-M.S.; supervision, M.-H.Y.; project administration, M.-H.Y.; funding acquisition, M.-H.Y. All authors have read and agreed to the published version of the manuscript.

Funding

This research was funded by the National Natural Science Foundation of China (31800276), the Open Fund of Dabie Mountain Laboratory (DMLOF2024021), the Natural Science Foundation of Henan Province of China (252300420219), and the Nanhu Scholars Program for Young Scholars of XYNU granted to Ming-Hui Yan.

Data Availability Statement

The raw data supporting the conclusions of this article will be made available by the authors on request.

Institutional Review Board Statement

Not applicable.

Conflicts of Interest

The authors declare no conflicts of interest.

References

  1. Fritsch, P. Styracaceae. In Flowering Plants·Dicotyledons: Celastrales, Oxalidales, Rosales, Cornales, Ericales; Springer: Berlin/Heidelberg, Germany, 2004; pp. 434–442. [Google Scholar]
  2. Chase, M.W.; Christenhusz, M.J.M.; Fay, M.F.; Byng, J.W.; Judd, W.S.; Soltis, D.E.; Mabberley, D.J.; Sennikov, A.N.; Soltis, P.S.; Stevens, P.F. An update of the Angiosperm Phylogeny Group classification for the orders and families of flowering plants: APG IV. Bot. J. Linn. Soc. 2016, 181, 1–20. [Google Scholar] [CrossRef]
  3. Fritsch, P.W.; Morton, C.M.; Chen, T.; Meldrum, C. Phylogeny and biogeography of the Styracaceae. Int. J. Plant Sci. 2001, 162, S95–S116. [Google Scholar] [CrossRef]
  4. Fritsch, P.W.; Yao, X.; Simison, W.B.; Cruz, B.C.; Chen, T. Perkinsiodendron, a new genus in the Styracaceae based on morphology and DNA sequences. J. Bot. Res. Inst. Tex. 2016, 10, 109–117. [Google Scholar]
  5. Yan, M.; Fritsch, P.W.; Moore, M.J.; Feng, T.; Meng, A.; Yang, J.; Deng, T.; Zhao, C.; Yao, X.; Sun, H.; et al. Plastid phylogenomics resolves infrafamilial relationships of the Styracaceae and sheds light on the backbone relationships of the Ericales. Mol. Phylogenet. Evol. 2018, 121, 198–211. [Google Scholar] [CrossRef]
  6. Fu, L. Plant China Plant Red Data Book: Rare and Endangered Plants; Science Publishing House Press: Beijing, China, 1992; p. 741. [Google Scholar]
  7. Wang, L.; Wu, X.; Li, Y.; Xu, X. Prediction of suitable cultivation area for Halesia carolina L. in China. J. Nanjing For. Univ. 2018, 61, 10–16. [Google Scholar] [CrossRef]
  8. Guo, Y.; Yang, J.; Bai, M.; Zhang, G.; Liu, Z. The chloroplast genome evolution of Venus slipper (Paphiopedilum): IR expansion, SSC contraction, and highly rearranged SSC regions. BMC Plant Biol. 2021, 21, 248. [Google Scholar] [CrossRef]
  9. Cauz-Santos, L.A.; da Costa, Z.P.; Sader, M.A.; van den Berg, C.; Vieira, M.L.C. Chloroplast genomic insights into adaptive evolution and rapid radiation in the genus Passiflora (Passifloraceae). BMC Plant Biol. 2025, 25, 192. [Google Scholar] [CrossRef]
  10. Wang, J.; He, W.; Xiang, K.; Wu, Z.; Gu, C. Advances in plant phylogeny in the genome era. J. Zhejiang A&F Univ. 2023, 40, 227–236. [Google Scholar] [CrossRef]
  11. Zhu, S.; Liu, Q.; Qiu, S.; Dai, J.; Gao, X. DNA barcoding: An efficient technology to authenticate plant species of traditional Chinese medicine and recent advances. Chin. Med. 2022, 17, 112. [Google Scholar] [CrossRef]
  12. Gao, J.; Tomlinson, K.W.; Zhao, W.; Wang, B.; Lapuz, R.S.; Liu, J.X.; Pasion, B.O.; Hai, B.T.; Chanthayod, S.; Chen, J.; et al. Phylogeography and introgression between Pinus kesiya and Pinus yunnanensis in Southeast Asia. J. Syst. Evol. 2024, 62, 120–134. [Google Scholar] [CrossRef]
  13. Jiang, X.L.; Xu, G.; Deng, M. Spatial genetic patterns and distribution dynamics of the rare oak Quercus chungii: Implications for biodiversity conservation in Southeast China. Forests 2019, 10, 821. [Google Scholar] [CrossRef]
  14. Moner, A.M.; Furtado, A.; Henry, R.J. Two divergent chloroplast genome sequence clades captured in the domesticated rice gene pool may have significance for rice production. BMC Plant Biol. 2020, 20, 472. [Google Scholar] [CrossRef] [PubMed]
  15. Drouin, G.; Daoud, H.; Xia, J. Relative rates of synonymous substitutions in the mitochondrial, chloroplast and nuclear genomes of seed plants. Mol. Phylogenet. Evol. 2008, 49, 827–831. [Google Scholar] [CrossRef] [PubMed]
  16. Dong, W.; Xu, C.; Wu, P.; Cheng, T.; Yu, J.; Zhou, S.; Hong, D.Y. Resolving the systematic positions of enigmatic taxa: Manipulating the chloroplast genome data of Saxifragales. Mol. Phylogenet. Evol. 2018, 126, 321–330. [Google Scholar] [CrossRef]
  17. Dong, W.; Xu, C.; Wen, J.; Zhou, S. Evolutionary directions of single nucleotide substitutions and structural mutations in the chloroplast genomes of the family Calycanthaceae. BMC Evol. Biol. 2020, 20, 96. [Google Scholar] [CrossRef]
  18. Dong, W.; Liu, Y.; Li, E.; Xu, C.; Sun, J.; Li, W.; Zhou, S.; Zhang, Z.; Suo, Z. Phylogenomics and biogeography of Catalpa (Bignoniaceae) reveal incomplete lineage sorting and three dispersal events. Mol. Phylogenet. Evol. 2022, 166, 107330. [Google Scholar] [CrossRef]
  19. Shang, C.; Li, E.; Yu, Z.; Lian, M.; Chen, Z.; Liu, K.; Xu, L.; Tong, Z.; Wang, M.; Dong, W. Chloroplast genomic resources and genetic divergence of endangered species Bretschneidera sinensis (Bretschneideraceae). Front. Ecol. Evol. 2022, 10, 873100. [Google Scholar] [CrossRef]
  20. Torre, S.; Sebastiani, F.; Burbui, G.; Pecori, F.; Pepori, A.L.; Passeri, I.; Ghelardini, L.; Selvaggi, A.; Santini, A. Novel insights into refugia at the southern margin of the distribution range of the endangered species Ulmus laevis. Front. Plant Sci. 2022, 13, 826158. [Google Scholar] [CrossRef]
  21. Sun, J.; Wang, S.; Wang, Y.; Wang, R.; Liu, K.; Li, E.; Qiao, P.; Shi, L.; Dong, W.; Huang, L.; et al. Phylogenomics and genetic diversity of Arnebiae radix and its allies (Arnebia, Boraginaceae) in China. Front. Plant Sci. 2022, 13, 920826. [Google Scholar] [CrossRef]
  22. Xiao, S.; Xu, P.; Deng, Y.; Dai, X.; Zhao, L.; Heider, B.; Zhang, A.; Zhou, Z.; Cao, Q. Comparative analysis of chloroplast genomes of cultivars and wild species of sweetpotato (Ipomoea batatas [L.] Lam). BMC Genom. 2021, 22, 1–12. [Google Scholar] [CrossRef]
  23. Guo, Q.; Xue, X.; Wang, D.; Zhang, L.; Liu, W.; Wang, E.; Cui, X.; Hou, X. Genetic diversity and population genetic structure of Paeonia suffruticosa by chloroplast DNA simple sequence repeats (cpSSRs). Hort. Plant J. 2025, 11, 367–376. [Google Scholar] [CrossRef]
  24. Yang, R.; Feng, X.; Gong, X. Genetic structure and demographic history of Cycas chenii (Cycadaceae), an endangered species with extremely small populations. Plant Divers. 2017, 39, 44–51. [Google Scholar] [CrossRef] [PubMed]
  25. Jin, J.; Yu, W.; Yang, J.; Song, Y.; DePamphilis, C.W.; Yi, T.; Li, D. GetOrganelle: A fast and versatile toolkit for accurate de novo assembly of organelle genomes. Genome Biol. 2020, 21, 1–31. [Google Scholar] [CrossRef] [PubMed]
  26. Danecek, P.; Bonfield, J.K.; Liddle, J.; Marshall, J.; Ohan, V.; Pollard, M.O.; Whitwham, A.; Keane, T.; McCarthy, S.A.; Davies, R.M.; et al. Twelve years of SAMtools and BCFtools. Gigascience 2021, 10, giab008. [Google Scholar] [CrossRef]
  27. Huang, L.; Yu, H.; Wang, Z.; Xu, W. CPStools: A package for analyzing chloroplast genome sequences. iMetaOmics 2024, 1, e25. [Google Scholar] [CrossRef]
  28. Shi, L.; Chen, H.; Jiang, M.; Wang, L.; Wu, X.; Huang, L.; Liu, C. CPGAVAS2, an integrated plastome sequence annotator and analyzer. Nucleic Acids Res. 2019, 47, W65–W73. [Google Scholar] [CrossRef]
  29. Lowe, T.M.; Eddy, S.R. tRNAscan-SE: A program for improved detection of transfer RNA genes in genomic sequence. Nucleic Acids Res. 1997, 25, 955–964. [Google Scholar] [CrossRef]
  30. Katoh, K.; Standley, D.M. MAFFT multiple sequence alignment software version 7: Improvements in performance and usability. Mol. Biol. Evol. 2013, 30, 772–780. [Google Scholar] [CrossRef]
  31. Rambaut, A. Se-Al: Sequence Alignment Editor. 1996. Available online: http://tree.bio.ed.ac.uk/software/seal/ (accessed on 6 February 2025).
  32. Rozas, J.; Ferrer-Mata, A.; Sánchez-DelBarrio, J.C.; Guirao-Rico, S.; Librado, P.; Ramos-Onsins, S.E.; Sánchez-Gracia, A. DnaSP 6: DNA sequence polymorphism analysis of large data sets. Mol. Biol. Evol. 2017, 34, 3299–3302. [Google Scholar] [CrossRef]
  33. Kumar, S.; Stecher, G.; Tamura, K. MEGA7: Molecular evolutionary genetics analysis version 7.0 for bigger datasets. Mol. Biol. Evol. 2016, 33, 1870–1874. [Google Scholar] [CrossRef]
  34. Yang, Z. PAML 4: Phylogenetic analysis by maximum likelihood. Mol. Biol. Evol. 2007, 24, 1586–1591. [Google Scholar] [CrossRef]
  35. Peden, J.F. Analysis of Codon Usage. Ph.D. Thesis, University of Nottingham, Nottingham, UK, 2000. [Google Scholar]
  36. Amiryousefi, A.; Hyvönen, J.; Poczai, P. IRscope: An online program to visualize the junction sites of chloroplast genomes. Bioinformatics 2018, 34, 3030–3031. [Google Scholar] [CrossRef]
  37. Frazer, K.A.; Pachter, L.; Poliakov, A.; Rubin, E.M.; Dubchak, I. VISTA: Computational tools for comparative genomics. Nucleic Acids Res. 2004, 32, W273–W279. [Google Scholar] [CrossRef]
  38. Xia, E.H.; Li, F.D.; Tong, W.; Li, P.H.; Wu, Q.; Zhao, H.J.; Ge, R.H.; Li, R.P.; Li, Y.Y.; Zhang, Z.Z.; et al. Tea plant information archive: A comprehensive genomics and bioinformatics platform for tea plant. Plant Biotechnol. J. 2019, 17, 1938–1953. [Google Scholar] [CrossRef]
  39. Ronquist, F.; Teslenko, M.; Van Der Mark, P.; Ayres, D.L.; Darling, A.; Höhna, S.; Larget, B.; Liu, L.; Suchard, M.A.; Huelsenbeck, J.P. MrBayes 3.2: Efficient Bayesian phylogenetic inference and model choice across a large model space. Syst. Biol. 2012, 61, 539–542. [Google Scholar] [CrossRef]
  40. Leigh, J.W.; Bryant, D.; Nakagawa, S. POPART: Full-feature software for haplotype network construction. Methods Ecol. Evol. 2015, 6, 1110–1116. [Google Scholar] [CrossRef]
  41. Falush, D.; Stephens, M.; Pritchard, J.K. Inference of population structure using multilocus genotype data: Dominant markers and null alleles. Mol. Ecol. Notes 2007, 7, 574–578. [Google Scholar] [CrossRef]
  42. Chang, C.C.; Chow, C.C.; Tellier, L.C.; Vattikuti, S.; Purcell, S.M.; Lee, J.J. Second-generation PLINK: Rising to the challenge of larger and richer datasets. Gigascience 2015, 4, s13742-015-0047-8. [Google Scholar] [CrossRef]
  43. Excoffier, L.; Lischer, H.E. Arlequin suite ver 3.5: A new series of programs to perform population genetics analyses under Linux and Windows. Mol. Ecol. Resour. 2010, 10, 564–567. [Google Scholar] [CrossRef]
  44. Kavaliauskas, D.; Danusevičius, D.; Baliuckas, V. New insight into genetic structure and diversity of Scots pine (Pinus sylvestris L.) populations in Lithuania based on nuclear, chloroplast and mitochondrial DNA markers. Forests 2022, 13, 1179. [Google Scholar] [CrossRef]
  45. Huang, X.; Coulibaly, D.; Tan, W.; Ni, Z.; Shi, T.; Li, H.; Hayat, F.; Gao, Z. The analysis of genetic structure and characteristics of the chloroplast genome in different Japanese apricot germplasm populations. BMC Plant Biol. 2022, 22, 354. [Google Scholar] [CrossRef] [PubMed]
  46. Sun, J.; Wang, Y.; Qiao, P.; Zhang, L.; Li, E.; Dong, W.; Zhao, Y.; Huang, L. Pueraria montana population structure and genetic diversity based on chloroplast genome data. Plants 2023, 12, 2231. [Google Scholar] [CrossRef] [PubMed]
  47. Yao, R.; Wang, B.; Heinrich, M.; Wang, Q.; Xiao, P. Genetic diversity of food-medicinal Lycium spp. in China: Insights from chloroplast genome. Chin. Herb. Med. 2024, 16, 401–411. [Google Scholar] [CrossRef] [PubMed]
  48. Sun, J.; Wang, Y.; Garran, T.A.; Qiao, P.; Wang, M.; Yuan, Q.; Guo, L.; Huang, L. Heterogeneous genetic diversity estimation of a promising domestication medicinal motherwort Leonurus cardiaca based on chloroplast genome resources. Front. Genet. 2021, 12, 721022. [Google Scholar] [CrossRef]
  49. Xu, J.; Zang, F.; Wu, Q.; Wang, Y.; Wang, B.; Huang, P.; Zang, D.; Ma, Y.; Zheng, Y. Analysis of the genetic diversity and molecular phylogeography of the endangered wild rose (Rosa rugosa) in China based on chloroplast genes. Glob. Ecol. Conserv. 2021, 28, e01653. [Google Scholar] [CrossRef]
  50. Casazza, G.; Grassi, F.; Zecca, G.; Minuto, L. Phylogeographic insights into a peripheral refugium: The importance of cumulative effect of glaciation on the genetic structure of two endemic plants. PLoS ONE 2016, 11, e0166983. [Google Scholar] [CrossRef]
  51. Zhang, X.; Liu, Y.H.; Wang, Y.H.; Shen, S.K. Genetic diversity and population structure of Rhododendron rex Subsp. rex inferred from microsatellite markers and chloroplast DNA sequences. Plants 2020, 9, 338. [Google Scholar] [CrossRef]
  52. Li, Q.; Guo, X.; Niu, J.; Duojie, D.; Li, X.; Opgenoorth, L.; Zou, J. Molecular phylogeography and evolutionary history of the endemic species Corydalis hendersonii (Papaveraceae) on the Tibetan Plateau inferred from chloroplast DNA and ITS sequence variation. Front. Plant Sci. 2020, 11, 436. [Google Scholar] [CrossRef]
  53. Ma, X.; Tang, M.; Bi, Y.; Yang, J. Genetic diversity and population structure analysis of wild Cymbidium tortisepalum based on chloroplast DNA in Yunnan Province of China. J. Amer. Soc. Hort. Sci. 2021, 146, 424–434. [Google Scholar] [CrossRef]
  54. Xiao, X.; Chen, J.; Ran, Z.; Huang, L.; Li, Z. Comparative Analysis of Complete Chloroplast Genomes and Phylogenetic Relationships of 21 Sect. Camellia (Camellia, L.) Plants. Genes 2025, 16, 49. [Google Scholar] [CrossRef]
  55. Stronen, A.V.; Norman, A.J.; Vander Wal, E.; Paquet, P.C. The relevance of genetic structure in ecotype designation and conservation management. Evol. Appl. 2022, 15, 185–202. [Google Scholar] [CrossRef]
  56. Teske, D.; Peters, A.; Mollers, A.; Fischer, M. Genomic profiling: The strengths and limitations of chloroplast genome-based plant variety authentication. J. Agric. Food Chem. 2020, 68, 14323–14333. [Google Scholar] [CrossRef]
  57. Robles, P.; Quesada, V. Unveiling the functions of plastid ribosomal proteins in plant development and abiotic stress tolerance. Plant Physiol. Biochem. 2022, 189, 35–45. [Google Scholar] [CrossRef]
  58. Zhang, Y.; Zhang, A.; Li, X.; Lu, C. The role of chloroplast gene expression in plant responses to environmental stress. Int. J. Mol. Sci. 2020, 21, 6082. [Google Scholar] [CrossRef]
  59. Jia, X.; Feng, S.; Zhang, H.; Liu, X. Plastome phylogenomics provide insight into the evolution of Taxus. Forests 2022, 13, 1590. [Google Scholar] [CrossRef]
  60. Kim, K.-R.; Park, S.Y.; Kim, H.; Hong, J.M.; Kim, S.-Y.; Yu, J.-N. Complete chloroplast genome determination of Ranunculus sceleratus from Republic of Korea (Ranunculaceae) and comparative chloroplast genomes of the members of the Ranunculus Genus. Genes 2023, 14, 1149. [Google Scholar] [CrossRef]
  61. Ehlers, J.; Gibbard, P.; Hughes, P. Quaternary glaciations and chronology. In Past Glacial Environments, 2nd ed.; Elsevier: Amsterdam, The Netherlands, 2018; pp. 77–101. [Google Scholar] [CrossRef]
  62. Fu, J.; Wen, L. Impacts of Quaternary glaciation, geological history and geography on animal species history in continental East Asia: A phylogeographic review. Mol. Ecol. 2023, 32, 4497–4514. [Google Scholar] [CrossRef]
  63. Tang, C.Q.; Matsui, T.; Ohashi, H.; Dong, Y.F.; Momohara, A.; Herrando-Moraira, S.; Qian, S.; Yang, Y.; Ohsawa, M.; Luu, H.T.; et al. Identifying long-term stable refugia for relict plant species in East Asia. Nat. Commun. 2018, 9, 4488. [Google Scholar] [CrossRef]
  64. Fan, D.M.; Yue, J.P.; Nie, Z.L.; Li, Z.M.; Comes, H.P.; Sun, H. Phylogeography of Sophora davidii (Leguminosae) across the ‘Tanaka-Kaiyong Line’, an important phytogeographic boundary in Southwest China. Mol. Ecol. 2013, 22, 4270–4288. [Google Scholar] [CrossRef]
  65. Provan, J.; Bennett, K.D. Phylogeographic insights into cryptic glacial refugia. Trends. Ecol. Evol. 2008, 23, 564–571. [Google Scholar] [CrossRef]
  66. Luo, D.; Xiao, Y.; Zhan, L.; Zhang, L. The tectogenesis control of Danxia landform in southeast China. J. East China Inst. Technol. 2010, 33, 147–153. [Google Scholar] [CrossRef]
  67. Jiang, C.; Wu, M.; He, S.; Lu, Y.; Zhao, C. Phylogeography of a herbal Pinellia ternata reveals repeated range expansions and inter/postglacial recolonization routes on the fragmented distribution pattern in China. Ecol. Evol. 2024, 14, e70206. [Google Scholar] [CrossRef]
  68. Qiu, Y.X.; Fu, C.X.; Comes, H.P. Plant molecular phylogeography in China and adjacent regions: Tracing the genetic imprints of Quaternary climate and environmental change in the world’s most diverse temperate flora. Mol. Phylogenet. Evol. 2011, 59, 225–244. [Google Scholar] [CrossRef]
  69. Liu, W.; Xie, J.; Zhou, H.; Kong, H.; Hao, G.; Fritsch, P.W.; Gong, W. Population dynamics linked to glacial cycles in Cercis chuniana FP Metcalf (Fabaceae) endemic to the montane regions of subtropical China. Evol. Appl. 2021, 14, 2647–2663. [Google Scholar] [CrossRef]
  70. Li, N.; Wang, Z.; Deng, Q.; Wang, T.; Su, Y.J. Effects of climatic fluctuations on the fragmented distribution pattern of a Tertiary relict plant, Pseudotaxus chienii (Taxaceae), in subtropical China. Bot. J. Linn. Soc. 2024, 205, 55–74. [Google Scholar] [CrossRef]
  71. Du, S.; Wang, Z.; Ingvarsson, P.K.; Wang, D.; Wang, J.; Wu, Z.; Tembrock, L.R.; Zhang, J. Multilocus analysis of nucleotide variation and speciation in three closely related Populus (S alicaceae) species. Mol. Ecol. 2015, 24, 4994–5005. [Google Scholar] [CrossRef]
  72. Li, Y.; Liu, C.; Wang, R.; Luo, S.; Nong, S.; Wang, J.; Chen, X. Applications of molecular markers in conserving endangered species. Biodivers. Sci. 2020, 28, 367. [Google Scholar] [CrossRef]
  73. Zhao, Y.P.; Fan, G.; Yin, P.P.; Sun, S.; Li, N.; Hong, X.; Hu, G.; Zhang, H.; Zhang, F.M.; Han, J.D.; et al. Resequencing 545 ginkgo genomes across the world reveals the evolutionary history of the living fossil. Nat. Commun. 2019, 10, 4201. [Google Scholar] [CrossRef]
  74. Wang, C.; Wang, M.; Yang, S.; Wu, X.; Zhu, S.; Yan, Y.; Xu, J.; Wen, Y. Taxonomic status and spatial genetic pattern of Taxus in northern and central China: Insights from integrative taxonomy, ecology and phylogeography. BMC Plant Biol. 2025, 25, 181. [Google Scholar] [CrossRef]
Figure 1. Percentage of variable characters (single nucleotide polymorphisms, SNPs) in homologous loci among 25 P. macgregorii chloroplast genome. (A) Protein-coding region; (B) non-coding region. The homologous loci are oriented according to their locations in the chloroplast genomes. The threshold line indicates the nucleotide diversity value of the gene ranked 6th in descending order of nucleotide diversity.
Diversity 17 00439 g001
Figure 2. Relative synonymous codon usage (RSCU) preference in P. macgregorii chloroplast genome.
Diversity 17 00439 g002
Figure 3. Nonsynonymous (dN), synonymous (dS) substitution rates, and dN/dS of 79 protein-coding genes. (A) Synonymous (dS) and nonsynonymous (dN) substitution rates of the protein coding genes. (B) DN/dS values of the protein coding genes.
Diversity 17 00439 g003
Figure 4. Geographic distribution and genetic structure of populations of P. macgregorii. (A) The phylogenetic relationship of the P. macgregorii populations based on the complete chloroplast genome sequences. Blue represents the northern clade, yellow represents the central clade, and orange represents the southern clade. (B) PCA of all accessions. (C) The bar plot of admixture results when K = 3.
Diversity 17 00439 g004
Figure 5. The geographic distribution of P. macgregorii populations. The colors of the pie charts are based on the results of admixture analysis (K = 3).
Diversity 17 00439 g005
Table 1. Nucleotide diversity and variables of 134 chloroplast genome accessions.
LocationPolymorphic SitesSingleton Variable SitesParsimony Informative SitesIndelsNucleotide DiversitySNP Density/kb
IR38038120.000311.93
LSC50825064970.0013711.36
SSC15701571310.0020115.7
Total74127396780.001098.45
Table 2. Highly variable chloroplast-protein-coding genes of 134 chloroplast genome accessions.
GeneProteinLength bpNnSnSNPDensity of SNPs/kb
rpl32ribosomal protein L3215923531.45
rps8ribosomal protein S840241512.44
rpl33ribosomal protein L332040229.80
ycf1hypothetical chloroplast RF1955411240529.38
psbHphotosystem II phosphoprotein2190229.13
rpoARNA polymerase alpha subunit10236398.80
ndhDNADH-plastoquinone oxidoreductase subunit 4150065117.33
ndhHNADH-plastoquinone oxidoreductase subunit 711792686.79
rps7ribosomal protein S74651236.45
ndhANADH-plastoquinone oxidoreductase subunit 110894376.43
Abbreviations: Nn, nonsynonymous; Sn, synonymous.
Table 3. Genetic diversity and neutrality test for three clades of 134 chloroplast genome accessions.
GroupNSHHdPiTajima’s DFu’s Fs
Clade A3829270.799430.000621.531462.56614
Clade B4424170.73150 0.000683.43261 *2.77411
Clade C5222970.748110.000613.25077 *7.84627
Abbreviations: N, sample size; S, number of polymorphic sites; H, number of haplotypes; Hd, haplotype diversity; Pi, nucleotide diversity. * p < 0.05.
Table 4. Summary of the total variations (SNPs/indels) detected in the whole collection and each clade.
GroupAccessionsAll Variations
SNPsIndelsTotalDensity/kb
Clade A382923756674.19
Clade B442411924332.72
Clade C522292424712.96
Total13474167815719.88
Table 5. Sequence divergence between three clades.
ComparisonDAFST
Clade A vs. Clade B0.000670.16234
Clade A vs. Clade C0.000720.19900
Clade B vs. Clade C0.000650.18308
Table 6. The percentage of variation among and within clades.
Source of VariationPercentage of Variation
AMOVAAmong clades51.19
Within clades48.81
Disclaimer/Publisher’s Note: The statements, opinions and data contained in all publications are solely those of the individual author(s) and contributor(s) and not of MDPI and/or the editor(s). MDPI and/or the editor(s) disclaim responsibility for any injury to people or property resulting from any ideas, methods, instructions or products referred to in the content.

