
Vertical Distribution Patterns of Crustaceous Zooplankton Associated with Invasive Bythotrephes longimanus and Cercopagis pengoi in Lake Champlain (U.S.A.)


Abstract
1. Introduction
2. Materials and Methods
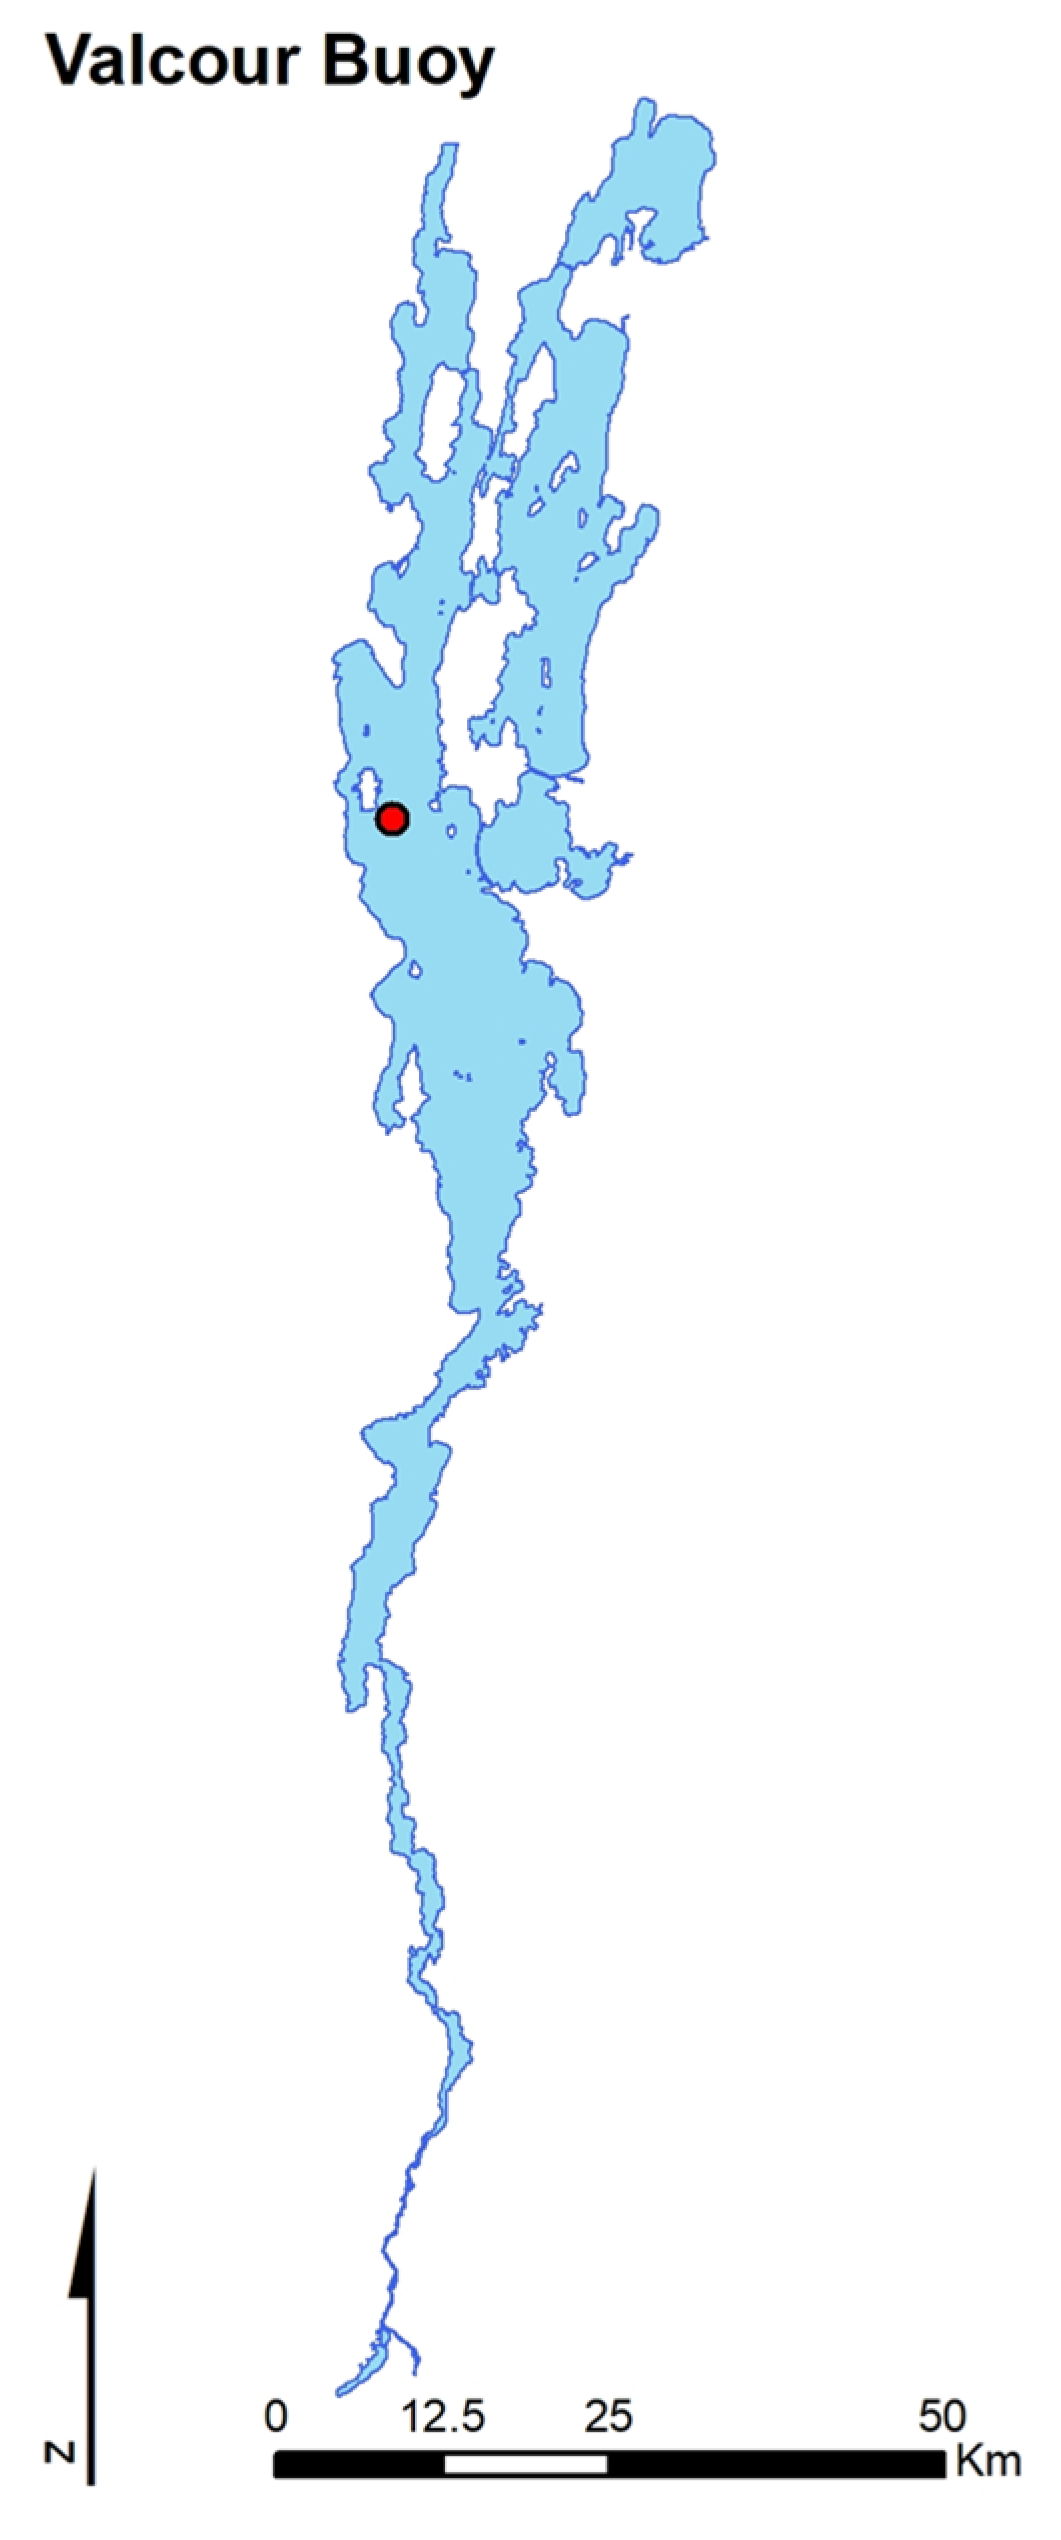
2.1. Field Data Collections
2.2. Laboratory Processing
2.3. Data Analysis
3. Results
3.1. Vertical Zooplankton Structure: Pre- and Post-Invasion
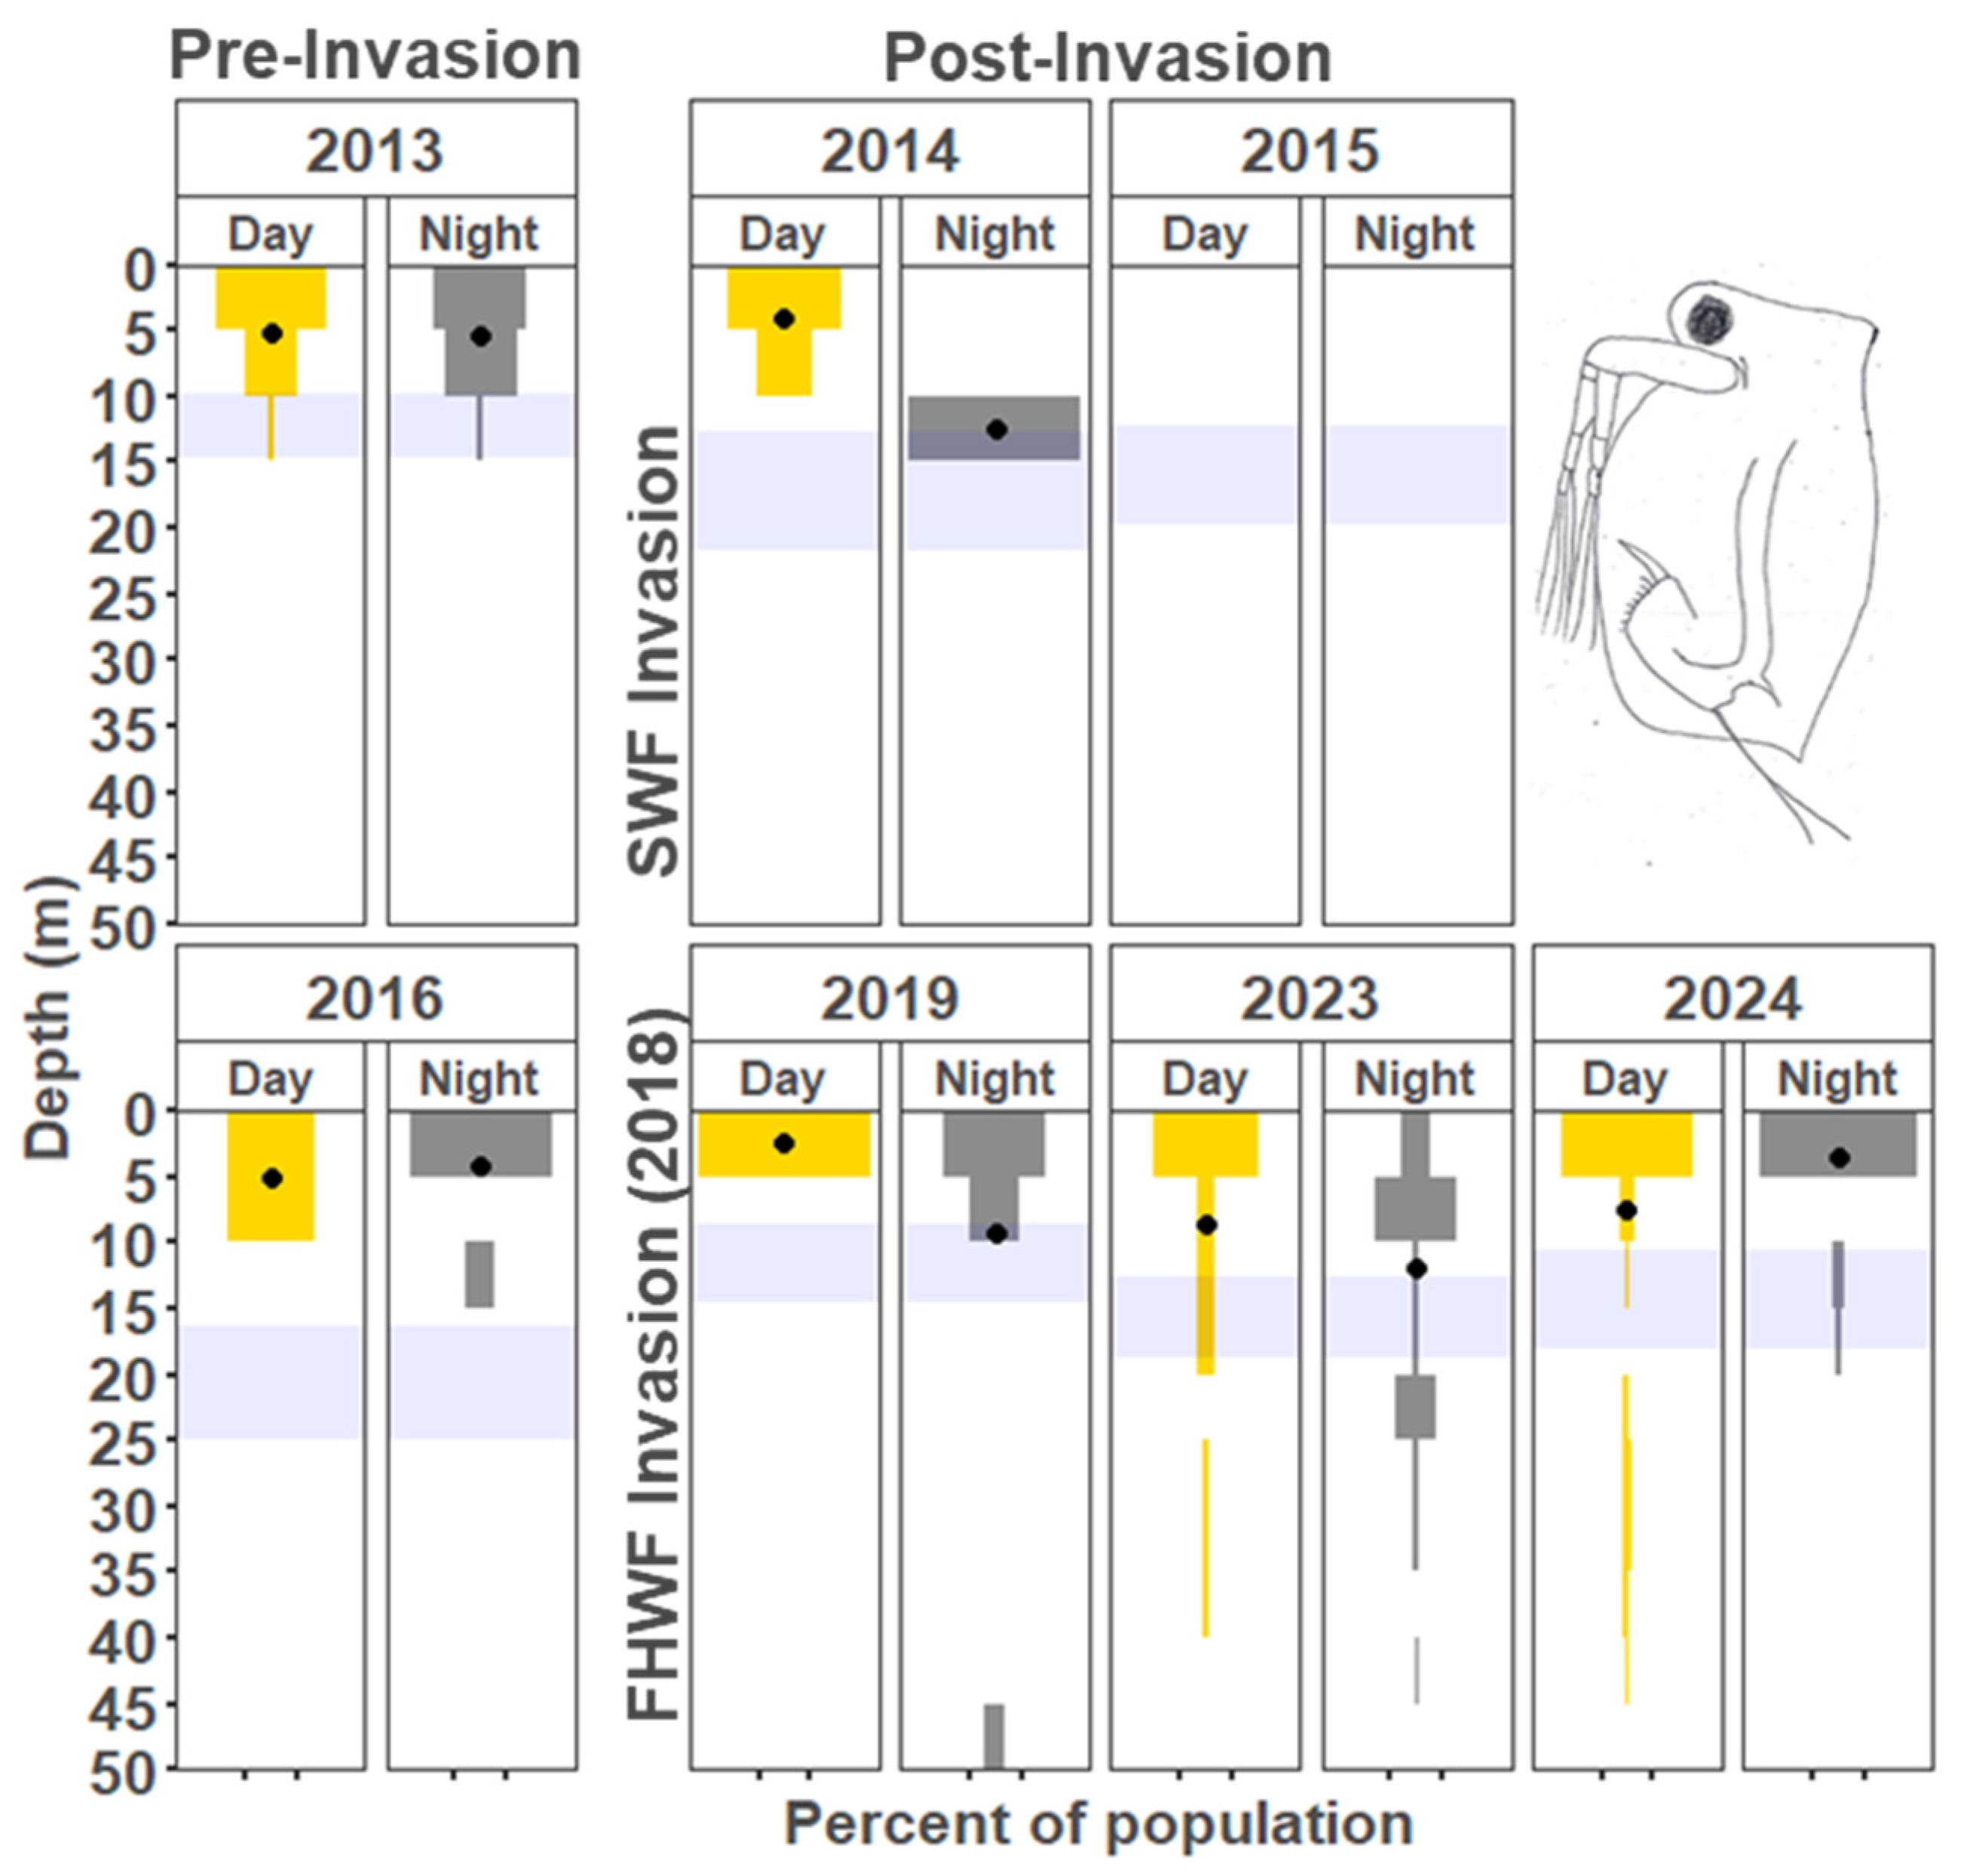
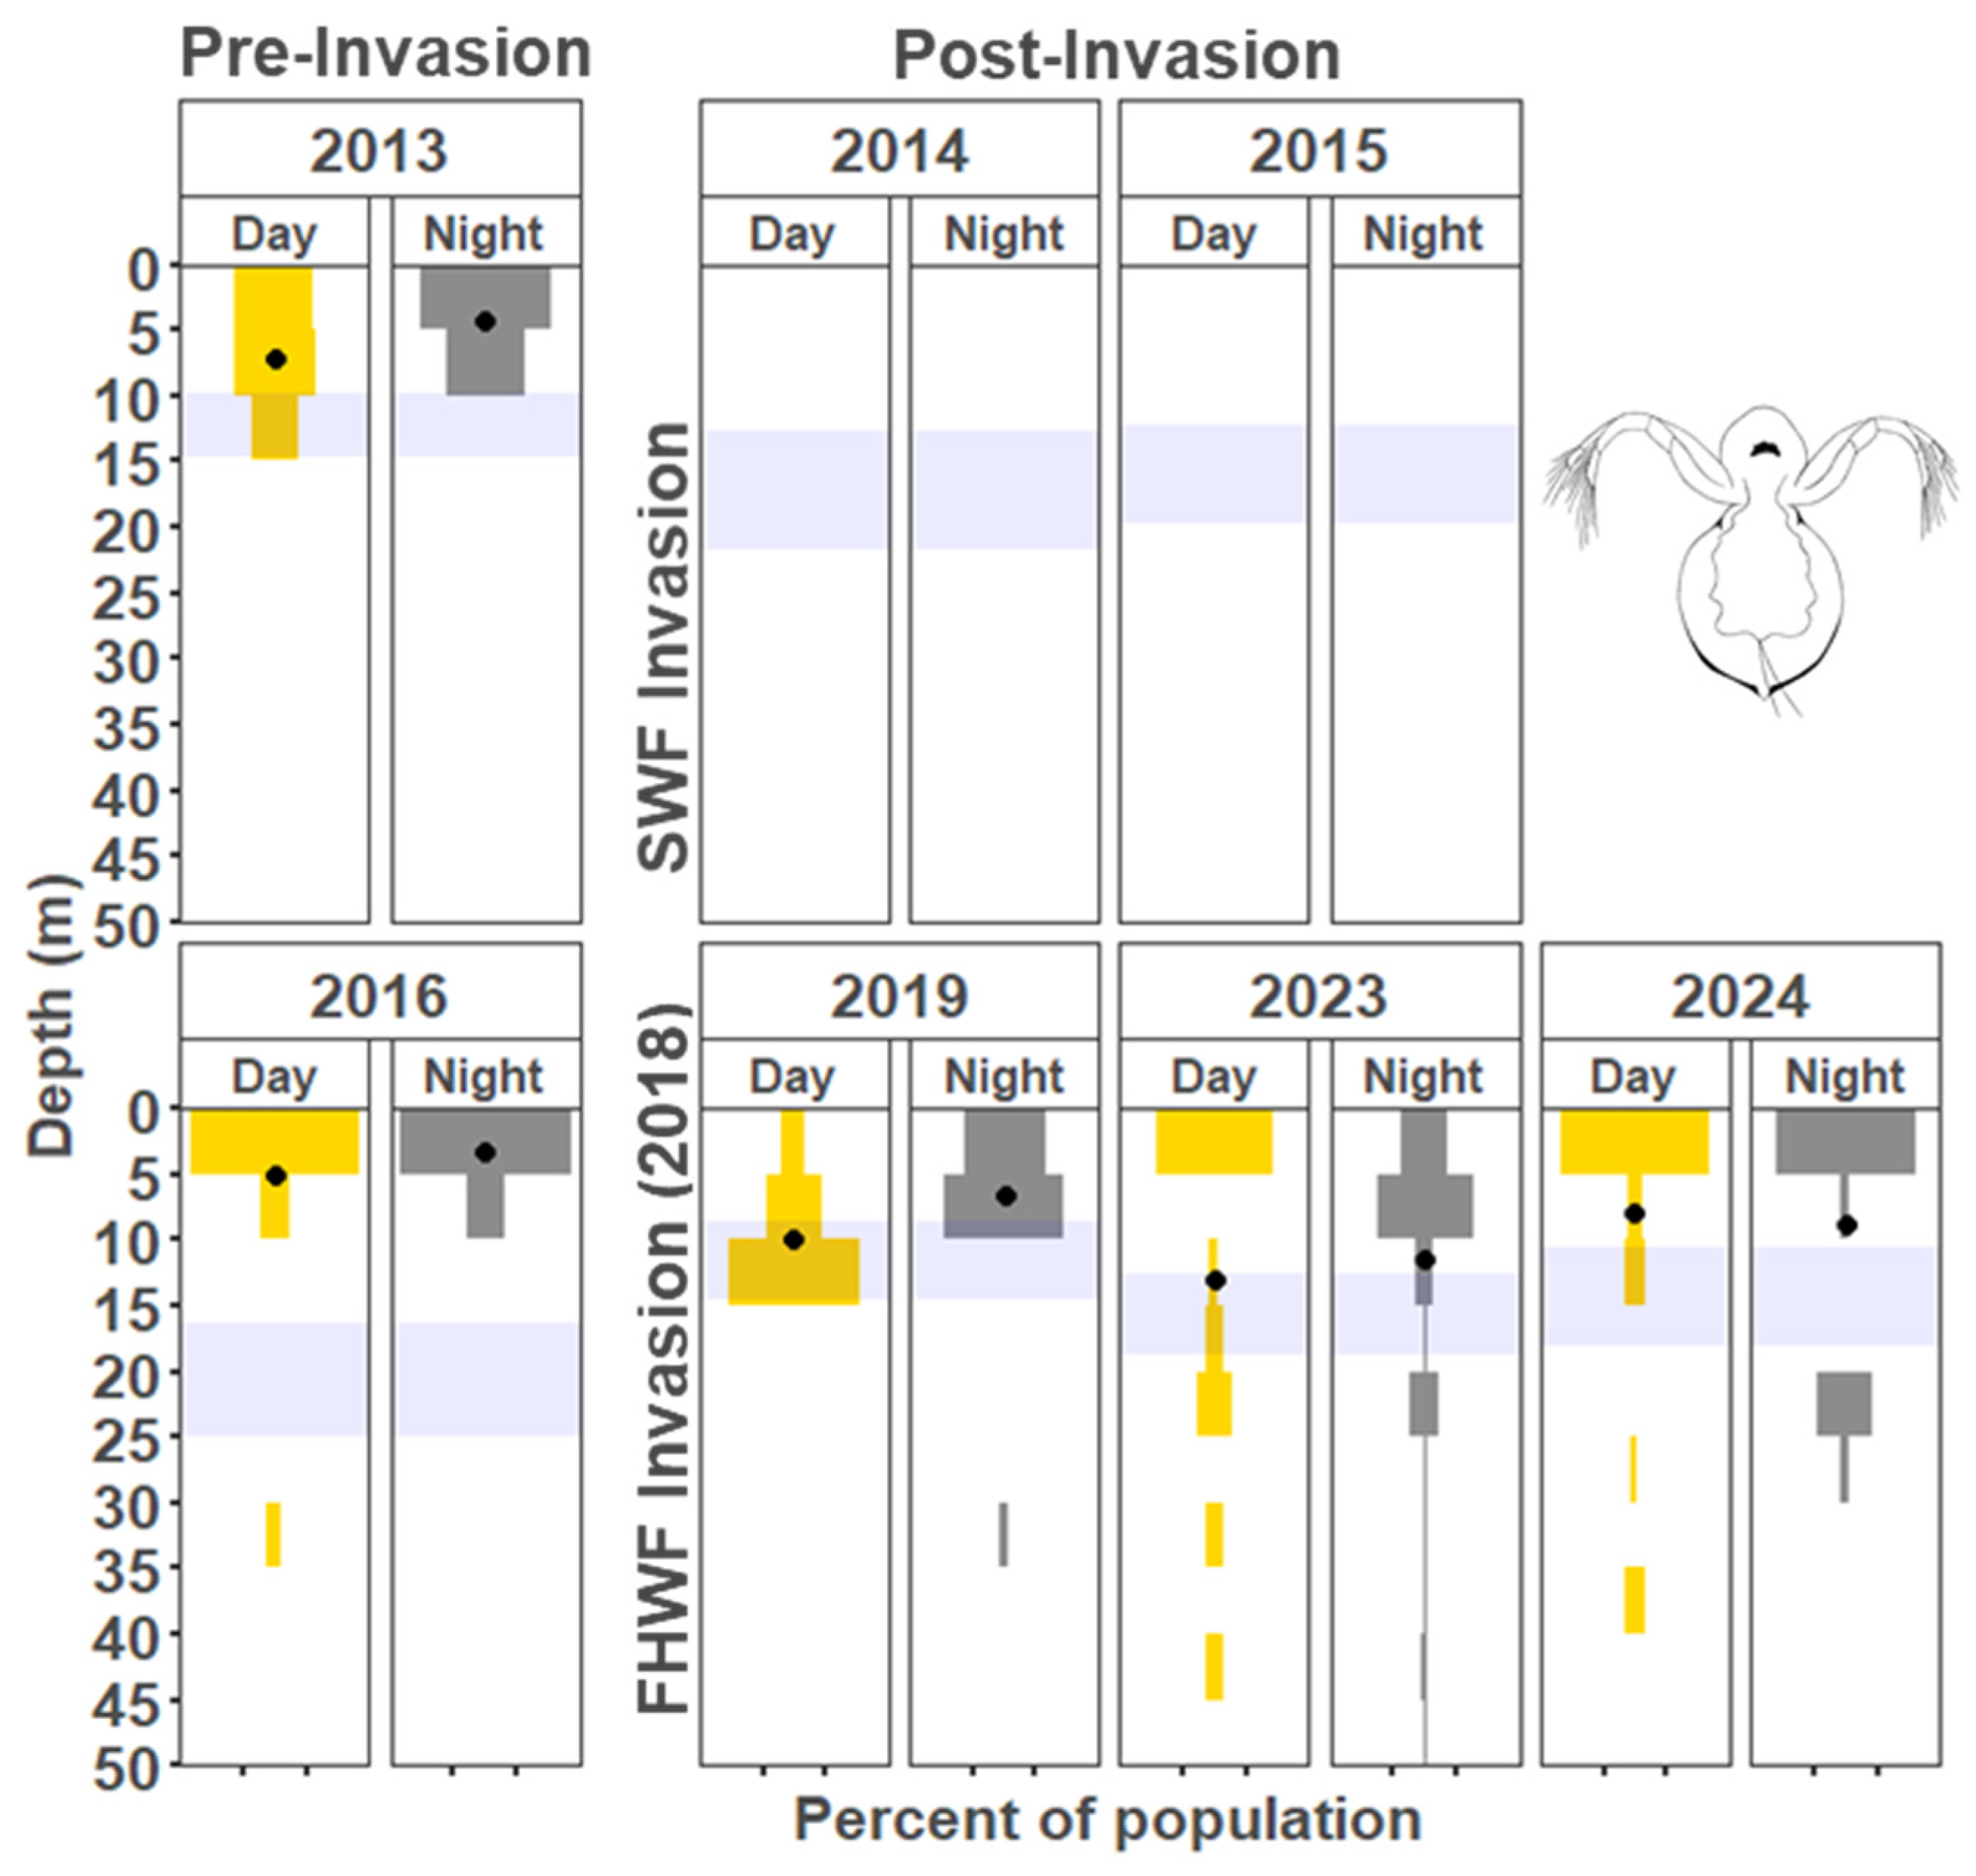
3.1.1. Cladocera
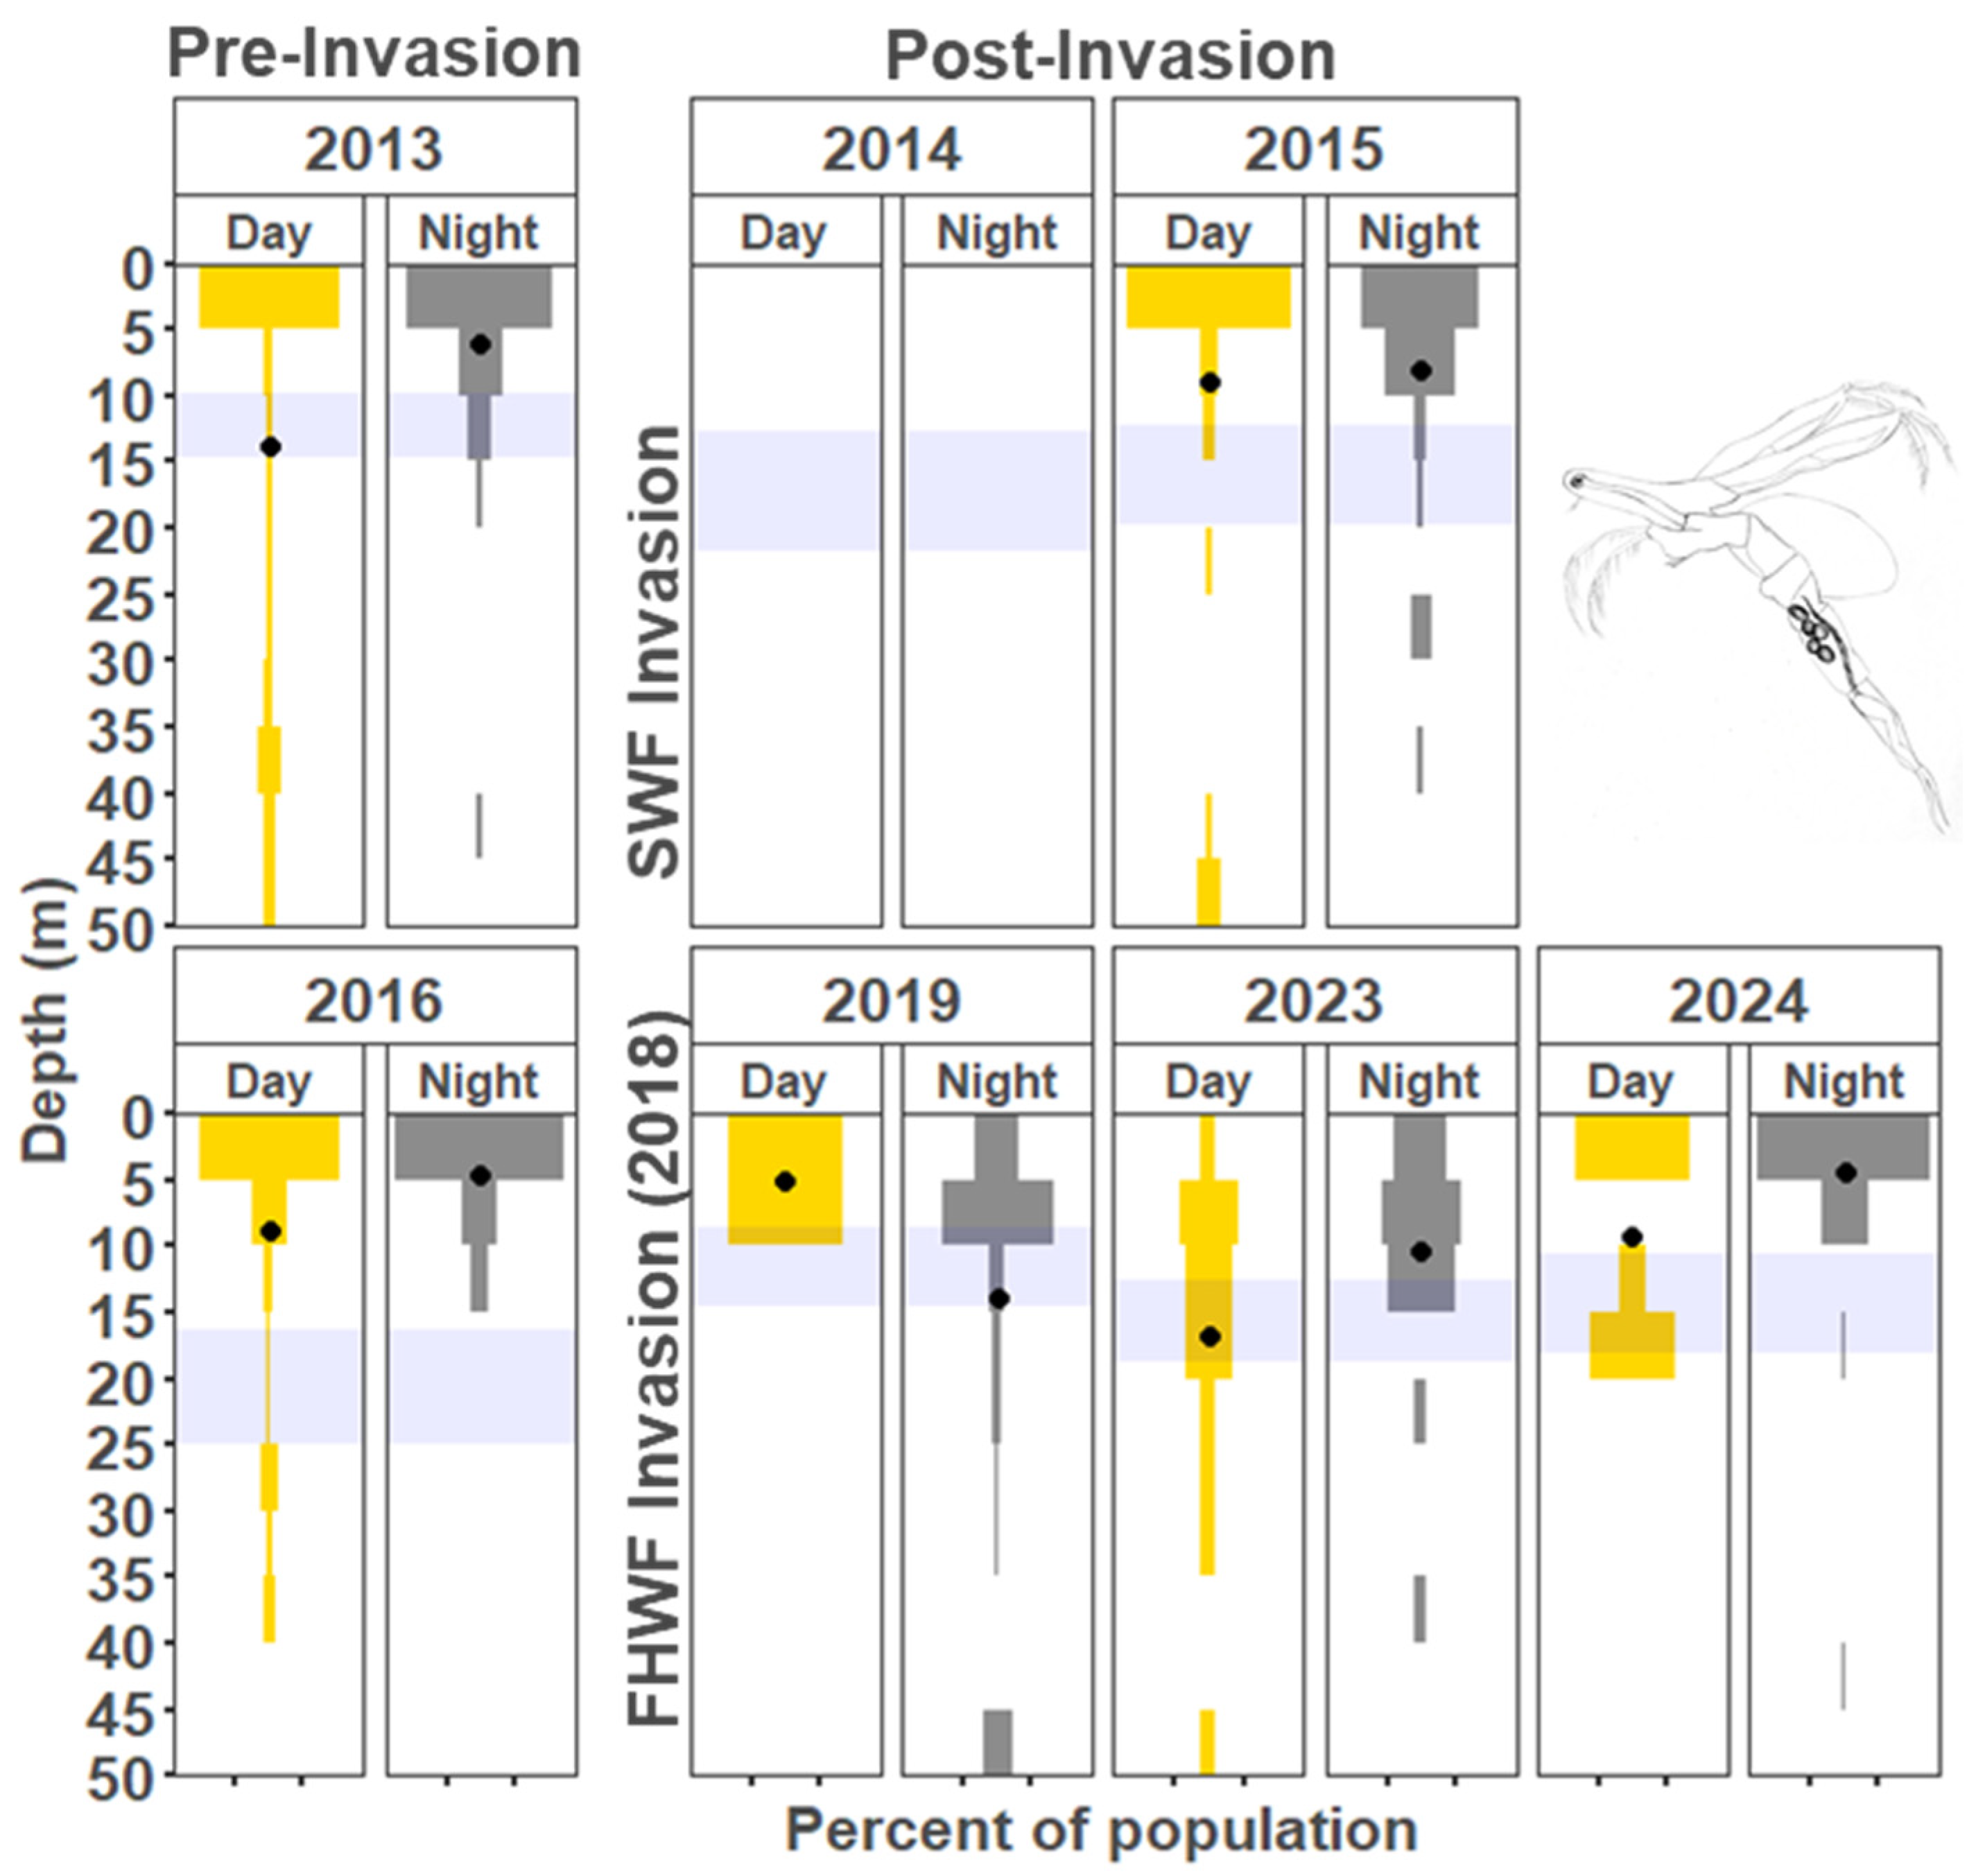
3.1.2. Copepods
3.2. Community Structure
4. Discussion
4.1. Vertical Migration Patterns During the Reference Years
4.2. Vertical Distribution Shifts Associated with the Bythotrephes Invasion
4.3. Vertical Distribution Shifts Associated with Cercopagis Invasion
4.4. Vertical Distribution Trends with Continued High Abundance of Cercopagis
4.5. Implications for Higher Trophic Levels
4.6. Potential Patterns Associated with Climate Change in Lake Champlain
5. Conclusions
Author Contributions
Funding
Institutional Review Board Statement
Data Availability Statement
Acknowledgments
Conflicts of Interest
Appenxix A. Community Structure by Depth Before and After Cercopagid Invasions

References
- Carling, K.J.; Mihuc, T.B.; Siegfried, C.; Bonham, R.; Dunlap, F. Where have all the rotifers gone? Zooplankton community patterns in Lake Champlain from 1992–2001. In Lake Champlain: Partnerships and Research in the New Millennium; Springer: New York, NY, USA, 2004; pp. 259–270. [Google Scholar]
- Vanderploeg, H.A.; Nalepa, T.F.; Jude, D.J.; Mills, E.L.; Holeck, K.T.; Liebig, J.R.; Grigorovich, I.A.; Ojaveer, H. Dispersal and emerging ecological impacts of Ponto-Caspian species in the Laurentian Great Lakes. Can. J. Fish. Aquat. Sci. 2002, 59, 1209–1228. [Google Scholar] [CrossRef]
- Connelly, N.A.; O’Neill, C.R.; Knuth, B.A.; Brown, T.L. Economic impacts of zebra mussels on drinking water treatment and electric power generation facilities. Environ. Manag. 2007, 40, 105–112. [Google Scholar] [CrossRef] [PubMed]
- Mills, E.L.; Leach, J.H.; Carlton, J.T.; Secor, C.L. Exotic species in the Great Lakes: A history of biotic crises and anthropogenic introductions. J. Great Lakes Res. 1993, 19, 1–54. [Google Scholar] [CrossRef]
- Johnson, L.E.; Ricciardi, A.; Carlton, J.T. Overland dispersal of aquatic invasive species: A risk assessment of transient recreational boating. Ecol. Appl. 2001, 11, 1789–1799. [Google Scholar] [CrossRef]
- Marsden, J.E.; Hauser, M. Exotic species in Lake Champlain. J. Great Lakes Res. 2009, 35, 250–265. [Google Scholar] [CrossRef]
- Stickney, M.; Hickey, C.; Hoerr, R. Lake Champlain basin program: Working together today for tomorrow. Lakes Reserv. Res. Manag. 2001, 6, 217–223. [Google Scholar] [CrossRef]
- Mihuc, T.B.; Dunlap, F.; Binggeli, C.; Myers, L.; Pershyn, C.; Groves, A.; Waring, A. Long-term patterns in Lake Champlain’s zooplankton: 1992–2010. J. Great Lakes Res. 2012, 38, 49–57. [Google Scholar] [CrossRef]
- Cutter, Z.A.; Mihuc, T.B.; Myers, L.W. Invasion of Bythotrephes longimanus and Cercopagis pengoi in Lake Champlain: Impacts on the Native Zooplankton Community. Diversity 2023, 15, 1112. [Google Scholar] [CrossRef]
- Zaret, T.M.; Suffern, J.S. Vertical migration in zooplankton as a predator avoidance mechanism. Limnol. Oceanogr. 1976, 21, 804–813. [Google Scholar] [CrossRef]
- Lampert, W. The adaptive significance of diel vertical migration of zooplankton. Funct. Ecol. 1989, 3, 21–27. [Google Scholar] [CrossRef]
- Dodson, S. Predicting diel vertical migration of zooplankton. Limnol. Oceanogr. 1990, 35, 1195–1200. [Google Scholar] [CrossRef]
- Dawidowicz, P.; Loose, C.J. Metabolic costs during predator-induced diel vertical migration of Daphnia. Limnol. Oceanogr. 1992, 37, 1589–1595. [Google Scholar] [CrossRef]
- Loose, C.J.; Dawidowicz, P. Trade-offs in diel vertical migration by zooplankton: The costs of predator avoidance. Ecology 1994, 75, 2255–2263. [Google Scholar] [CrossRef]
- Hays, G.C. A review of the adaptive significance and ecosystem consequences of zooplankton diel vertical migrations. Hydrobiologia 2003, 503, 163–170. [Google Scholar] [CrossRef]
- Stich, H.B.; Lampert, W. Growth and reproduction of migrating and non-migrating Daphnia species under simulated food and temperature conditions of diurnal vertical migration. Oecologia 1984, 61, 192–196. [Google Scholar] [CrossRef] [PubMed]
- Rivier, I.K. The predatory cladocera (Onychopoda: Podonidae, Polyphemidae, Cercopagidae) and Leptodorida of the world. In Guides to the Identification of the Microinvertebrates of the Continental Waters of the World; Backhuys: Leiden, The Netherlands, 1998; pp. 1–213. [Google Scholar]
- Lehman, J.T.; Cáceres, C.E. Food-web responses to species invasion by a predatory invertebrate: Bythotrephes in Lake Michigan. Limnol. Oceanogr. 1993, 38, 879–891. [Google Scholar] [CrossRef]
- Pichlová-Ptáçníková, R.; Vanderploeg, H.A. The invasive cladoceran Cercopagis pengoi is a generalist predator capable of feeding on a variety of prey species of different sizes and escape abilities. Fundam. Appl. Limnol. 2009, 173, 267–279. [Google Scholar] [CrossRef]
- Ojaveer, H.; Kuhns, L.A.; Barbiero, R.P.; Tuchman, M.L. Distribution and population characteristics of Cercopagis pengoi in Lake Ontario. J. Great Lakes Res. 2001, 27, 10–18. [Google Scholar] [CrossRef]
- BenoÍt, H.P.; Johannsson, O.E.; Warner, D.M.; Sprules, W.G.; Rudstam, L.G. Assessing the impact of a recent predatory invader: The population dynamics, vertical distribution, and potential prey of Cercopagis pengoi in Lake Ontario. Limnol. Oceanogr. 2002, 47, 626–635. [Google Scholar] [CrossRef]
- Pangle, K.L.; Peacor, S.D.; Johannsson, O.E. Large nonlethal effects of an invasive invertebrate predator on zooplankton population growth rate. Ecology 2007, 88, 402–412. [Google Scholar] [CrossRef]
- Muirhead, J.; Sprules, W.G. Reaction distance of Bythotrephes longimanus, encounter rate and index of prey risk for Harp Lake, Ontario. Freshw. Biol. 2003, 48, 135–146. [Google Scholar] [CrossRef]
- Barnhisel, D.R. Zooplankton spine induces aversion in small fish predators. Oecologia 1991, 88, 444–450. [Google Scholar] [CrossRef] [PubMed]
- Bushnoe, T.M.; Warner, D.M.; Rudstam, L.G.; Mills, E.L. Cercopagis pengoi as a new prey item for alewife (Alosa pseudoharengus) and rainbow smelt (Osmerus mordax) in Lake Ontario. J. Great Lakes Res. 2003, 29, 205–212. [Google Scholar] [CrossRef]
- Muenscher, W.G. Plankton studies in the Lake Champlain watershed. In A Biological Survey of the Lake Champlain Watershed; Supplement to the 19th Annual Report; NY State Conservation Department: Albany, NY, USA, 1930. [Google Scholar]
- Myer, G.E.; Gruendling, G.K. Limnology of Lake Champlain, Lake Champlain Basin Study; New England River Basins Commission: Burlington, VT, USA, 1979. [Google Scholar]
- Keen, R.; Kantor, J.D. Patterns of vertical migration of zooplankton in Lake Champlain. In Proceedings of the 1977 Fourth Annual Lake Champlain Basin Environmental Conference, Chazy, NY, USA, 9–10 August 1977. [Google Scholar]
- Yan, N.; Pawson, T. Changes in the crustacean zooplankton community of Harp Lake, Canada, following invasion by Bythotrephes cederstroemi. Freshw. Biol. 1997, 37, 409–425. [Google Scholar] [CrossRef]
- Laxson, C.L.; McPhedran, K.N.; Makarewicz, J.C.; Telesh, I.V.; Macisaac, H.J. Effects of the non-indigenous cladoceran Cercopagis pengoi on the lower food web of Lake Ontario. Freshw. Biol. 2003, 48, 2094–2106. [Google Scholar] [CrossRef]
- LaMay, M.; Hayes-Pontius, E.; Ater, I.; Mihuc, T. A revised key to the zooplankton of Lake Champlain. State Univ. N. Y. Plattsbg. 2013, 6, 1–41. [Google Scholar]
- Balcer, M.; Korda, N.; Dodson, S. Zooplankton of the Great Lakes: A Guide to the Identification and Ecology of Common Crustacean Species; University of Wisconsin Press: Madison, WI, USA, 1984. [Google Scholar]
- Bollens, S.M.; Frost, B.W. Predator-induced diet vertical migration in a planktonic copepod. J. Plankton Res. 1989, 11, 1047–1065. [Google Scholar] [CrossRef]
- Oksanen, J.; Simpson, G.; Blanchet, F.; Kindt, R.; Legendre, P.; Minchin, P.; O’Hara, R.; Solymos, P.; Stevens, M.; Szoecs, E.; et al. Vegan: Community Ecology Package. R Package Version 2.6-4. 2022. Available online: https://CRAN.R-project.org/package=vegan (accessed on 25 October 2024).
- R Core Team. R: A Language and Environment for Statistical Computing; R Foundation for Statistical Computing: Vienna, Austria, 2024; Available online: https://www.R-project.org/ (accessed on 25 October 2024).
- Daase, M.; Hop, H.; Falk-Petersen, S. Small-scale diel vertical migration of zooplankton in the High Arctic. Polar Biol. 2016, 39, 1213–1223. [Google Scholar] [CrossRef]
- LaMay, M. Diel Vertical Migration of Zooplankton in a Lake Containing the Invasive Bythotrephes longimanus (Lake George) Compared to a Non-Invaded Lake (Lake Champlain). Master’s Thesis, Plattsburgh State University, Plattsburgh, NY, USA, 2014. [Google Scholar]
- Bandara, K.; Varpe, Ø.; Wijewardene, L.; Tverberg, V.; Eiane, K. Two hundred years of zooplankton vertical migration research. Biol. Rev. 2021, 96, 1547–1589. [Google Scholar] [CrossRef]
- Dawidowicz, P.; Wielanier, M. Costs of predator avoidance reduce competitive ability of Daphnia. Hydrobiologia 2004, 526, 165–169. [Google Scholar] [CrossRef]
- Lampert, W.; McCauley, E.; Manly, B.F. Trade–offs in the vertical distribution of zooplankton: Ideal free distribution with costs? Proc. R. Soc. Lond. Ser. B Biol. Sci. 2003, 270, 765–773. [Google Scholar] [CrossRef] [PubMed]
- Amundsen, P.A.; Siwertsson, A.; Primicerio, R.; Bøhn, T. Long-term responses of zooplankton to invasion by a planktivorous fish in a subarctic watercourse. Freshw. Biol. 2009, 54, 24–34. [Google Scholar] [CrossRef]
- Vanderploeg, H.A.; Liebig, J.R.; Omair, M. Bythotrephes predation on Great Lakes’ zooplankton measured by an in-situ method: Implications for zooplankton community structure. Arch. Fur Hydrobiol. 1993, 127, 1–8. [Google Scholar] [CrossRef]
- Pichlová-Ptáčníková, R.; Vanderploeg, H.A. The quick and the dead: Might differences in escape rates explain the changes in the zooplankton community composition of Lake Michigan after invasion by Bythotrephes? Biol. Invasions 2011, 13, 2595–2604. [Google Scholar] [CrossRef]
- Bourdeau, P.E.; Pangle, K.L.; Peacor, S.D. The invasive predator Bythotrephes induces changes in the vertical distribution of native copepods in Lake Michigan. Biol. Invasions 2011, 13, 2533–2545. [Google Scholar] [CrossRef]
- Lane, P.A. Role of invertebrate predation in structuring zooplankton communities: With 3 tables in the text. Int. Ver. Für Theor. Und Angew. Limnol. Verhandlungen 1978, 20, 480–485. [Google Scholar] [CrossRef]
- Barnett, A.J.; Finlay, K.; Beisner, B.E. Functional diversity of crustacean zooplankton communities: Towards a trait-based classification. Freshw. Biol. 2007, 52, 796–813. [Google Scholar] [CrossRef]
- Mihuc, T.; Hayes-Pontius, E.; Arnwine, M.; Cutter, Z.; Myers, L. Lake Champlain zooplankton community dynamics following an extreme flood event. Diversity 2024, 16, 451. [Google Scholar] [CrossRef]
- Stemberger, R.S. Prey selection by the copepod Diacyclops thomasi. Oecologia 1985, 65, 492–497. [Google Scholar] [CrossRef]
- Warner, D.; Rudstam, L.G.; Benoît, H.; Mills, E.L.; Johannsson, O. Changes in seasonal nearshore zooplankton abundance patterns in Lake Ontario following establishment of the exotic predator Cercopagis pengoi. J. Great Lakes Res. 2006, 32, 531–542. [Google Scholar] [CrossRef]
- Ohman, M.D.; Frost, B.W.; Cohen, E.B. Reverse diel vertical migration: An escape from invertebrate predators. Science 1983, 220, 1404–1407. [Google Scholar] [CrossRef] [PubMed]
- Brooks, J.L.; Dodson, S.I. Predation, body size, and composition of plankton: The effect of a marine planktivore on lake plankton illustrates theory of size, competition, and predation. Science 1965, 150, 28–35. [Google Scholar] [CrossRef]
- Kerfoot, W.C. The divergence of adjacent populations. Ecology 1975, 56, 1298–1313. [Google Scholar] [CrossRef]
- Brandl, Z. Feeding strategies of planktonic cyclopoids in lacustrine ecosystems. J. Mar. Syst. 1998, 15, 87–95. [Google Scholar] [CrossRef]
- Witt, A.M.; Cáceres, C.E. Potential predator-prey relationships between Bythotrephes longimanus and Cercopagis pengoi in southwestern Lake Michigan. J. Great Lakes Res. 2004, 30, 519–527. [Google Scholar] [CrossRef]
- Makarewicz, J.; Damaske, E.; Laxson, C. Seasonal and Vertical Distribution, Food Web Dynamics and Contaminant Biomagnification of Cercopagis pengoi in Lake Ontario; Brockport Technical Reports (Water Resources); SUNY Open Access Repository (SOAR): Albany, NY, USA, 2002; Available online: https://soar.suny.edu/handle/20.500.12648/4437 (accessed on 10 April 2024).
- Ptáčníková, R.; Vanderploeg, H.A.; Cavaletto, J.F. Big versus small: Does Bythotrephes longimanus predation regulate spatial distribution of another invasive predatory cladoceran, Cercopagis pengoi? J. Great Lakes Res. 2015, 41, 143–149. [Google Scholar] [CrossRef]
- Ojaveer, H.; Lumberg, A. On the role of Cercopagis (Ceropagis pengoi Ostroumov) in Pärnu Bay and in the NE part of the Gulf of Riga Ecosystem. Proc. Estonian Acad. Sci. Ecol. 1995, 5, 227–232. [Google Scholar]
- Antsulevich, A.; Välipakka, P. Cercopagis pengoi—New important food object of the Baltic herring in the Gulf of Finland. Int. Rev. Hydrobiol. 2000, 85, 609–619. [Google Scholar] [CrossRef]
- Pothoven, S.A.; Vanderploeg, H.A.; Cavaletto, J.F.; Krueger, D.M.; Mason, D.M.; Brandt, S.B. Alewife planktivory controls the abundance of two invasive predatory cladocerans in Lake Michigan. Freshw. Biol. 2007, 52, 561–573. [Google Scholar] [CrossRef]
- Storch, A.J.; Schulz, K.L.; Cáceres, C.E.; Smyntek, P.M.; Dettmers, J.M.; Teece, M.A. Consumption of two exotic zooplankton by alewife (Alosa pseudoharengus) and rainbow smelt (Osmerus mordax) in three Laurentian Great Lakes. Can. J. Fish. Aquat. Sci. 2007, 64, 1314–1328. [Google Scholar] [CrossRef]
- Ball, S.C.; Mihuc, T.B.; Myers, L.W.; Stockwell, J.D. Ten-fold decline in Mysis diluviana in Lake Champlain between 1975 and 2012. J. Great Lakes Res. 2015, 41, 502–509. [Google Scholar] [CrossRef]
- Hrycik, A.R.; Simonin, P.W.; Rudstam, L.G.; Parrish, D.L.; Pientka, B.; Mihuc, T.B. Mysis zooplanktivory in Lake Champlain: A bioenergetics analysis. J. Great Lakes Res. 2015, 41, 492–501. [Google Scholar] [CrossRef]
- Delmarsh, L. Long-Term Life History Patterns of Mysis diluviana in Lake Champlain. Master’s Thesis, Plattsburgh State University, Plattsburgh, NY, USA, 2021. [Google Scholar]
- Boscarino, B.T.; Rudstam, L.G.; Mata, S.; Gal, G.; Johannsson, O.E.; Mills, E.L. The effects of temperature and predator—Prey interactions on the migration behavior and vertical distribution of Mysis relicta. Limnol. Oceanogr. 2007, 52, 1599–1613. [Google Scholar] [CrossRef]
- Rudstam, L.G.; Hetherington, A.L.; Mohammadian, A.M. Effect of temperature on feeding and survival of Mysis relicta. J. Great Lakes Res. 1999, 25, 363–371. [Google Scholar] [CrossRef]
- Gerritsen, J. Adaptive responses to encounter problems. In Evolution and Ecology of Zooplankton Communities; Kerfoot, C., Ed.; University Press of New England: Lebanon, NH, USA, 1980; Volume 3, pp. 52–62. [Google Scholar]
- Bowers, J.A.; Cooper, W.E.; Hall, D.J. Midwater and epibenthic behaviors of Mysis relicta Loven: Observations from the Johnson-Sea-Link II submersible in Lake Superior and from a remotely operated vehicle in northern Lake Michigan. J. Plankton Res. 1990, 12, 1279–1286. [Google Scholar] [CrossRef]
- Simoncelli, S.; Thackeray, S.J.; Wain, D.J. Effect of temperature on zooplankton vertical migration velocity. Hydrobiologia 2019, 829, 143–166. [Google Scholar] [CrossRef]
- O’Malley, B.P.; Bunnell, D.B. Diet of Mysis diluviana reveals seasonal patterns of omnivory and consumption of invasive species in offshore Lake Michigan. J. Plankton Res. 2014, 36, 989–1002. [Google Scholar] [CrossRef]
- Marsden, J.E.; Kozel, C.L.; Chipman, B.D. Recruitment of lake trout in Lake Champlain. J. Great Lakes Res. 2018, 44, 166–173. [Google Scholar] [CrossRef]
- Marsden, J.E.; Langdon, R.W. The history and future of Lake Champlain’s fishes and fisheries. J. Great Lakes Res. 2012, 38, 19–34. [Google Scholar] [CrossRef]
- Walsh, M.G.; O’Gorman, R.; Strang, T.; Edwards, W.H.; Rudstam, L.G. Fall diets of alewife, rainbow smelt, and slimy sculpin in the profundal zone of southern Lake Ontario during 1994–2005 with an emphasis on occurrence of Mysis relicta. Aquat. Ecosyst. Health Manag. 2008, 11, 368–376. [Google Scholar] [CrossRef]
- Pothoven, S.A.; Vanderploeg, H.A.; Ludsin, S.A.; Höök, T.O.; Brandt, S.B. Feeding ecology of emerald shiners and rainbow smelt in central Lake Erie. J. Great Lakes Res. 2009, 35, 190–198. [Google Scholar] [CrossRef]
- Marsden, J.E.; Schumacher, M.N.; Wilkins, P.D.; Marcy-Quay, B.; Alger, B.; Rokosz, K.; Baker, C.L. Diet differences between wild and stocked age-0 to age-3 lake trout indicate influence of early rearing environments. J. Great Lakes Res. 2022, 48, 782–789. [Google Scholar] [CrossRef]
- Simonin, P.W.; Parrish, D.L.; Rudstam, L.G.; Sullivan, P.J.; Pientka, B. Native rainbow smelt and nonnative alewife distribution related to temperature and light gradients in Lake Champlain. J. Great Lakes Res. 2012, 38, 115–122. [Google Scholar] [CrossRef]
- Riha, M.; Walsh, M.G.; Connerton, M.J.; Holden, J.; Weidel, B.C.; Sullivan, P.J.; Holda, T.J.; Rudstam, L.G. Vertical distribution of alewife in the Lake Ontario offshore: Implications for resource use. J. Great Lakes Res. 2017, 43, 823–837. [Google Scholar] [CrossRef]
- Lesser, J.S.; Bruel, R.; Marcy-Quay, B.; McReynolds, A.T.; Stockwell, J.D.; Marsden, J.E. Whole-lake food web model indicates alewife invasion fueled lake trout restoration and altered patterns of trophic flow Lake Champlain. J. Great Lakes Res. 2024, 50, 102249. [Google Scholar] [CrossRef]
- Brassard, S.G.; Rautio, M.; Bertolo, A. Vertical distribution patterns of zooplankton across a gradient of fish predation in boreal lakes. Freshw. Biol. 2023, 68, 588–608. [Google Scholar] [CrossRef]
- Van Gool, E.; Ringelberg, J. Relationship between fish kairomone concentration in a lake and phototactic swimming by Daphnia. J. Plankton Res. 2002, 24, 713–721. [Google Scholar] [CrossRef]
- Guisande, C.; Duncan, A.; Lampert, W. Trade-offs in Daphnia vertical migration strategies. Oecologia 1991, 87, 357–359. [Google Scholar] [CrossRef]
- DeMott, W.R.; Kerfoot, W.C. Competition among cladocerans: Nature of the interaction between Bosmina and Daphnia. Ecology 1982, 63, 1949–1966. [Google Scholar] [CrossRef]
- Mihuc, T.B.; Snyder, K.; Cutter, Z.; Bouyea, S. Long-Term Shifts in Phytoplankton Community Composition and Abundance in Lake Champlain: A 50-Year Comparison. In The Role of Plankton in Freshwater and Marine Ecology; Pereira, L., Ed.; IntechOpen: London, UK, 2024; (accessed on 31 December 2024). [Google Scholar] [CrossRef]
- Jiang, X.; Yang, W.; Xiang, X.; Niu, Y.; Chen, L.; Zhang, J. Cyanobacteria alter competitive outcomes between Daphnia and Bosmina in dependence on environmental conditions. Fundam. Appl. Limnol. 2014, 184, 11–22. [Google Scholar] [CrossRef]
- Cutter, Z. Invasive Predatory Cladocera in Lake Champlain: Impacts to the Zooplankton Community Composition and Native Predator Species. Master’s Thesis, Plattsburgh State University, Plattsburgh, NY, USA, 2021. [Google Scholar]
- Schulz, K.L.; Yurista, P.M. Implications of an invertebrate predator’s (Bythotrephes cederstroemi) atypical effects on a pelagic zooplankton community. Hydrobiologia 1998, 380, 179–193. [Google Scholar] [CrossRef]
- Nesbitt, L.M.; Riessen, H.P.; Ramcharan, C.W. Opposing predation pressures and induced vertical migration responses in Daphnia. Limnol. Oceanogr. 1996, 41, 1306–1311. [Google Scholar] [CrossRef]
- Dawidowicz, P.; Loose, C.J. Cost of swimming by Daphnia during diel vertical migration. Limnol. Oceanogr. 1992, 37, 665–669. [Google Scholar] [CrossRef]


| Invader | 2013 | 2014 | 2015 | 2016 | 2017 | 2018 | 2019 | 2020 | 2021 | 2022 | 2023 | 2024 |
|---|---|---|---|---|---|---|---|---|---|---|---|---|
| SWF | N/D | Incr | High | Low | N/D | N/D | Low | Low | Low | Low | Low | Low |
| Peak density | 0 | 15 | 14.1 | 0.10 | 0 | 0 | 0.05 | 0.20 | 0.10 | 0.52 | 0.20 | 0.62 |
| FHWF | N/D | N/D | N/D | N/D | N/D | Incr | High | High | High | High | High | High |
| Peak density | 0 | 0 | 0 | 0 | 0 | 36.4 | 49.8 | 22.8 | 26.5 | 38.0 | 40.0 | 53.1 |
| Taxon | 2013 | 2014 | 2015 | 2016 | 2019 | 2023 | 2024 |
|---|---|---|---|---|---|---|---|
| Bosmina coregoni | 5198.6 | 1808.5 | 0.0 | 183.9 | 2242.9 | 11,511.7 | 1458.9 |
| Bosmina longirostris | 14,240.9 | 3557.7 | 61.3 | 20,107.8 | 11,483.7 | 27,796.1 | 14,403.5 |
| Ceriodaphnia | 3819.2 | 76.6 | 0.0 | 490.4 | 182.7 | 1379.3 | 3519.1 |
| Daphnia retrocurva | 10,559.6 | 4259.6 | 0.0 | 8705.2 | 26,826.4 | 14,402.5 | 17,969.8 |
| Diacyclops thomasi | 29,218.6 | 11,162.5 | 490.4 | 31,878.1 | 2651.6 | 17,765.4 | 6531.2 |
| Diaphanosoma birgei | 3457.6 | 0.0 | 0.0 | 2268.3 | 1237.9 | 1179.4 | 2690.9 |
| Leptodiaptomus minutus | 8893.2 | 7549.6 | 147.1 | 6191.7 | 2428.6 | 2620.2 | 548.2 |
| Leptodiaptomus sicilis | 1597.0 | 2344.9 | 2611.6 | 4046.1 | 4982.1 | 2900.2 | 1494.3 |
| Mesocyclops edax | 1414.1 | 9662.6 | 306.5 | 613.0 | 2055.3 | 3569.7 | 1341.0 |
| Tropocyclops prasinus mexicanus | 5574.6 | 1996.5 | 527.2 | 5701.3 | 143.4 | 695.6 | 512.8 |
Disclaimer/Publisher’s Note: The statements, opinions and data contained in all publications are solely those of the individual author(s) and contributor(s) and not of MDPI and/or the editor(s). MDPI and/or the editor(s) disclaim responsibility for any injury to people or property resulting from any ideas, methods, instructions or products referred to in the content. |
© 2025 by the authors. Licensee MDPI, Basel, Switzerland. This article is an open access article distributed under the terms and conditions of the Creative Commons Attribution (CC BY) license (https://creativecommons.org/licenses/by/4.0/).
Share and Cite
Arnwine, M.; Mihuc, T.; Myers, L.; Lamay, M.; Cutter, Z. Vertical Distribution Patterns of Crustaceous Zooplankton Associated with Invasive Bythotrephes longimanus and Cercopagis pengoi in Lake Champlain (U.S.A.). Diversity 2025, 17, 371. https://doi.org/10.3390/d17060371
Arnwine M, Mihuc T, Myers L, Lamay M, Cutter Z. Vertical Distribution Patterns of Crustaceous Zooplankton Associated with Invasive Bythotrephes longimanus and Cercopagis pengoi in Lake Champlain (U.S.A.). Diversity. 2025; 17(6):371. https://doi.org/10.3390/d17060371
Chicago/Turabian StyleArnwine, Marshall, Timothy Mihuc, Luke Myers, Mark Lamay, and Zachary Cutter. 2025. "Vertical Distribution Patterns of Crustaceous Zooplankton Associated with Invasive Bythotrephes longimanus and Cercopagis pengoi in Lake Champlain (U.S.A.)" Diversity 17, no. 6: 371. https://doi.org/10.3390/d17060371
APA StyleArnwine, M., Mihuc, T., Myers, L., Lamay, M., & Cutter, Z. (2025). Vertical Distribution Patterns of Crustaceous Zooplankton Associated with Invasive Bythotrephes longimanus and Cercopagis pengoi in Lake Champlain (U.S.A.). Diversity, 17(6), 371. https://doi.org/10.3390/d17060371