
Genomic Diversity and Species Boundaries of the Chilean Silversides Fishes (Atheriniformes, Atherinopsidae)

 , , and
Abstract
1. Introduction
2. Materials and Methods
2.1. Study Area and Sample Collection
2.2. ddRAD Sequences

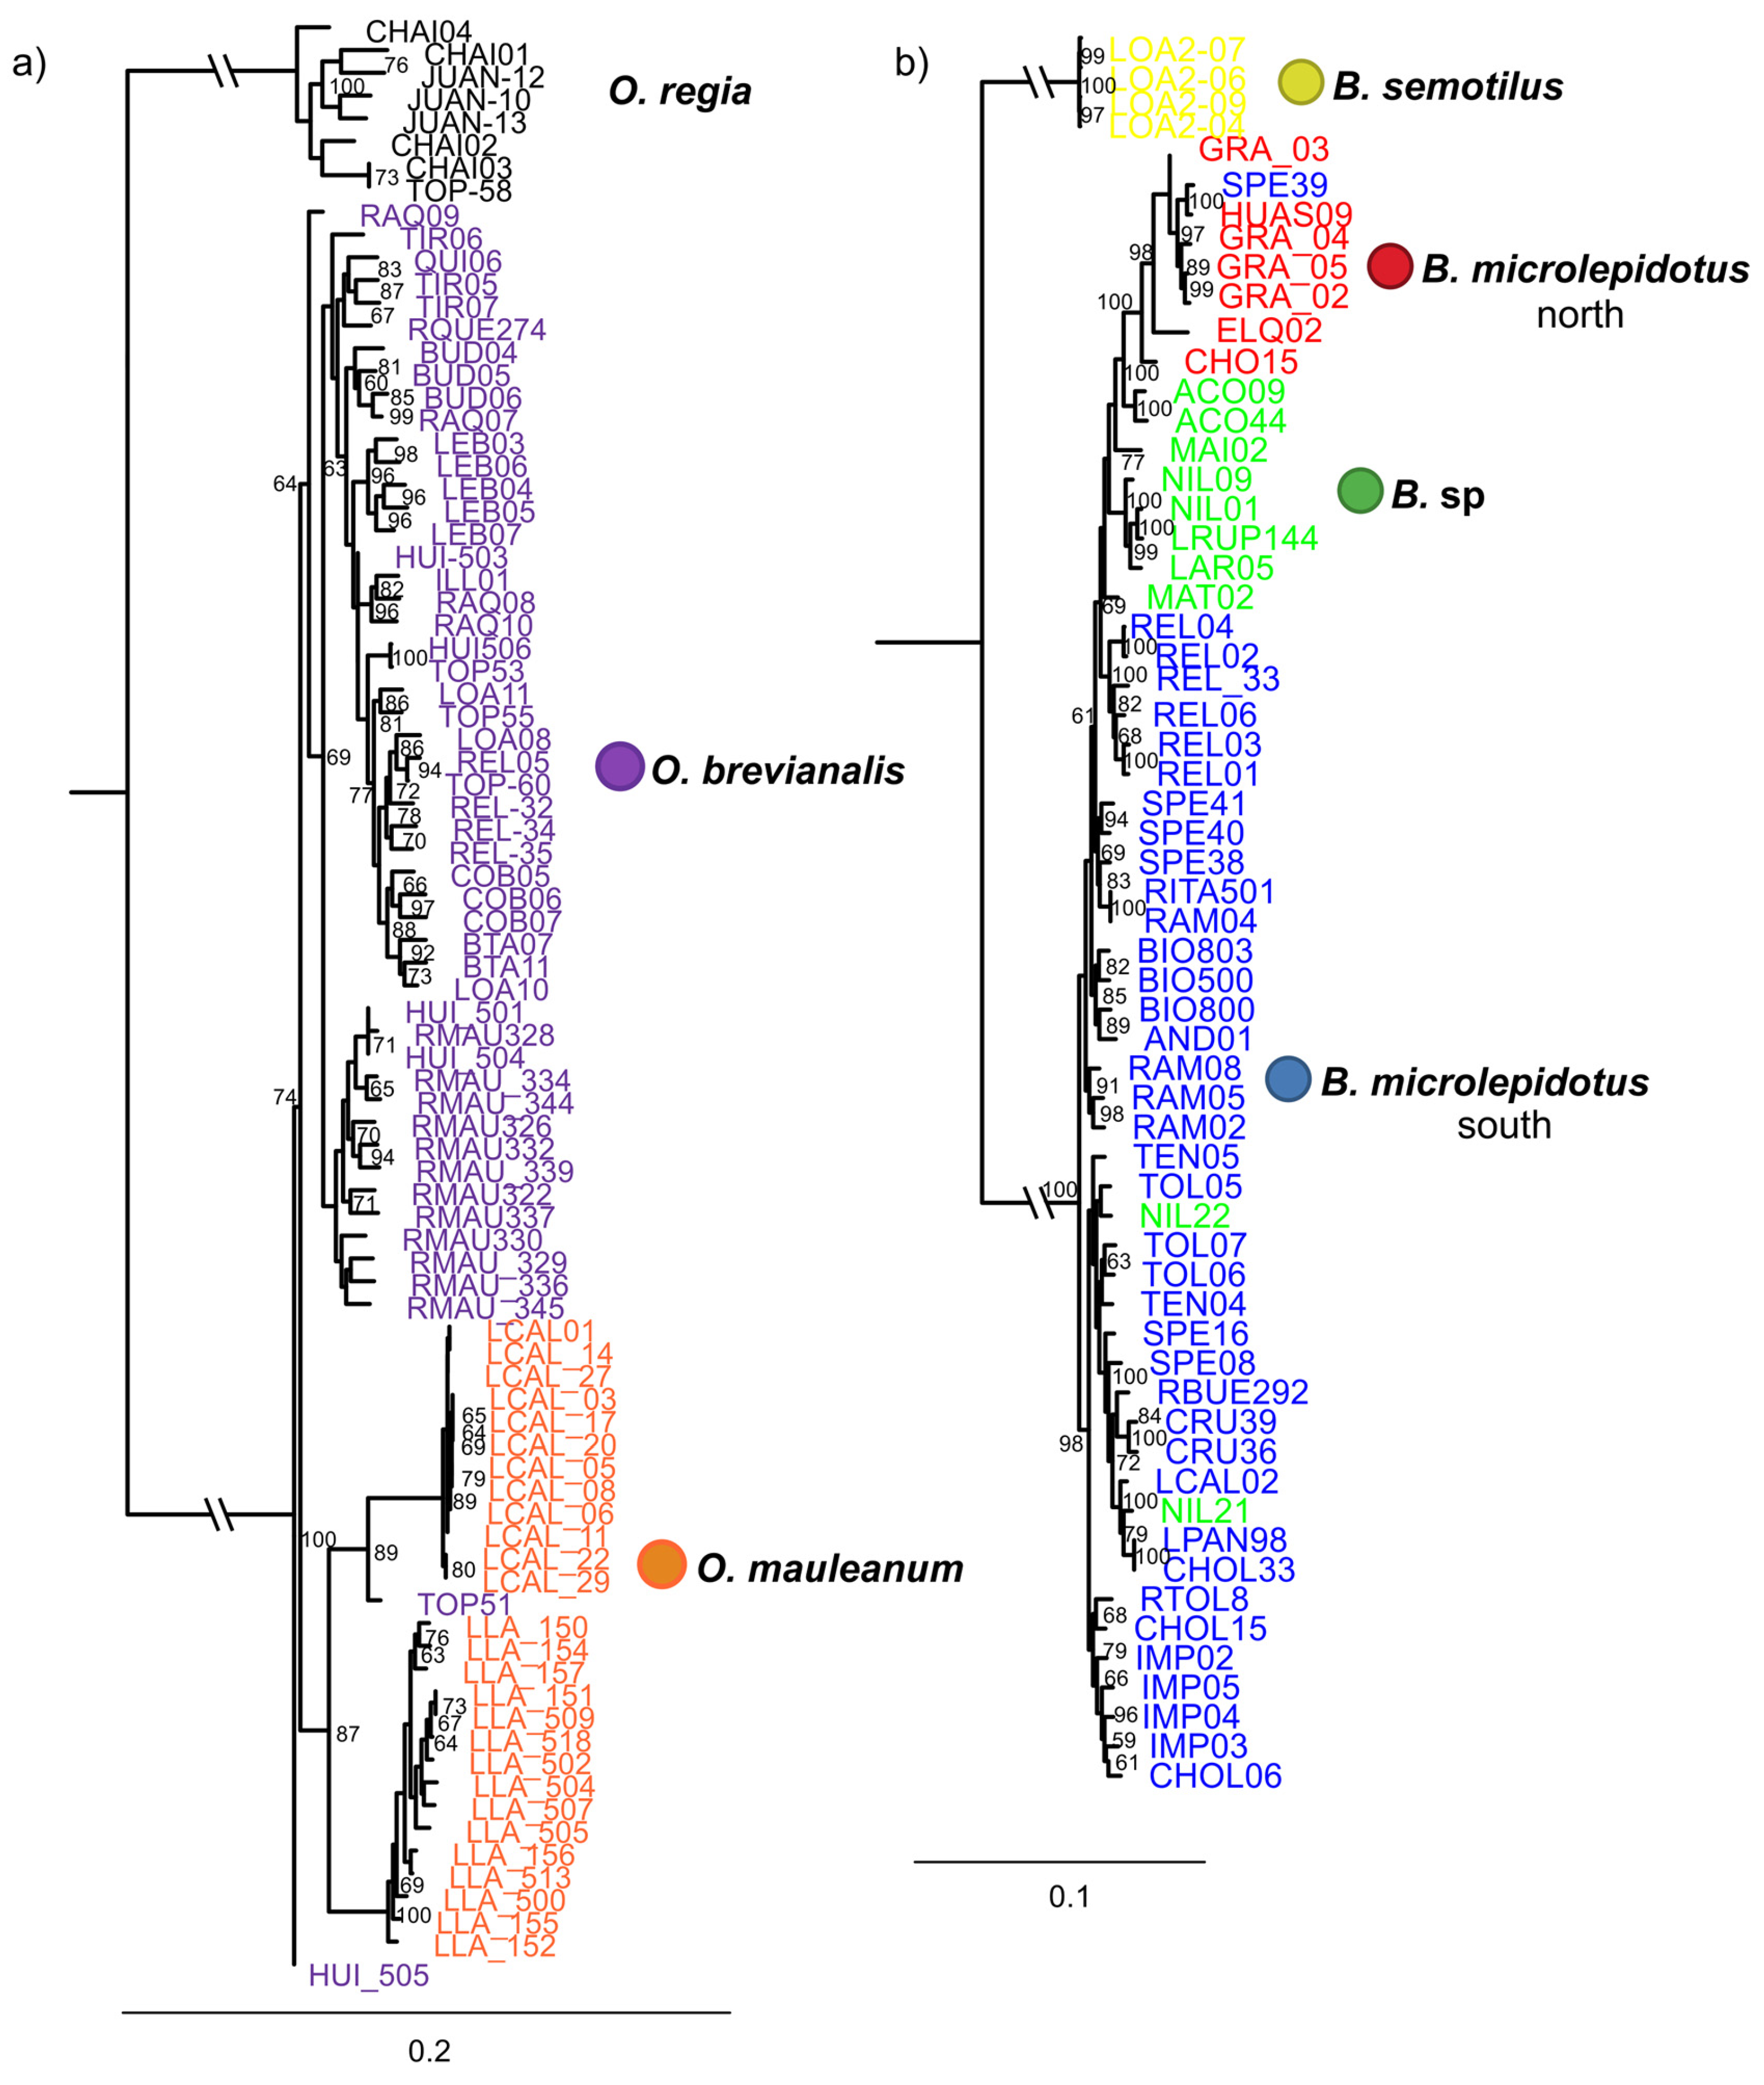
| Dataset | n (min. Samples Per Loci) | Species (n) | Loci | SNPs | Missing Sites (%) | Fit Model BIC | Par. Inf. | Sing. Sites | Dist. Patt. | SNPs VCF | Re-Construction |
|---|---|---|---|---|---|---|---|---|---|---|---|
| 1 | 86 (40) | O. brevianalis (52); O. mauleanum (27) + O. regia (7) | 12,009 | 26,110 | 46.56 | TVMe + ASC + R3 | 8545 | 3766 | 12,130 | 610 | IQTree (Figure 2a) |
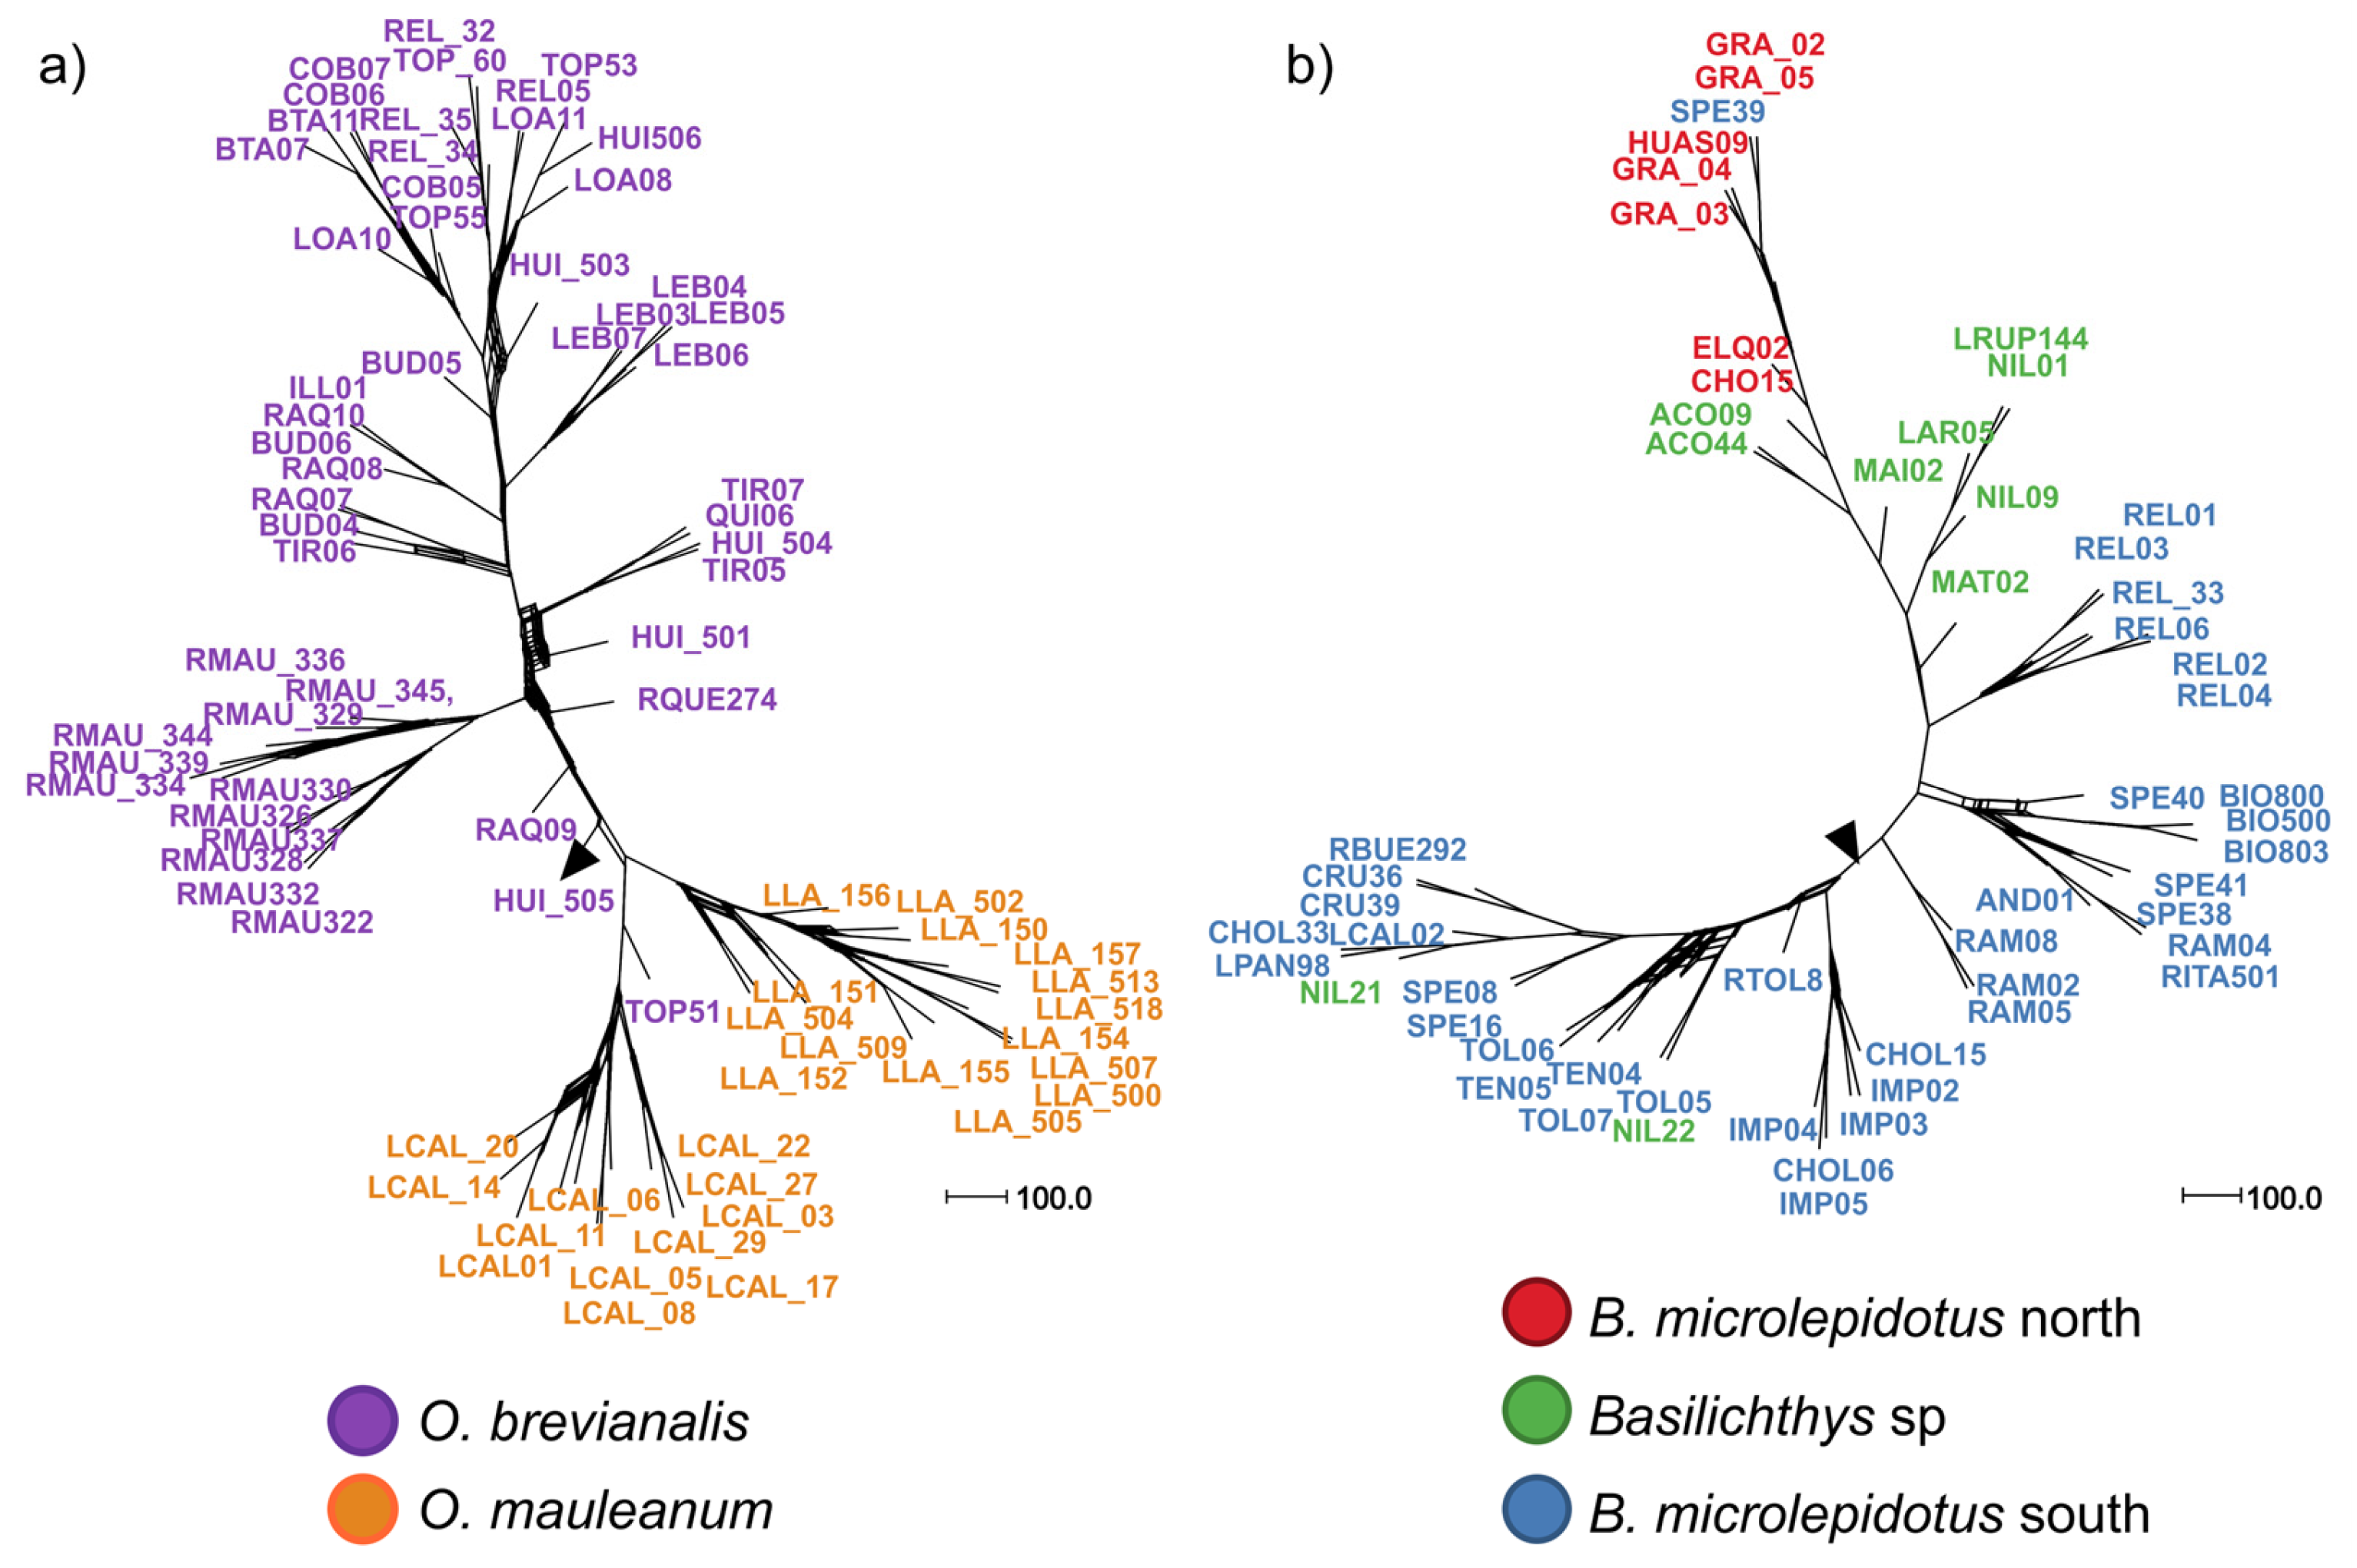
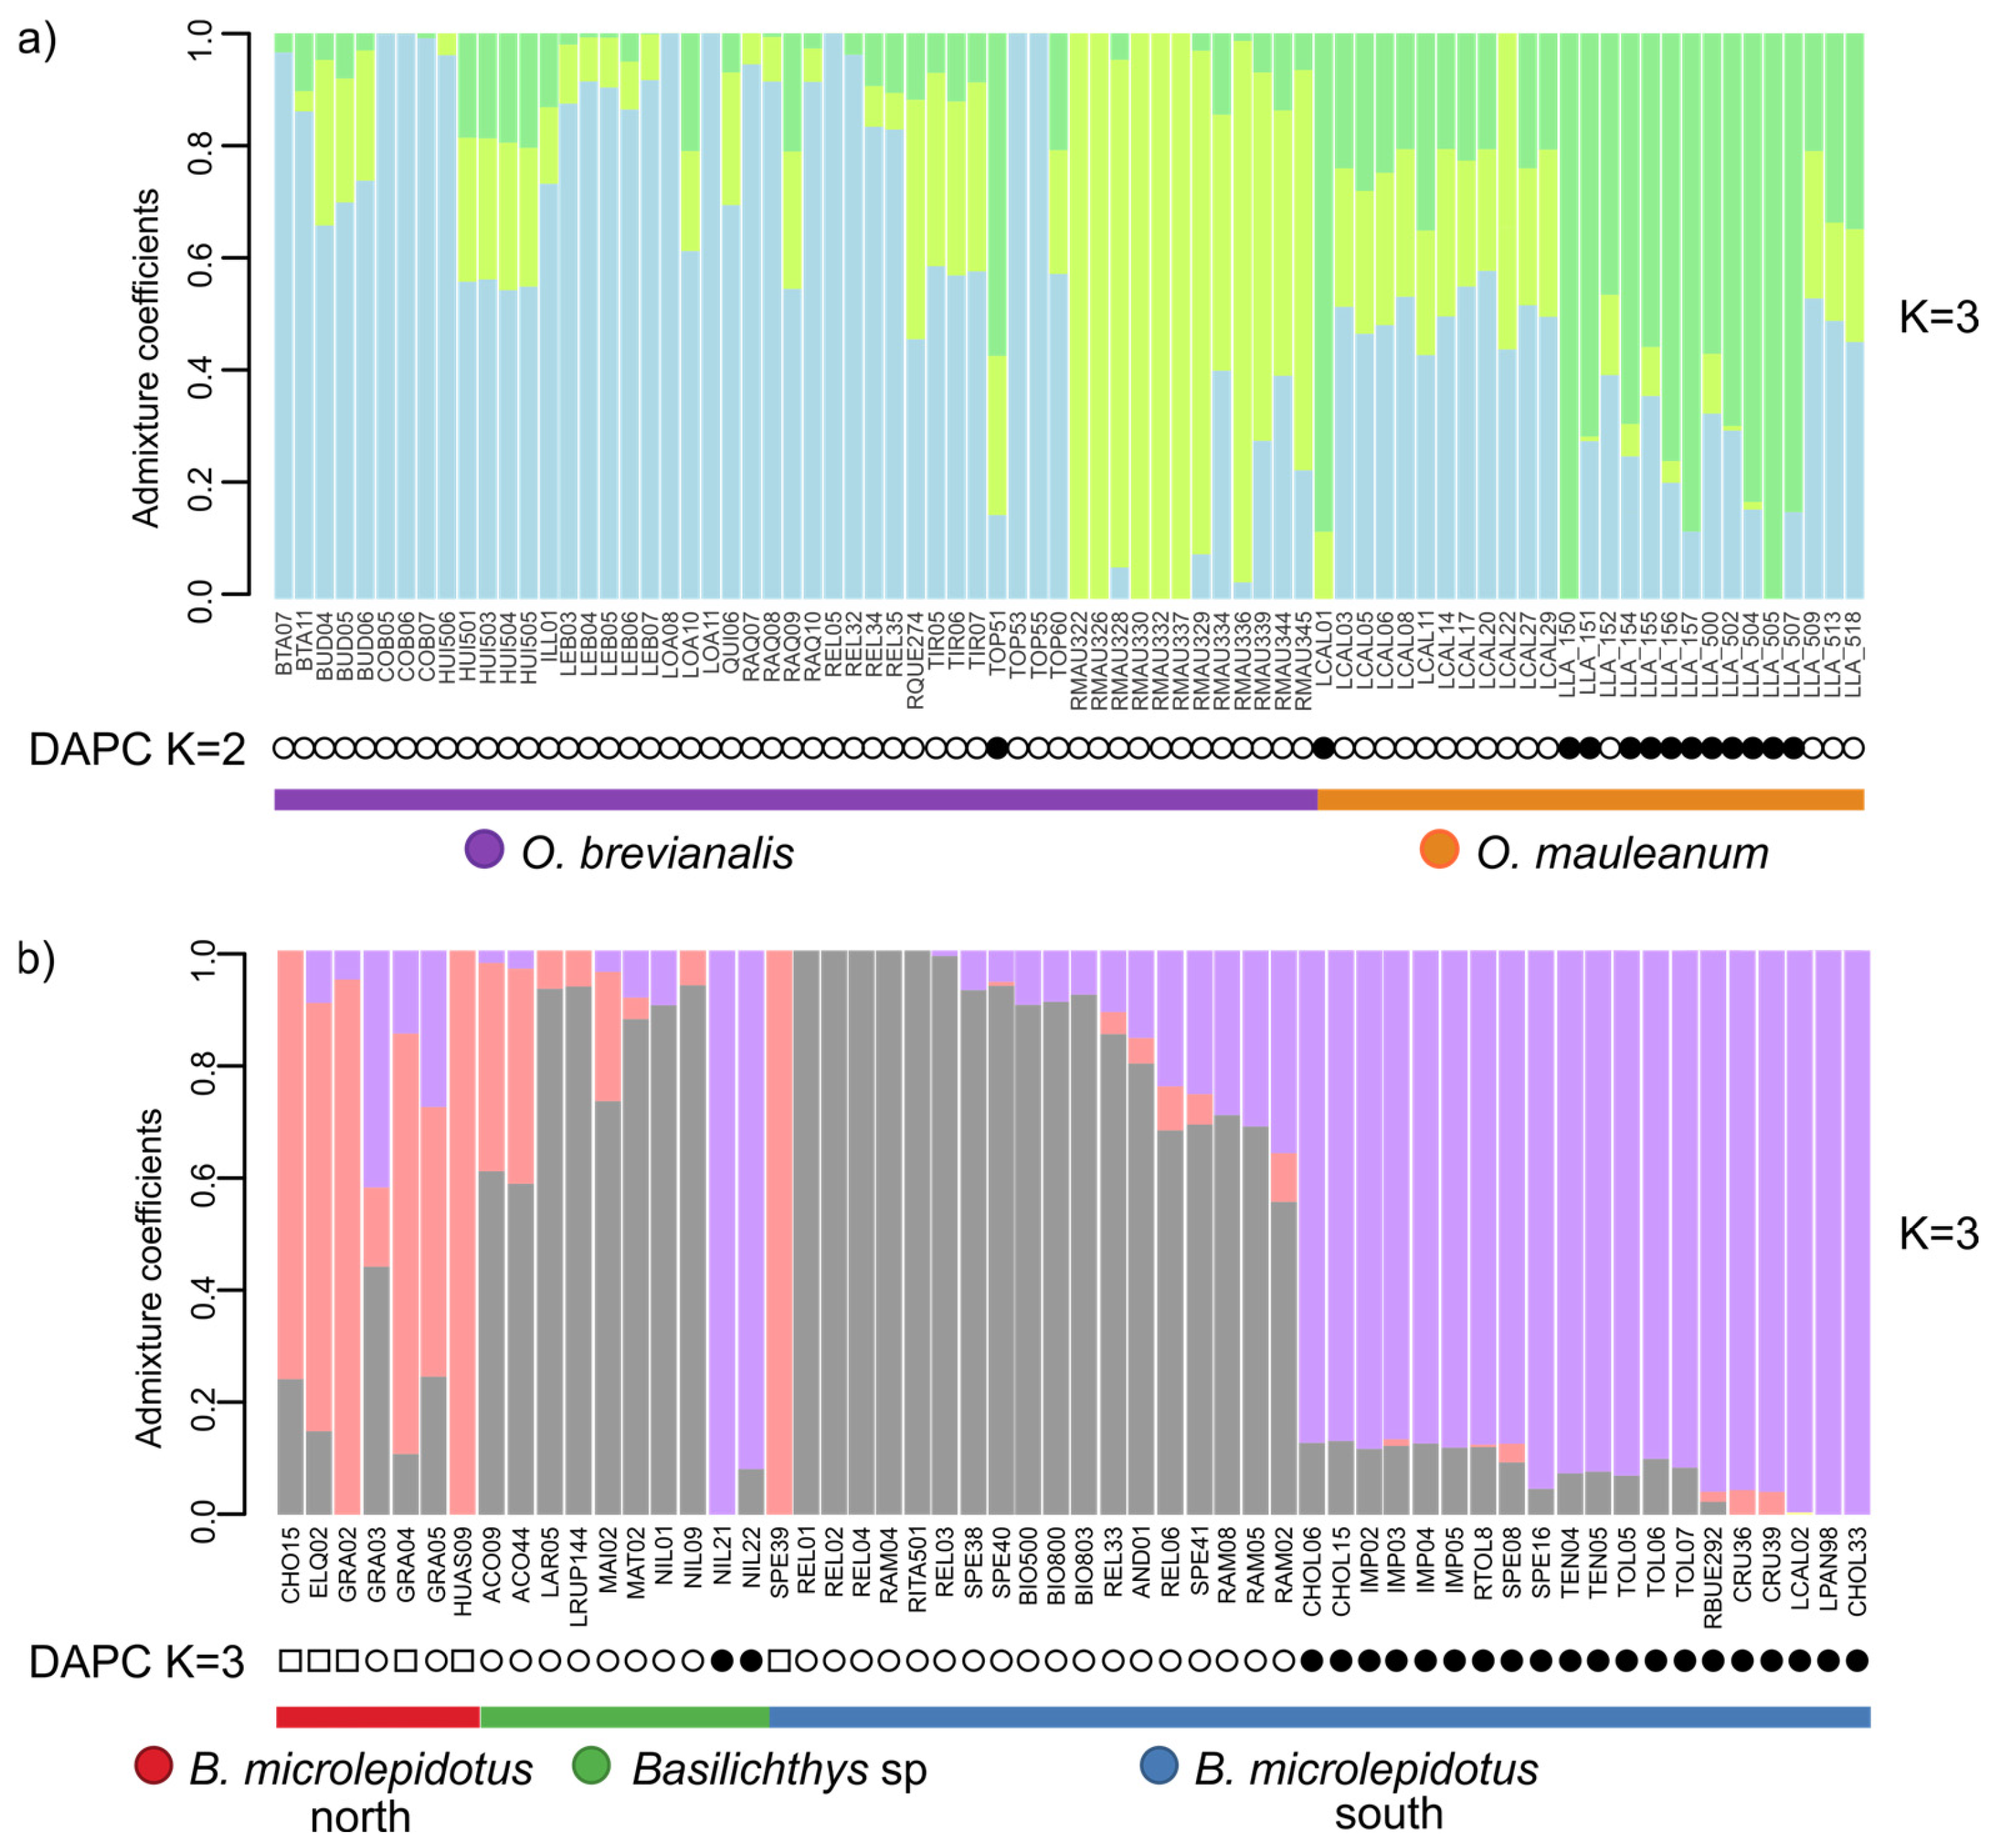
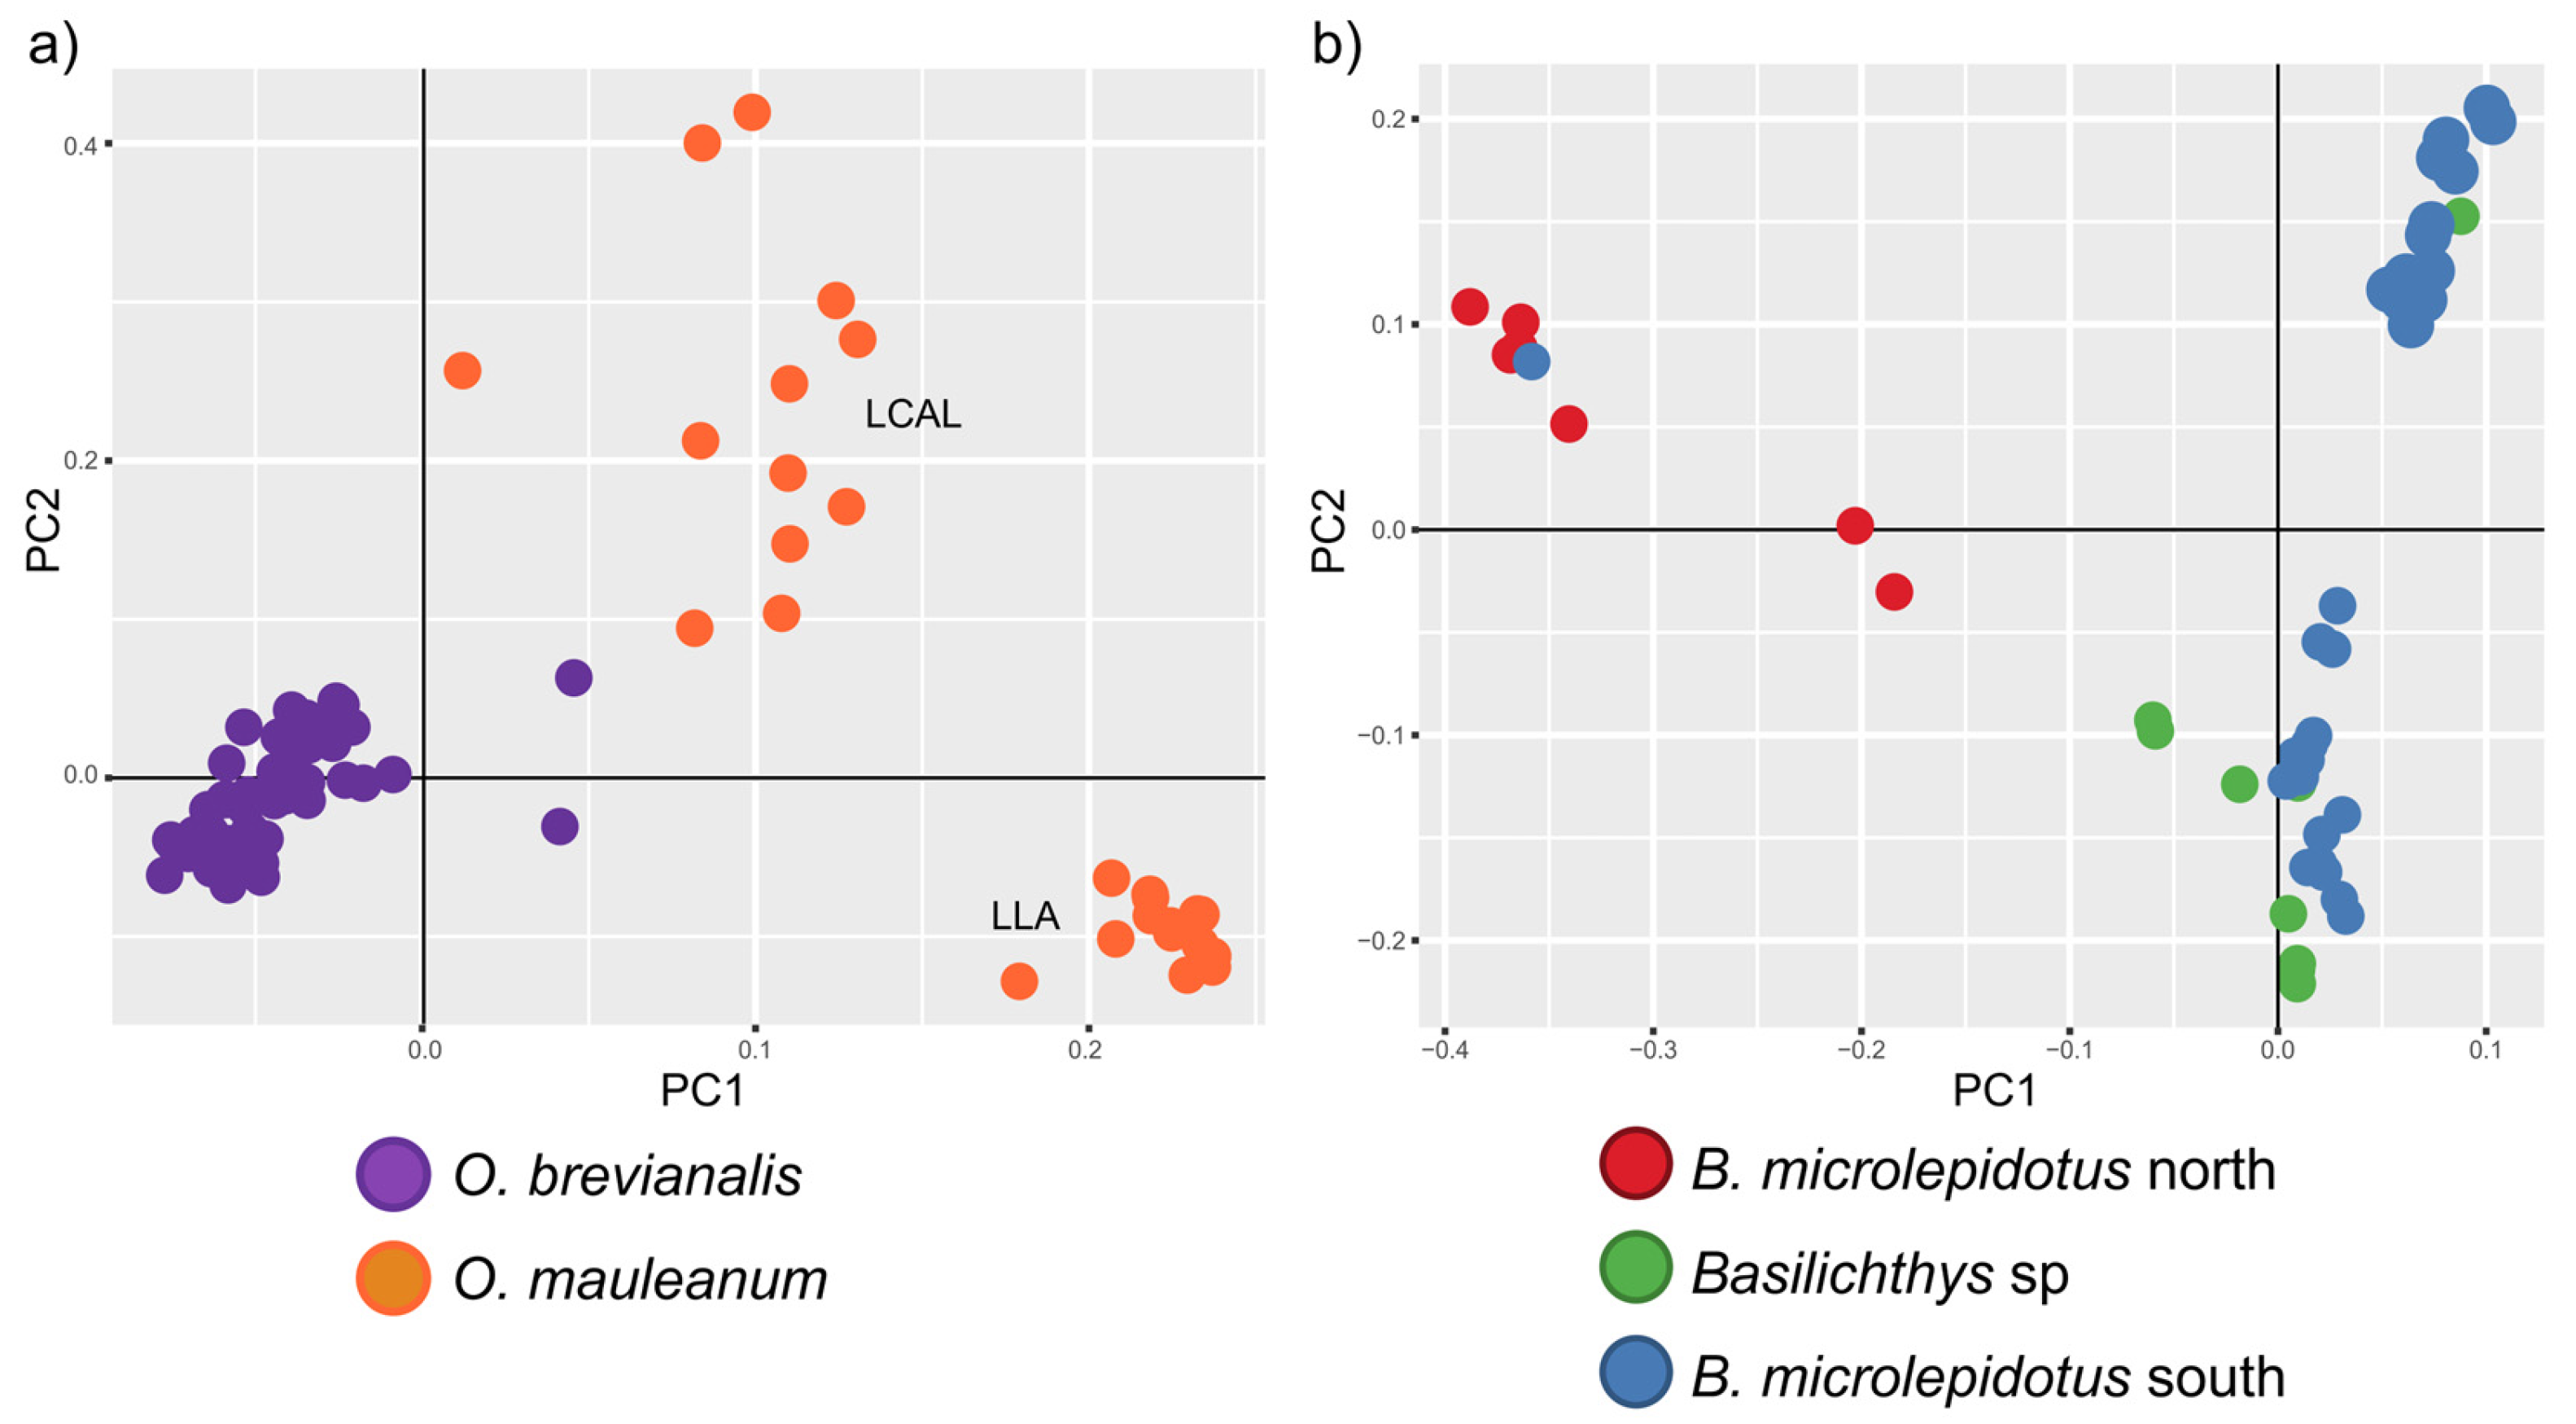
| 2 | 79 (40) | O. brevianalis (52); O. mauleanum (27) | 14,338 | 22,025 | 43.28 | TVM + F + ASC + R3 | 4361 | 2635 | 6957 | 227 | SplitsTree (Figure 3a), LEA and DAPC (Figure 4a), PCA (Figure 5a), BFD (Table 2) |
| 3 | 60 (54) | B. semotilus (4); B. microlepidotus north (7); B. microlepidotus south (39); B. sp. (10) | 6843 | 16,155 | 7.69 | TVM + F + ASC + R2 | 8417 | 1279 | 6606 | 987 | IQTree (Figure 2b) |
| 4 | 56 (49) | B. microlepidotus north (7); B. microlepidotus south (39); B. sp. (10) | 13,680 | 25,596 | 9.53 | TVM + F + ASC + R3 | 6793 | 3404 | 10,111 | 1198 | SplitsTree (Figure 3b), LEA and DAPC (Figure 4b), PCA (Figure 5b), BFD (Table 2) |
| Genus | n Indiv | n Species | Model | MLE | BF | 2 × ln (BF) | Rank |
|---|---|---|---|---|---|---|---|
| Odontesthes | 65 | 2 | O. reg + O.mau/O.brev | −799.19 | 1 | ||
| 3 | O. reg + O. mau + O. brev | −2089.368 | 2580.357 | 15.711 | 2 | ||
| 2 | O. brev + O. mau | −3755.274 | - | - | 3 | ||
| 79 | 2 | DAPC: K1 + K2 | −570.828 | 6368.891 | 17.518 | 2 | |
| 3 | STR: K1 + K2 + K3 | −503.57 | 6503.407 | 17.56 | 1 | ||
| Basilichthys | 59 | 2 | B. semo + B. micro/B. sp | −14,164.594 | - | - | 4 |
| 4 | B. semo + B. micro north + B. micro south + B. sp | −13,630.528 | 1068.1311 | 13.957 | 3 | ||
| 4 | B. semo + DAPC: K1 + K2 + K3 | −13,321.713 | 1685.761 | 14.859 | 2 | ||
| 4 | B. semo + STR: K1+ K2 + K3 | −13,104.867 | 2119.453 | 15.318 | 1 | ||
| 56 | 3 | B. north + B. south + B. sp | −24,156.608 | - | - | 3 | |
| 3 | DAPC: K1 + K2 + K3 | −23,440.831 | 1431.553 | 14.533 | 2 | ||
| 3 | STR: K1 + K2 + K3 | −23,047.263 | 2218.691 | 15.409 | 1 |
2.3. Data Analyses
3. Results
Data Analyses
4. Discussion
4.1. Odontesthes
4.2. Basilichthys
5. Conclusions
Supplementary Materials
Author Contributions
Funding
Institutional Review Board Statement
Informed Consent Statement
Data Availability Statement
Acknowledgments
Conflicts of Interest
References
- Vila, I.; Fuentes, L.; Contreras, M. Peces Límnicos de Chile. Boletín Mueso Nac. Hist. Nat. Chile 1999, 48, 61–75. [Google Scholar] [CrossRef]
- Dyer, B.S. Revisión Sistemática De Los Pejerreyes De Chile (Teleostei, Atheriniforme). Estud. Oceanol. 2000, 19, 99–127. [Google Scholar]
- Habit, E.; Dyer, B.S.; Vila, I. Estado de Conocimiento de Los Peces Dulceacuícolas de Chile. Gayana 2006, 70, 100–112. [Google Scholar] [CrossRef]
- Ramos, V. The Birth of Southern South America. Am. Sci. 1989, 77, 444–450. [Google Scholar]
- Hulton, N.R.J.; Purves, R.S.; McCulloch, R.D.; Sugden, D.E.; Bentley, M.J. The Last Glacial Maximum and Deglaciation in Southern South America. Quat. Sci. Rev. 2002, 21, 233–241. [Google Scholar] [CrossRef]
- Ruzzante, D.E.; Walde, S.J.; Cussac, V.E.; Dalebout, M.L.; Seibert, J.; Ortubay, S.; Habit, E. Phylogeography of the Percichthyidae (Pisces) in Patagonia: Roles of Orogeny, Glaciation, and Volcanism. Mol. Ecol. 2006, 15, 2949–2968. [Google Scholar] [CrossRef]
- Zemlak, T.S.; Habit, E.M.; Walde, S.J.; Carrea, C.; Ruzzante, D.E. Surviving Historical Patagonian Landscapes and Climate: Molecular Insights from Galaxias maculatus. BMC Evol. Biol. 2010, 10, 67. [Google Scholar] [CrossRef]
- Dyer, B.S. Systematic Revision of the South American Silversides (Teleostei, Atheriniformes). Biocell 2006, 30, 69–88. [Google Scholar]
- Campanella, D.; Hughes, L.C.; Unmack, P.J.; Bloom, D.D.; Piller, K.R.; Ortí, G. Multi-Locus Fossil-Calibrated Phylogeny of Atheriniformes (Teleostei, Ovalentaria). Mol. Phylogenet. Evol. 2015, 86, 8–23. [Google Scholar] [CrossRef]
- Hughes, L.C.; Cardoso, Y.P.; Sommer, J.A.; Cifuentes, R.; Cuello, M.; Somoza, G.M.; González-Castro, M.; Malabarba, L.R.; Cussac, V.; Habit, E.M.; et al. Biogeography, Habitat Transitions and Hybridization in a Radiation of South American Silverside Fishes Revealed by Mitochondrial and Genomic RAD Data. Mol. Ecol. 2020, 29, 738–751. [Google Scholar] [CrossRef]
- Betancur-R, R.; Ortí, G.; Stein, A.M.; Marceniuk, A.P.; Alexander Pyron, R. Apparent Signal of Competition Limiting Diversification after Ecological Transitions from Marine to Freshwater Habitats. Ecol. Lett. 2012, 15, 822–830. [Google Scholar] [CrossRef] [PubMed]
- Betancur-R, R.; Ortí, G.; Pyron, R.A. Fossil-Based Comparative Analyses Reveal Ancient Marine Ancestry Erased by Extinction in Ray-Finned Fishes. Ecol. Lett. 2015, 18, 441–450. [Google Scholar] [CrossRef] [PubMed]
- Meier, J.I.; Stelkens, R.B.; Joyce, D.A.; Mwaiko, S.; Phiri, N.; Schliewen, U.K.; Selz, O.M.; Wagner, C.E.; Katongo, C.; Seehausen, O. The Coincidence of Ecological Opportunity with Hybridization Explains Rapid Adaptive Radiation in Lake Mweru Cichlid Fishes. Nat. Commun. 2019, 10, 5391. [Google Scholar] [CrossRef] [PubMed]
- Ricklefs, R.E.; Schluter, D. Species Diversity: Regional and Historical Influences. In Species Diversity in Ecological Communities: Historical and Geographical Perspectives; Ricklefs, E.E., Schluter, D., Eds.; The University of Chicago Press: Chicago, IL, USA, 1993; pp. 350–363. [Google Scholar]
- Losos, J.B. Adaptive Radiation, Ecological Opportunity, and Evolutionary Determinism: American Society of Naturalists E. O. Wilson Award Address. Am. Nat. 2010, 175, 623–639. [Google Scholar] [CrossRef]
- Hughes, L.C.; Somoza, G.M.; Nguyen, B.N.; Bernot, J.P.; González-Castro, M.; Díaz de Astarloa, J.M.; Ortí, G. Transcriptomic Differentiation Underlying Marine-to-Freshwater Transitions in the South American Silversides Odontesthes argentinensis and O. bonariensis (Atheriniformes). Ecol. Evol. 2017, 7, 5258–5268. [Google Scholar] [CrossRef]
- González-Castro, M.; Cardoso, Y.P.; Hughes, L.C.; Ortí, G. Hybridization Is Strongly Constrained by Salinity during Secondary Contact between Silverside Fishes (Odontesthes, Atheriniformes). Heredity 2022, 129, 233–243. [Google Scholar] [CrossRef]
- Vila, I.; Habit, E. Current Situation of the Fish Fauna in the Mediterranean Region of Andean River Systems in Chile. Fishes Mediterr. Environ. 2015, 2015, 1–19. [Google Scholar] [CrossRef]
- Klink, A.; Eckmann, R. Age and Growth, Feeding Habits, and Reproduction of Cauque mauleanum (Steindachner 1896) (Pisces: Atherinidae) in Southern Chile. Stud. Neotrop. Fauna Environ. 1985, 20, 239–249. [Google Scholar] [CrossRef]
- Vargas, C.; Contreras, M.; Vila, I. Edad y Crecimiento de Odontesthes brevianalis (Günther 1880) En La Laguna Conchalí (31°53′; 71°32′), Chile. Gayana 2002, 66, 199–202. [Google Scholar] [CrossRef]
- Véliz, D.; Catalán, L.; Pardo, R.; Acuña, P.; Díaz, A.; Poulin, E.; Vila, I. The Genus Basilichthys (Teleostei: Atherinopsidae) Revisited along Its Chilean Distribution Range (21° to 40° S) Using Variation in Morphology and MtDNA. Rev. Chil. Hist. Nat. 2012, 85, 49–59. [Google Scholar] [CrossRef]
- Comte, S.; Vila, I. Modalidad Re- Productiva de Basilichthys microlepidotus (Jenyns) En El Río Choapa. (Pisces: Atherinidae). An. Mus. Hist. Nat. Valparaíso 1987, 18, 85–94. [Google Scholar]
- Comte, S.; Vila, I. Spawning of Basilichthys microlepidotus (Jenyns). J. Fish Biol. 1992, 41, 971–981. [Google Scholar] [CrossRef]
- Bahamondes, I.; Soto, D.; Vila, I. Hábitos Alimentarios de Las Espe—Cies de Atherinidae Del Embalse Rapel. Medio Ambient. 1979, 4, 3–18. [Google Scholar]
- IUCN. The IUCN Red List of Threatened Species. Version 2024-1. Available online: https://www.iucnredlist.org (accessed on 28 June 2024).
- Vila, I.; Veloso, A.; Schlatter, R.; Ramirez, C. Macrófitas y Vertebrados de Los Sistemas Límnicos de Chile; Editorial Universitaria: Santiago, Chile, 2006. [Google Scholar]
- Cortés-Miranda, J.; Veliz, D.; Rico, C.; Vega-Retter, C. Copy number variations in response to chronic pollution: Basilichthys microlepidotus in central Chile. Neotrop. Ichthyol. 2025, 23, e240083. [Google Scholar] [CrossRef]
- Peterson, B.K.; Weber, J.N.; Kay, E.H.; Fisher, H.S.; Hoekstra, H.E. Double Digest RADseq: An Inexpensive Method for de Novo SNP Discovery and Genotyping in Model and Non-Model Species. PLoS ONE 2012, 7, e37135. [Google Scholar] [CrossRef]
- Eaton, D.A.R. PyRAD: Assembly of de Novo RADseq Loci for Phylogenetic Analyses. Bioinformatics 2014, 30, 1844–1849. [Google Scholar] [CrossRef]
- Danecek, P.; Auton, A.; Abecasis, G.; Albers, C.A.; Banks, E.; Depristo, M.A.; Handsaker, R.E.; Lunter, G.; Marth, G.T.; Sherry, S.T.; et al. The Variant Call Format and VCFtools. Bioinformatics 2011, 27, 2156–2158. [Google Scholar] [CrossRef]
- Nguyen, L.T.; Schmidt, H.A.; Von Haeseler, A.; Minh, B.Q. IQ-TREE: A Fast and Effective Stochastic Algorithm for Estimating Maximum-Likelihood Phylogenies. Mol. Biol. Evol. 2015, 32, 268–274. [Google Scholar] [CrossRef]
- Kalyaanamoorthy, S.; Minh, B.Q.; Wong, T.K.F.; Von Haeseler, A.; Jermiin, L.S. ModelFinder: Fast Model Selection for Accurate Phylogenetic Estimates. Nat. Methods 2017, 14, 587–589. [Google Scholar] [CrossRef]
- Hoang, D.T.; Chernomor, O.; Von Haeseler, A.; Minh, B.Q.; Vinh, L.S. UFBoot2: Improving the Ultrafast Bootstrap Approximation. Mol. Biol. Evol. 2018, 35, 518–522. [Google Scholar] [CrossRef]
- Huson, D.H.; Bryant, D. Application of Phylogenetic Networks in Evolutionary Studies. Mol. Biol. Evol. 2006, 23, 254–267. [Google Scholar] [CrossRef] [PubMed]
- R Core Team. R: A Language and Environment for Statistical Computing 2023. Available online: https://www.R-project.org. (accessed on 28 March 2025).
- Frichot, E.; François, O. LEA: An R Package for Landscape and Ecological Association Studies. Methods Ecol. Evol. 2015, 6, 925–929. [Google Scholar] [CrossRef]
- Jombart, T. Adegenet: A R Package for the Multivariate Analysis of Genetic Markers. Bioinformatics 2008, 24, 1403–1405. [Google Scholar] [CrossRef]
- Luu, K.; Bazin, E.; Blum, M.G.B. Pcadapt: An R Package to Perform Genome Scans for Selection Based on Principal Component Analysis. Mol. Ecol. Resour. 2017, 17, 67–77. [Google Scholar] [CrossRef]
- Mantel, N. The Detection of Disease Clustering and a Generalized Regression Approach. Cancer Res. 1967, 27, 209–220. [Google Scholar] [CrossRef]
- Dray, S.; Dufour, A.B. The Ade4 Package: Implementing the Duality Diagram for Ecologists. J. Stat. Softw. 2007, 22, 1–20. [Google Scholar] [CrossRef]
- Goudet, J. HIERFSTAT, a Package for R to Compute and Test Hierarchical F-Statistics. Mol. Ecol. Notes 2005, 5, 184–186. [Google Scholar] [CrossRef]
- Leache, A.D.; Fujita, M.K. Bayesian Species Delimitation in West African Forest Geckos (Hemidactylus fasciatus). Proc. R. Soc. B Biol. Sci. 2010, 277, 3071–3077. [Google Scholar] [CrossRef]
- Bouckaert, R.; Vaughan, T.G.; Barido-Sottani, J.; Duchêne, S.; Fourment, M.; Gavryushkina, A.; Heled, J.; Jones, G.; Kühnert, D.; De Maio, N.; et al. BEAST 2.5: An Advanced Software Platform for Bayesian Evolutionary Analysis. PLoS Comput. Biol. 2019, 15, e1006650. [Google Scholar] [CrossRef]
- Lischer, H.E.L.; Excoffier, L. PGDSpider: An Automated Data Conversion Tool for Connecting Population Genetics and Genomics Programs. Bioinformatics 2012, 28, 298–299. [Google Scholar] [CrossRef]
- Kass, R.; Raftery, A. Bayes Factors. J. Am. Stat. Assoc. 1995, 90, 773–795. [Google Scholar] [CrossRef]
- Clapperton, C.M. The Quaternary Glaciation of Chile: A Review. Rev. Chil. Hist. Nat. 1994, 67, 369–383. [Google Scholar]
- Harrison, S.; Glasser, N.F. The Pleistocene Glaciations of Chile. In Quarternary Glaciations—Extent and Chronology; Ehlers, J., Gibbard, P.L., Hughes, P.D., Eds.; Elsevier B.V. Hera: Amsterdam, The Netherlands, 2011; pp. 739–756. [Google Scholar]
- Ruzzante, D.E.; Walde, S.J.; Gosse, J.C.; Cussac, V.E.; Habit, E.; Zemlak, T.S.; Adams, E.D.M. Climate Control on Ancestral Population Dynamics: Insight from Patagonian Fish Phylogeography. Mol. Ecol. 2008, 17, 2234–2244. [Google Scholar] [CrossRef] [PubMed]
- González-Castro, M.; Díaz De Astarloa, J.M.; Cousseau, M.B.; Figueroa, D.E.; Delpiani, S.M.; Bruno, D.O.; Guzzoni, J.M.; Blasina, G.E.; Deli Antoni, M.Y. Fish Composition in a South-Western Atlantic Temperate Coastal Lagoon: Spatial temporal Variation and Relationships with Environmental Variables. J. Mar. Biol. Assoc. UK 2009, 89, 593–604. [Google Scholar] [CrossRef]
- González-Castro, M.; Rosso, J.J.; Mabragana, E.; Diaz De Astarloa, J.M. Surfing among Species, Populations and Morphotypes: Inferring Boundaries between Two Species of New World Silversides (Atherinopsidae). Comptes Rendus—Biol. 2016, 339, 10–23. [Google Scholar] [CrossRef]
- Ringuelet, R.A. Zoogeografía y Ecología de Los Peces de Aguas Continentales de La Argentina y Consideraciones Sobre Las Áreas Ictiológicas de América Del Sur. Ecosur 1975, 2, 3. [Google Scholar]
- Arratia, G.; Peñafort, M.B.; Menu-Marque, S. Peces de La Región Sureste de Los Andes y Sus Probables Relaciones Biogeográficas Actuales. Deserta 1983, 7, 7. [Google Scholar]
- Quezada-Romegialli, C.; Fuentes, M.; Véliz, D. Comparative Population Genetics of Basilichthys microlepidotus (Atheriniformes: Atherinopsidae) and Trichomycterus areolatus (Siluriformes: Trichomycteridae) in North Central Chile. Environ. Biol. Fishes 2010, 89, 173–186. [Google Scholar] [CrossRef]
- Habit, E.; Parra, O.; Valdovinos, C. Ictiofauna De Un Sistema Fluvial Receptor De Aguas Servidas: Respuestas a Una Nueva Planta De Tratamiento (Rio Quilque, Chile Central). Gayana 2005, 69, 94–103. [Google Scholar] [CrossRef]
- Pardo, R.; Vila, I.; Capella, J.J. Competitive Interaction between Introduced Rainbow Trout and Native Silverside in a Chilean Stream. Environ. Biol. Fishes 2009, 86, 353–359. [Google Scholar] [CrossRef]
- Cortes-Miranda, J.; Véliz, D.; Flores-Prado, L.; Sallaberry, M.; Vega-Retter, C. Genetic Diversity and Origin of a Fish Population Recently Colonizing a Reservoir: The Case of Basilichthys microlepidotus, Central Chile. Popul. Ecol. 2022, 64, 227–237. [Google Scholar] [CrossRef]
- Vega-Retter, C.; Rojas-Hernández, N.; Cortés-Miranda, J.; Véliz, D.; Rico, C. Genome Scans Reveal Signals of Selection Associated with Pollution in Fish Populations of Basilichthys microlepidotus, an Endemic Species of Chile. Sci. Rep. 2024, 14, 15727. [Google Scholar] [CrossRef] [PubMed]
- Vega-Retter, C.; Vila, I.; Véliz, D. Signatures of Directional and Balancing Selection in the Silverside Basilichthys microlepidotus (Teleostei: Atherinopsidae) Inhabiting a Polluted River. Evol. Biol. 2015, 42, 156–168. [Google Scholar] [CrossRef]
- Vega-Retter, C.; Rojas-Hernandez, N.; Vila, I.; Espejo, R.; Loyola, D.E.; Copaja, S.; Briones, M.; Nolte, A.W.; Véliz, D. Differential Gene Expression Revealed with RNA-Seq and Parallel Genotype Selection of the Ornithine Decarboxylase Gene in Fish Inhabiting Polluted Areas. Sci. Rep. 2018, 8, 4820. [Google Scholar] [CrossRef]
- Rojas-Hernandez, N.; Véliz, D.; Vega-Retter, C. Selection of Suitable Reference Genes for Gene Expression Analysis in Gills and Liver of Fish under Field Pollution Conditions. Sci. Rep. 2019, 9, 3459. [Google Scholar] [CrossRef] [PubMed]

Disclaimer/Publisher’s Note: The statements, opinions and data contained in all publications are solely those of the individual author(s) and contributor(s) and not of MDPI and/or the editor(s). MDPI and/or the editor(s) disclaim responsibility for any injury to people or property resulting from any ideas, methods, instructions or products referred to in the content. |
© 2025 by the authors. Licensee MDPI, Basel, Switzerland. This article is an open access article distributed under the terms and conditions of the Creative Commons Attribution (CC BY) license (https://creativecommons.org/licenses/by/4.0/).
Share and Cite
Briñoccoli, Y.F.; Cardoso, Y.P.; Cifuentes, R.; Habit, E.M.; Ortí, G. Genomic Diversity and Species Boundaries of the Chilean Silversides Fishes (Atheriniformes, Atherinopsidae). Diversity 2025, 17, 347. https://doi.org/10.3390/d17050347
Briñoccoli YF, Cardoso YP, Cifuentes R, Habit EM, Ortí G. Genomic Diversity and Species Boundaries of the Chilean Silversides Fishes (Atheriniformes, Atherinopsidae). Diversity. 2025; 17(5):347. https://doi.org/10.3390/d17050347
Chicago/Turabian StyleBriñoccoli, Yanina F., Yamila P. Cardoso, Roberto Cifuentes, Evelyn M. Habit, and Guillermo Ortí. 2025. "Genomic Diversity and Species Boundaries of the Chilean Silversides Fishes (Atheriniformes, Atherinopsidae)" Diversity 17, no. 5: 347. https://doi.org/10.3390/d17050347
APA StyleBriñoccoli, Y. F., Cardoso, Y. P., Cifuentes, R., Habit, E. M., & Ortí, G. (2025). Genomic Diversity and Species Boundaries of the Chilean Silversides Fishes (Atheriniformes, Atherinopsidae). Diversity, 17(5), 347. https://doi.org/10.3390/d17050347