Article

Local Variation in Ground Arthropod Diversity Rises as Distance to Residential Areas Decreases in a Mature Evergreen Forest

Hubei Key Laboratory of Edible Wild Plants Conservation and Utilization, College of Life Sciences, Hubei Normal University, Huangshi 435002, China
*
Authors to whom correspondence should be addressed.
Diversity 2025, 17(5), 344; https://doi.org/10.3390/d17050344
Submission received: 29 March 2025 / Revised: 8 May 2025 / Accepted: 8 May 2025 / Published: 13 May 2025
(This article belongs to the Special Issue The Impact of Ecocide on Diversity)

Abstract

:
Ground-dwelling arthropods interact with vertebrates, plants, detritus, and microbes as important players in forest ecosystems. Human disturbance threatens the diversity of forest arthropods, with varied impacts on different taxa. However, we understand little of the impact of human disturbance on overwintering ground-dwelling arthropod diversity in mature subtropical evergreen forests. In order to test how ground-dwelling arthropod diversity varies by the distance to residential areas, we set 108 pitfall traps along four 100 m transects beginning near residential areas along the edges of a mature subtropical evergreen forest in Central China. We collected 30,616 arthropods, representing 96 morphospecies. The results show that the Shannon, Simpson, and Pielou’s evenness indices, as well as the effective number of species at α = 1 and 2, decrease when the pitfall traps are within 60 m of the residential areas. Moreover, the coefficients of variation in these three indices are higher at the sites closer to the residential areas by 11.54–17.72%. Such high variations in these widely used diversity and evenness indices indicate that estimation bias in arthropod diversity is more likely to occur at sites closer to residential areas. We suggest that different aspects of community composition should be studied to assess the effects of human disturbance on ground-dwelling arthropod diversity.

1. Introduction

Forests conserve a large number of arthropod species [1,2,3,4], which structure the ecological networks that contain mutualistic and antagonistic interactions within forest ecosystems [3,5,6,7,8]. Arthropods are important components of forest ecosystems, with some taxa, such as spiders (Araneae), ants (Hymenoptera: Formicidae), and dung beetles (Coleoptera: Scarabaeoidea), being indicators for forest health and integrity [3,9,10,11]. Understanding how human disturbance, such as deforestation, land use change, and residential activity, affects forest arthropod diversity is crucial for maintaining the ecological functions and ecosystem services of forests [12,13,14,15,16]. The negative effects of human disturbance on arthropod communities can be huge [2,13,17,18]. For example, deforestation can result in the loss of over 6000 arthropod species in a tropical forest [2] and over 700 in a Sahelian forest [19]. But there are findings indicating positive effects [20,21,22] or no effect [23] of human disturbance on arthropod diversity. In some cases, arthropod richness in forests increases during human disturbance due to the introduction of invasive species [22,24,25] and the growth of generalist species [21,26], while some endemic and specialist species may be less common and distribute less widely [27,28]. Some studies show that different taxa of arthropods may respond differently to human disturbance [29,30,31,32,33]. For example, the diversity of spiders decreases as canopy openness increases given the composition shift from generalists to specialists in areas with intact and closed canopies [32,34]. Meanwhile, invasive ants [25] and dung beetles [29,30] are common in fragmented forests, where open canopies, wood debris, and human wastes promote the population growth of these species. Here, populations of some endemic and specialist ants decline as the level of human disturbance increases [26,31]. Within certain orders of arthropods, such as Araneae [35], Diptera [4], and Hymenoptera [36], the variation in diversity at the different levels of human disturbance is high [37].
We have limited understanding whether a high variation in responses to human disturbance is present across the taxa of arthropods, especially among overwintering arthropods [38,39] and those in subtropical forests [18,23]. With the growing human populations in subtropical regions [40,41], deforestation for urbanization increases and is projected to continue increasing [42,43,44]. Land use and other human activities have also become more frequent as the results of increasing human populations in these regions [45,46]. Despite the efforts in afforestation and restoration to achieve a net increase in forested area in Central China, deforestation and fragmentation occur more frequently in mature subtropical evergreen forests to accommodate human populations within this highly populated region [47,48]. These urban forests provide ecosystem functions and services for millions of humans from several mega cities, including Wuhan, Changsha, and Hefei, and from hundreds of surrounding townships [49,50]. But they are more vulnerable to urbanization and industrialization than those forests in Southern and Western China in terms of maintaining ecological functions and ecosystem services [48,51]. Under increasing human disturbance, it is important to understand how human disturbance affects arthropod diversity in mature subtropical evergreen forests in Central China.
Dwelling on the ground or near the land surface, ground-dwelling arthropods are useful indicators for human disturbance in forests because of their sensitivity to different levels of disturbance and efficiency of sampling [37,52,53]. On the one hand, the composition, including abundance [54] and richness [39], of different taxa of ground-dwelling arthropods varies between intact and disturbed forests. Many common taxa of ground-dwelling arthropods, such as spiders [30,32,34], ants [25,55], dung beetles [29,30], crickets (Orthoptera: Grylloidea) [56], flies (Diptera) [4,57], and isopods (Isopoda: Oniscidae) [58], are sensitive to human disturbance. On the other hand, the efficiency of the sampling of ground-dwelling arthropods is higher than that for flying arthropods [52,59,60]. Ground-dwelling arthropods can be collected using pitfall traps and identified according to morphological differences [52]. Pitfall trapping, first developed by Hertz [61] and Barber [62], is the most frequently used sampling technique for ground-dwelling arthropods [52,60]. The two common spatial layouts of pitfall traps are grid and transect [60]. The former evenly covers the sampling location with known separation, while the latter is suitable for testing the impact of abiotic gradients on arthropods [60,63]. By controlling for the edge effect and the effect of habitat heterogeneity on arthropod diversity [64,65], gridded pitfall traps set along transects can be used to measure how different levels of human disturbance affect ground-dwelling arthropod diversity [63,66].
Although some studies on the impact of human disturbance on ground-dwelling arthropods in subtropical forests identified the decline in diversity of some common arthropod taxa [4,25,29,30,34,55,56,57,58,67], little evidence of such impacts on the communities of ground-dwelling arthropods is available [67,68]. Under the rapid change in land use from forests to urbanized area in Central China [43,44,49,51], there is an urgent need to understand the impact of human activities on arthropods [7,22,28], especially among overwintering arthropods [38,39] within urban forests [8,18,26]. Overwintering arthropods are important players in maintaining the ecological stability and ecosystem functions of subtropical forests in winter when other decomposers become less active than in warmer seasons [38,39]. This study aims to assess how distance to residential areas affects overwintering ground-dwelling arthropod diversity, while controlling for the edge effect and the impact of habitat heterogeneity using gridded pitfall traps in a mature subtropical evergreen forest in Central China. The results will improve our understanding of the responses of forest arthropod communities to human disturbance and inform the sustainable management of subtropical evergreen forests to maintain biodiversity, functions, and ecosystem services.

2. Materials and Methods
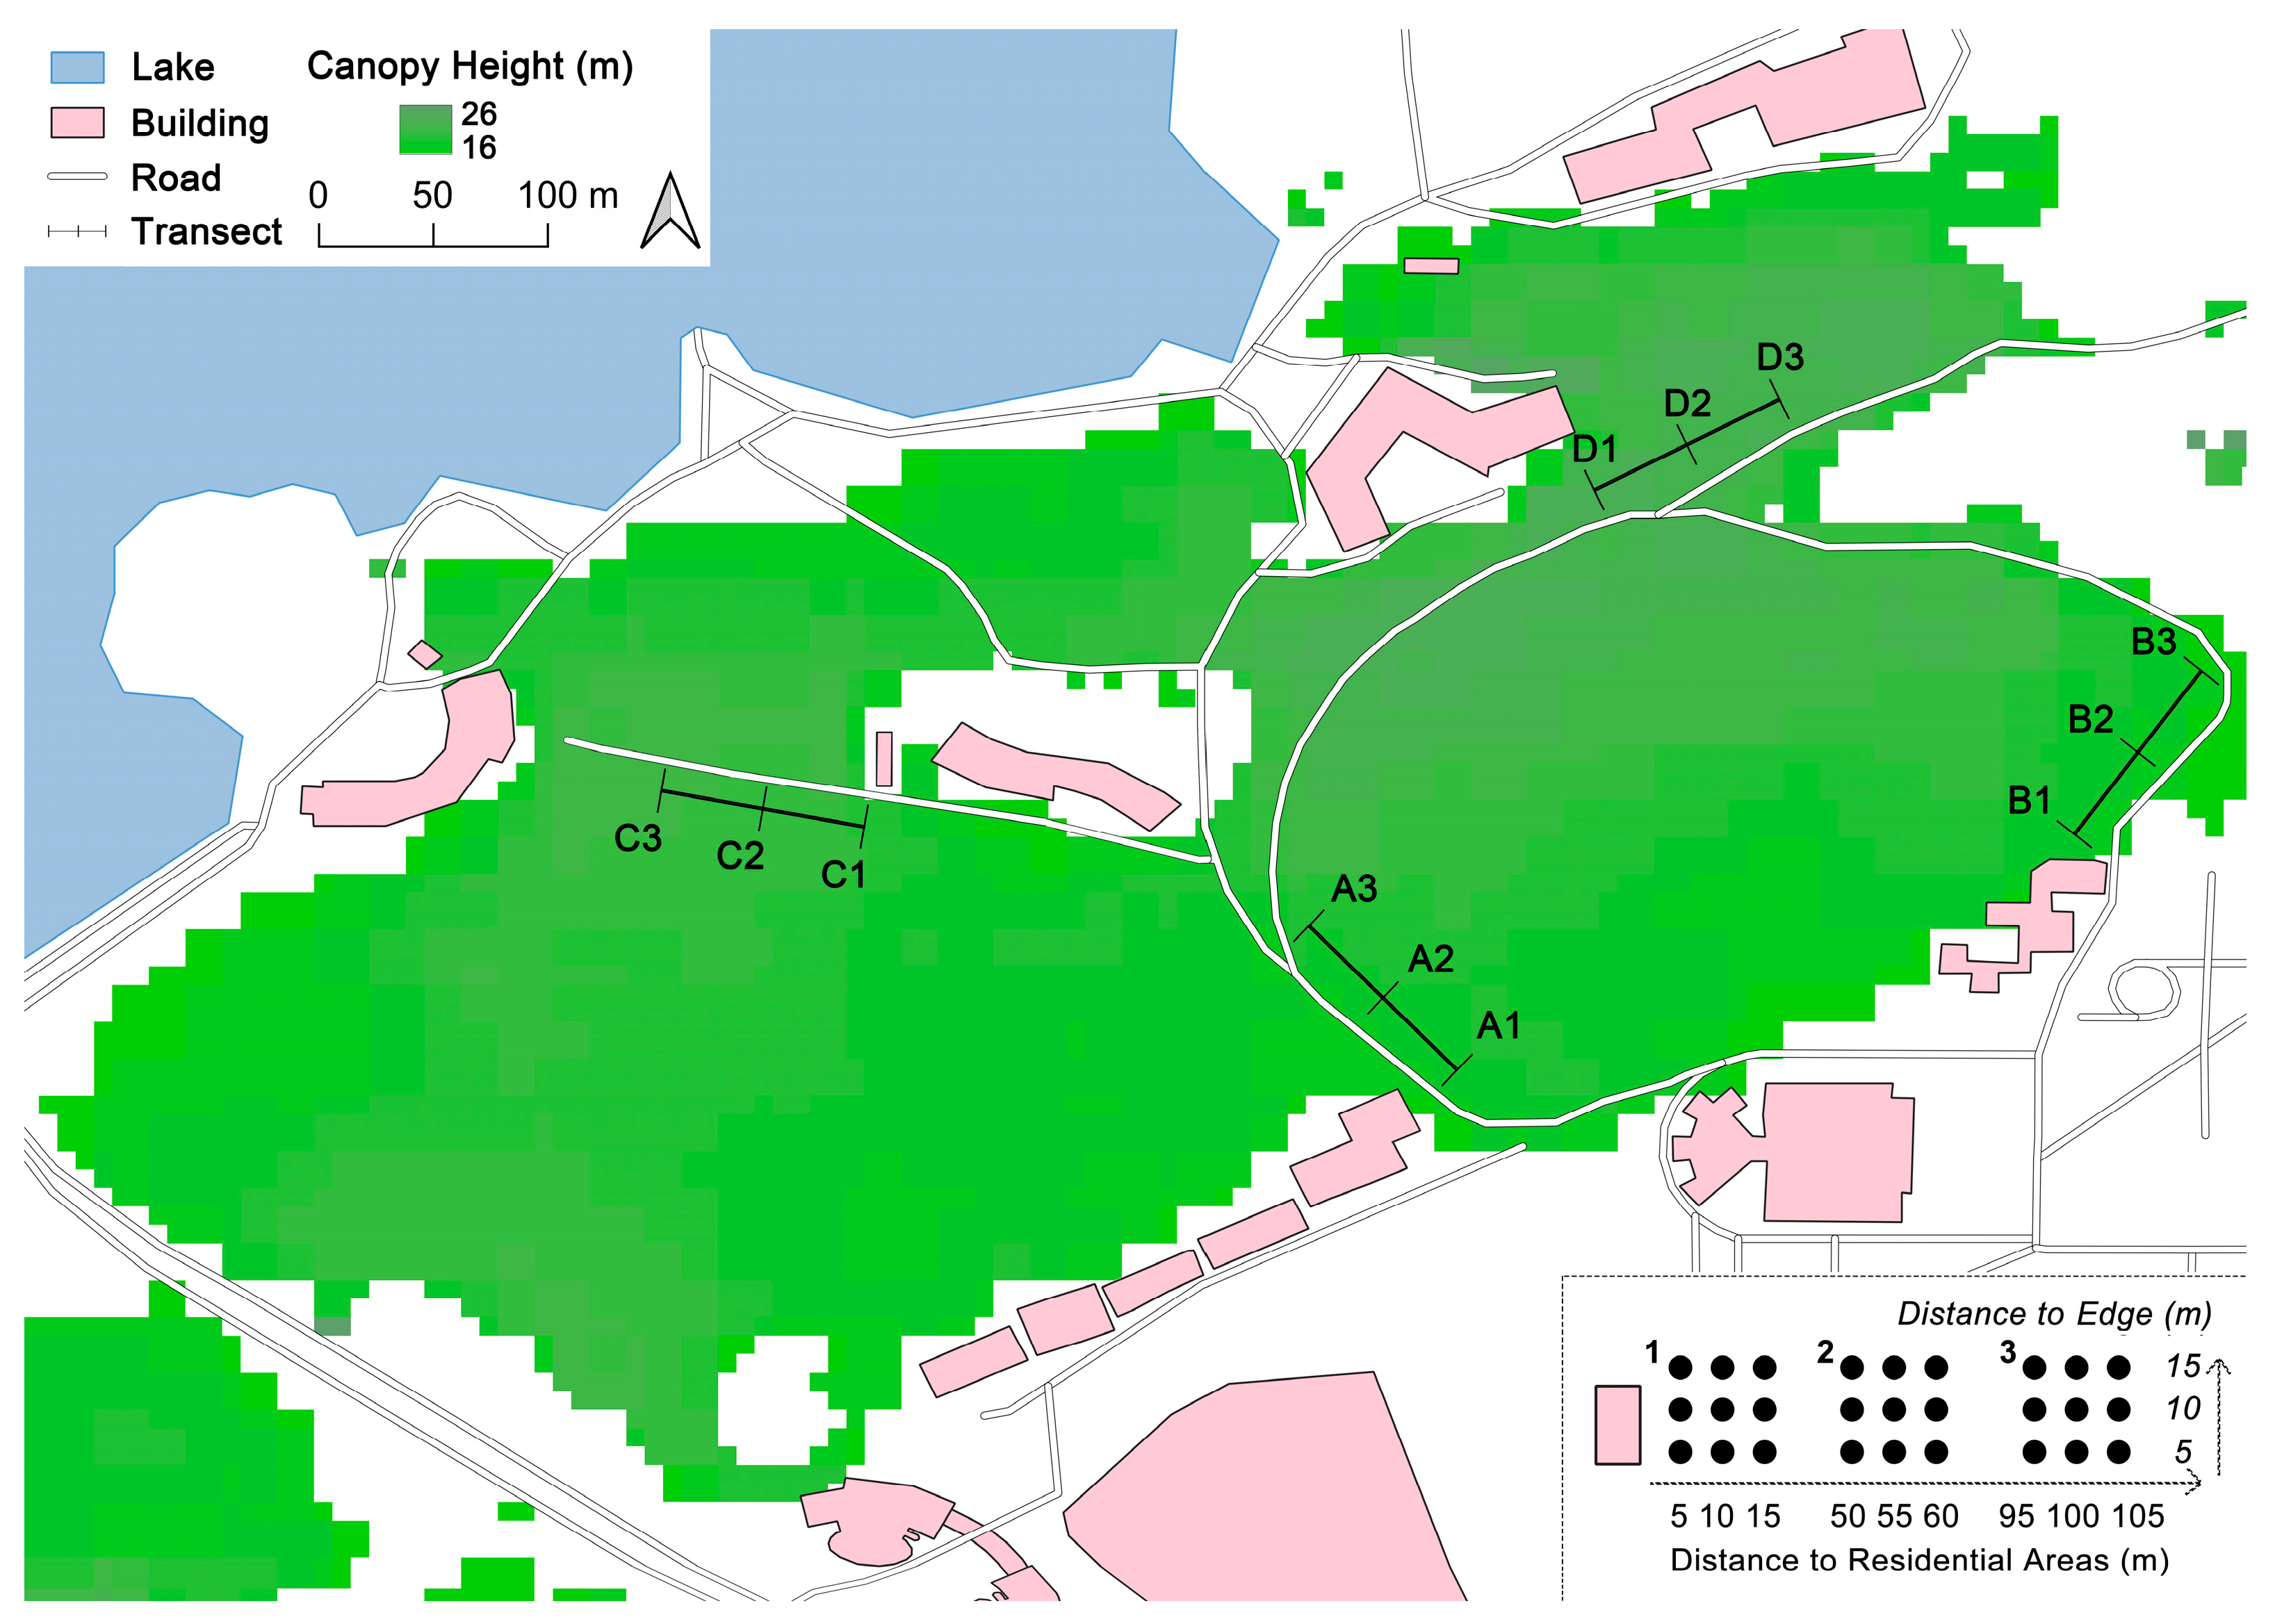
2.1. Study Area

This study was conducted in a 32-hectare mature subtropical evergreen forest in Central China (30°13′50″–30°13′52″ N, 115°3′45″–115°3′47″ E) with a residential area surrounding it (Figure 1). Within the 1 km distance from this urban forest, there are over 35 thousand residents [69], and the population density ranges from 1050 to 1800 per hectare based on our family visits. The study area is located in the subtropical monsoon climate zone, with a mean annual temperature of 17 °C, and there is 1352 mm of annual precipitation [70]. The forest age is 62 years old, and the dominant tree species is Cinnamomum camphora (L.) J.Presl, with a mean canopy closure of 83% and a canopy height between 16 and 26 m [48]. Elevation ranges from 21 m to 90 m, the slope is between 3 and 18° [48], and the soil type is yellow-brown soil [69]. The soil was documented under the code of B12 in the Genetic Soil Classification of China (GSCC) [71]. It is a type of luvisol with a high organic carbon content, a pH between 5.5 and 7.0, and a cation exchange capacity (CEC) above 24 cmol/kg [72].

2.2. Pitfall Trapping

We prepared 108 pitfall traps using 200 mL transparent polyethylene plastic cups (top diameter 6.2 cm, bottom diameter 4.5 cm, and height 8.2 cm), each containing 100 mL mixture of brown sugar water and 70% ethanol. The 100 mL mixture includes 5 g brown sugar, 15 mL white vinegar, 80 mL water, and 5 mL 70% ethanol, which is effective for attracting and preserving ground-dwelling arthropods [73]. We inserted the pitfall traps into 8 cm wide and 10 cm deep holes on 27 October 2024 and collected overwintering ground-dwelling arthropods for 10 days until 6 November 2024. The daily temperature range during the collection period was 15–25 °C, and the mean daily temperature was 22 °C (±4 °C). The total precipitation during this period was 2 mm, the mean relative humidity was 81% (±6%), and the mean daily near surface wind speed was 2 m/s (±2 m/s) based on the meteorological data recorded by a weather station 1 km away from the study area [70]. The maximum length of consecutive sunny days in December 2024 and January 2025 was less than 5 days, and the study area was closed in February 2025 due to the Spring Festival, which prevented further sampling efforts on the arthropods over this winter.
The 108 pitfall traps were set along four 100 m transects from the edge near residential areas to the inner forest (Figure 1). At the start, midpoint, and end of each transect, three grids of 9 traps were deployed by 3 rows and 3 columns with a 5 m distance between each pair of adjacent traps (Figure 1). Each transect started 5 m away from the nearest residential area, so the distances from residential areas of the three grids are 5–15 m, 50–60 m, and 95–105 m, respectively. To control for the edge effect and the impact of habitat heterogeneity [66], the four transects were set in parallel to forest edges (the distances of 5, 10, and 15 m from the edge) near four residential buildings (Figure 1). We checked that the canopy closure at each pitfall trap was above 80% and the slope of the transect was below 5°. We also recorded the number of pieces of human trash at size > 5 cm and the number of visible pieces of plastic trash within a circle of diameter 5 m from each pitfall trap.

2.3. Diversity Indices

At the lab, we washed out the residue of mixture and dust from samples using 70% ethanol, and preserve the samples in 108 centrifuge tubes, each containing the arthropods from an individual pitfall trap. We then identified each collected arthropod using stereo microscopes (SZ 650 B2L 0.7–4.5× Zoom, Chongqing Optec Instrument Co., Ltd. (Chongqing, China)) based on the taxonomic and morphological characteristics of the samples and those of the identified morphospecies [74]. We sorted the individuals of the same morphospecies into a labeled centrifuge tube preserved in 70% ethanol. A data sheet for the morphospecies composition of the samples from each pitfall trap was prepared for rank abundance assessment and diversity analysis.
Based on the composition data, we first assessed the rank abundance of the morphospecies by fitting null, preemption, Zipf, and lognormal models using the R 4.4.3 package vegan [75]. The model with the lowest Akaike information criterion (AIC) fits the data best. Rank abundance is useful for assessing the representation of samples for a target community [76]. In order to assess the spatial dependence of the samples collected from the 108 pitfall traps, we calculated the Bray–Curtis dissimilarity (Equation (1); BC) of the arthropods between each pair of pitfall traps to evaluate the dissimilarity of species composition [77].
B C i j = 1 2 C i j S i + S j ,
where Si and Sj are the numbers of species at the ith and jth pitfall traps, Cij is the number of species occurring at both the pitfall traps, and BCij is the Bray–Curtis dissimilarity between the two pitfall traps. A value of 0 indicates that two pitfall traps share all the species, and a value of 1 indicates that the two pitfall traps do not share any species [77]. Bray–Curtis dissimilarity is useful for assessing if there could be a problem of pseudoreplication in the pitfall traps [78,79].
We then calculated the abundance (total number of individuals; Equation (2); N); morphospecies richness (total number of morphospecies; S); and four indices, namely Shannon’s diversity index (Equation (3); H) [80], Simpson’s diversity index (Equation (4); D) [81], Margalef’s richness index (Equation (5); d) [82], and Pielou’s evenness index (Equation (6); J) [83], of each pitfall trap.
N = i = 1 S n i ,
where ni is the number of the ith of S morphospecies collected in the given pitfall trap.
H = i = 1 S n i N l n ( n i N ) ,
D = 1 i = 1 S n i N 2 ,
d = S 1 ln N ,
J = H ln S ,
We also estimated the effective number of species (ENS) [84] at α = 1 and 2 based on inverting Renyi entropy using the R package divo [85]. The effective number of species evaluates diversity as the number of species in an equivalent community with equally abundant species [86]. These six diversity and evenness indices have been widely used to measure and assess the diversity of biological communities [87,88,89], including arthropods [2,21].

2.4. Analysis of Variance

We conducted two analyses to confirm if arthropod diversity was affected by human disturbance and if the variations in arthropod diversity indices were different at different levels of human disturbance. First, we checked the normality using the Shapiro–Wilk test and homogeneity of variance using Levene’s test of abundance, morphospecies richness, and the six diversity indices. We then conducted two-way analysis of variance (ANOVA) to test if abundance, morphospecies richness, and each of the six diversity indices of the 108 pitfall traps vary by the distances to the forest edge (5, 10, and 15 m) and the distances to the residential areas (5, 10, 15, 50, 55, 60, 95, 100, and 105 m). Heatmaps were produced to visualize mean abundance, morphospecies richness, and each of the six diversity indices by the distances to the forest edge and to the residential areas using the R package ggplot2 [90]. Multiple comparison over the estimated marginal means using the R package emmeans was conducted if significant effects were detected from two-way ANOVA (i.e., p < 0.05) [91], while the difference in Shannon index was confirmed based on the modified t-test [92]. Second, the coefficient of variation (CV; Equation (7)) of abundance, morphospecies richness, and each of the six diversity indices within each grid, namely the 9 pitfall traps set by 3 rows and 3 columns, was calculated. One-way ANOVA was then applied to the CV to analyze if CV varies by the distances from the grid centers to the residential areas, i.e., 5–15, 50–60, and 95–105 m. The distance to the forest edge was not considered here because no edge effect was detected from first analysis. Multiple comparison was conducted if the mean of the CV varies by the distance to the residential areas using the R package emmeans [91].
C V = s t a n d a r d   d e v i a t i o n m e a n × 100 % ,

3. Results

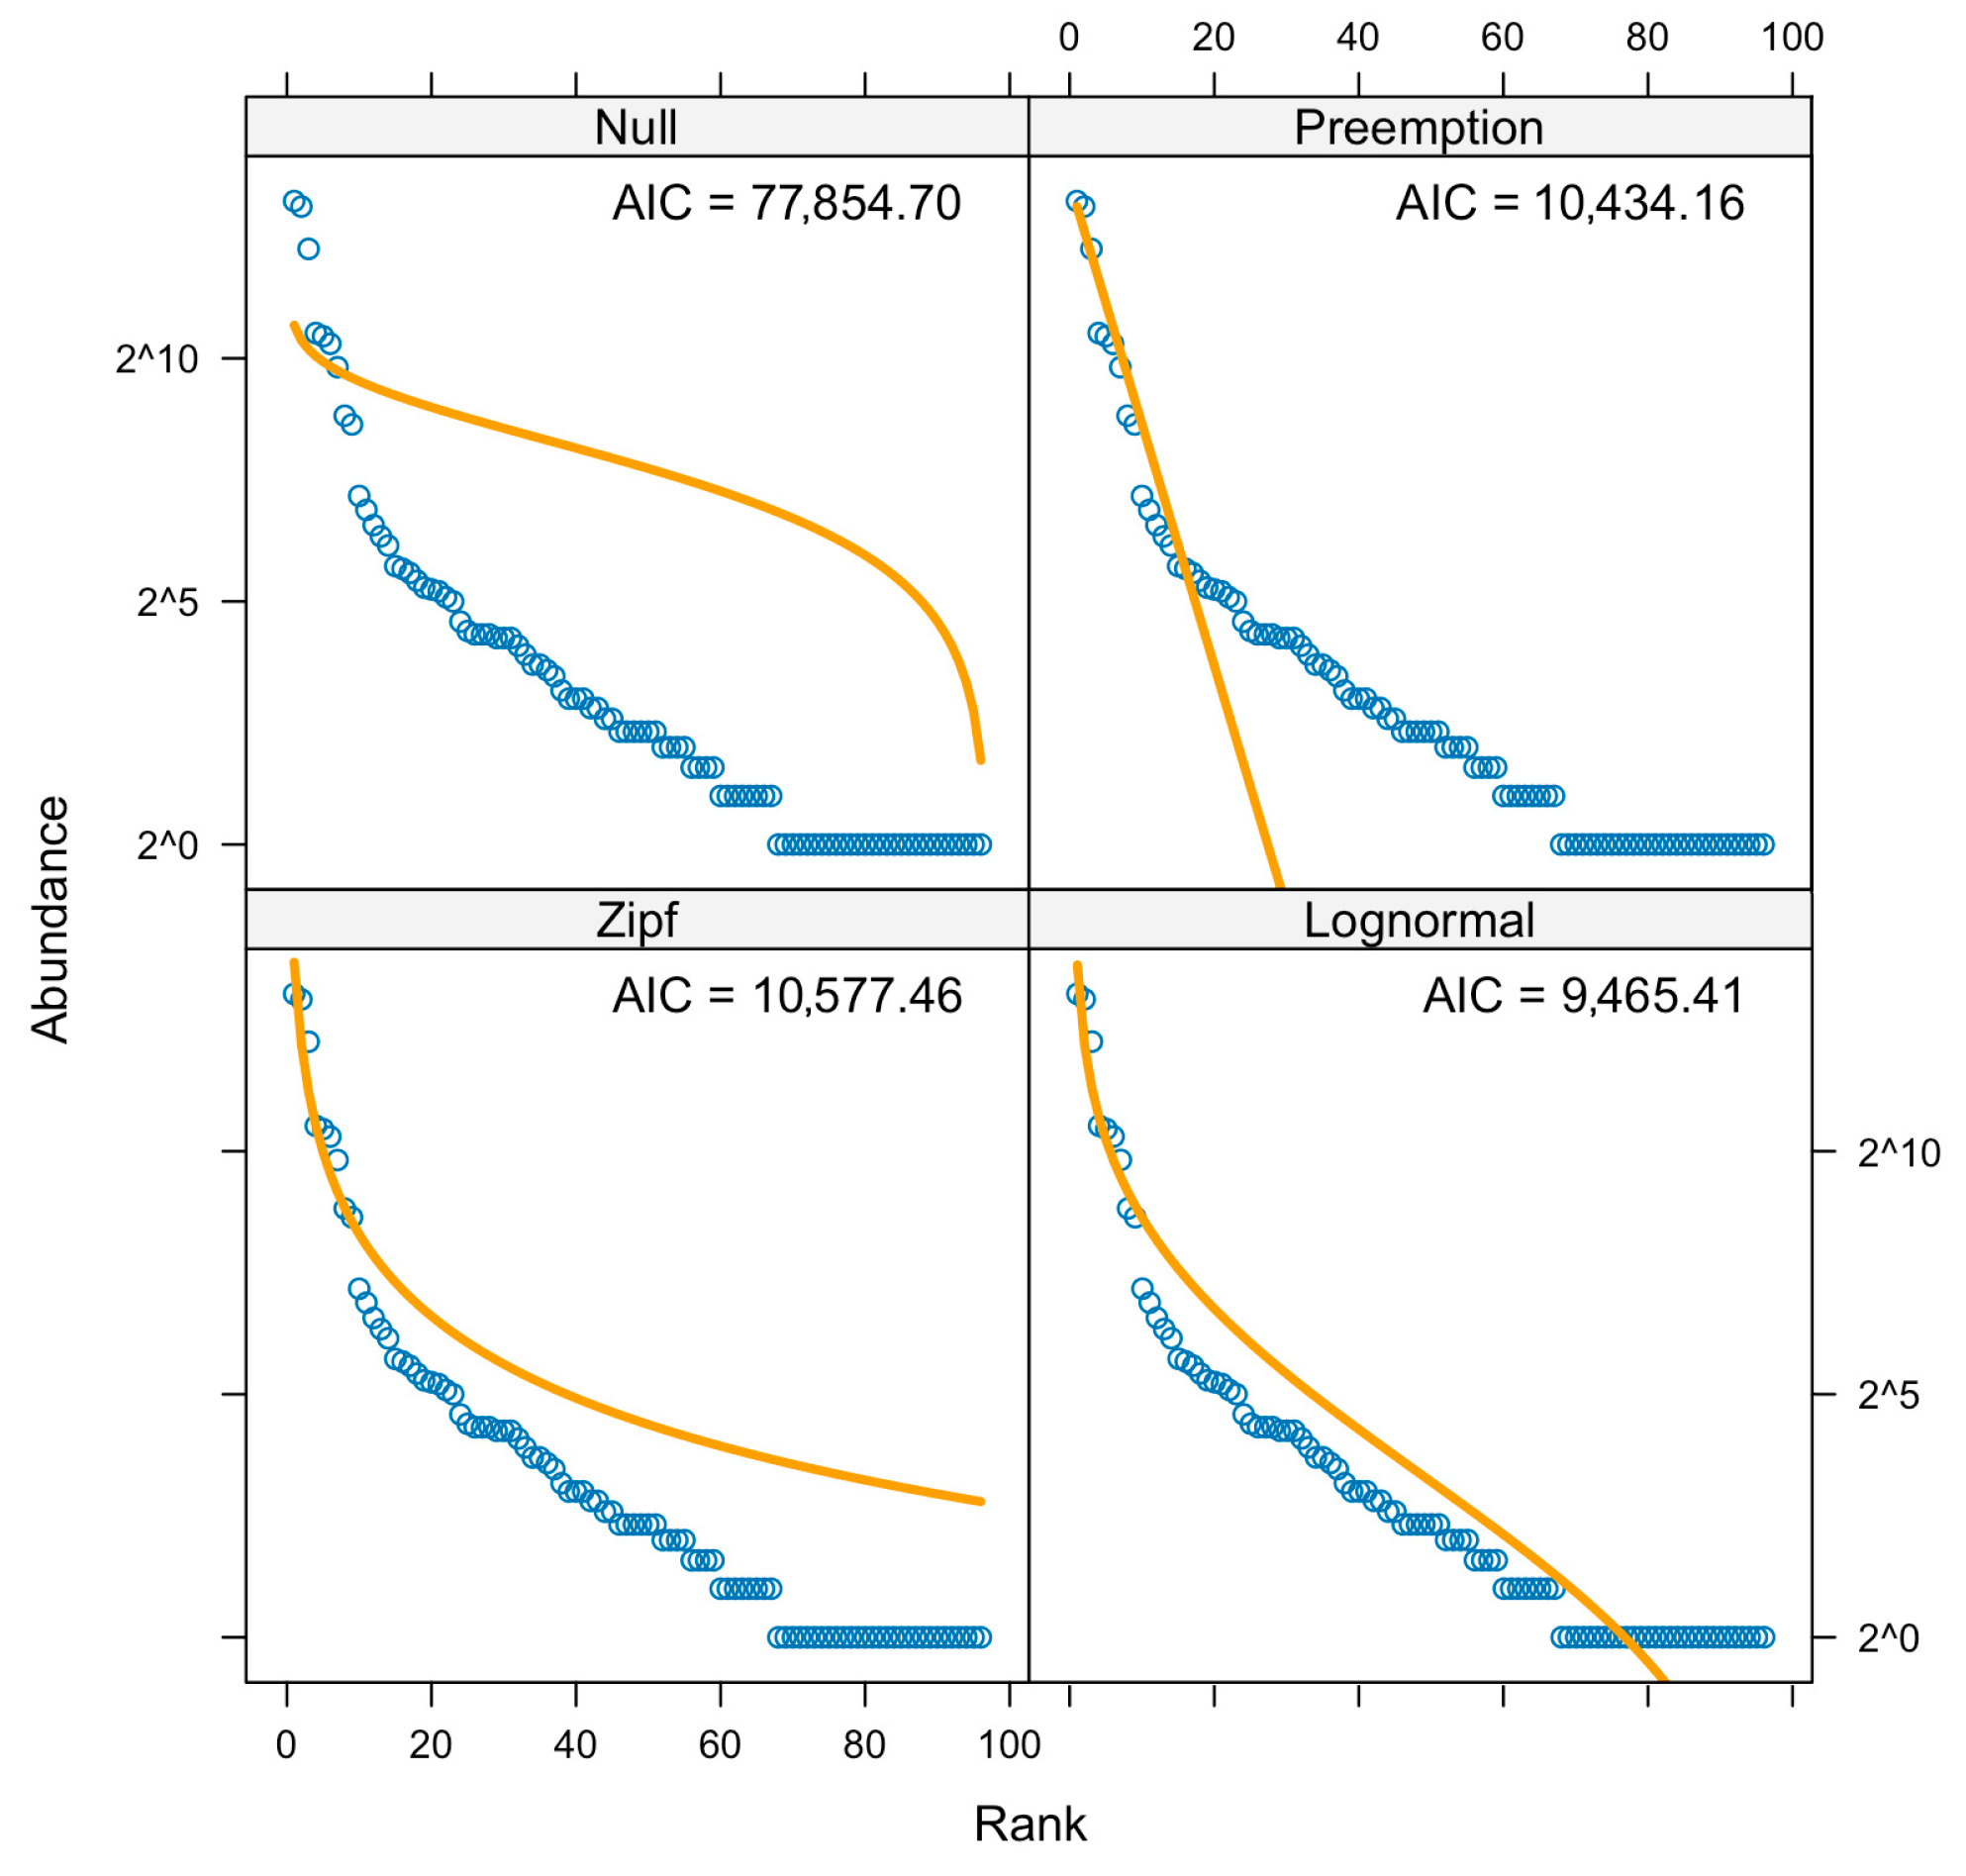
3.1. Community Composition

In total, 30,616 arthropod individuals of five classes (i.e., Chilopoda, Arachnida, Malacostraca, Collembola, and Insecta), 16 orders, and 96 morphospecies were collected and identified (Table 1; Table A1). The number of Insecta morphospecies collected from each grid of pitfall traps accounts for over 71.8% of the morphospecies richness from the same grid. The most abundant order is Hymenoptera, accounting for 81.7% individuals of the samples, followed by Diptera (6.7% of the samples), both of which are the most diverse order with the highest morphospecies richness of 20 morphospecies. There are thirty-three singletons (i.e., morphospecies collected from only one pitfall trap) and seven doubletons (i.e., morphospecies collected from only two pitfall traps), where Araneae (seven singletons and three doubletons) and Diptera (seven singletons and one doubleton) are the two orders with most singletons and doubletons. The abundance of each morphospecies varies from one to nine thousand six hundred and forty-eight individuals, with a mean of three hundred and nineteen and a median of five individuals. For 59 morphospecies, fewer than 10 individuals were trapped by the 108 pitfall traps. The numbers of arthropods collected by the 108 pitfall traps vary from 31 to 1202, with a mean of 283 and a median of 204 individuals. And the numbers of arthropod morphospecies of the 108 pitfall traps range from 5 to 35 with both a mean and a median of 13 morphospecies.
The rank abundance curves of these morphospecies are shown in Figure 2, with the best fitted model as the log-normal model (AIC = 9465.41). The samples represent the ground-dwelling arthropod community in the study area, with three morphospecies of ants being the three most abundant taxa [76]. Regarding dissimilarity in morphospecies composition within and among the grids, Bray–Curtis dissimilarity between each pair of the 108 pitfall traps ranges from 0.100 to 0.882, with only 10 pairs below 0.333, and 2880 out of 5778 pairs ≥ 0.500 (Figure 3). There is no difference in Bray–Curtis dissimilarity among the 12 grids (one-way ANOVA; p = 0.36).

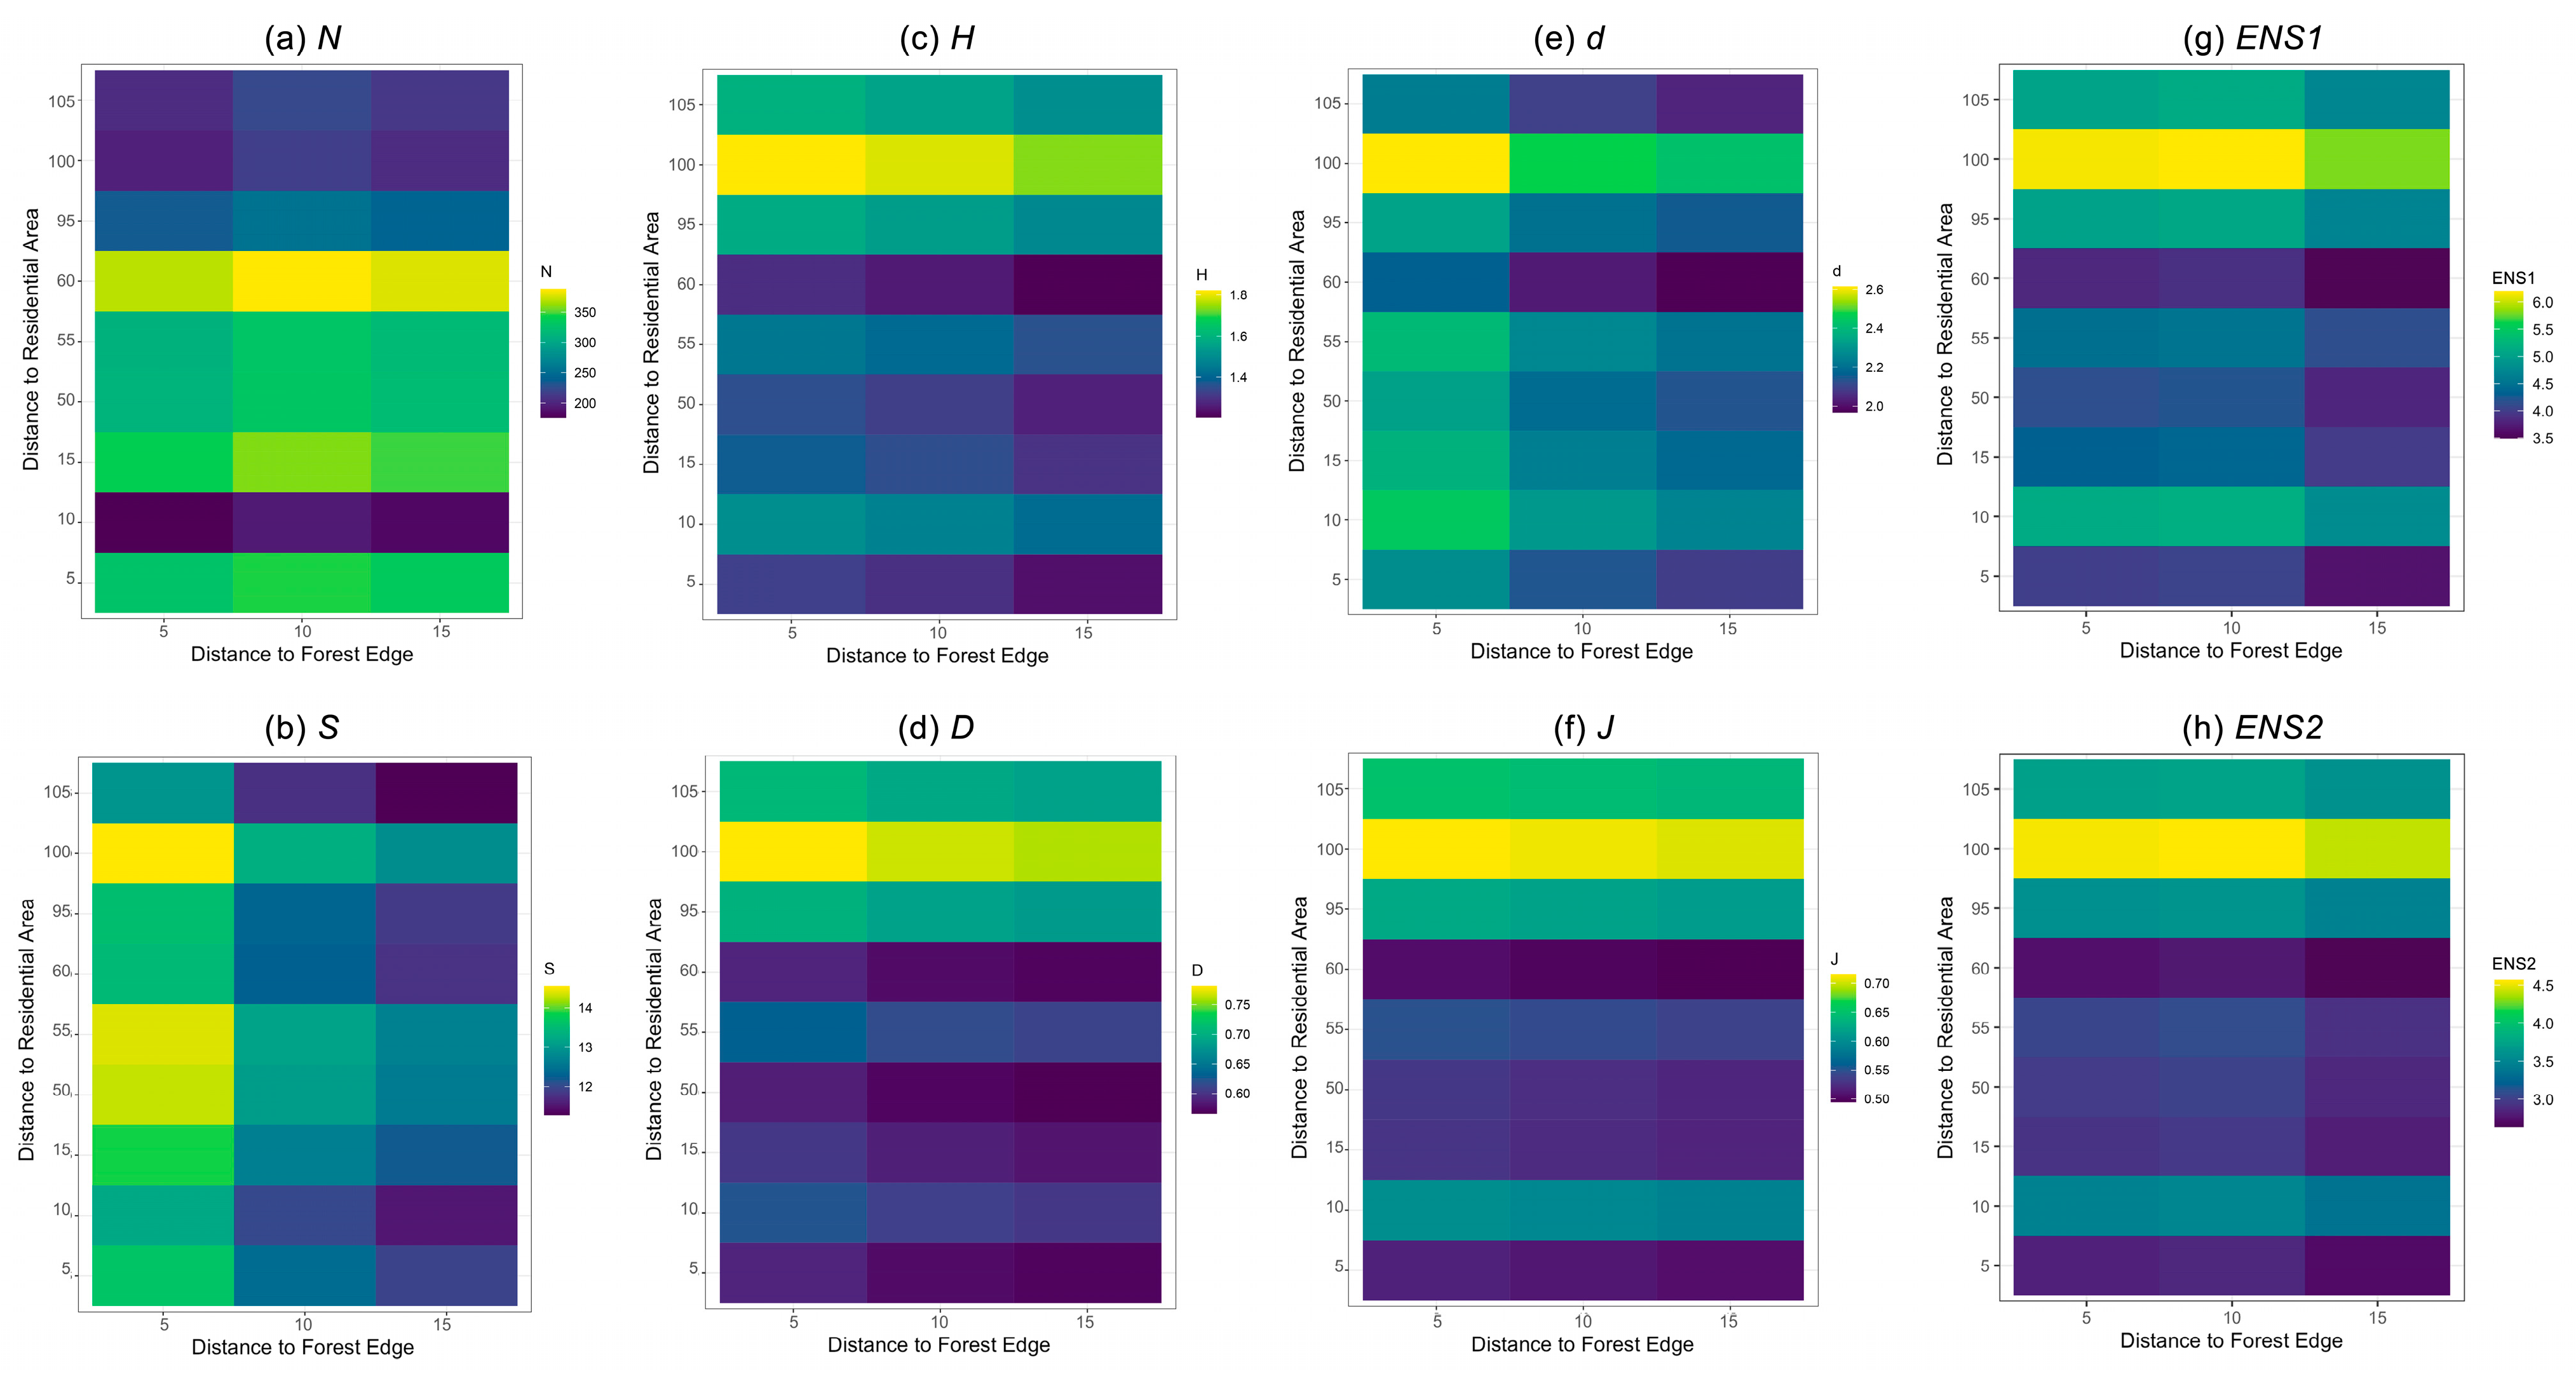
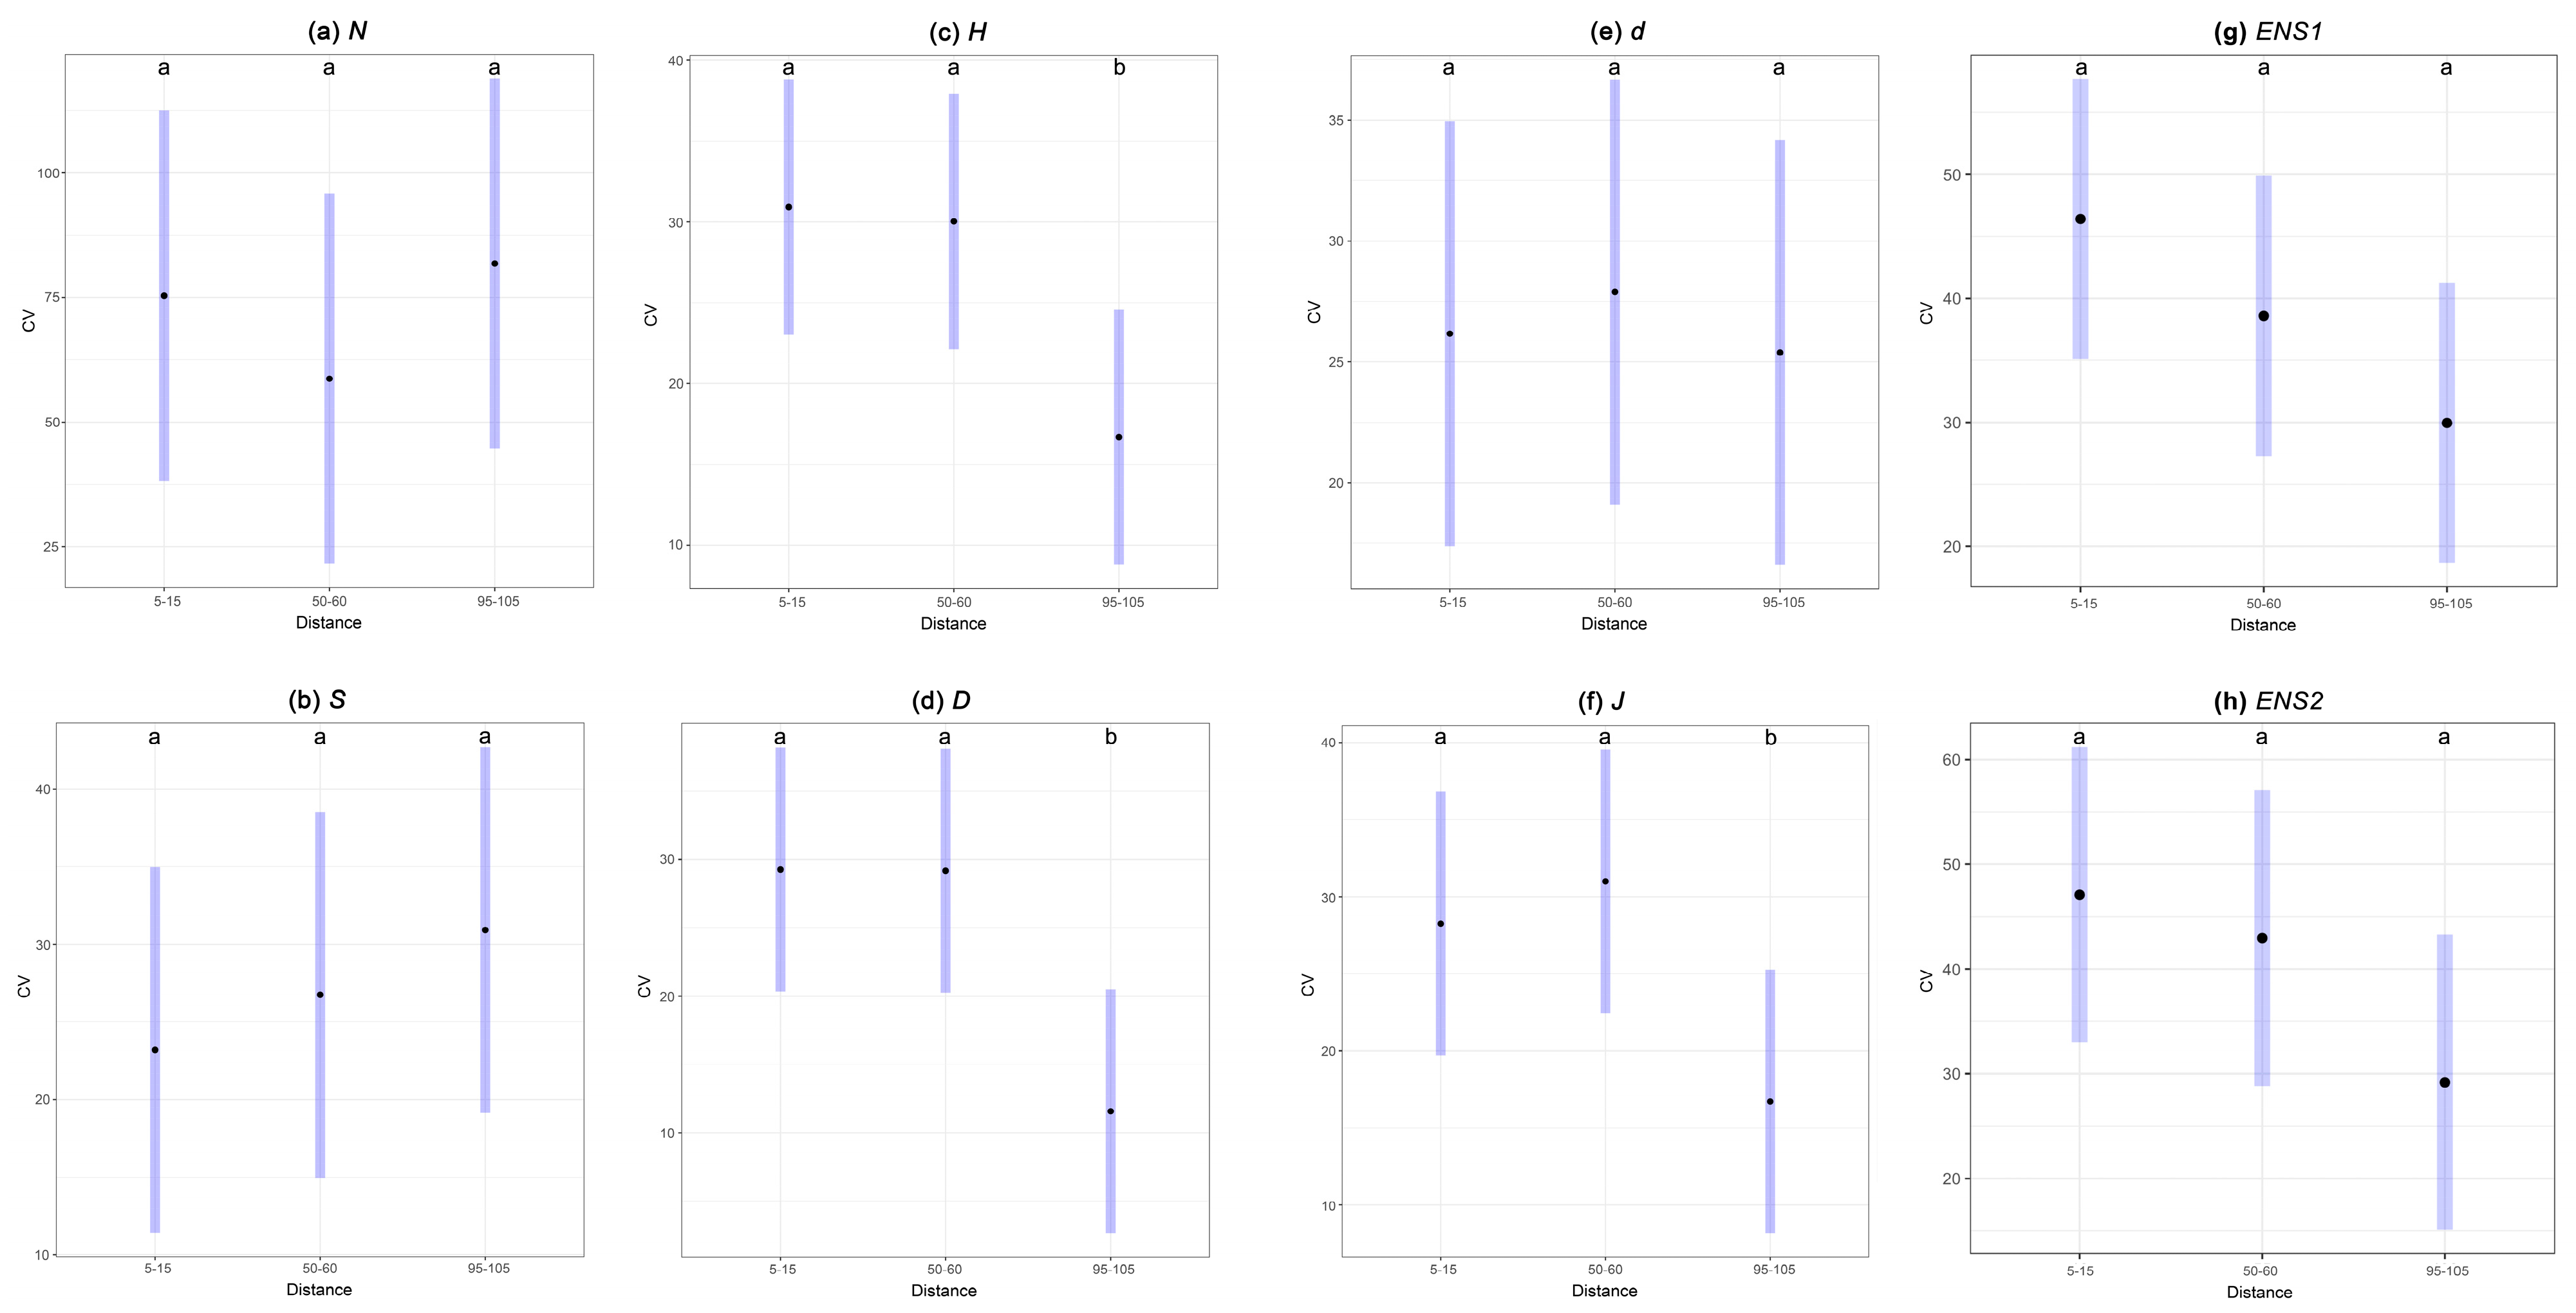
3.2. Variation in Diversity Indices

Heatmaps of abundance, morphospecies richness, and each of the six diversity indices by the distances to the residential areas and the forest edge are shown in Figure 4. Based on two-way ANOVA, only the Shannon index (p = 0.044), the Simpson index (p = 0.021), and Pielou’s evenness index (p = 0.010) of the 108 pitfall traps are significantly different by the distances to the residential areas. No difference is detected in abundance (p = 0.409), morphospecies richness (p = 0.990), or Margalef’s richness index (p = 0.929) by the distances to the residential areas. Additionally, the edge effect or the interaction between the edge effect and the distance to the residential areas is not significant for abundance, morphospecies richness, or any of the six diversity indices of the 108 pitfall traps (each p > 0.05). Multiple comparison confirms that the pitfall traps 100 m away from the residential areas show significantly higher diversity (H and D) and evenness (J) than those 5 m, 15 m, 50 m, and 60 m away (Table 2). In addition, the distance to the residential areas is negatively correlated with the number of pieces of human trash (r = −0.577; p < 0.001; Figure A1A) and with the number of pieces of plastic trash (r = −0.559; p < 0.001; Figure A1B) within the circle of diameter of 5 m from each pitfall trap.
One-way ANOVA confirms that the CVs of the Shannon index (p = 0.032), the Simpson index (p = 0.017), and Pielou’s evenness index (p = 0.049) are different by the distances from the grids to the residential areas, while no difference in the CVs of abundance (p = 0.608), morphospecies richness (p = 0.595), and Margalef’s richness index (p = 0.899) is found among these grids. Multiple comparison shows that the CVs of the Shannon index (p = 0.029 and 0.038), the Simpson index (p = 0.018 and 0.019), and Pielou’s evenness index (p = 0.044 and 0.040) are significantly lower at the grids 95–105 m away from the residential areas than those 5–15 m and 50–60 m away, respectively. The mean differences in the CVs of the Shannon, the Simpson, and Pielou’s evenness indices between the grids 5–15 m and 95–105 m away from the residential areas are 14.23%, 17.72%, and 11.54%, respectively. Those between the grids 50–60 m and 95–105 m away from the residential areas are 13.34%, 17.62%, and 14.28%, respectively. Meanwhile, multiple comparison shows that the CVs of the Shannon index (p = 0.982), the Simpson index (p = 0.999), and Pielou’s evenness index (p = 0.867) of the grids 5–15 m away from the residential areas are not different from those of the grids 50–60 m away from the residential areas (Figure 5).

4. Discussion

From the 30,616 individuals collected at the 108 pitfall traps, we identify 96 morphospecies belonging to overwintering ground-dwelling arthropod communities in the 23-hectare mature subtropical evergreen forest (Figure 1). The 96 morphospecies follow a log-normal distribution according to the rank abundance curve (Figure 2). It can be expected that more morphospecies can be identified if the sampling efforts improve, e.g., setting more pitfall traps and extending the collection period, given that 33 singletons are present in our samples [93]. However, despite the unfavorable weather conditions in the subsequent two months and the temporary closure of the study area due to the Spring Festival, the sampling efficiency of the 108 pitfall traps is optimized to answer if the diversity of ground-dwelling arthropods decreases at the sites closer to the residential areas for the design of this experiment [60,73] and the collection period [39,55]. The samples collected from these pitfall traps (Table 1) indicate the high sampling efficiency of the design [66]. We collected the ground-dwelling arthropods in late autumn when the spatial variation in arthropod diversity within evergreen forests is lower comparing to that in spring and summer [38,94], making them good indicators for the impact of human disturbance on different taxa [39]. Although some studies on ground beetle diversity imply that the species composition of beetles collected by pitfall traps set within 20 m is similar, and replications by pitfall traps could be at the risk of pseudoreplication [95], the Bray–Curtis dissimilarity of morphospecies composition between nearly half of the pairs of pitfall traps is over 0.5, indicating a low risk of pseudoreplication in this study [78,79].
In this study, the use of multiple diversity and evenness indices, e.g., the Shannon and the Simpson diversity indices, effective numbers of species, and Pielou’s evenness index, in addition to abundance and morphospecies richness (Figure 4) is essential for analyzing the composition data based on pitfall traps with disturbance regimes [13,32,88,89]. Following the previous studies reporting a decline in diversity of many arthropod taxa, including spiders, ants, and flies, during human disturbance in subtropical forests [4,25,30,34,55,56,57,58,66], we also find that ground-dwelling arthropod diversity is lower at the sites closer to the residential areas than those 100 m away (Table 2). Higher levels of disturbance at the sites closer to the residential areas, such as light, noise, and solid waste, may cause the distribution shift of endemic species and specialist species from these sites to less-affected habitats [21,26]. Meanwhile, the populations of invasive species and generalist species which benefit from reduced competition and open niches as a consequences of human disturbance grow fast and become dominant species at disturbed sites [22,25,27,30,66]. These two processes of composition change are likely the causes of the decline in the Shannon, the Simpson, the effective number of species, and Pielou’s evenness indices in the study area [89]. Other than the impact of human disturbance, no edge effect or interaction between the edge effect and the impact of human disturbance is identified in this study. The spatial distribution of ground-dwelling arthropods within the forest is less affected by the edge effect than the soil profile [17], vegetation heterogeneity [38], canopy openness [34], forest age [65], and the stand characteristics [64], which are of less concern in this study.
In addition to the decline in the Shannon, the Simpson, and Pielou’s indices identified at the sites 5 m, 15 m, 50 m, and 60 m away from the residential areas (Table 2), the increase in the coefficient of variation in these three indices at the grids 5–15 m and 50–60 m away from the residential areas (Figure 5) implies that the impact of human disturbance on ground-dwelling arthropod diversity may be more complex than previously identified [7,8,18,22,26,28]. The higher variation in diversity indices of the grids closer to the residential areas than those 95–105 m away from the residential areas indicates that it is less likely to detect the impact of human disturbance at disturbed sites and more likely to reach a biased estimation of arthropod diversity at these sites. A larger fluctuation in population dynamics and higher variation in the species distribution of different taxa of ground-dwelling arthropods sometimes can be detected at disturbed habitats and fragments of forests [11,31], and sometimes cannot [7,18]. To reduce the chance of making a type II error (i.e., unable to reject the false null hypothesis), more sampling efforts, such as setting more pitfall traps per grid and repeated sampling, are needed for studies on the impact of human disturbance on ground-dwelling arthropod diversity [63,66]. We also suggest that the variation in diversity indices of sites at different levels of human disturbance should be considered in addition to the diversity indices themselves. Moreover, the temporal variation in arthropod diversity at disturbed and intact sites should be further investigated and incorporated for a comprehensive understanding of the impact of human disturbance on ground-dwelling arthropods [19,23].
Although the identification of morphospecies is sufficient for conducting the analysis of the impact of human disturbance on arthropod abundance, diversity, and evenness [2,21], if possible, molecular techniques in taxonomy should be used for species identification [4,96]. The DNA barcoding technique based on the cytochrome c oxidase subunit I (COI) gene can be used to verify the morphological identification of species [97]. It is also helpful to build a COI database of the arthropods collected from the study area for arthropod metabarcoding and environmental DNA analysis [4]. However, the numbers of individuals of the 59 morphospecies (accounting for 61.5% of the total morphospecies richness) collected from the pitfall traps are fewer than 10, which made it difficult to conduct a polymerase chain reaction (PCR) for these morphospecies [4]. We therefore will keep the samples in 70% ethanol and wait for the next sampling season to collect more individuals for these morphospecies before building a COI database for the arthropods. Under the increasing rate of urbanization in Central China [44,49,51], we need urgently and comprehensively understand how the arthropod community in the forests of this region responds to human disturbance [8,18,26]. Future studies on the spatiotemporal variation in multiple aspects of arthropod diversity, such as species composition, species turnover, and functional diversity, within different human disturbance regimes using optimized sampling methods and advanced techniques in taxonomy are needed to guide the sustainable management of subtropical evergreen forests.

Author Contributions

Conceptualization, Y.Z., K.X. and G.L.; methodology, M.W., Y.Z. and K.X.; validation, J.S., M.W., H.L. and Y.Z.; formal analysis, J.S. and H.L.; investigation, J.S., M.W., H.L., W.S., F.Z., H.C., J.P., Y.Z. and K.X.; resources, Y.Z. and G.L.; data curation, J.S., M.W., H.L., W.S. and F.Z.; writing—original draft preparation, J.S., M.W., H.L., W.S., F.Z., H.C., J.P., Y.Z., K.X. and G.L.; writing—review and editing, K.X., Y.Z. and G.L.; visualization, W.S., F.Z., H.C. and J.P.; supervision, Y.Z., K.X. and G.L.; project administration, Y.Z. and K.X.; funding acquisition, G.L. All authors have read and agreed to the published version of the manuscript.

Funding

This research was funded by the Natural Science Foundation of Hubei Province of China, grant number 2023AFB1005, and by the Hubei Key Laboratory of Edible Wild Plants Conservation and Utilization, grant number EWPL202309. The APC was funded by the Natural Science Foundation of Hubei Province of China.

Institutional Review Board Statement

Not applicable.

Data Availability Statement

The data presented in this study are available on request from the corresponding author due to the restriction on data sharing underwritten in the agreement with the Natural Science Foundation of Hubei Province of China.

Acknowledgments

We acknowledge the contributions of Meimiao Chen, Jiaxin Cui, Sida Lai, Xinyang Song, Minwei Tan, Yuxi Tan, Hanlu Tian, and Xiang Yu in field work.

Conflicts of Interest

The authors declare no conflicts of interest. The funders had no role in the design of the study; in the collection, analyses, or interpretation of data; in the writing of the manuscript; or in the decision to publish the results.

Appendix A

Table A1. A summary of the morphospecies richness, abundance, and relative abundance (%) of the 30,616 arthropods of the 16 orders collected from the 108 pitfall traps.
OrderRichnessAbundanceRelative Abundance (%)
Scolopendromorpha29743.181
Scutigeromorpha110.003
Araneae14710.232
Sarcoptiformes8860.281
Isopoda1390.127
Entomobryomorpha14521.476
Dermaptera3380.124
Orthoptera2400.131
Blattodea2580.189
Thysanoptera130.010
Hemiptera712804.181
Hymenoptera2025,00881.683
Coleoptera111070.349
Diptera2020556.712
Siphonaptera13991.303
Mecoptera250.016
Figure A1. The relationships between the number of pieces of human trash (A) and the distance to the residential areas (m) of the 108 pitfall traps and between the number of pieces of plastic trash (B) and the distance to the residential areas (m). Both the numbers are counted within the circle of diameter of 5 m from each pitfall trap. Significant negative relationships are found between the number of pieces of human trash (r = −0.577; p < 0.001) and the distance to the residential areas and between the number of pieces of plastic trash (r = −0.559; p < 0.001) and the distance.
Diversity 17 00344 g0a1

References

  1. Maleque, M.A.; Ishii, H.T.; Maeto, K. The use of arthropods as indicators of ecosystem integrity in forest management. J. For. 2006, 104, 113–117. [Google Scholar] [CrossRef]
  2. Basset, Y.; Cizek, L.; Cuénoud, P.; Didham, R.K.; Guilhaumon, F.; Missa, O.; Novotny, V.; Ødegaard, F.; Roslin, T.; Schmidl, J.; et al. Arthropod diversity in a tropical forest. Science 2012, 338, 1481–1484. [Google Scholar] [CrossRef] [PubMed]
  3. Gerlach, J.; Samways, M.; Pryke, J. Terrestrial invertebrates as bioindicators: An overview of available taxonomic groups. J. Insect Conserv. 2013, 17, 831–850. [Google Scholar] [CrossRef]
  4. Huang, J.; Miao, X.; Wang, Q.; Menzel, F.; Tang, P.; Yang, D.; Wu, H.; Vogler, A.P. Metabarcoding reveals massive species diversity of Diptera in a subtropical ecosystem. Ecol. Evol. 2022, 12, e8535. [Google Scholar] [CrossRef]
  5. Lattin, J.D. Arthropod diversity and conservation in old-growth northwest forests. Am. Zool. 1993, 33, 578–587. [Google Scholar] [CrossRef]
  6. Yekwayo, I.; Pryke, J.S.; Roets, F.; Samways, M.J. Surrounding vegetation matters for arthropods of small, natural patches of indigenous forest. Insect Conserv. Divers. 2016, 9, 224–235. [Google Scholar] [CrossRef]
  7. Lichtenberg, E.M.; Kennedy, C.M.; Kremen, C.; Batary, P.; Berendse, F.; Bommarco, R.; Bosque-Pérez, N.A.; Carvalheiro, L.G.; Snyder, W.E.; Williams, N.M.; et al. A global synthesis of the effects of diversified farming systems on arthropod diversity within fields and across agricultural landscapes. Glob. Change Biol. 2017, 23, 4946–4957. [Google Scholar] [CrossRef]
  8. Kotze, D.J.; Lowe, E.C.; MacIvor, J.S.; Ossola, A.; Norton, B.A.; Hochuli, D.F.; Mata, L.; Moretti, M.; Gagné, S.A.; Handa, I.T.; et al. Urban forest invertebrates: How they shape and respond to the urban environment. Urban Ecosyst. 2022, 25, 1589–1609. [Google Scholar] [CrossRef]
  9. Maleque, M.A.; Maeto, K.; Ishii, H.T. Arthropods as bioindicators of sustainable forest management, with a focus on plantation forests. Appl. Entomol. Zool. 2009, 44, 1–11. [Google Scholar] [CrossRef]
  10. Zommers, Z. “Follow the Spiders”: Ecosystems as Early Warnings. In Reducing Disaster: Early Warning Systems for Climate Change; Singh, A., Zommers, Z., Eds.; Springer: Dordrecht, The Netherlands, 2014. [Google Scholar] [CrossRef]
  11. Lamarre, G.P.; Hérault, B.; Fine, P.V.; Vedel, V.; Lupoli, R.; Mesones, I.; Baraloto, C. Taxonomic and functional composition of arthropod assemblages across contrasting Amazonian forests. J. Anim. Ecol. 2016, 85, 227–239. [Google Scholar] [CrossRef]
  12. Swart, R.C.; Pryke, J.S.; Roets, F. Arthropod assemblages deep in natural forests show different responses to surrounding land use. Biodivers. Conserv. 2018, 27, 583–606. [Google Scholar] [CrossRef]
  13. Seibold, S.; Gossner, M.M.; Simons, N.K.; Blüthgen, N.; Müller, J.; Ambarlı, D.; Ammer, C.; Bauhus, J.; Fischer, M.; Habel, J.C.; et al. Arthropod decline in grasslands and forests is associated with landscape-level drivers. Nature 2019, 574, 671–674. [Google Scholar] [CrossRef] [PubMed]
  14. Cours, J.; Bouget, C.; Barsoum, N.; Horák, J.; Le Souchu, E.; Leverkus, A.B.; Pincebourde, S.; Thorn, S.; Sallé, A. Surviving in changing forests: Abiotic disturbance legacy effects on arthropod communities of temperate forests. Cur. For. Rep. 2023, 9, 189–218. [Google Scholar] [CrossRef]
  15. Kung’u, G.N.; Cousseau, L.; Githiru, M.; Habel, J.C.; Kinyanjui, M.; Matheka, K.; Schmitt, C.B.; Seifert, T.; Teucher, M.; Lens, L.; et al. Anthropogenic activities affect forest structure and arthropod abundance in a Kenyan biodiversity hotspot. Biodivers. Conserv. 2023, 32, 3255–3282. [Google Scholar] [CrossRef]
  16. Li, Y.; Schmid, B.; Schuldt, A.; Li, S.; Wang, M.Q.; Fornoff, F.; Staab, M.; Guo, P.F.; Anttonen, P.; Chesters, D.; et al. Multitrophic arthropod diversity mediates tree diversity effects on primary productivity. Nat. Ecol. Evol. 2023, 7, 832–840. [Google Scholar] [CrossRef]
  17. Humphrey, J.W.; Hawes, C.; Peace, A.J.; Ferris-Kaan, R.; Jukes, M.R. Relationships between insect diversity and habitat characteristics in plantation forests. For. Ecol. Manag. 1999, 113, 11–21. [Google Scholar] [CrossRef]
  18. Lange, M.; Weisser, W.W.; Gossner, M.M.; Kowalski, E.; Türke, M.; Joner, F.; Fonseca, C.R. The impact of forest management on litter-dwelling invertebrates: A subtropical–temperate contrast. Biodivers. Conserv. 2011, 20, 2133–2147. [Google Scholar] [CrossRef]
  19. Lingbeek, B.J.; Higgins, C.L.; Muir, J.P.; Kattes, D.H.; Schwertner, T.W. Arthropod diversity and assemblage structure response to deforestation and desertification in the Sahel of western Senegal. Glob. Ecol. Conserv. 2017, 11, 165–176. [Google Scholar] [CrossRef]
  20. Estay, S.A.; Navarrete, S.A.; Rothmann Toro, S. Effects of human mediated disturbances on exotic forest insect diversity in a Chilean Mediterranean ecosystem. Biodivers. Conserv. 2012, 21, 3699–3710. [Google Scholar] [CrossRef]
  21. Agra, J.; Ligeiro, R.; Heino, J.; Macedo, D.R.; Castro, D.M.; Linares, M.S.; Callisto, M. Anthropogenic disturbances alter the relationships between environmental heterogeneity and biodiversity of stream insects. Ecol. Indic. 2021, 121, 107079. [Google Scholar] [CrossRef]
  22. Canelles, Q.; Aquilué, N.; James, P.M.; Lawler, J.; Brotons, L. Global review on interactions between insect pests and other forest disturbances. Landsc. Ecol. 2021, 36, 945–972. [Google Scholar] [CrossRef]
  23. Crossley, M.S.; Meier, A.R.; Baldwin, E.M.; Berry, L.L.; Crenshaw, L.C.; Hartman, G.L.; Lagos-Kutz, D.; Nichols, D.H.; Patel, K.; Varriano, S.; et al. No net insect abundance and diversity declines across US Long Term Ecological Research sites. Nat. Ecol. Evol. 2020, 4, 1368–1376. [Google Scholar] [CrossRef]
  24. Brandon-Mong, G.J.; Littlefair, J.E.; Sing, K.W.; Lee, Y.P.; Gan, H.M.; Clare, E.L.; Wilson, J.J. Temporal changes in arthropod activity in tropical anthropogenic forests. Bull. Entomol. Res. 2018, 108, 792–799. [Google Scholar] [CrossRef] [PubMed]
  25. Baidya, P.; Bagchi, S. Influence of human land use and invasive species on beta diversity of tropical ant assemblages. Insect Conserv. Divers. 2022, 15, 73–85. [Google Scholar] [CrossRef]
  26. Lu, Z.; Hoffmann, B.D.; Chen, Y. Can reforested and plantation habitats effectively conserve SW China’s ant biodiversity? Biodivers. Conserv. 2016, 25, 753–770. [Google Scholar] [CrossRef]
  27. Cerda, X.; Arnan, X.; Retana, J. Is competition a significant hallmark of ant (Hymenoptera: Formicidae) ecology. Myrmecol. News 2013, 18, 131–147. [Google Scholar]
  28. Cardoso, P.; Barton, P.S.; Birkhofer, K.; Chichorro, F.; Deacon, C.; Fartmann, T.; Fukushima, C.S.; Gaigher, R.; Habel, J.C.; Hallmann, C.A.; et al. Scientists’ warning to humanity on insect extinctions. Biol. Conserv. 2020, 242, 108426. [Google Scholar] [CrossRef]
  29. Horgan, F.G. Effects of deforestation on diversity, biomass and function of dung beetles on the eastern slopes of the Peruvian Andes. For. Ecol. Manag. 2005, 216, 117–133. [Google Scholar] [CrossRef]
  30. Pearce, J.L.; Venier, L.A. The use of ground beetles (Coleoptera: Carabidae) and spiders (Araneae) as bioindicators of sustainable forest management: A review. Ecol. Indic. 2006, 6, 780–793. [Google Scholar] [CrossRef]
  31. de Castro Solar, R.R.; Barlow, J.; Andersen, A.N.; Schoereder, J.H.; Berenguer, E.; Ferreira, J.N.; Gardner, T.A. Biodiversity consequences of land-use change and forest disturbance in the Amazon: A multi-scale assessment using ant communities. Biol. Conserv. 2016, 197, 98–107. [Google Scholar] [CrossRef]
  32. Potapov, A.M.; Dupérré, N.; Jochum, M.; Dreczko, K.; Klarner, B.; Barnes, A.D.; Krashevska, V.; Rembold, K.; Kreft, H.; Brose, U.; et al. Functional losses in ground spider communities due to habitat structure degradation under tropical land-use change. Ecology 2020, 101, e02957. [Google Scholar] [CrossRef]
  33. Lira, A.F.; Foerster, S.I.; Salomão, R.P.; Porto, T.J.; Albuquerque, C.M.; Moura, G.J. Understanding the effects of human disturbance on scorpion diversity in Brazilian tropical forests. J. Insect. Conserv. 2021, 25, 147–158. [Google Scholar] [CrossRef]
  34. Košulič, O.; Michalko, R.; Hula, V. Impact of canopy openness on spider communities: Implications for conservation management of formerly coppiced oak forests. PLoS ONE 2016, 11, e0148585. [Google Scholar] [CrossRef] [PubMed]
  35. Huang, P.S.; Tso, I.M.; Lin, H.C.; Lin, L.K.; Lin, C.P. Effects of thinning on spider diversity of an East Asian subtropical plantation forest. Zool. Stud. 2011, 50, 705–717. [Google Scholar]
  36. Lee, R.H.; Kwong, I.H.; Tsang, T.P.; Wong, M.K.; Guénard, B. Remotely sensed environmental data as ecological proxies for ground-dwelling ant diversity along a subtropical forest succession gradient. J. Ecol. 2023, 111, 1428–1442. [Google Scholar] [CrossRef]
  37. Uehara-Prado, M.; de Oliveira Fernandes, J.; de Moura Bello, A.; Machado, G.; Santos, A.J.; Vaz-de-Mello, F.Z.; Freitas, A.V.L. Selecting terrestrial arthropods as indicators of small-scale disturbance: A first approach in the Brazilian Atlantic Forest. Biol. Conserv. 2009, 142, 1220–1228. [Google Scholar] [CrossRef]
  38. Dennis, P.; Thomas, M.B.; Sotherton, N.W. Structural features of field boundaries which influence the overwintering densities of beneficial arthropod predators. J. Appl. Ecol. 1994, 31, 361–370. [Google Scholar] [CrossRef]
  39. Knapp, M.; Štrobl, M.; Venturo, A.; Seidl, M.; Jakubíková, L.; Tajovský, K.; Kadlec, T.; González, E. Importance of grassy and forest non-crop habitat islands for overwintering of ground-dwelling arthropods in agricultural landscapes: A multi-taxa approach. Biol. Conserv. 2022, 275, 109757. [Google Scholar] [CrossRef]
  40. Allen, J.C.; Barnes, D.F. The causes of deforestation in developing countries. Ann. Am. Assoc. Geogr. 1985, 75, 163–184. [Google Scholar] [CrossRef]
  41. Leblois, A.; Damette, O.; Wolfersberger, J. What has driven deforestation in developing countries since the 2000s? Evidence from new remote-sensing data. World Dev. 2017, 92, 82–102. [Google Scholar] [CrossRef]
  42. Song, X.P.; Hansen, M.C.; Stehman, S.V.; Potapov, P.V.; Tyukavina, A.; Vermote, E.F.; Townshend, J.R. Global land change from 1982 to 2016. Nature 2018, 560, 639–643. [Google Scholar] [CrossRef] [PubMed]
  43. Purswani, E.; Pathak, B.; Kumar, D.; Verma, S. Land-use Change as a Disturbance Regime. In Environmental Concerns and Sustainable Development; Shukla, V., Kumar, N., Eds.; Springer: Singapore, 2020; pp. 127–144. [Google Scholar] [CrossRef]
  44. Yang, H.; Zhong, X.; Deng, S.; Nie, S. Impact of LUCC on landscape pattern in the Yangtze River Basin during 2001–2019. Ecol. Infom. 2022, 69, 101631. [Google Scholar] [CrossRef]
  45. Zhou, Y.; Ning, L.; Bai, X. Spatial and temporal changes of human disturbances and their effects on landscape patterns in the Jiangsu coastal zone, China. Ecol. Indic. 2018, 93, 111–122. [Google Scholar] [CrossRef]
  46. Jacobson, A.P.; Riggio, J.; Tait, A.M.; Baillie, J.E.M. Global areas of low human impact (‘Low Impact Areas’) and fragmentation of the natural world. Sci. Rep. 2019, 9, 14179. [Google Scholar] [CrossRef]
  47. Zhang, S.; Yang, P.; Xia, J.; Wang, W.; Cai, W.; Chen, N.; Hu, S.; Luo, X.; Li, J.; Zhan, C. Land use/land cover prediction and analysis of the middle reaches of the Yangtze River under different scenarios. Sci. Total Environ. 2022, 833, 155238. [Google Scholar] [CrossRef] [PubMed]
  48. Zhang, J.; Qu, X.; Huang, Y.; Tan, M.; Xu, K. Assessing the potential of species loss caused by deforestation in a mature subtropical broadleaf forest in Central China. Trees For. People 2024, 18, 100673. [Google Scholar] [CrossRef]
  49. Zhang, F.; Zhang, Z.; Kong, R.; Chang, J.; Tian, J.; Zhu, B.; Jiang, S.; Chen, X.; Xu, C.Y. Changes in forest net primary productivity in the Yangtze River Basin and its relationship with climate change and human activities. Remote Sens. 2019, 11, 1451. [Google Scholar] [CrossRef]
  50. Liu, Y.; Zhang, J.; Rao, S.; Xu, K. Sleet damage to branches and crowns of street camphor trees (Cinnamomum camphora) in a central China mega-city: Damage statistics, modelling, and implications. Front. For Glob. Change 2024, 7, 1391645. [Google Scholar] [CrossRef]
  51. Lu, S.; Tang, X.; Guan, X.; Qin, F.; Liu, X.; Zhang, D. The assessment of forest ecological security and its determining indicators: A case study of the Yangtze River Economic Belt in China. J. Environ. Manag. 2020, 258, 110048. [Google Scholar] [CrossRef]
  52. Brown, B.V. Sampling methods for adult flies (Diptera). In Measuring Arthropod Biodiversity; Santos, J.C., Fernandes, G.W., Eds.; Springer: Cham, Switzerland, 2021; pp. 187–204. [Google Scholar] [CrossRef]
  53. Gaoue, O.G.; Bassoki, H.; Dassou, A.G. Chronic anthropogenic disturbance mediates the bottom-up influence of plant diversity on arthropods in tropical forests. Ecol. Evol. 2024, 14, e11055. [Google Scholar] [CrossRef]
  54. Greenberg, C.H.; McGrane, A. A comparison of relative abundance and biomass of ground-dwelling arthropods under different forest management practices. For. Ecol. Manag. 1996, 89, 31–41. [Google Scholar] [CrossRef]
  55. Kwon, T.S.; Lee, C.M.; Sung, J.H. Diversity decrease of ant (Formicidae, Hymenoptera) after a forest disturbance: Different responses among functional guilds. Zool. Stud. 2014, 53, 37. [Google Scholar] [CrossRef]
  56. Szinwelski, N.; Rosa, C.S.; Schoereder, J.H.; Mews, C.M.; Sperber, C.F. Effects of forest regeneration on crickets: Evaluating environmental drivers in a 300-year chronosequence. Int. J. Zool. 2012, 2012, 793419. [Google Scholar] [CrossRef]
  57. Frouz, J. Use of soil dwelling Diptera (Insecta, Diptera) as bioindicators: A review of ecological requirements and response to disturbance. Agric. Ecosyst. Environ. 1999, 74, 167–186. [Google Scholar] [CrossRef]
  58. Hassall, M.; Jones, D.T.; Taiti, S.; Latipi, Z.; Sutton, S.L.; Mohammed, M. Biodiversity and abundance of terrestrial isopods along a gradient of disturbance in Sabah, East Malaysia. Eur. J. Soil Biol. 2006, 42 (Suppl. S1), S197–S207. [Google Scholar]
  59. Wilson, L.T.; Room, P.M. The relative efficiency and reliability of three methods for sampling arthropods in Australian cotton fields. Aust. J. Entomol. 1982, 21, 175–181. [Google Scholar] [CrossRef]
  60. Woodcock, B.A. Pitfall trapping in ecological studies. In Insect Sampling in Forest Ecosystems; Leather, S.R., Ed.; Blackwell Science: West Sussex, UK, 2005; pp. 37–57. [Google Scholar] [CrossRef]
  61. Hertz, M. Huomioita petokuoriaisten olinpaikoista. Luonnon Ystävä 1927, 31, 218–222. [Google Scholar]
  62. Barber, H.S. Traps for cave-inhabiting insects. J. Elisha Mitchell Sci. Soc. 1931, 46, 259–266. [Google Scholar]
  63. Brown, G.R.; Matthews, I.M. A review of extensive variation in the design of pitfall traps and a proposal for a standard pitfall trap design for monitoring ground-active arthropod biodiversity. Ecol. Evol. 2016, 6, 3953–3964. [Google Scholar] [CrossRef]
  64. Jokimäki, J.; Huhta, E.; Itämies, J.; Rahko, P. Distribution of arthropods in relation to forest patch size, edge, and stand characteristics. Can. J. For. Res. 1998, 28, 1068–1072. [Google Scholar] [CrossRef]
  65. De Smedt, P.; Baeten, L.; Proesmans, W.; Van de Poel, S.; Van Keer, J.; Giffard, B.; Martin, L.; Vanhulle, R.; Brunet, J.; Cousins, S.A.; et al. Strength of forest edge effects on litter-dwelling macro-arthropods across Europe is influenced by forest age and edge properties. Divers. Distrib. 2019, 25, 963–974. [Google Scholar] [CrossRef]
  66. Hohbein, R.R.; Conway, C.J. Pitfall traps: A review of methods for estimating arthropod abundance. Wildl. Soc. Bull. 2018, 42, 597–606. [Google Scholar] [CrossRef]
  67. Hartshorn, J. A review of forest management effects on terrestrial leaf litter inhabiting arthropods. Forests 2020, 12, 23. [Google Scholar] [CrossRef]
  68. Perry, K.I.; Herms, D.A. Dynamic responses of ground-dwelling invertebrate communities to disturbance in forest ecosystems. Insects 2019, 10, 61. [Google Scholar] [CrossRef] [PubMed]
  69. Zhang, C.; Fang, S. Identifying and zoning key areas of ecological restoration for territory in resource-based cities: A case study of Huangshi city, China. Sustainability 2021, 13, 3931. [Google Scholar] [CrossRef]
  70. Lin, X.; Wu, X.; Chao, J.; Ge, X.; Tan, L.; Liu, W.; Sun, Z.; Hou, J. Effects of combined ecological restoration measures on water quality and underwater light environment of Qingshan Lake, an urban eutrophic lake in China. Ecol. Indic. 2024, 163, 112107. [Google Scholar] [CrossRef]
  71. Gong, Z.; Zhang, G.; Chen, Z. Development of soil classification in China. In Soil Classification; Eswaran, H., Ahrens, R., Rice, T.J., Stewart, B.A., Eds.; CRC Press: Boca Raton, FL, USA, 2002; pp. 101–126. [Google Scholar] [CrossRef]
  72. Zhu, Q.; De Vries, W.; Liu, X.; Zeng, M.; Hao, T.; Du, E.; Zhang, F.; Shen, J. The contribution of atmospheric deposition and forest harvesting to forest soil acidification in China since 1980. Atmos. Environ. 2016, 146, 215–222. [Google Scholar] [CrossRef]
  73. Koivula, M.; Kotze, J.; Hiisivuori, L.; Rita, H. Pitfall trap efficiency: Do trap size, collecting fluid and vegetation structure matter? Entomol. Fenn. 2003, 14, 1–14. [Google Scholar] [CrossRef]
  74. Ji, L. China Checklist of Animals, In Catalogue of Life China: 2024 Annual Checklist; The Biodiversity Committee of Chinese Academy of Sciences, Ed.; Chinese Academy of Sciences: Beijing, China, 2024. [Google Scholar] [CrossRef]
  75. Oksanen, J.; Blanchet, F.G.; Kindt, R.; Legendre, P.; Minchin, P.R.; O’hara, R.B.; Simpson, G.L.; Solymos, P.; Stevens, M.H.H.; Wagner, H.; et al. Package ‘Vegan’. Community Ecology Package, version 2.9.; CRAN: Windhoek, Namibia, 2013. [Google Scholar]
  76. Matthews, T.J.; Whittaker, R.J. On the species abundance distribution in applied ecology and biodiversity management. J. Appl. Ecol. 2015, 52, 443–454. [Google Scholar] [CrossRef]
  77. Bray, J.R.; Curtis, J.T. An ordination of the upland forest communities of southern Wisconsin. Ecol. Monogr. 1957, 27, 326–349. [Google Scholar] [CrossRef]
  78. Clarke, K.R.; Somerfield, P.J.; Chapman, M.G. On resemblance measures for ecological studies, including taxonomic dissimilarities and a zero-adjusted Bray–Curtis coefficient for denuded assemblages. J. Exp. Mar. Biol. Ecol. 2006, 330, 55–80. [Google Scholar] [CrossRef]
  79. Sherwin, W.B. Bray-Curtis (AFD) differentiation in molecular ecology: Forecasting, an adjustment (AA), and comparative performance in selection detection. Ecol. Evol. 2022, 12, e9176. [Google Scholar] [CrossRef] [PubMed]
  80. Shannon, C.E. A mathematical theory of communication. Bell. Syst. Tech. J. 1948, 27, 379–423. [Google Scholar] [CrossRef]
  81. Simpson, E.H. Measurement of diversity. Nature 1949, 163, 688. [Google Scholar] [CrossRef]
  82. Margalef, R. Information theory in ecology. Gen. Syst. 1958, 3, 36–71. [Google Scholar]
  83. Pielou, E.C. Species-diversity and pattern-diversity in the study of ecological succession. J. Theor. Biol. 1966, 10, 370–383. [Google Scholar] [CrossRef]
  84. Jost, L. Entropy and diversity. Oikos 2006, 113, 363–375. [Google Scholar] [CrossRef]
  85. Rempala, G.A.; Seweryn, M. Methods for diversity and overlap analysis in T-cell receptor populations. J. Math. Biol. 2013, 67, 1339–1368. [Google Scholar] [CrossRef]
  86. Jost, L. The relation between evenness and diversity. Diversity 2010, 2, 207–232. [Google Scholar] [CrossRef]
  87. Magurran, A.E. Measuring biological diversity. Curr. Biol. 2021, 31, R1174–R1177. [Google Scholar] [CrossRef]
  88. Peet, R.K. The measurement of species diversity. Annu. Rev. Ecol. Syst. 1974, 5, 285–307. [Google Scholar] [CrossRef]
  89. Roswell, M.; Dushoff, J.; Winfree, R. A conceptual guide to measuring species diversity. Oikos 2021, 130, 321–338. [Google Scholar] [CrossRef]
  90. Wickham, H. ggplot2. Wiley Interdiscip. Rev. Comput. Stat. 2011, 3, 180–185. [Google Scholar] [CrossRef]
  91. Lenth, R.; Singmann, H.; Love, J.; Buerkner, P.; Herve, M. Emmeans: Estimated Marginal Means, Aka Least-Squares Means, R Package Version 1.10.7.; CRAN: Windhoek, Namibia, 2019. [Google Scholar] [CrossRef]
  92. Magurran, A.E. Measuring Biological Diversity; John Wiley & Sons, Blackwell: Hoboken, NJ, USA, 2013. [Google Scholar]
  93. Coddington, J.A.; Agnarsson, I.; Miller, J.A.; Kuntner, M.; Hormiga, G. Undersampling bias: The null hypothesis for singleton species in tropical arthropod surveys. J. Anim. Ecol. 2009, 78, 573–584. [Google Scholar] [CrossRef]
  94. Anu, A.; Sabu, T.K.; PJ, V. Seasonality of litter insects and relationship with rainfall in a wet evergreen forest in south Western Ghats. J. Insect Sci. 2009, 9, 46. [Google Scholar] [CrossRef] [PubMed]
  95. Elek, Z.; Lövei, G.L. Patterns in ground beetle (Coleoptera: Carabidae) assemblages along an urbanisation gradient in Denmark. Acta Oecol. 2007, 32, 104–111. [Google Scholar] [CrossRef]
  96. Zeng, Y.; Yang, Y.T.; Wu, Q.J.; Wang, S.L.; Xie, W.; Zhang, Y.J. Genome-wide analysis of odorant-binding proteins and chemosensory proteins in the sweet potato whitefly, Bemisia tabaci. Insect Sci. 2019, 26, 620–634. [Google Scholar] [CrossRef]
  97. Antil, S.; Abraham, J.S.; Sripoorna, S.; Maurya, S.; Dagar, J.; Makhija, S.; Bhagat, P.; Gupta, R.; Sood, U.; Lal, R.; et al. DNA barcoding, an effective tool for species identification: A review. Mol. Biol. Rep. 2023, 50, 761–775. [Google Scholar] [CrossRef]
Figure 1. The distribution of the 108 pitfall traps set in grids along four 100 m transects (A, B, C, and D) in the study area (30°13′50″–30°13′52″ N, 115°3′45″–115°3′47″ E). The grids numbered 1, 2, and 3 are 5–15 m, 50–60 m, and 95–105 m away from the residential areas (in red), respectively. Each transect consisting of 9 grids is set in parallel with the edge of the forest (in green), where the color gradient represents the canopy height derived from the Global Ecosystem Dynamics Investigation 10 m canopy height map. The scheme of the sampling design is illustrated in the inserted figure on the bottom right.
Diversity 17 00344 g001
Figure 2. The rank abundance curves of the 96 morphospecies collected from the 108 pitfall traps. The four distribution models are the null, preemption, Zipf and log-normal models. The AICs of these four models fitted to the actual rank abundance are 77,854.70, 10,434.16, 10,577.46, and 9465.41. The best fitted model is the log-normal model.
Diversity 17 00344 g002
Figure 3. A matrix of the Bray–Curtis dissimilarity of morphospecies compositions between each pair of the 108 pitfall traps. The value 0 means the two pitfall traps share all the morphospecies, and 1 means the two pitfall traps share no morphospecies. The order of pitfall traps marked by the same notation follows the increasing sequence of distance to edge (from 5 m to 15 m) and to the residential area (from 5–15 m to 95–105 m). A, B, C, and D are the four transects set in the study area.
Diversity 17 00344 g003
Figure 4. The heatmaps of abundance, morphospecies richness, the six diversity indices, and the effective numbers of species of the 108 pitfall traps by the distances to the residential areas and the forest edge. The color gradient illustrates the marginal means of abundance (N) (a), morphospecies richness (S) (b), the Shannon index (H) (c), the Simpson index (D) (d), Margalef’s richness index (d) (e), Pielou’s evenness index (J) (f), the effective number of species at α = 1 (ENS1) (g), and the effective number of species at α = 2 (ENS2) (h) of the pitfall traps at the given distances to the residential areas and to the forest edge.
Diversity 17 00344 g004
Figure 5. The estimated marginal means of the coefficient of variation (CV) of abundance, morphospecies richness, and the six diversity indices of the grids by the distance (m) to the residential areas. The marginal means of the CV of abundance (N) (a), morphospecies richness (S) (b), the Shannon index (H) (c), the Simpson index (D) (d), Margalef’s richness index (d) (e), Pielou’s evenness index (J) (f), and the effective numbers of species at α = 1 (ENS1) (g) and 2 (ENS2) (h) of the grids of pitfall traps are compared at three distances (i.e., 5–15 m, 50–60 m and 95–105 m). The blue error bar indicates the 95% confidence interval of the estimated marginal mean of the CV. The letters a and b marked at the top of each index at the given distance indicate a significant difference in the index between two distances (p < 0.05) if the letters are different, and vice versa.
Diversity 17 00344 g005
Table 1. The morphospecies composition of the 12 grids by the five classes of the phylum Arthropoda. The abundance (N) and morphospecies richness (S) of the arthropods collected at each grid are listed. A, B, C, and D are the four transects set in the study area, and the grids numbered 1, 2, and 3 are 5–15 m, 50–60 m, and 95–105 m away from the residential areas, respectively.
ChilopodaArachnidaMalacostracaCollembolaInsectaArthropoda
GridNSNSNSNSNSNS
A1923211231198826202432
A210213106171392730396344
A3302115191254125258630
B11415311201145226149232
B2179212931311212426234939
B33951228311031151840204151
C11426511151148434152043
C2132756181186724190133
C3529300251114227118133
D151218421181529820538730
D210718591581384023402231
D3148155211351186021215029
Total975310922391452129,0416930,61696
Table 2. The estimated marginal means of abundance (N), morphospecies richness (S), the Shannon index (H), the Simpson index (D), Margalef’s richness index (d), Pielou’s evenness index (J), and the effect numbers of species at α = 1 and 2 (ENS1 and ENS2) of the 108 pitfall traps by the distances from the residential areas. Under the column, the marginal means are superscripted with letters to indicate the statistical differences by the three distances from the residential areas. If two means share a same letter, this indicates that the two means are not different (p > 0.05), and vice versa (p < 0.05).
Distance (m)NSHDdJENS1ENS2
5336 a13 a1.285 a0.579 a2.169 a0.512 a3.907 a2.800 a
10185 a12 a1.466 ab0.611 ab2.338 a0.596 ab5.022 ab3.450 ab
15349 a13 a1.344 a0.590 a2.268 a0.524 a4.222 ab2.903 a
50321 a13 a1.314 a0.575 a2.221 a0.526 a4.056 ab2.954 a
55320 a13 a1.407 ab0.619 ab2.291 a0.544 ab4.374 ab3.010 ab
60378 a13 a1.251 a0.579 a2.050 a0.500 a3.733 a2.719 a
95244 a13 a1.536 a0.691 ab2.230 a0.620 ab4.932 ab3.558 ab
100206 a14 a1.782 b0.770 b2.505 a0.709 a6.053 b4.502 b
105213 a12 a1.553 ab0.696 ab2.124 a0.645 ab4.964 ab3.681 ab
Disclaimer/Publisher’s Note: The statements, opinions and data contained in all publications are solely those of the individual author(s) and contributor(s) and not of MDPI and/or the editor(s). MDPI and/or the editor(s) disclaim responsibility for any injury to people or property resulting from any ideas, methods, instructions or products referred to in the content.

