Abstract
Understanding how assemblages are structured is important for ecology, especially in tropical regions that exhibit high biodiversity and are currently experiencing high rates of loss and modification of natural environments caused by anthropogenic impacts. Understanding the structuring of assemblages across different regions at different spatial scales allows us to comprehend how environmental modifications can affect biodiversity on a local and regional scale. The objective of this study was to evaluate the biodiversity of Odonata species using taxonomic diversity metrics (richness and composition) in areas of Cerrado, Atlantic Forest, and Caatinga and to evaluate which sets of local and spatial environmental variables are associated with these assemblages among the different areas evaluated. The study was conducted in the state of Bahia, where 49 streams were sampled, including 17 in the Atlantic Forest, 18 in the Caatinga, and 15 in the Cerrado. Our results demonstrate a high diversity of Odonata species, with 95 species collected. We found a similar species richness among the regions sampled. However, each region presented a distinct composition, with greater similarity between the Cerrado and the Caatinga. Spatial predictors along with some environmental variables were associated with the Caatinga and Cerrado. Some environmental variables, such as the amount of riparian vegetation and aquatic vegetation, were associated with the Cerrado. The results highlighted that each of the evaluated regions are fundamental for maintaining and conserving the regional dragonfly biodiversity. The lack of conservation of aquatic ecosystems in the different regions leads to local species loss and, consequently, to a loss of regional Odonata biodiversity.
1. Introduction
Understanding the patterns of distribution and structuring of assemblages remains a fundamental issue for ecologists worldwide, especially in the current scenario of intense anthropogenic changes in natural landscapes [1,2,3,4]. Environmental changes, whether natural or anthropogenic and at different scales, such as local, regional, or historical, affect the structure of assemblages, enabling or preventing the occurrence of certain species in environments [5,6,7]. They can explain differences in species diversity and structuring among sites with different environmental characteristics and across different spatial scales [8,9,10,11].
Understanding these patterns of assemblage structuring can be a pathway to comprehending species distribution processes among different regions. The variations in local and regional environmental variables such as temperature, precipitation, humidity, and soil types, among others, are considered important in the structuring of the regional biodiversity of species, as they may harbor groups of endemic species associated with certain phytophysiognomies, thus contributing to increased local, regional, and global biodiversity [12].
The state of Bahia, one of the largest Brazilian states, located in the northeast region of the country, harbors three biomes: the Caatinga, the Cerrado, and the Atlantic Forest [13]. The Caatinga is a domain considered endemic to Brazil, with a great diversity of fauna and flora. Meanwhile, the Cerrado and Atlantic Forest are considered biodiversity hotspots [13,14]. All of them are recognized for their high species biodiversity, with a large portion being endemic and suffering from intense anthropogenic impacts [14,15]. These impacts are associated with habitat loss and degradation caused by deforestation, the conversion of areas for agriculture and pasture, intense human occupation in urban areas, and the adverse effects of climate change [15,16,17,18], emphasizing the importance of research that addresses the relationship regarding biodiversity among these biomes.
However, studies that assess the structuring of assemblages in different biomes are still scarce, especially when it comes to invertebrates [19,20,21]. Among invertebrates, aquatic insects such as the Odonata have been widely used to assess the effects of anthropogenic modifications on natural environments and their biodiversity [22]. Odonata are extremely dependent on terrestrial and aquatic ecosystems and comprise sets of species with different ecological and behavioral characteristics that allow different groups to be classified according to the type of environment in which they are found [23,24]. For example, some species can be considered forest specialists, open-area specialists, and habitat generalists [24]. Thus, it is possible to use these species’ characteristics to understand how different biomes relate to the structuring of Odonata diversity.
Based on this perspective, the present study evaluated Odonata biodiversity using taxonomic diversity metrics (richness and composition) in areas of the Atlantic Forest, Caatinga, and Cerrado. We also evaluated which sets of local and spatial environmental variables are associated with these assemblages among the different areas evaluated. This study had the following specific objectives: (a) To compare the richness of Odonata in areas of the Atlantic Forest, Cerrado, and Caatinga. Our prediction is that Cerrado areas will exhibit greater richness compared to Atlantic Forest and Caatinga. The higher environmental heterogeneity in Cerrado areas, ranging from more open areas to forested areas, with different types of vegetation formations, will provide a greater diversity of habitats for dragonfly species and maintain a greater diversity of species considered open area specialists and forest specialists along streams [24,25,26]. (b) To evaluate the Odonata assemblage composition among the different sampled regions. Our prediction is that the composition of Odonata assemblages will differ among the evaluated areas. We expect that the regions of the Cerrado and Caatinga have a similarity in composition, exhibiting greater similarity in environmental characteristics, such as temperature, rainfall, and luminosity, along with some similarities in the vegetation formation present. (c) To assess which environmental and spatial variables are structuring the composition of Odonata assemblages in the three biomes. Our prediction is that different sets of environmental variables and spatial distance act as local and regional filters in structuring Odonata biodiversity between the different sampled regions.
2. Materials and Methods
2.1. Study Area
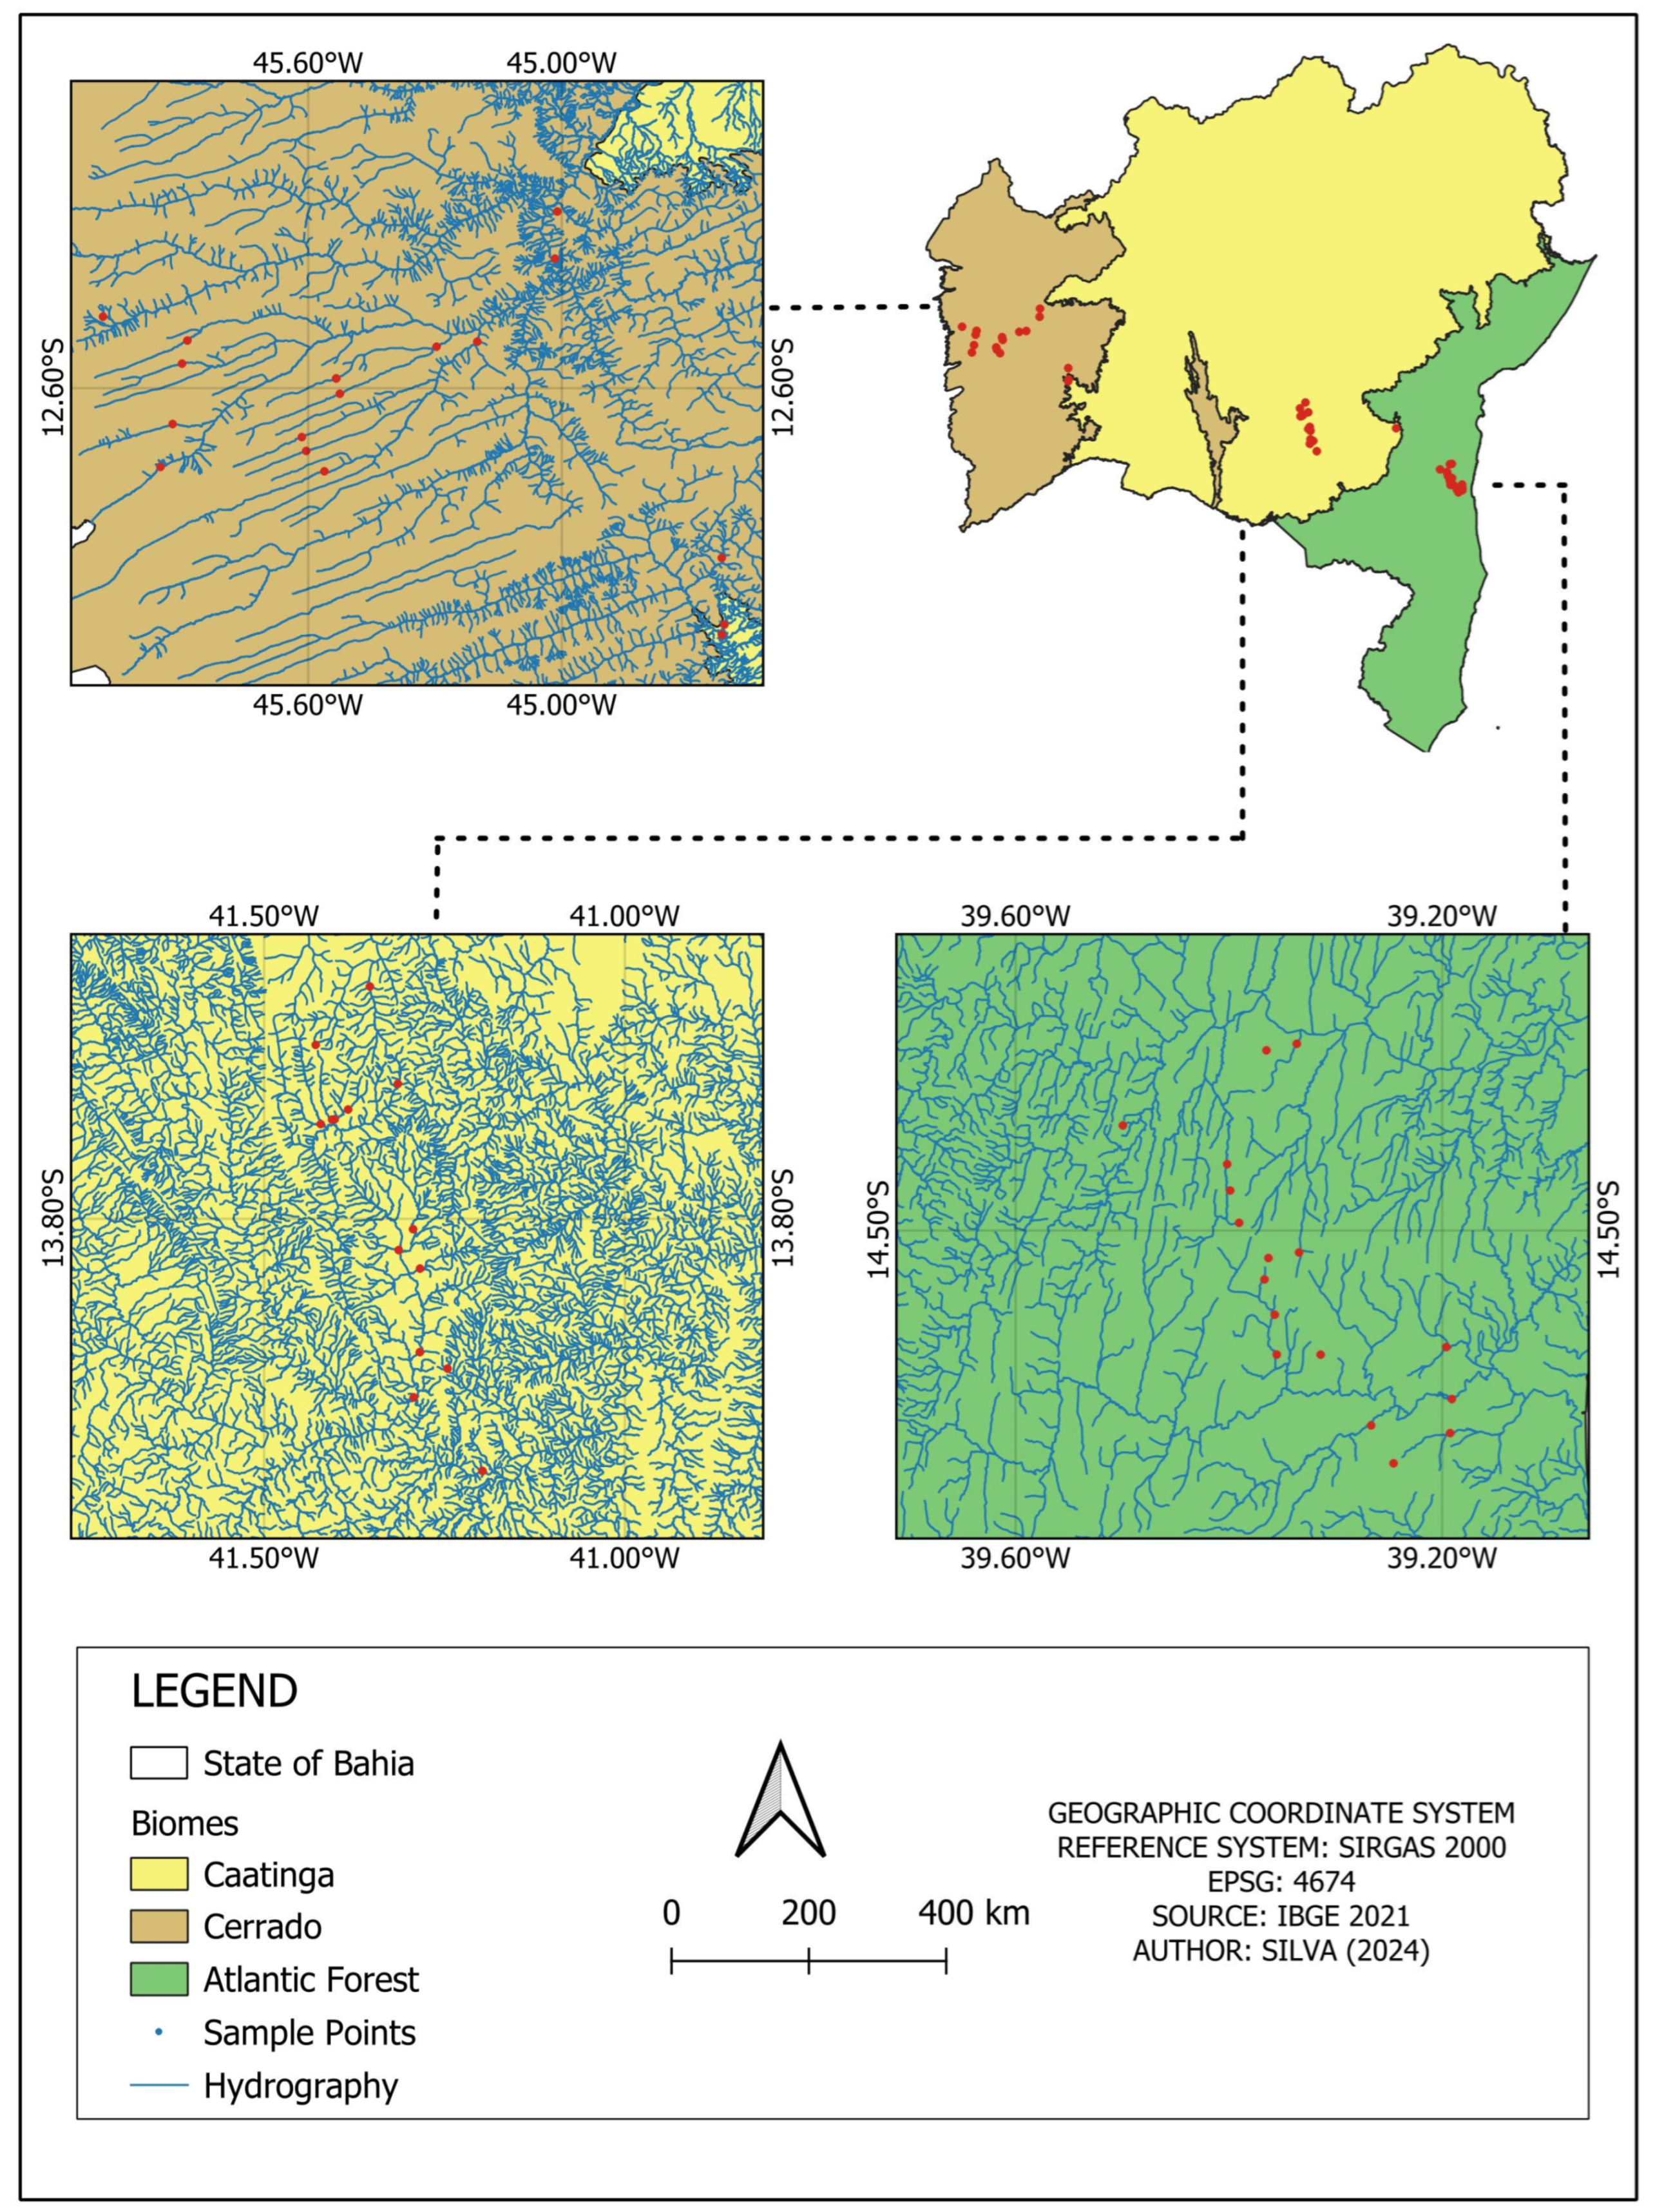
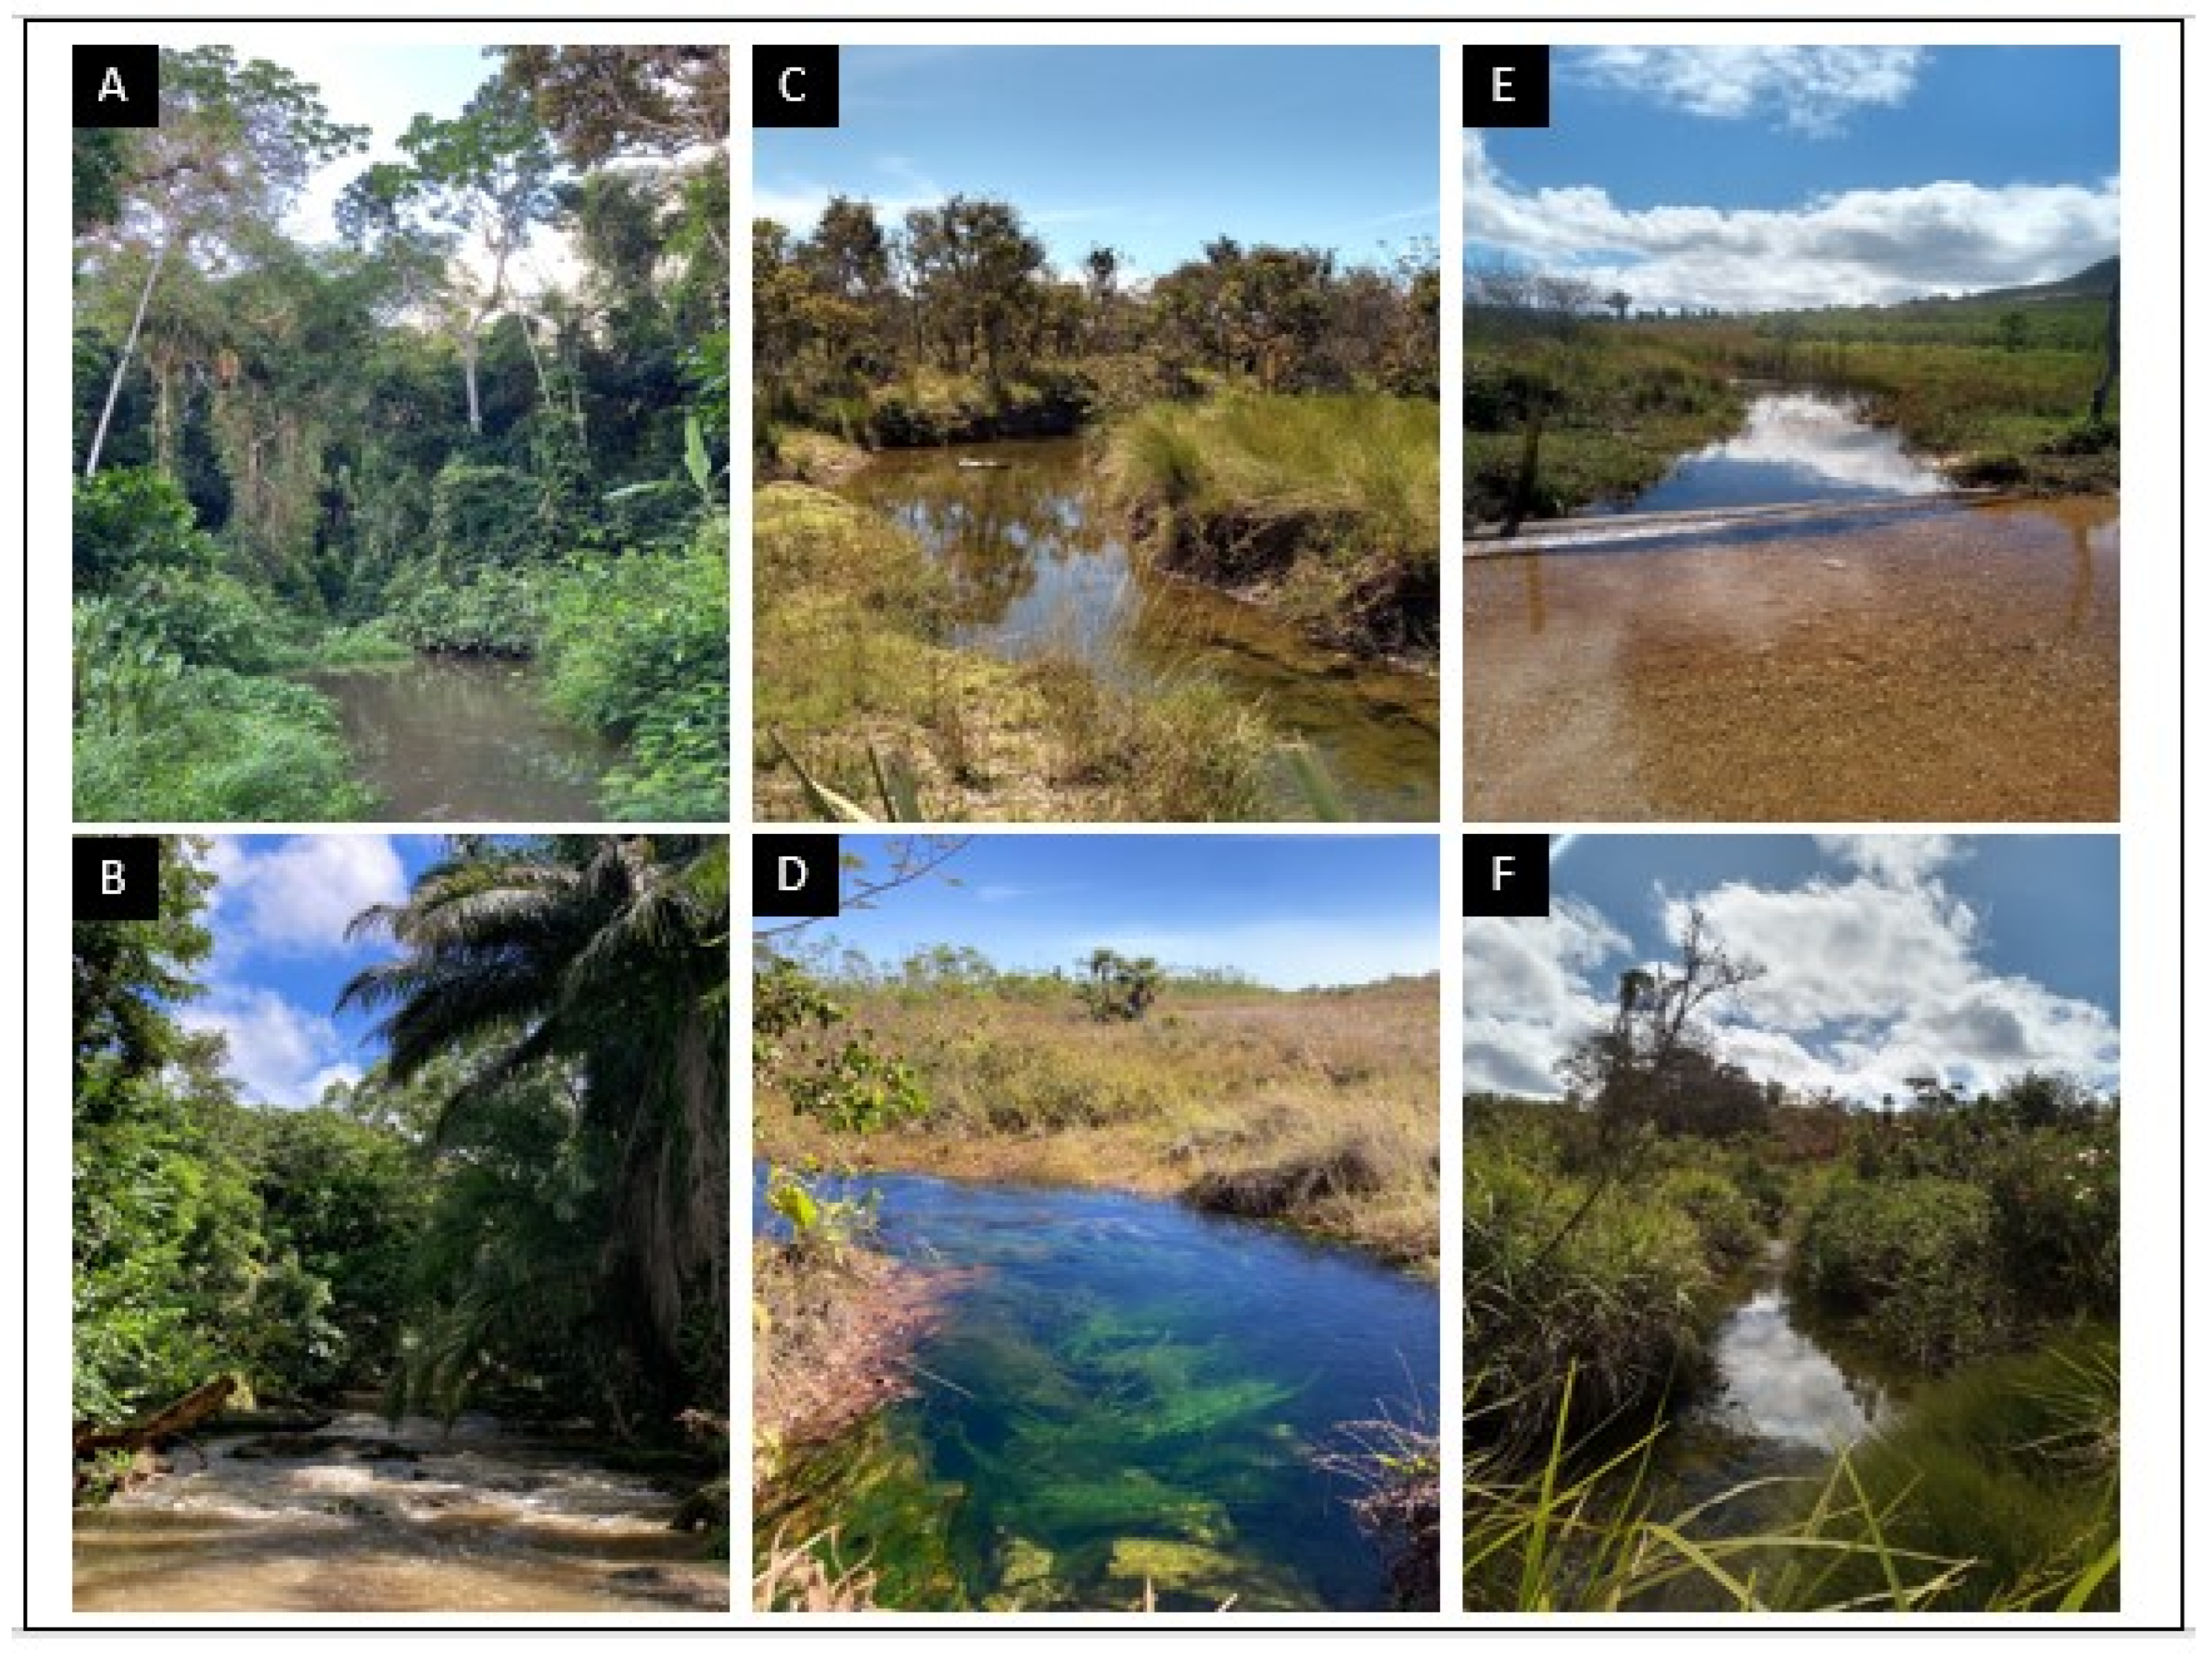
This study was conducted in the state of Bahia, Brazil, in streams located within the three biomes present in the state: Atlantic Forest, Caatinga, and Cerrado (Figure 1). In the areas of the Atlantic Forest, the region’s climate, according to Köppen–Geiger, is classified as Af Tropical Rainforest Climate (tropical super-humid), with rainfall evenly distributed throughout the year. The sampled sites were located in the Bahia Coastal Forest ecoregion. In the Caatinga region, the climate is classified as dry, with rainfall in the summer and a well-defined dry period in the winter; the average temperature is above 18 °C and there is an absence of water surplus. The sampled sites were located in the Complexo da Chapada Diamantina and Depression Sertaneja Meridional ecoregions [27]. In the Cerrado region, the climate is classified as Subhumid Tropical with rainfall in the summer and a well-defined dry period in the winter. The sampled sites were located in the Chapadão do São Francisco ecoregion. A total of 49 streams were sampled, with 17 in the Atlantic Forest, 18 in the Caatinga, and 15 in the Cerrado, all in second- to fourth-order streams (Figure 2).
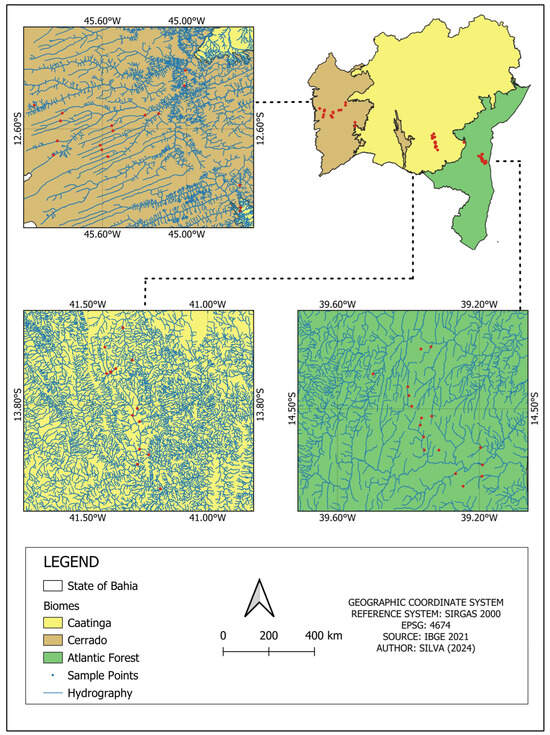
Figure 1.
Map of the state of Bahia showing the divisions of the Atlantic Forest, Caatinga, and Cerrado biomes and an enlargement of each region showing the collection points in each area. This figure provides an overview of the state and specific enlargements of each biome, illustrating the distribution of sampling points in relation to the hydrographic network (in blue) and the biome coverage.
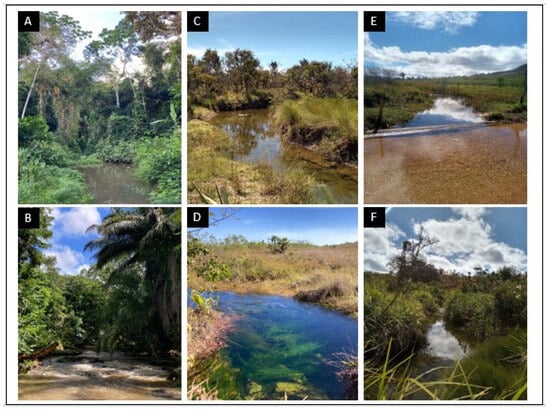
Figure 2.
Images of some of the streams sampled in different biomes of the state of Bahia, Brazil. (A,B) Streams located in the Atlantic Forest, characterized by dense forest cover and shaded banks. (C,D) Streams in the Cerrado, with campo vegetation and open areas, and waters that are often clearer with the presence of aquatic macrophytes. (E,F) Streams in the Caatinga, with more exposed banks, sparse vegetation, and generally shallower waters.
In the Atlantic Forest, a sampling campaign was conducted between April and May 2022. Generally, the streams present had stable banks, with little or no evidence of siltation, with an average width of 2.2 m and an average depth of 26.7 cm. Riparian vegetation in some sites exhibited a closed canopy, with the water temperature averaging 23.6 °C. Most of the sampled points were within cocoa cultivation areas (Theobroma cacao), known regionally as “Cabruca” or Cabruca cocoa. This cultivation system is considered an agroforestry system, where plants grow in the shade of native forest trees [28,29].
In the Caatinga, collections took place in July and August 2022. The streams had stable banks with little evidence of siltation, with an average width of 3 m and an average depth of 40 cm. Riparian vegetation in the sites consisted of an open canopy, and the average water temperature was 21.9 °C. The majority of the sampled sites are located near the Chapada Diamantina, a region dominated by small rural properties, with areas of pasture and cultivation of strawberries in greenhouses [27].
In the Cerrado, collections took place in July 2022. The sampled streams had an average width of 3.6 m and an average depth of 73 cm. Overall, most of the streams had riparian vegetation with a width ranging from 5 to 10 m, and the average water temperature was around 22.6 °C. The region is dominated by agriculture with the cultivation of soybeans, corn, and cotton and is characterized by flat soils, with little slope, and the presence of large water reservoirs such as the Uruguaia Aquifer [30].
2.2. Specimen Collection and Identification
Adult specimens were sampled within a 100 m segment on both banks of the water body. They were collected using an entomological net, with a total sampling effort of 01:30 h for each established point. Collection was authorized by SISBIO with license number 57179-1. The collected individuals were transported to the laboratory at the State University of Santa Cruz for identification using identification keys up to the genus level [31,32,33] and subsequently confirmed with specific identification keys for each group. The collected material as deposited in the Aquatic Insects Collection of the State University of Southwest Bahia—UESB.
2.3. Environmental and Spatial Variables
At each sampling point, physicochemical environmental variables were measured. The physical structure of the habitats was characterized using the Habitat Integrity Index (HII), following the methodology proposed by [34]. This index is based on the assessment of 12 environmental attributes, which consider factors such as native vegetation cover, surrounding land use, presence of natural retention structures, aquatic vegetation, substrate composition, and accumulation of organic debris. The values obtained for each criterion were transformed according to the procedure described by [35]. The final score ranges from 0.1 to 1, where lower values indicate environmental degradation, while values close to 1 reflect well-preserved conditions. The HII has been widely adopted in ecological research due to its effectiveness in evaluating the health of aquatic ecosystems and is considered a reliable tool for detecting environmental changes in these systems [36].
Measurements of stream width, depth, and flow velocity were conducted along a 100 m stretch of the stream channel, with the average taken from five measurement points at each site. To assess the chemical characteristics of the water, a multiparameter probe (YSI Professional) was used to record the following parameters: temperature, pH, electrical conductivity, dissolved oxygen (DO), and salinity (Table S1). These environmental indicators were selected for their relevance in shaping the structure and composition of aquatic insect communities, as demonstrated in various studies [37,38,39,40].
The variables were standardized prior to analysis and subsequently subjected to principal component analysis (PCA), using Euclidean distance as a dissimilarity measure. The aim was to evaluate how these variables relate to sampling sites across different domains. To determine which principal components should be retained as relevant environmental variables, the broken stick method [41] was applied. The selected axes were then incorporated into the analysis along with spatial data and the species matrix.
2.4. Spatial Variables
Spatial information was derived by calculating spatial filters based on the geographic coordinates of the sampled streams. The coordinates were recorded using a GPS device and subsequently used to construct a Euclidean distance matrix through the “vegdist” function available in the “vegan” package (version 2.6.6.1) [42]. The spatial filters were generated using the principal coordinates of neighbor matrices (PCNM) method, also implemented via the “pcnm” function in the “vegan” package [43]. This approach enables the assessment of whether spatial factors contribute to the structuring of assemblages [44]. The selection of significant axes was performed using the “adespatial” package (version 0.3.23) [45] in the R environment, version 4.3.2. PCNM vectors were subjected to a forward selection process [46], and the selected vectors were then applied in redundancy analysis (RDA). These selected vectors were subsequently incorporated into the analysis along with the environmental variables and species matrices.
2.5. Data Analysis
To assess the distribution of species richness among the sampled areas, we created a Venn diagram to show the number of species shared and exclusive among the Atlantic Forest, Cerrado, and Caatinga areas. We also calculated the estimated species richness through the rarefied (or interpolated) richness based on the number of individuals for each of the sampled areas (Atlantic Forest, Cerrado, and Caatinga).
To assess the difference in Odonata richness among phytophysiognomic domains, the non-parametric Kruskal–Wallis test was used, as the assumptions of variance homogeneity and residual normality were not met (Figure S1).
To assess the relationship regarding community composition among domains, a principal coordinates analysis (PCoA) and a permanova [47] were used. PCoA was performed on a distance matrix to determine differences between the assemblies and the biomes, and the resulting clustering was tested using permanova with 999 permutations [47].
To assess the relationship of environmental and spatial filters with Odonata species across different biomes, the data matrix containing adult specimen abundances was transformed into a relative abundance matrix separately using the Hellinger method to reduce the effect of large abundances [48]. Each stream was considered as a sampling unit, totaling 49 sampling units. The selected spatial and environmental vectors were used in a redundancy analysis (RDA) with the adult assemblage. The significance of the RDA was tested through an analysis of variance (ANOVA). All analyses were carried out using R software, version 4.3.2.
3. Results
A total of 1447 adult Odonata individuals were captured, distributed among 1036 specimens of the suborder Zygoptera and 411 of the suborder Anisoptera, totaling 95 species. In the Atlantic Forest, 465 specimens and 55 species were captured; in the Cerrado, 429 specimens and 49 species were captured; and in the Caatinga, 553 specimens and 43 species were captured. Among the collected species, the most representative for the Atlantic Forest were Acanthagrion gracile, Hetaerina auripennis, Heteragrion aurantiacum, Erythrodiplax unimaculata, and Perithemis icteroptera, with 78, 69, 43, 18, and 15 specimens, respectively; for the Cerrado, Hetaerina dutati, Acanthagrion cuyabae, Cyanallagma ferenigrum, Telebasis coccinea, Erythrodiplax latimaculata, and Erythrodiplax fusca were most representative, with 67, 60, 26, 22, 32, and 20 specimens, respectively; and for the Caatinga, Hetaerina rosea, Cyanallagma nigrinuchale, Argia tomoyo, Perithemis tenera, and Micrathyria hesperis were most representative, with 82, 34, 25, 28, and 38 specimens, respectively.
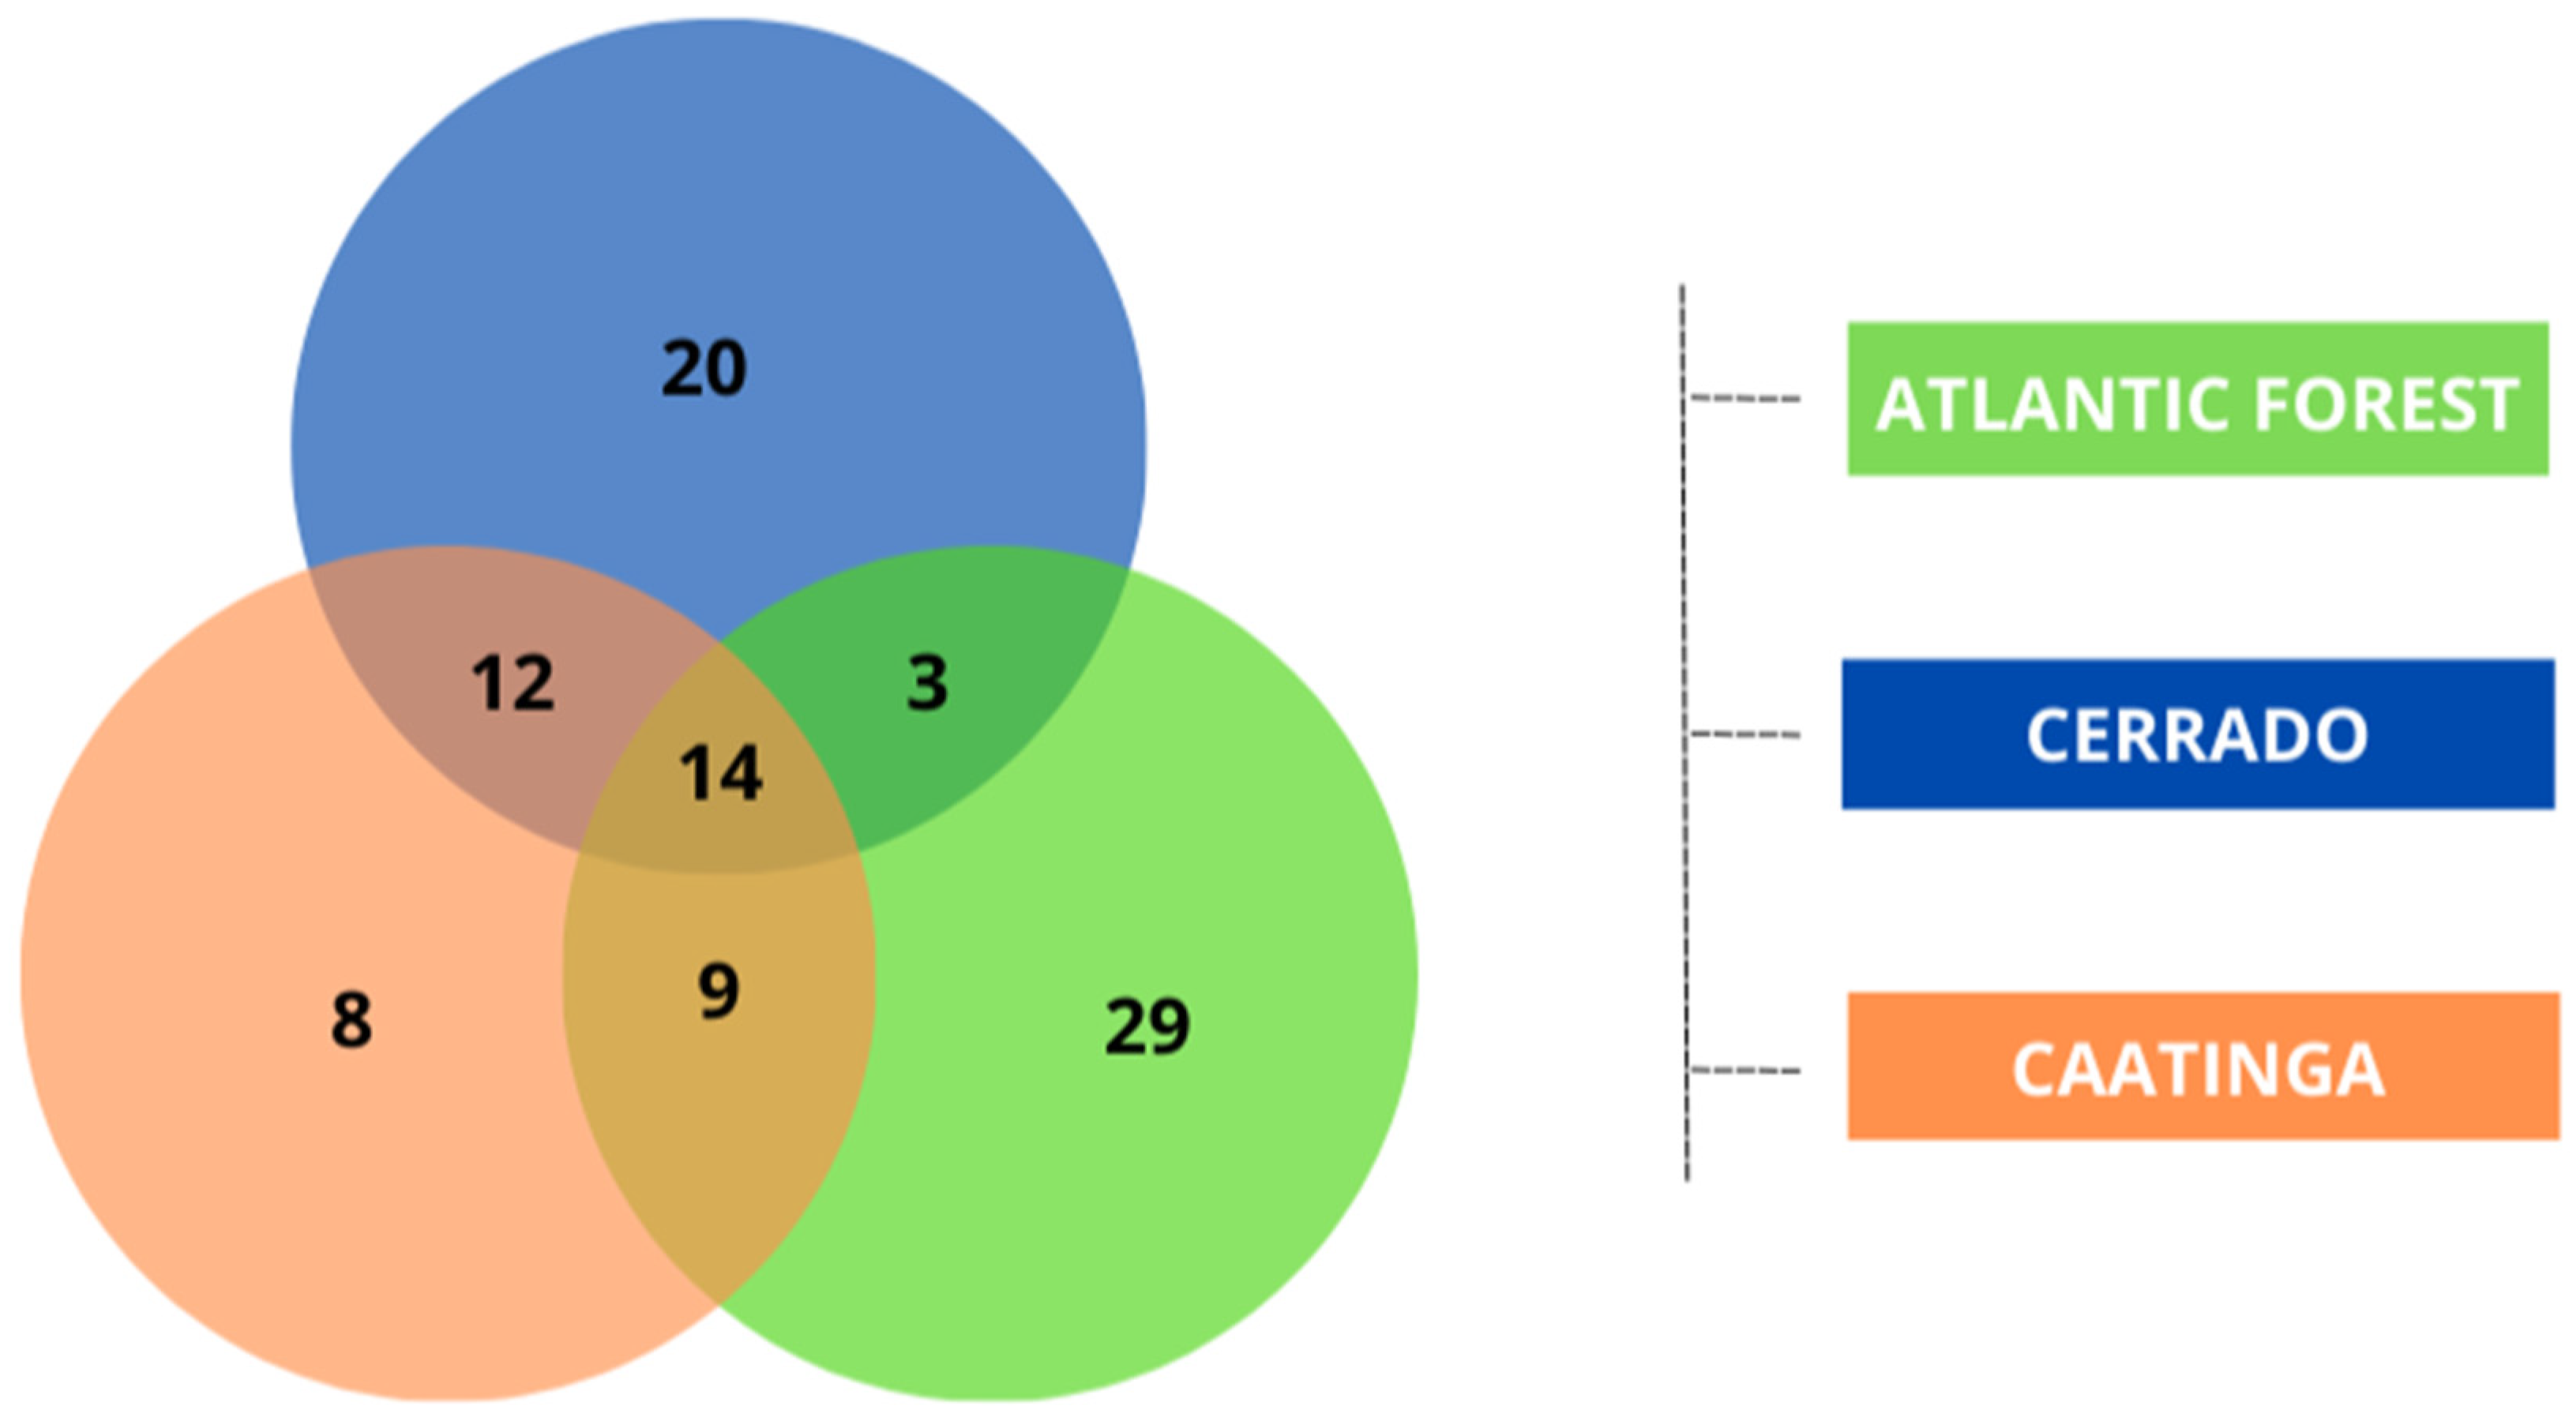
Out of the 95 species collected, we found that eight species were exclusive to the Caatinga, while 20 species occurred only in the Cerrado and 29 species occurred only in the Atlantic Forest. Among the species shared between the domains, 12 species were recorded in both the Caatinga and Cerrado, nine species for the Caatinga and Atlantic Forest, and three between the Cerrado and Atlantic Forest. Additionally, 14 species were common among all three domains (Figure 3 and Table S2).
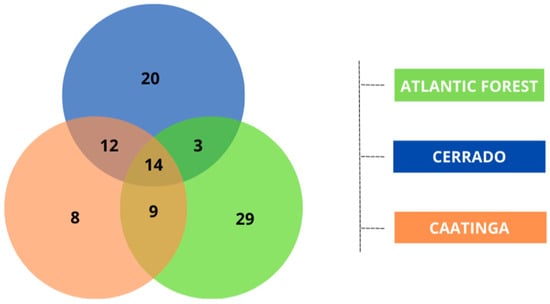
Figure 3.
Venn diagram illustrating the number of species exclusive to each biome (Atlantic Forest, Cerrado, and Caatinga) and the species shared between two or among all three biomes evaluated. This diagram highlights the uniqueness and the overlap in species composition across the different environments studied.
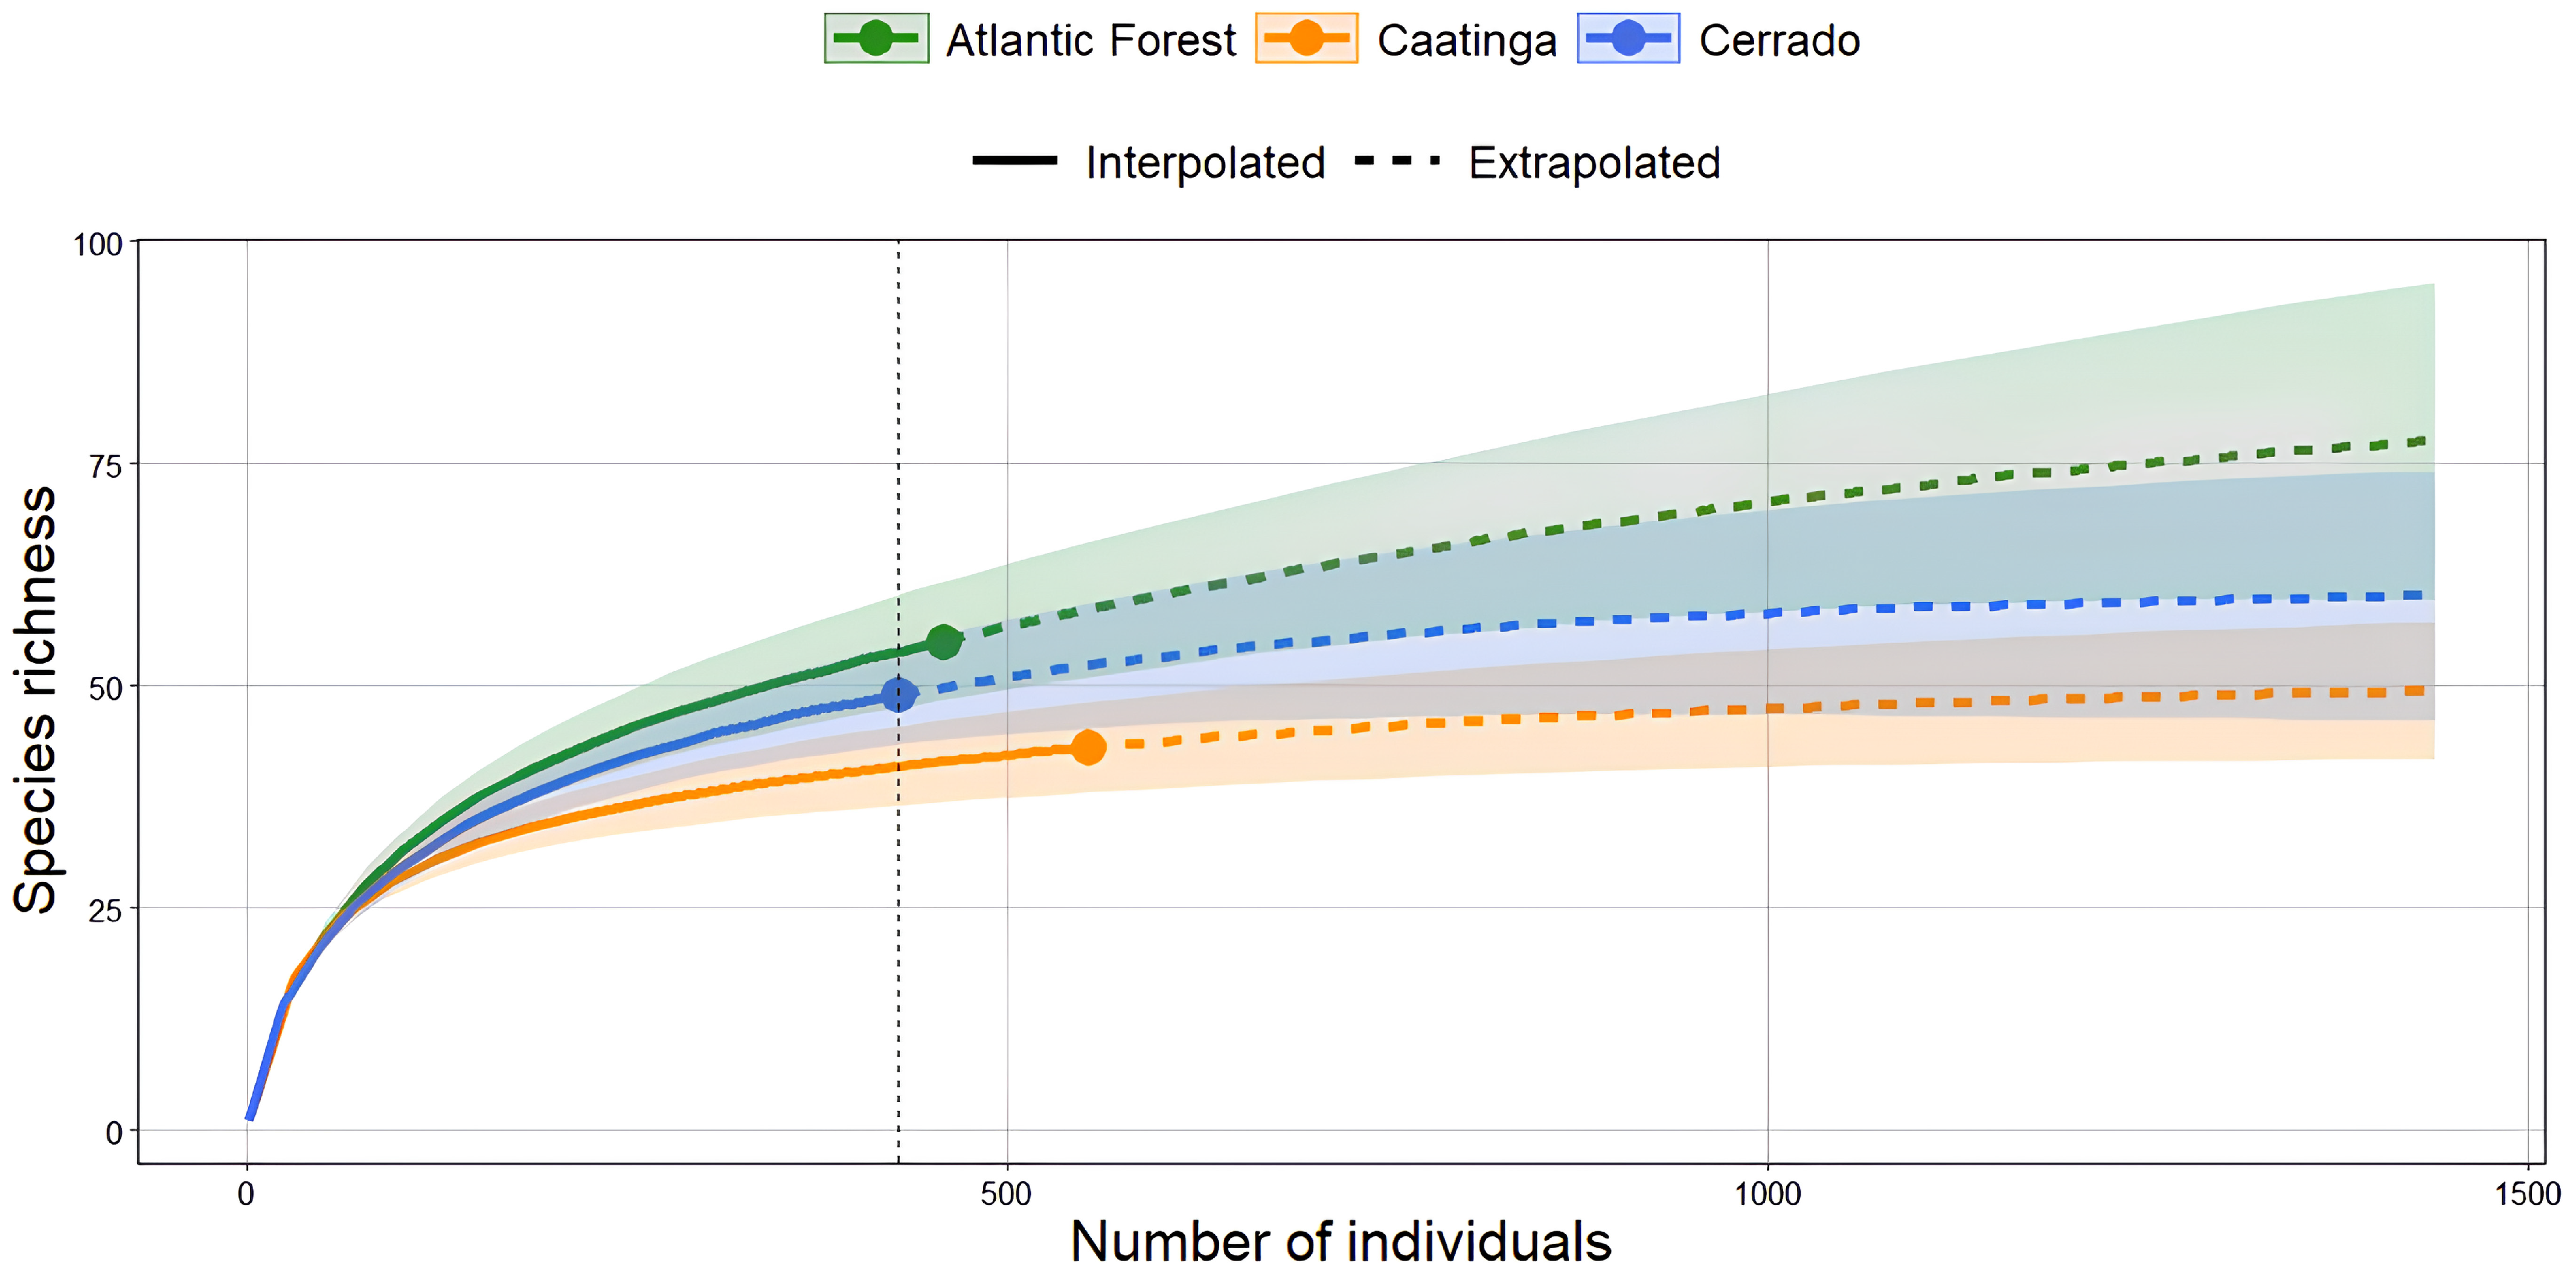
When evaluating the estimated richness of Odonata species among the phytophysiognomic domains, we found that the Atlantic Forest and Cerrado presented a sharp increase in extrapolated richness, suggesting the possibility of finding new species with increased sampling effort (87.32 and 61.04 species, respectively). In contrast, the extrapolated richness of the Caatinga (50.98 species) approaches a plateau, suggesting that most species in this domain have already been sampled. It is also worth noting that the confidence interval (95% confidence interval) of the Atlantic Forest and Cerrado clearly overlaps all phytophysiognomic domains, showing a more heterogeneous species diversity, especially in the Atlantic Forest. In contrast, the Caatinga appears to reach the saturation point more quickly, suggesting a lower and more homogeneous diversity when compared to the other phytophysiognomic domains (Figure 4).
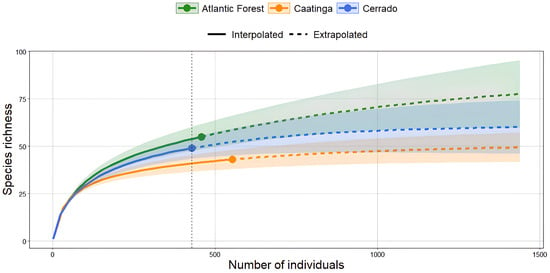
Figure 4.
Rarefied (or interpolated) richness of Odonata species among the sampled areas of the Atlantic Forest, Cerrado, and Caatinga. The Atlantic Forest and Cerrado showed extrapolated richness values of 87.32 and 61.04 species, respectively, while the Caatinga showed an extrapolated richness of 50.98 species. The dashed vertical line represents the minimum standardized abundance value among the sampled areas.
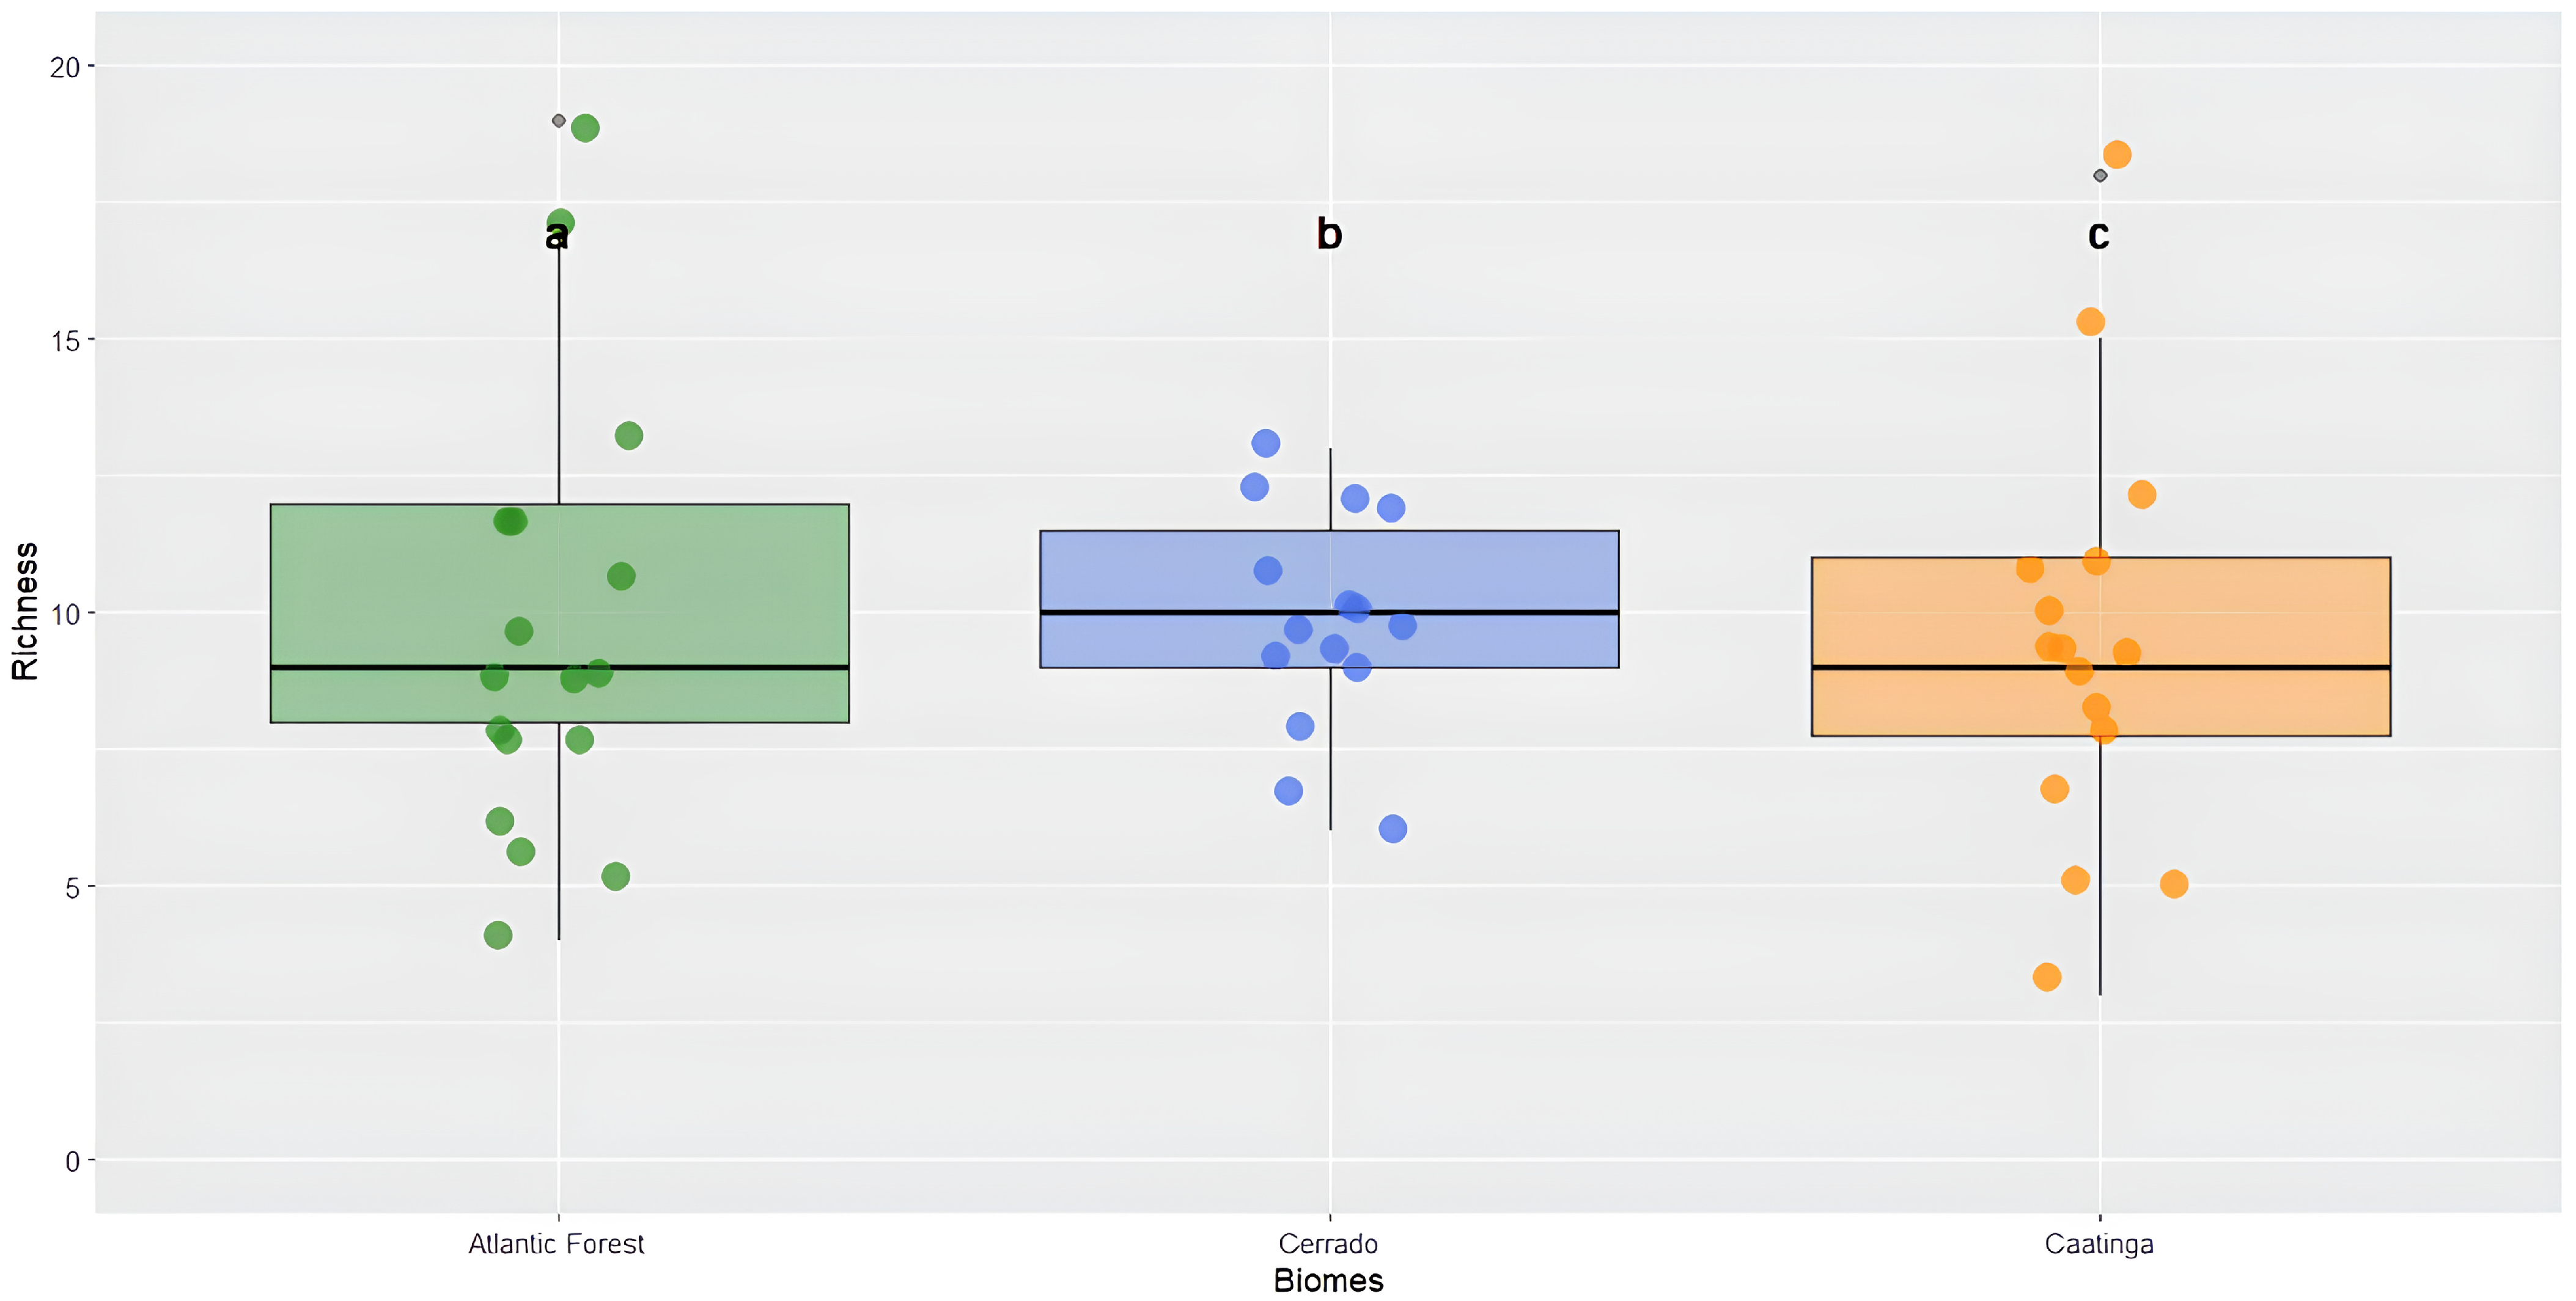
When comparing the observed richness among the three phytophysiognomic domains, the results showed that there was no significant difference among the biomes (χ2 = 0.933, df = 2, p = 0.627). The Caatinga exhibited a richness variation from 4 to 19 species with a mean of 9.7. The Cerrado showed a variation from 6 to 13 species with a mean of 9.8, and the Atlantic Forest presented a variation from 3 to 18 species with a mean of 9.3 (Figure 5).
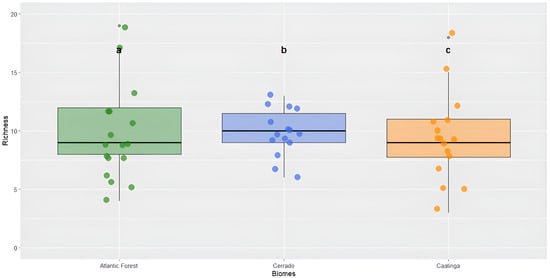
Figure 5.
Richness of the order Odonata among the different biomes: Caatinga, Cerrado, and Atlantic Forest. Kruskal–Wallis test (χ2 = 0.933, df = 2, p = 0.627). Different lowercase letters above the boxplots (a, b, c) represent comparisons among medians, but in this case, they indicate no statistically significant difference in species richness between the biomes (p > 0.05).
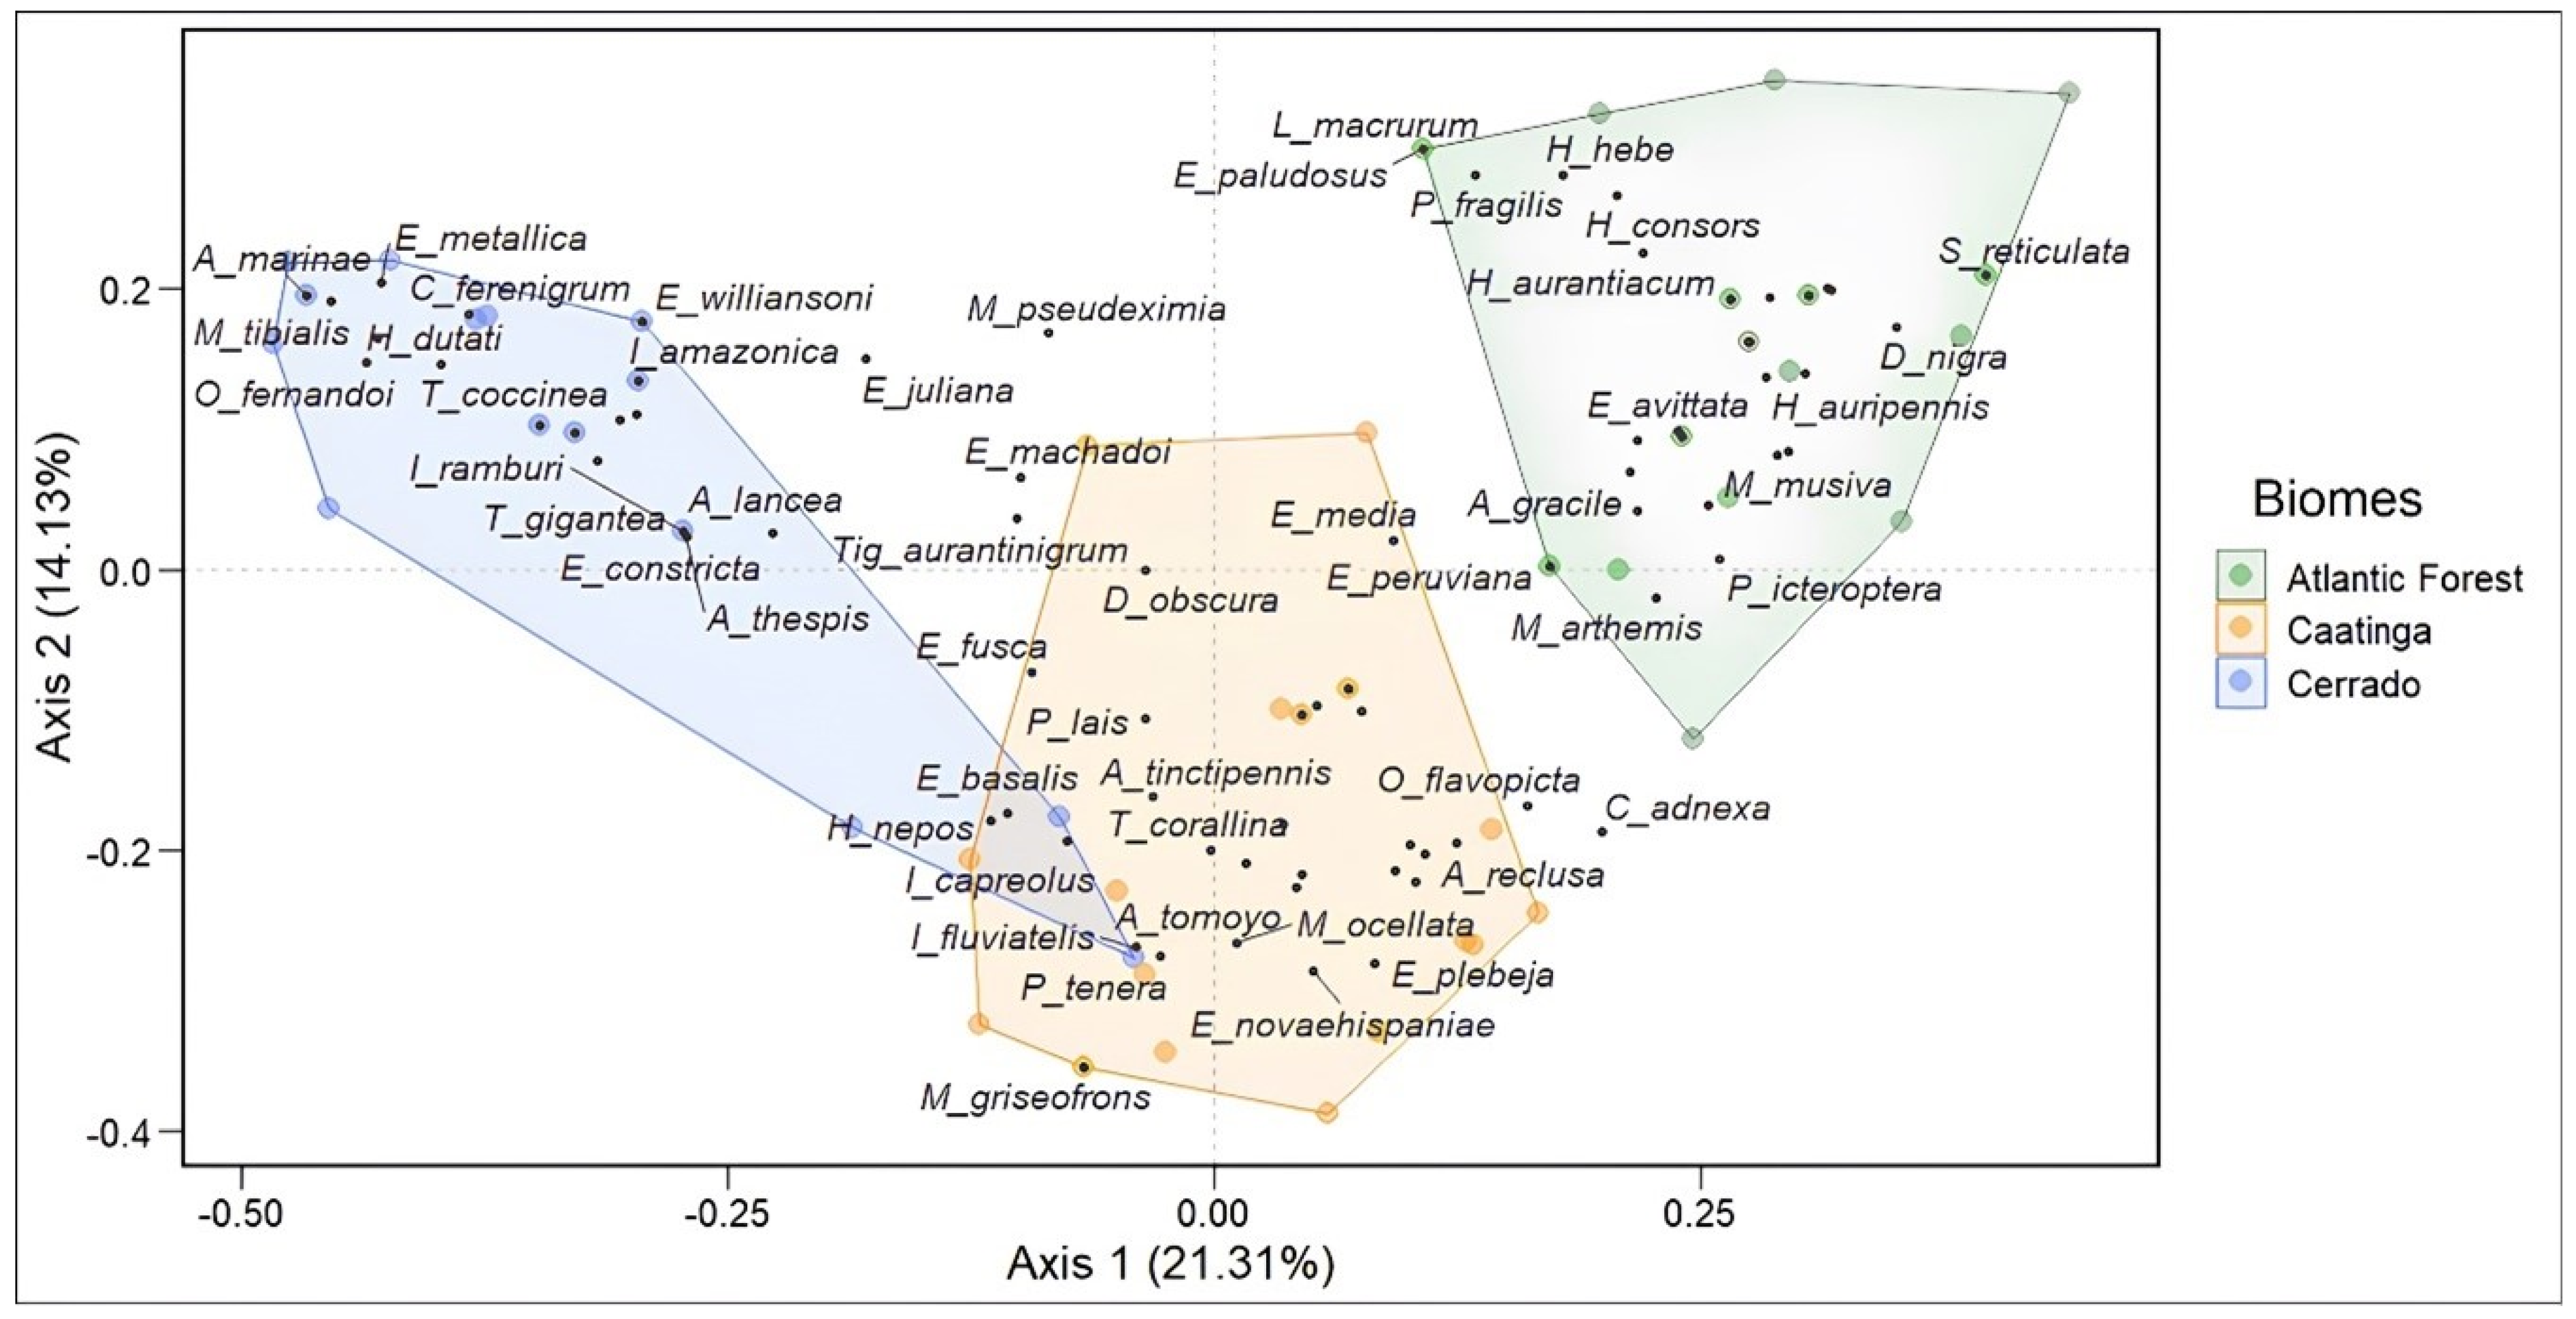
The assessment of assembly composition among the phytophysiognomic domains showed a difference between them (Permanova p < 0.001). In other words, each of the evaluated biomes has a different species composition. Most of these species are not shared between them. The composition between the species in the Atlantic Forest and the Cerrado and the Atlantic Forest and the Caatinga had the highest dissimilarity. The Caatinga and Cerrado, on the other hand, exhibited a composition with more shared species, indicating a greater similarity between them (Figure 6).
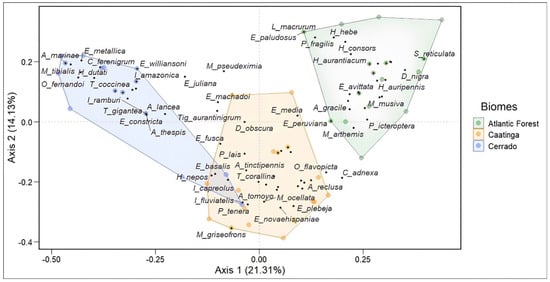
Figure 6.
PCoA analysis plot demonstrating the dissimilarity in the composition of Odonata assemblages between the Caatinga, Cerrado, and Atlantic Forest. Blue points are associated with the Cerrado domain, yellow points with the Caatinga domain, and green points with the Atlantic Forest domain.
Spatial and Environmental Variables
According to spatial variables, the axes PCNM 1, PCNM 3, and PCNM 4 were selected by means of the forward selection method, corresponding to the axes that contributed most to explaining the data for the adult assemblage among the different phytophysiognomic domains evaluated, being PCNM 1 (R2 0.11; F = 5.92, p = 0.001), PCNM 3 (R2 0.16; F = 1.57, p = 0.02), and PCNM 4 (R2 0.18; F = 1.55, p = 0.03) (Table S3).
Environmental variables in the PCA, when related to adult specimens, showed the first two axes with observed values greater than those estimated via the broken stick method. The two PCA axes accounted for 44.9% of the cumulative proportion. Axis PC1 explained 31.42%, and PC2 explained 13.51% (the eigenvalue for each axis was as follows: PC1 = 6.598; PC2 = 2.836). Among the environmental variables that contributed most to each axis, variables present in the Habitat Integrity Index (HII) with values greater than 0.8 were highlighted (Table S3). For the PC1 axis, the width of the riparian vegetation (0.92), riparian vegetation integrity (0.91), 10 m riparian zone vegetation (0.92), bank structure (0.96), sub-cut bank (0.85), aquatic vegetation (0.89), and debris (0.90) were prominent. For the PC2 axis, pH (0.90) and dissolved oxygen (0.81) stood out (Table S1).
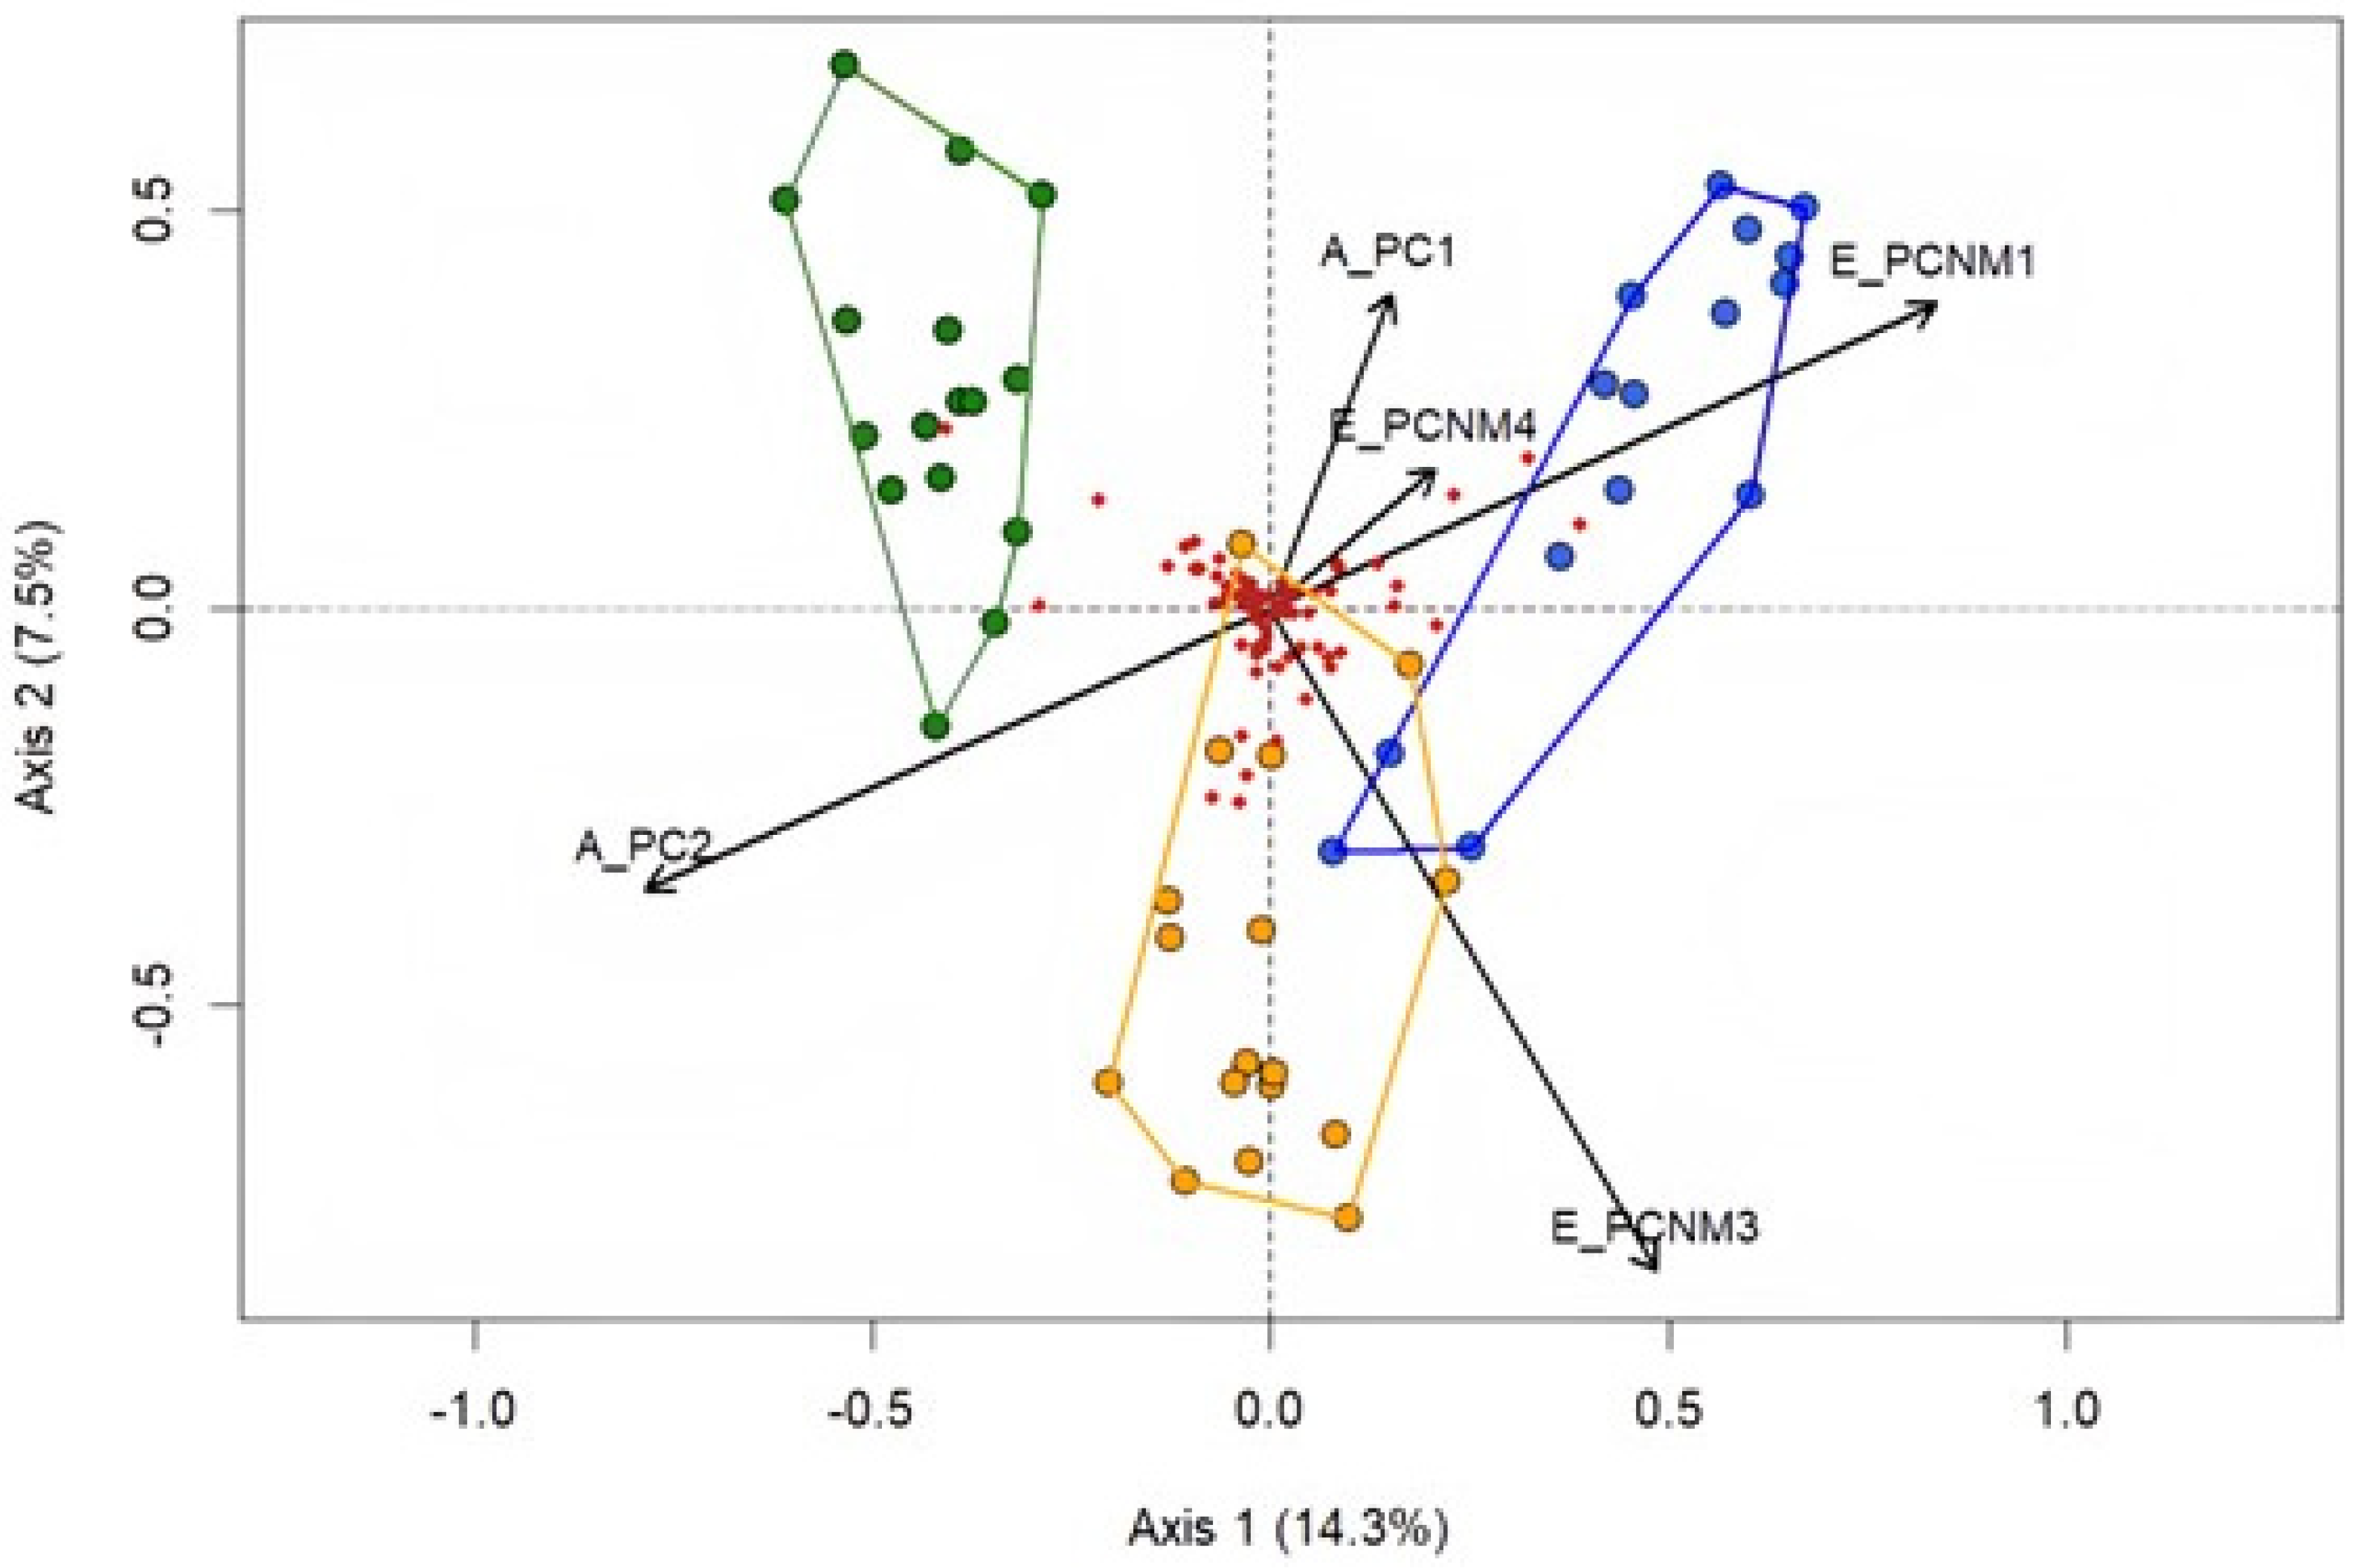
The result of redundancy analysis (RDA) indicated that the combination of environmental and spatial variables accounted for 21.8% of the composition of Odonata species assemblages in the three biomes. Axis 1 explained 14.3% and Axis 2 explained 7.5% of the variation in the data (Figure 7). The ANOVA test showed that the ordination analysis generated by RDA is statistically significant (F = 2.82, p = 0.001). Sites associated with the Caatinga are influenced by the spatial and environmental axes PC2 and PCNM3, while the Cerrado is influenced by the spatial axes APC1, PCNM1, and PCNM4. The partition analysis indicated that environmental variables explained 11%, spatial variables explained 11%, and both (environment and spatial variables) explained 29.3% (residue, 70.7%).
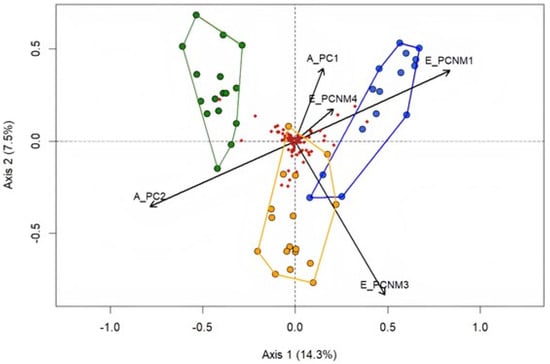
Figure 7.
Result of redundancy analysis showing the relationship between spatial variables and environmental variables among the sites in the biomes, represented by colors: green for Atlantic Forest, blue for the Cerrado, and yellow for the Caatinga. Axis 1 explained 14.3% and Axis 2 explained 7.5% of the variation in the data. PCNM—related to spatial filters; PC—related to environmental variables.
4. Discussion
Our results highlight that the areas of the Atlantic Forest, the Cerrado, and the Caatinga maintain a high diversity of Odonata species, emphasizing their importance for regional biodiversity. Although we did not find a difference in richness, we registered a difference in the composition of Odonata among sampled regions, which shows that the loss of species in one of these biomes can lead to a decrease in regional biodiversity, particularly between the Atlantic Forest and the Cerrado and the Atlantic Forest and the Caatinga, which have more dissimilar species assemblages. These results reinforce the importance of maintaining efforts related to conservation measures and reducing anthropogenic impacts in different biomes to preserve species richness and local and regional diversity. We also recorded that among the domains evaluated, environmental and spatial variables play an important role in structuring these assemblies. These particularities, which are still unclear in each biome, present exclusive species adapted to these local environmental conditions.
The similarity in species richness between the biomes did not support our prediction that the Cerrado would be the domain with the highest number of species. There are still few studies on Odonata that investigate this relationship across different biomes [19,49,50,51]. Refs. [52,53] demonstrated a similarity in Odonata richness between areas of the Cerrado and the Atlantic Forest. However, studies comparing the richness of Odonata between different environments have mostly not found a differentiation in richness when comparing areas with different anthropogenic modifications such as agricultural fields, pastures, and urbanized zones and native areas [24,29,49,54].
The similarity of richness between domains is partly associated with the group having species with different ecological and behavioral characteristics that allow a broad colonization of environments with different environmental characteristics, as is the case of the regions sampled in this study. In general, species that are considered generalists and/or specialists of open areas are associated with more open areas, with little or no riparian vegetation and environments that have a greater thermal amplitude, such as the Cerrado and Caatinga areas. Species considered as forest specialists generally do not tolerate a large thermal amplitude, use the shade of the canopy in the process of thermoregulation, and have oviposition and larval development associated with the roots, branches. and leaves that are maintained in the streams by the presence of riparian vegetation [29,54,55,56].
Our results demonstrate a large number of species shared between the Caatinga and the Cerrado and the Atlantic Forest. The sampled sites in the Caatinga are geographically located between the other two evaluated domains, bordering the Cerrado to the west and the Atlantic Forest to the east. However, it was observed that the Cerrado and Atlantic Forest have a large number of exclusive species and an intermediate number of species shared among them. Both the Cerrado and the Atlantic Forest are already known for their great diversity of Odonata [57,58,59,60,61]. In our study, species such as Argia tinctipennis, Acanthagrion aepiolum, Acanthagrion cuyabae, Cynallagma nigrinuchale, Epipleoneura metallica, Erythrodiplax latimaculata, Erythrodiplax leticia, and Oxyagrion chapandense were commonly associated with Cerrado and Caatinga areas. Studies have generally associated these species with more open environments, with high solar incidence and/or with some degree of anthropization [62,63,64,65,66,67,68,69,70]. Meanwhile, the species Heteragrion aurantiacum, Perilestes fragilis, Heteragrion consors, and Leptagrion macrurum were associated with areas of Atlantic Forest. These species are considered in the literature as dependent on forested areas and always associated with more intact environments [29,54,55,56]; that is, forest specialists.
The composition of the assemblages among the different evaluated domains showed that the Atlantic Forest areas have a more dissimilar composition compared to the other two domains. The Caatinga and Cerrado domains exhibited greater similarity between them, which corroborated our prediction. The dissimilarity among Odonata assemblages found between the domains demonstrates that these assemblages are dependent on the environmental and spatial characteristics of each phytophysiognomic domain. Studies that evaluate the composition of Odonata species have shown that changes between different land uses within the same biome modify the composition of assemblages. Environments with similar environmental characteristics have assemblages of species that are also more similar to each other. As environments are altered (naturally or anthropically), there is also a change in species assemblages between areas, especially in environments that undergo anthropic modifications, such as areas of cultivation, pasture, and urbanization [24,29,49,54]. However, there are still few studies on Odonata that evaluate this relationship between different biomes [19,35,49,50,51,62].
When evaluating the relationships of assemblages with environmental and spatial variables, we found that some environmental and spatial filters are associated with the structuring of these species within the different evaluated biomes. The environmental variables related to riparian vegetation (width and integrity of the vegetation) and channel margins (margin structure, sub-margin), aquatic vegetation, and debris (PC1 axis) are positively associated with the Cerrado areas, which are also partially related to the spatial filter (PCNM1 and PCNM4). On the other hand, the Caatinga is associated with the environmental variables of dissolved oxygen and pH (PC2 axis) and spatial filters (PCNM3 and PCNM5). Spatial filters were associated with domains considered more open (Cerrado and Caatinga). Spatial filters play a fundamental role in structuring Odonata assemblages, mainly larger species. These species generally have greater dispersal capacities and are most associated with open areas, and the vast majority are considered habitat generalist species. In contrast, more forested areas such as the Atlantic Forest have species that are considered more habitat specialists and generally respond more to environmental filters related to riparian vegetation, which act as barriers for these species [24,29,56,65,69].
Our results emphasize the need for conservation strategies adapted to the particularities of each biome. In the Atlantic Forest, for example, the preservation, maintenance, and restoration of riparian zones are essential to protect the physical integrity of streams and, consequently, preserve the species associated with this domain, especially species considered forest specialists [29,62]. In the Cerrado and Caatinga, respect for land use on the banks of water bodies, control of water use for irrigation, the uncontrolled use of insecticides, and the preservation of unique microhabitats (such as paths and temporary environments) are essential to reduce impacts on the region and preserve species that are associated with these domains, especially species considered specialists in open areas [67,70]. The integration of these measures into heterogeneous land use planning is vital for the resilience of aquatic ecosystems in the face of anthropogenic pressures within the different areas assessed and consequently for the preservation and maintenance of local and regional biodiversity.
5. Conclusions
The different biomes evaluated (Cerrado, Caatinga, and Atlantic Forest) play an important role in structuring the regional biodiversity of Odonata. Our study emphasizes that these domains are environments with high species richness and that maintain Odonata assemblages with different compositions. Our results contribute to the understanding of how these assemblages are structured and how they are associated with environmental and spatial variables, highlighting the association of species’ ecological and behavioral characteristics (forest specialists, open area specialists, and generalists) with the different biomes available. In this context, Odonata species can be used as bioindicators of regional biodiversity in the regions that are formed by several biomes. This emphasizes that the loss or degradation of different biomes on a regional scale can lead the loss and/or alteration not only of local biodiversity but also of regional biodiversity, especially considering that increasing anthropogenic impacts are associated with the environmental, landscape, and climatic changes in all of these areas.
Supplementary Materials
The following supporting information can be downloaded at: https://www.mdpi.com/article/10.3390/d17050345/s1.
Author Contributions
K.T.: Conceptualization; data curation; formal analysis; investigation; methodology; visualization; writing—original draft preparation; writing—review and editing. A.d.S.S.: Data curation; formal analysis; investigation; writing—review and editing. D.S.V.: Validation; writing—review and editing. C.R.: Formal analysis; investigation; writing—review and editing. M.E.R.: Conceptualization; methodology; data curation; investigation; validation; formal analysis; supervision; visualization; writing—original draft; writing—review and editing. All authors have read and agreed to the published version of the manuscript.
Funding
This research was funded by the Fundação de Amparo à Pesquisa do Estado da Bahia (FAPESB)/Coordination for the Improvement of Higher Education Personnel (CAPES) under project PPF0005—AVALIAÇÃO SOCIOAMBIENTAL INTEGRADA DO PROJETO FIOL—PPG SISTEMAS AQUÁTICOS TROPICAIS/UESC.
Institutional Review Board Statement
Not applicable.
Data Availability Statement
The original contributions presented in this study are included in the article and Supplementary Materials. Further inquiries can be directed to the corresponding author.
Acknowledgments
We would like to thank the Postgraduate Program in Tropical Aquatic Systems and FAPESB for the scholarship awarded to Karolina Teixeira Silva, which made it possible to collect data in the field, and the State University of Santa Cruz (UESC) for supporting the research.
Conflicts of Interest
The authors declare no conflicts of interest.
References
- Colwell, R.K. Biodiversity: Concepts, patterns, and measurement. Prin. Guide Ecol. 2009, 663, 257–263. [Google Scholar]
- Cortezzi, S.S.; Bispo, P.C.; Paciencia, G.P.; Leite, R.C. Influence of human action on the fauna of aquatic macroinvertebrates in streams in a cerrado region in the southwest of the state of São Paulo. Iheringia Sér Zool. 2009, 99, 36–43. [Google Scholar] [CrossRef]
- Brown, J.H. Why are there so many species in the tropics? J. Biogeogr. 2014, 41, 8–22. [Google Scholar] [CrossRef]
- Bo, T.; Doretto, A.; Levrino, M. Contribution of beta diversity in shaping stream macroinvertebrate communities among hydro-ecoregions. Aquat. Ecol. 2020, 54, 957–971. [Google Scholar] [CrossRef]
- Harrison, S. Local and regional diversity in a patchy landscape: Native, alien, and endemic herbs on serpentine. Ecology 1999, 80, 70–80. [Google Scholar] [CrossRef]
- Hubbell, S.P. The Unified Neutral Theory of Biodiversity and Biogeography; Princeton University Press: Princeton, NJ, USA, 2001. [Google Scholar]
- Heino, J.; Alahuhta, J. Elements of regional beetle faunas: Faunal variation and compositional breakpoints along climate, land cover and geographical gradients. J. Anim. Ecol. 2015, 84, 427–441. [Google Scholar] [CrossRef]
- Peres, C.A. Structure and special organization of an Amazonian terra firme forest primate community. J. Trop. Ecol. 1993, 9, 259–279. [Google Scholar] [CrossRef]
- Heino, J. Positive relationship between regional distribution and local abundance in stream insects: A consequence of niche breadth or habitat niche position? Ecography 2005, 28, 483–494. [Google Scholar] [CrossRef]
- Heino, J.; Grönroos, M. Untangling the relationships among regional occupancy, species traits and niche characteristics in stream invertebrates. Ecol. Evol. 2014, 4, 1931–1942. [Google Scholar] [CrossRef]
- Oliveira-Junior, J.M.B. Structuring of the Odonata (Insecta) Community in Eastern Amazonia: Spatial, Environmental and Morphological Effects in Intact and Altered Streams. Doctoral Thesis, Federal University of Pará/Museu Paraense Emílio Goeldi, Belém, Brazil, 2015; 163p. [Google Scholar]
- Harris, P.T. Biogeography, Benthic Ecology, and Habitat Classification Schemes. In Seafloor Geomorphology as Benthic Habitat; Elsevier: Amsterdam, The Netherlands, 2012; pp. 61–91. [Google Scholar]
- Mittermeier, R.A.; Tumer, W.R.; Larsen, F.W.; Brooks, T.M.; Gascon, C. Global Biodiversity Conservation: The critical role of hotspots. In Biodiversity Hotspots: Distribution and Protection of Conservation Priority Areas; Zachos, F.E., Habel, J.C., Eds.; Springer: Berlin/Heidelberg, Germany, 2011; pp. 3–22. [Google Scholar]
- Myers, N.; Mittermeier, R.A.; Mittermeier, C.G.; Fonseca, G.A.B.; Kent, J. Biodiversity hotspots for conservation priorities. Nature 2000, 403, 853–858. [Google Scholar] [CrossRef]
- Mello, K.; Taniwakir, H.; De Paula, F.R.; Valent, R.A.; Randhir, T.O.; Macedo, D.R.; Leal, C.G.; Rodrigues, C.B.; Hughes, R.M. Multiscale land use impacts on water quality: Assessment, planning, and future perspectives in Brazil. J. Environ. Manag. 2020, 270, 110879. [Google Scholar] [CrossRef] [PubMed]
- Klink, C.A.; Machado, A.R.B. Conservation of the Brazilian Cerrado. Conserv. Biol. 2005, 19, 707–713. [Google Scholar] [CrossRef]
- Ribeiro, M.C.; Metzger, J.P.; Martensen, A.C.; Ponzoni, F.J.; Hirota, M.M. The Brazilian Atlantic Forest: How much is left, and how is the remaining forest distributed? Implications for conservation. Biol. Conserv. 2009, 142, 1141–1153. [Google Scholar] [CrossRef]
- Scarano, F.R.; Ceotto, P. Brazilian Atlantic Forest: Impact, vulnerability, and adaptation to climate change. Biodivers. Conserv. 2015, 24, 2319–2331. [Google Scholar] [CrossRef]
- Brasil, L.S.; Vieira, T.B.; Oliveira Junior, J.M.B.; Dias-Silva, K.; Juen, L. Elements of metacommunity structure in Amazonian Zygoptera among streams under different spatial scales and environmental conditions. Ecol. Evol. 2017, 7, 3190–3200. [Google Scholar] [CrossRef]
- Chesters, D.; Beckshäfer, P.; Orr, C.M.; Adamowicz, J.S.; Chun, K.P.; Zhu, C.D. Climatic and vegetational drivers of insect beta diversity at the continental scale. Ecol. Evol. 2019, 9, 13764–13775. [Google Scholar] [CrossRef]
- Cardoso, P.; Parton, P.S.; Berkhofer, K.; Chichorro, F.; Deacon, C.; Fartmann, T.; Fukushima, C.S.; Gaigher, R.; Habel, J.C.; Hallmann, C.A.; et al. Scientists’ Warning to humanity on insect extinctions. Biol. Conserv. 2020, 242, 108426. [Google Scholar] [CrossRef]
- Gómez-Tolosa, M.; Rivera-Velázquez, G.; Rioja-Paradela, T.M.; Mendoza-Cuenca, L.F.; Tejeda-Cruz, C.; López, S. The use of Odonata species for environmental assessment: A meta-analysis for the Neotropical region. Environ. Sci. Pollut. Res. 2021, 28, 1381–1396. [Google Scholar] [CrossRef]
- De Marco, P., Jr.; Vianna, D.M. Distribuição do esforço de coleta de Odonata no Brasil—Subsídios para escolha de áreas prioritárias para levantamentos faunísticos. Lundiana 2005, 6, 13–26. [Google Scholar] [CrossRef]
- Carvalho, G.F.; Roque, O.F.; Barbosa, L.; Montang, A.L.F.; Juen, L. Oil palm plantation is not a suitable environment for most forest specialist species of Odonata in Amazonia. Anim. Conserv. 2018, 21, 526–533. [Google Scholar] [CrossRef]
- Rodrigues, M.E.; Roque, F.O.; Quintero, J.M.O.; Pena, J.C.C.; Sousa, D.C.; De Marco, P.J. Neolinear responses in damselfly community along a gradient of habitat loss in a savana landscape. Biol. Conserv. 2016, 194, 113–120. [Google Scholar] [CrossRef]
- Rodrigues, M.E.; Moura, E.B.; Koroiva, R.; Borges, A.C.P.; de Oliveira Roque, F. Survey of Dragonflies (Odonata) in Palm Swamps of Cerrado Hotspot. Entomol. New 2018, 128, 24–38. [Google Scholar] [CrossRef]
- Velloso, A.L.; Sampaio, E.V.S.B.; Pareyn, F.G.C. Ecorregiões: Propostas Para o Bioma Caatinga; PNE, The Nature Conservancy do Brasil: Brasília, Brazil, 2002; 76p, ISBN 8573151811. [Google Scholar]
- Cassano, C.R.; Schroth, G.; Faria, D.; Delabie, J.H.; Bede, L. Landscape and farm scale management to enhance biodiversity conservation in the cocoa producing region of southern Bahia, Brazil. Biodivers. Conserv. 2009, 18, 577–603. [Google Scholar] [CrossRef]
- Santos, L.R.; Rodrigues, M.E. Dragonflies (Odonata) in cocoa growing areas in the Atlantic Forest: Taxonomic diversity and relationship with environmental and spatial variables. Diversity 2022, 14, 672. [Google Scholar] [CrossRef]
- Lima, L.B.; Pimenta, F.M.; Silva, E.A.D.; Santos, A.B.; Costa, M.H. Spatial and temporal analysis of agricultural expansion in western Bahia. In Proceedings of the XXVII Brazilian Cartography Congress and XXVI Exposicarta, SBC, Rio de Janeiro, Brazil, 6–9 November 2017; pp. 1280–1283. [Google Scholar]
- Garrison, R.W.; Von Ellenrieder, N.; Louton, J.A. Damselfly Genera of the New World: An Illustrated and Annotated Key to the Zygoptera; The Johns Hopkins University Press: Baltimore, MD, USA, 2010. [Google Scholar]
- Lencioni, F.A.A. The Damselflies of Brazil: An Illustrated Guide—The Non Coenagrionidae families; All Print Editora: São Paulo, Brazil, 2005. [Google Scholar]
- Lencioni, F.A.A. The Damselflies of Brazil: An Illustrated Guide—Coenagrionidae; All Print Editora: São Paulo, Brazil, 2006. [Google Scholar]
- Nessimian, J.L.; Venticinque, E.; Zuanon, J.; De Marco, P.; Gordo, M.; Fidelis, L.; D’arc Batista, J.; Juen, L. Land use, habitat integrity, and aquatic insect assemblages in Central Amazonian streams. Hydrobiologia 2008, 614, 117–131. [Google Scholar] [CrossRef]
- Oliveira-Junior, J.M.B.; Juen, L. The Zygoptera/Anisoptera Ratio (Insecta: Odonata): A New Tool for Habitat Alterations Assessment in Amazonian Streams. Neotrop. Entomol. 2019, 48, 552–560. [Google Scholar] [CrossRef]
- Brasil, L.S.; Lima, E.L.; Spigoloni, Z.A.; Ribeiro-Brasil, D.R.G.; Juen, L. The habitat integrity index and aquatic insect communities in tropical streams: A meta-analysis. Ecol. Indic. 2020, 116, 106495. [Google Scholar] [CrossRef]
- Cunha, E.J.; Assis, L.M.F.; Juen, L. Oil palm crops effects on evironmental integrity of Amazonian streams and Heteroptera (Hemiptera) species diversity. Ecol. Indic. 2015, 52, 422–429. [Google Scholar] [CrossRef]
- Calvão, L.B.; Nogueira, D.S.; Montag, L.F.A.; Lopes, M.A.; Juen, L. Are Odonata communities impacted by conventional or reduced impact logging? Ecol. Manag. 2016, 382, 143–150. [Google Scholar] [CrossRef]
- Valente-Neto, F.; de Oliveira Roque, F.; Rodrigues, M.E.; Juen, L.; Swan, C.M. Toward a practical use of Neotropical odonates as bioindicators: Testing congruence across taxonomic resolution and life stages. Ecol. Indic. 2016, 61, 952–959. [Google Scholar] [CrossRef]
- Valente-Neto, F.; Rodrigues, M.E.; Roque, F.O. Selecting indicators based on biodiversity surrogacy and environmental response in a riverine network: Bringing operationality to biomonitoring. Ecol. Indic. 2018, 94, 198–206. [Google Scholar] [CrossRef]
- Jackson, D.A. Stopping rules in principal components analysis, a comparison of heuristical and statistical approaches. Ecology 1993, 74, 2204–2214. [Google Scholar] [CrossRef]
- Dray, S.; Legendre, P.; Blanchet, G. Packfor: Forward Selection with Permutation (Canoco p. 46). R-Forge, The R Project for Statistical Computing 2016. Available online: https://rdrr.io/rforge/packfor/ (accessed on 12 October 2022).
- Dray, S.P.; Legendre, P.; Peres-Neto, P.R. Spatial modelling, a comprehensive framework for principal coordinate analysis of neighbour matrices (PCNM). Ecol. Model. 2006, 196, 483–793. [Google Scholar] [CrossRef]
- Cunha, E.J.; Juen, L. Environmental drivers of the metacommunity structure of insects on the surface of tropical streams of the Amazon. Austral Ecol. 2020, 45, 586–595. [Google Scholar] [CrossRef]
- Dray, S.; Blanchet, G.; Borcard, D.; Guenard, G.; Jombart, T.; Larocque, G.; Legendre, P.; Madi, N.; Wagner, H.H.; Dray, M.S. Package ‘adespatial’. R. Package 2018, 2018, 3–8. [Google Scholar]
- Blanchet, G.F.; Legendre, P.; Borcard, D. Forward Selection of Explanatory Variables. ESA J. 2008, 89, 2623–2632. [Google Scholar] [CrossRef]
- Anderson, M.J.; Walsh, D.C.I. PERMANOVA, ANOSIM, and the mantel test in the face of heterogeneous dispersions: What null hypothesis are you testing? Ecol. Monogr. 2013, 83, 557–574. [Google Scholar] [CrossRef]
- Legendre, P.; Legendre, L. Numerical Ecology; Elsevier: Amsterdam, The Netherlands, 2012. [Google Scholar]
- Juen, L.; De Marco, P. Dragonfly endemism in the Brazilian Amazon: Competing hypotheses for biogeographical patterns. Biodivers. Conserv. 2012, 21, 3507–3521. [Google Scholar] [CrossRef]
- Juen, L.; De Marco, P. Odonate biodiversity in terra-firme forest streamlets in Central Amazonia: On the relative effects of neutral and niche drivers at small geographical extents. Insect Conserv. Divers. 2011, 4, 265–274. [Google Scholar] [CrossRef]
- Renner, S.; Périco, E.; Dalzochio, M.S.; Sahlém, G. The balance of common vs. rare: A study of dragonfly (Insecta: Odonata) assemblages is the Brazilian Pampa biome. Neotrop. Biodivers. 2022, 8, 188–199. [Google Scholar] [CrossRef]
- De Marco, P.; Batista, J.D.; Cabette, H.S.R. Community assembly of adult odonates in tropical streams: An ecophysiological hypothesis. PLoS ONE 2015, 10, e0123023. [Google Scholar] [CrossRef] [PubMed]
- Martins, F.A. Determinants of Odonata Diversity in Brazil: An Approach at Different Spatial Scales. Doctoral Thesis, Federal University of Goiás, Goiânia, Brazil, 2016. [Google Scholar]
- Ribeiro, C.; Rodrigues, M.E.; Shalén, G.; de Oliveira Roque, F. Dragonflies within and outside protected area: A comparison revealing the role of well-preserved atlantic forests in the preservation of critically endangered, phytotelmatous species. J. Insect Conserv. 2022, 26, 27–282. [Google Scholar] [CrossRef]
- Fonseca, B.M.; de Mendonça-Galvão, L.; Padovesi-Fonseca, C.; de Abreu, L.M.; Fernandes, A.C.M. Nutrient baselines of Cerrado low-order streams: Comparing natural and impacted sites in Central Brazil. Environ. Monit. Assess. 2014, 186, 19–33. [Google Scholar] [CrossRef]
- Mendes, T.P.; Fogac, L.; Alvarado, S.T.; Juen, L. Assessing habitat quality on alpha and beta diversity of Odonata larvae (Insect) in logging areas in Amazon forest. Hydrobiologia 2021, 848, 1147–1161. [Google Scholar] [CrossRef]
- Rodrigues, M.E.; Roque, F.D.O. Odonata checklist of Mato Grosso do Sul state, Brasil. Iheringia Série Zool. 2017, 107, e2017117. [Google Scholar]
- Ribeiro, C.; Firme, B.; Araujo, S.A.; de Sá, A.; Zander, F.; Teixeira, K.S.; Santos, L.R.; Rodrigues, M.E. Check-list of Odonata from the state of Bahia, Brazil: Ecological information, distribution, and new state records. Odonatologica 2021, 50, 161–186. [Google Scholar] [CrossRef]
- Venâncio, H.; Vilela, D.S.; Barbosa, M.S.; Santos, J.C. Dragonflies and Damselflies in a region of the Triângulo Mineiro, Minas gerais: Checklist and taxonomic additions. Biota Neotrop. 2021, 21, e20201182. [Google Scholar] [CrossRef]
- Anjos, C.S.; Gouvea, T.P.; Vilela, D.S.; Souza, M.M. Odonata (Insecta) richness in Atlantic Forests from Minas Gerais state, Brasil. Entomobrasilis 2023, 16, e1056. [Google Scholar] [CrossRef]
- Gouvea, T.P.; Stefani, G.; Vilela, D.S.; Avila-Junior, W.; Souza, M.M. Odonata community in transition areas between Cerrado and Atlantic Forest biomes in south-central Minas Gerais, Brazil. Acta Sci. Biol. Sci. 2023, 45, e63434. [Google Scholar] [CrossRef]
- Juen, L.; Oliveira-Junior, J.M.B.D.; Shimano, Y.; Mendes, T.P.; Cabette, H.S.R. Composition and richness of Odonata (Insecta) in streams with different levels of conservation in a Cerrado-Amazonian Forest ecotone. Acta Amaz. 2014, 44, 223–233. [Google Scholar] [CrossRef]
- Nobre, C.E.B.; Carvalho, A.L. Odonata of Itatira, a Brazilian semi-arid area in the state of Ceará. Int. J. Odonatol. 2014, 17, 73–80. [Google Scholar] [CrossRef]
- Nobre, C.E.B. Erythrodiplax leticia: Description of the female and updated geographic distribution (Odonata: Libellulidae). Zootaxa 2016, 4067, 469–472. [Google Scholar] [CrossRef] [PubMed]
- Calvão, L.B.; Juen, L.; de Oliveira Junior, J.M.B.; Batista, J.D.; De Marco Júnior, P. Land use modifies Odonata diversity in streams of the Brazilian Cerrado. J. Insect Conserv. 2018, 22, 675–685. [Google Scholar] [CrossRef]
- Bastos, R.C.; Brasil, L.S.; Carvalho, F.G.; Calvão, L.B.; Silva, J.; Juen, L. Odonata of the state of Maranhão, Brazil: Wallacean shortfall and priority areas for faunistic inventories. Biota Neotrop. 2019, 9, e20190734. [Google Scholar] [CrossRef]
- Veras, D.S.; Pinto, N.S.; Calvão, L.; Lustosa, G.S.; Azevêdo, C.A.S.; Juen, L. Environmental thresholds of dragonflies and damselflies from a Cerrado-Caatinga ecotone. Environ. Monit. Assess. 2022, 194, 614. [Google Scholar] [CrossRef]
- Veras, D.S.; Ferreira, M.F.R.; Lustosa, G.S.; Sousa, M.M.C.; Juen, L. Heterogeneity in altered streams does not increase the richness of stream specialist species of Odonata in the Maranhense Cerrado. J. Insect Conserv. 2024, 28, 665–674. [Google Scholar] [CrossRef]
- Miguel, T.B.; Oliveira-Júnior, J.M.B.; Ligeiro, R.; Juen, L. Odonata (Insecta) as a tool for the biomonitoring of environmental quality. Ecol. Indic. 2017, 81, 555–566. [Google Scholar] [CrossRef]
- Latrubesse, E.M.; Arima, E.; Ferreira, M.E.; Nogueira, S.H.; Wittmann, F.; Dias, M.S.; Bayer, M. Fostering water resource governance and conservation in the Brazilian Cerrado biome. Conserv. Sci. Pract. 2019, 1, e77. [Google Scholar] [CrossRef]
Disclaimer/Publisher’s Note: The statements, opinions and data contained in all publications are solely those of the individual author(s) and contributor(s) and not of MDPI and/or the editor(s). MDPI and/or the editor(s) disclaim responsibility for any injury to people or property resulting from any ideas, methods, instructions or products referred to in the content. |
© 2025 by the authors. Licensee MDPI, Basel, Switzerland. This article is an open access article distributed under the terms and conditions of the Creative Commons Attribution (CC BY) license (https://creativecommons.org/licenses/by/4.0/).

