
Genetic Variation and Differentiation of Himantoglossum s.s. in Greece


Abstract
1. Introduction
- (a)
- to study the genetic variation of Himantoglossum s.s. in Greece,
- (b)
- to explore the genetic differentiation of Himantoglossum s.s. in Greece, and in particular, whether H. jankae, the so-called H. samariense, and the populations of the Peloponnese and of Lesvos island are genetically differentiated, and
- (c)
- to search for DNA polymorphisms capable of discriminating the above taxa and/or the populations.
2. Materials and Methods
2.1. Plant Material
2.2. DNA Extraction
2.3. ISSR Markers
- (a)
- for UBC-810, UBC-811 and UBC-834: initial denaturation at 94 °C for 4 min, followed by 45 cycles comprising 30 s at 94 °C, 15 s at 45 °C and 2 min at 72 °C, and a final extension step at 72 °C for 7 min.
- (b)
- for UBC-815 and UBC-847: initial denaturation at 94 °C for 4 min, followed by 40 cycles comprising 30 s at 94 °C, 30 s at 45 °C and 2 min at 72 °C, and a final extension step at 72 °C for 7 min.
2.4. Sequencing of cpDNA and nDNA Regions
2.5. Data Analyses
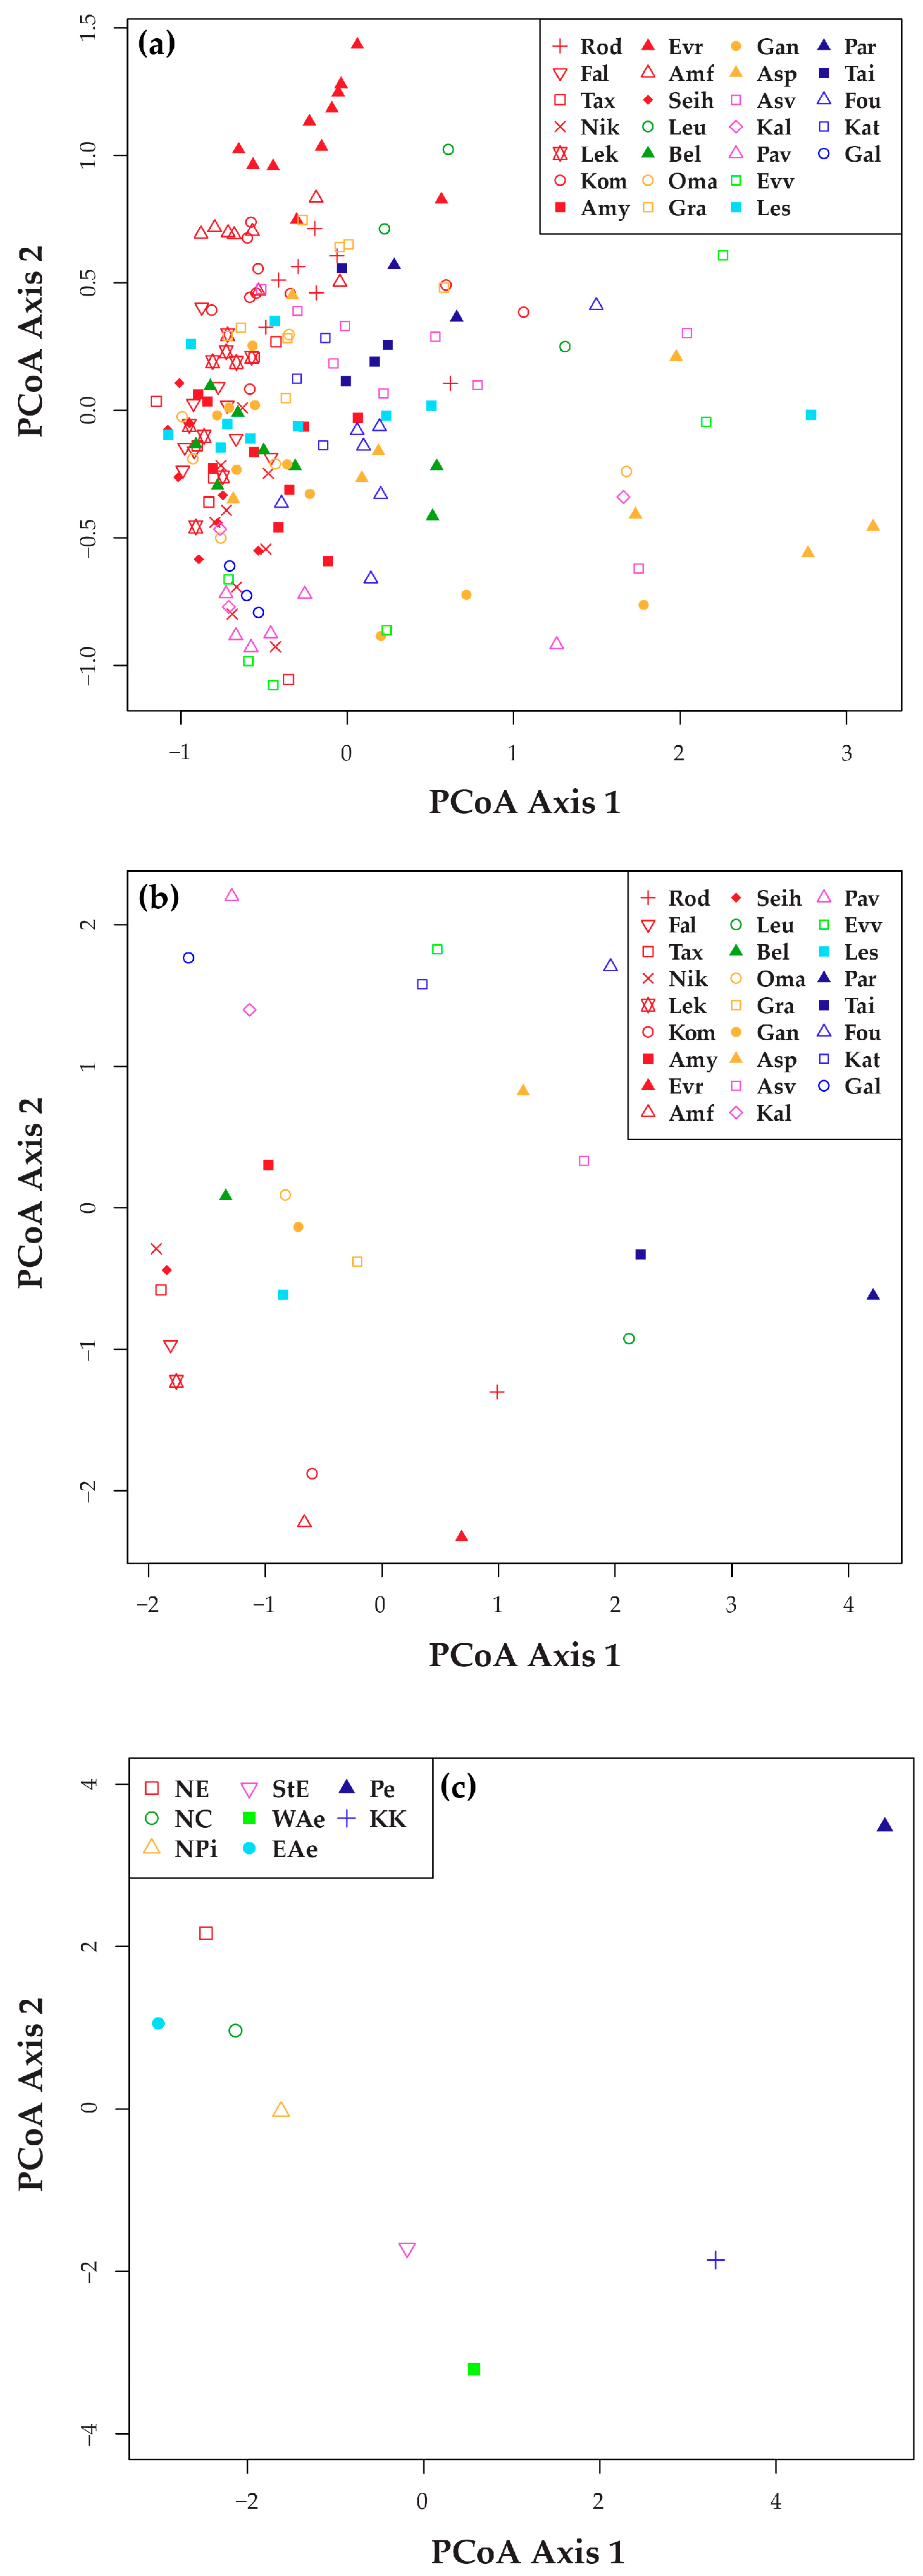
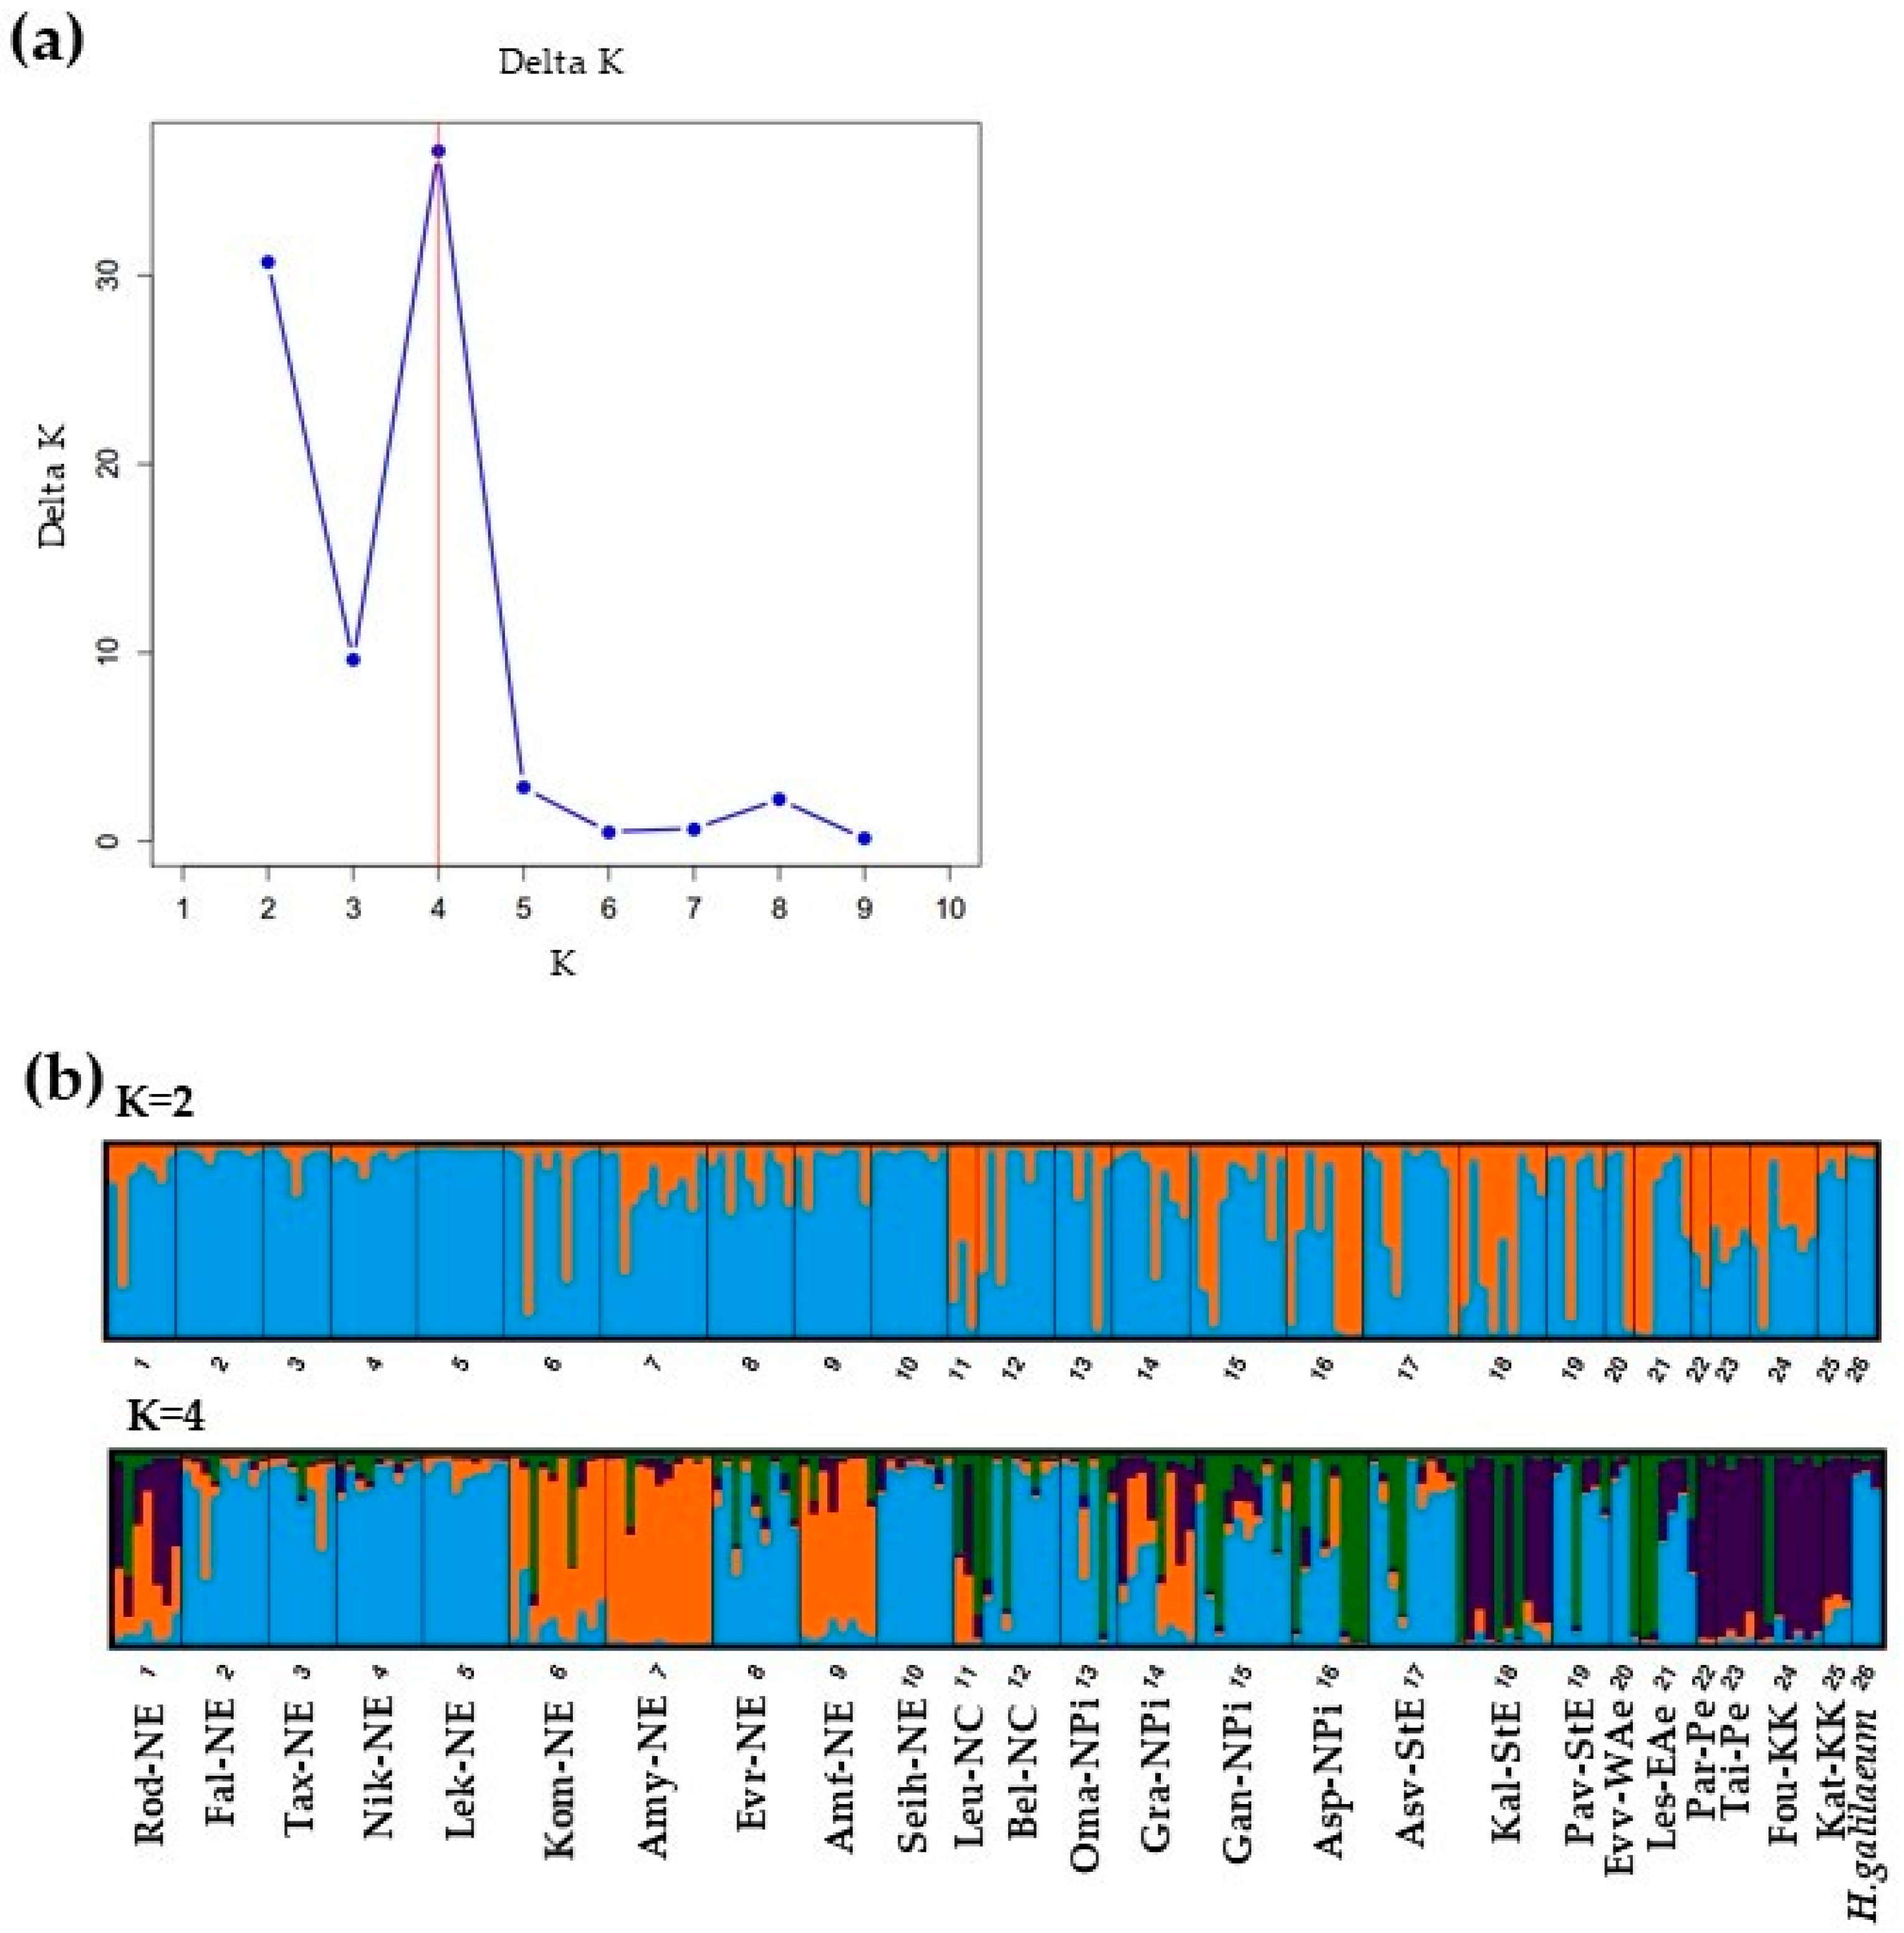
2.6. Results
3. Discussion
4. Implications for Conservation
5. Conclusions
Author Contributions
Funding
Institutional Review Board Statement
Data Availability Statement
Acknowledgments
Conflicts of Interest
References
- Duminil, J.; Di Michele, M. Plant species delimitation: A comparison of morphological and molecular markers. Plant Biosyst. 2009, 143, 528–542. [Google Scholar] [CrossRef]
- Delforge, P. Orchids of Europe, North Africa and the Middle East, 3rd ed.; A&C Black: London, UK, 2006. [Google Scholar]
- Kretzschmar, H.; Eccarius, W.; Dietrich, H. The Orchid Genera Anacamptis, Orchis and Neotinea. Phylogeny, Taxonomy, Morphology, Biology, Distribution, Ecology and Hybridisation; EchinoMedia Verlag: Bürgel, Germany, 2007. [Google Scholar]
- Andersson, E. On the identity of orchid populations: A morphometric study of the Dactylorhiza traunsteineri complex in eastern Sweden. Nord. J. Bot. 1994, 14, 269–275. [Google Scholar] [CrossRef]
- Dufrêne, M.; Gathoye, J.-L.; Tyteca, D. Biostatistical studies on western European Dactylorhiza (Orchidaceae)—D. maculata group. Plant Syst. Evol. 1991, 175, 55–72. [Google Scholar] [CrossRef]
- Tyteca, D.; Dufrêne, M. On the use of distances in the taxonomic study of critical plant groups—Case studies of Western European Orchidaceae. Ann. Bot. 1993, 71, 257–277. [Google Scholar] [CrossRef]
- Amich, F.; García-Barriuso, M.; Crespí, A.; Bernardos, S. Taxonomy, morphometric circumscription and karyology of the Mediterranean African representatives of Ophrys sect. Pseudophrys (Orchidaceae). Plant Biosyst. 2009, 143, 47–61. [Google Scholar] [CrossRef]
- Véla, E.; Rebbas, K.; Martin, R.; de Premorel, G.; Tison, J.-M. Waiting for integrative taxonomy: Morphospecies as an operational proxy for the radiative and reticulate genus Ophrys L. (Orchidaceae)? Eur. J. Environ. Scie. 2015, 5, 153–157. [Google Scholar] [CrossRef]
- Chase, M.W.; Cameron, K.M.; Barrett, R.L.; Freudenstein, J.V. DNA data and Orchidaceae systematics: A new phylogenetic classification. In Orchid Conservation; Dixon, K.W., Kell, S.P., Barrett, R.L., Crib, P.J., Eds.; Natural History Publications (Borneo): Kota Kinabalu, Malaysia, 2003; pp. 69–89. [Google Scholar]
- Freudenstein, J.V. Orchid phylogenetics and evolution: History, current status and prospects. Ann. Bot. 2024, mcae202. [Google Scholar] [CrossRef] [PubMed]
- Pérez-Escobar, O.A.; Bogarín, D.; Przelomska, N.A.S.; Ackerman, J.D.; Balbuena, J.A.; Bellot, S.; Bühlmann, R.P.; Cabrera, B.; Cano, J.A.; Charitonidou, M.; et al. The Origin and Speciation of Orchids. N. Phytol. 2024, 242, 700–716. [Google Scholar] [CrossRef]
- Bateman, R.M.; Pridgeon, A.M.; Chase, M.W. Phylogenetics of subtribe Orchidinae (Orchidoideae, Orchidaceae) based on nuclear ITS sequences. 2. Infrageneric relationships and reclassification to achieve monophyly of Orchis sensu stricto. Lindleyana 1997, 12, 113–141. [Google Scholar]
- Ennos, R.A.; French, G.C.; Hollingsworth, P.M. Conserving taxonomic complexity. Trends Ecol. Evol. 2005, 20, 164–168. [Google Scholar] [CrossRef]
- Hollingsworth, P.M.; Squirrell, J.; Richards, A.J.; Bateman, R.M.; Hollingsworth, M.L. Taxonomic Complexity, Conservation and Recurrent Origins of Self-Pollination in Epipactis (Orchidaceae). In Current Taxonomic Research on the British & European Flora; Bailey, J.P., Ellis, R.G., Eds.; Botanical Society of the British Isles: London, UK, 2006; pp. 27–44. [Google Scholar]
- Adhikari, B.; Wallace, L.E. Does the Platanthera dilatata (Orchidaceae) complex contain cryptic species or continuously variable populations? Plant Syst. Evol. 2014, 300, 1465–1476. [Google Scholar] [CrossRef]
- Li, Y.L.; Tong, Y.; Xing, F.W. DNA Barcoding Evaluation and Its Taxonomic Implications in the Recently Evolved Genus Oberonia Lindl. (Orchidaceae) in China. Front. Plant Sci. 2016, 7, 1791. [Google Scholar] [CrossRef] [PubMed]
- Gale, S.W.; Li, J.; Suddee, S.; Traiperm, P.; Craig, I.P.; Buruwate, T.; Crain, B.J.; McCormick, M.K.; Whigham, D.F.; Musthofa, A.; et al. Molecular phylogenetic analyses reveal multiple long-distance dispersal events and extensive cryptic speciation in Nervilia (Orchidaceae), an isolated basal Epidendroid genus. Front. Plant Sci. 2025, 15, 1495487. [Google Scholar] [CrossRef]
- Bateman, R.M.; Rudall, P.J.; Hawkins, J.A.; Sramkó, G. Himantoglossum hircinum (Lizard Orchid) reviewed in the light of new morphological and molecular observations. N. J. Bot. 2013, 3, 122–140. [Google Scholar] [CrossRef]
- Tsiftsis, S. Morphological variability of Himantoglossum s.s. (Orchidaceae) in Greece. Phytotaxa 2016, 245, 17–30. [Google Scholar] [CrossRef]
- Bateman, R.M.; Molnár, V.A.; Sramkó, G. In situ morphometric survey elucidates the evolutionary systematics of the Eurasian Himantoglossum clade (Orchidaceae: Orchidinae). PeerJ 2017, 5, e2893. [Google Scholar] [CrossRef] [PubMed]
- Sramkó, G.; Molnár, A.V.; Hawkins, J.A.; Bateman, R.M. Molecular phylogeny and evolutionary history of the Eurasiatic orchid genus Himantoglossum s.l. (Orchidaceae). Ann. Bot. 2014, 114, 1609–1626. [Google Scholar] [CrossRef]
- Bateman, R.M.; Hollingsworth, P.M.; Preston, J.; Yi-Bo, L.; Pridgeon, A.M.; Chase, M.W. Molecular phylogenetics and evolution of Orchidinae and selected Habenariinae (Orchidaceae). Bot. J. Linn. Soc. 2003, 142, 1–40. [Google Scholar] [CrossRef]
- Sundermann, H. Europäische und Mediterrane Orchideen; Kurt Schmersow: Hildesheim, Germany, 1975. [Google Scholar]
- Tutin, T.G.; Heywood, V.H.; Burges, N.A.; Moore, D.M.; Valentine, D.H.; Walters, S.M.; Webb, D.A. Flora Europaea, 5, Alismataceae to Orchidaceae; Cambridge University: Cambridge, UK, 1980. [Google Scholar]
- Baumann, H.; Künkele, S.; Lorenz, R. Orchideen Europas Mit Angrenzenden Gebieten; Eugen Ulmer: Stuttgart, Germany, 2006. [Google Scholar]
- Petrou, N.; Petrou, M.; Giannakoulias, M. Orchids of Greece; Koan Publishing House: Athens, Greece, 2011; 320p. [Google Scholar]
- Kreutz, C.A.J. Drei neue Orchideenarten aus der Südwesttürkei: Himantoglossum montis-tauri, Ophrys hygrophila und Ophrys labiosa. J. Eur. Orchid. 1997, 29, 653–698. [Google Scholar]
- Biel, B. Die Orchideenflora der Insel Lesvos (Griechenland). J. Eur. Orchid. 1998, 30, 251–443. [Google Scholar]
- Wielinga, A.; Wielinga, R. Op zoek naar Orchideeën op Lesbos. Eurorchis 2004, 16, 5–11. [Google Scholar]
- Vöth, W. Himantoglossum affine aus dem Peloponnes. Die Orchid. 1978, 29, 113–114. [Google Scholar]
- Alibertis, C.; Alibertis, A. The Orchids of Crete; Ch. & A. Alibertis: Iraklion, Greece, 1989. (In Greek) [Google Scholar]
- Devillers, P.; Baeten, F.; Dedroog, L.; Devillers-Terschuren, J.; Flausch, A. Orchids of Lesvos: Distributional and biogeographical notes. Les Nat. Belg. 2010, 91, 206–245. [Google Scholar]
- Rückbrodt, U.; Rückbrodt, D. Himantoglossum affine (Boiss.) Schltr. auf Kreta? Berichte Aus Arbeitskreisen Heim. Orchid. 1987, 4, 314–321. [Google Scholar]
- Tsiftsis, S.; Antonopoulos, Z. Atlas of the Greek Orchids; Mediterraneo Editions: Rethymno, Greece, 2017; Volume 1. [Google Scholar]
- Shifman, A. Himantoglossum galilaeum (Orchidaceae), a new Orchid in Northern Israel. J. Eur. Orch. 2008, 40, 727–748. [Google Scholar]
- Doyle, J.J.; Doyle, J.L. A Rapid DNA Isolation Procedure for Small Quantities of Fresh Leaf Tissue. Phytochem. Bull. 1987, 19, 11–15. [Google Scholar]
- Sreedar, R.V.; Venkatachalam, L.; Roohie, K.; Bhagyalakshimi, N. Molecular analysis of Vanilla planifolia cultivated in India using RAPD and ISSR markers. Orchid. Sci. Biotechnol. 2007, 1, 25–30. [Google Scholar]
- George, S.; Sharma, J.; Yadon, V.L. Genetic diversity of the endangered and narrow endemic Piperia yadonii (Orchidaceae) assessed with ISSR polymorphisms. Am. J. Bot. 2009, 96, 2022–2030. [Google Scholar] [CrossRef]
- Warghat, A.R.; Bajpai, P.K.; Srivastava, R.B.; Chaurasia, O.P.; Sood, H. Population genetic structure and conservation of small fragmented locations of Dactylorhiza hatagirea in Ladakh region of India. Sci. Hortic. 2013, 164, 448–454. [Google Scholar] [CrossRef]
- Luo, J.; Hou, B.W.; Niu, Z.T.; Liu, W.; Xue, Q.Y.; Ding, X.Y. Comparative Chloroplast Genomes of Photosynthetic Orchids: Insights into Evolution of the Orchidaceae and Development of Molecular Markers for Phylogenetic Applications. PLoS ONE 2014, 9, e99016. [Google Scholar] [CrossRef]
- Dong, W.-L.; Wang, R.-N.; Zhang, N.-Y.; Fan, W.-B.; Fang, M.-F.; Li, Z.-H. Molecular Evolution of Chloroplast Genomes of Orchid Species: Insights into Phylogenetic Relationship and Adaptive Evolution. Int. J. Mol. Sci. 2018, 19, 716. [Google Scholar] [CrossRef] [PubMed]
- Liu, H.; Ye, H.; Zhang, N.; Ma, J.; Wang, J.; Hu, G.; Li, M.; Zhao, P. Comparative Analyses of Chloroplast Genomes Provide Comprehensive Insights into the Adaptive Evolution of Paphiopedilum (Orchidaceae). Horticulturae 2022, 8, 391. [Google Scholar] [CrossRef]
- Liu, L.; Du, J.; Liu, Z.; Zuo, W.; Wang, Z.; Li, J.; Zeng, Y. Comparative and phylogenetic analyses of nine complete chloroplast genomes of Orchidaceae. Sci. Rep. 2023, 13, 21403. [Google Scholar] [CrossRef]
- Štorchová, H.; Olson, M. The architecture of the chloroplast psbA-trnH non-coding region in angiosperms. Plant Syst. Evol. 2007, 268, 235–256. [Google Scholar] [CrossRef]
- Kress, W.; Erickson, D. A two-locus global DNA barcode for land plants: The coding rbcL gene complements the non-coding trnH-psbA spacer region. PLoS ONE 2007, 2, e508. [Google Scholar] [CrossRef] [PubMed]
- Loera-Sánchez, M.; Studer, B.; Kölliker, R. DNA barcode trnH-psbA is a promising candidate for efficient identification of forage legumes and grasses. BMC Res. Notes 2020, 13, 35. [Google Scholar] [CrossRef]
- Yao, R.; Guo, R.; Liu, Y.; Kou, Z.; Shi, B. Identification and phylogenetic analysis of the genus Syringa based on chloroplast genomic DNA barcoding. PLoS ONE 2022, 17, e0271633. [Google Scholar] [CrossRef]
- Devey, D.S.; Bateman, R.M.; Fay, M.F.; Hawkins, J.A. Friends or relatives? Phylogenetics and species delimitation in the controversial European orchid genus Ophrys. Ann. Bot. 2008, 101, 385–402. [Google Scholar] [CrossRef] [PubMed]
- Raskoti, B.B.; Ale, R. DNA barcoding of medicinal orchids in Asia. Sci. Rep. 2021, 11, 23651. [Google Scholar] [CrossRef]
- Chen, Z.; Gao, L.; Wang, H.; Feng, S. Molecular Identification and Phylogenetic Analysis of Cymbidium Species (Orchidaceae) Based on the Potential DNA Barcodes matK, rbcL, psbA-trnH, and Internal Transcribed Spacer. Agronomy 2024, 14, 933. [Google Scholar] [CrossRef]
- Kress, W.J.; Wurdack, K.J.; Zimmer, E.A.; Weigt, L.A.; Janzen, D.H. Use of DNA barcodes to identify flowering plants. Proc. Natl. Acad. Sci. USA 2005, 102, 8369–8374. [Google Scholar] [CrossRef] [PubMed]
- Baldwin, B.G. Phylogenetic utility of the internal transcribed spacers of nuclear ribosomal DNA in plants: An example from the Compositae. Mol. Phyl. Evol. 1992, 1, 3–16. [Google Scholar] [CrossRef]
- Inda, L.A.; Pimentel, M.; Chase, M.W. Phylogenetics of tribe Orchideae (Orchidaceae: Orchidoideae) based on combined DNA matrices: Inferences regarding timing of diversification and evolution of pollination syndromes. Ann. Bot. 2012, 110, 71–90. [Google Scholar] [CrossRef] [PubMed]
- Cheng, L.; Lin, Z.; Xin, C.; Sun, H.; Li, X. Molecular identification and phylogenetic analysis of Papaver based on ITS2 barcoding. J. Forensic. Sci. 2022, 67, 712–719. [Google Scholar] [CrossRef]
- Xiang, X.G.; Hu, H.; Wang, W.; Jin, X.H. DNA barcoding of the recently evolved genus Holcoglossum (Orchidaceae: Aeridinae): A test of DNA barcode candidates. Mol. Ecol. Resour. 2011, 11, 1012–1021. [Google Scholar] [CrossRef]
- Xiang, X.G.; Schuiteman, A.; Li, D.Z.; Huang, W.C.; Chung, S.W.; Li, J.W.; Zhou, H.L.; Jin, W.T.; Lai, Y.J.; Li, Z.Y.; et al. Molecular systematics of Dendrobium (Orchidaceae, Dendrobieae) from mainland Asia based on plastid and nuclear sequences. Mol. Phylogenet. Evol. 2013, 69, 950–960. [Google Scholar] [CrossRef]
- Soliva, M.; Kocyan, A.; Widmer, A. Molecular phylogenetics of the sexually deceptive orchid genus Ophrys (Orchidaceae) based on nuclear and chloroplast DNA sequences. Mol. Phylogenet. Evol. 2001, 20, 78–88. [Google Scholar] [CrossRef] [PubMed]
- Ghorbani, A.; Gravendeel, B.; Selliah, S.; Zarre, S.; de Boer, H. DNA barcoding of tuberous Orchidoideae: A resource for identification of orchids used in Salep. Mol. Ecol. Res. 2017, 17, 342–352. [Google Scholar] [CrossRef]
- Madesis, P.; Ganopoulos, I.; Ralli, P.; Tsaftaris, A. Barcoding the major Mediterranean leguminous crops by combining universal chloroplast and nuclear DNA sequence targets. Genet. Mol. Res. 2012, 11, 2548–2558. [Google Scholar] [CrossRef]
- Hall, T. BioEdit: A user-friendly biological sequence alignment editor and analysis program for Windows 95/98/NT. Nucleic Acids Symp. Ser. 1999, 41, 95–98. [Google Scholar]
- Larkin, M.A.; Blackshields, G.; Brown, N.P.; Chenna, R.; McGettigan, P.A.; McWilliam, H.; Valentin, F.; Wallace, I.M.; Wilm, A.; Lopez, R.; et al. ClustalW and ClustalX version 2.0. Bioinformatics 2007, 23, 2947–2948. [Google Scholar] [CrossRef] [PubMed]
- Sang, T.; Crawford, D.J.; Stuessy, T.F. Chloroplast DNA Phylogeny, Reticulate Evolution, and Biogeography of Paeonia (Paeoniaceae). Am. J. Bot. 1997, 84, 1120–1136. [Google Scholar] [CrossRef]
- Tate, J.A.; Simpson, B.B. Paraphyly of Tarasa philippi (Malvaceae) and diverse origins of the polyploid species. Syst. Bot. 2003, 28, 723–737. [Google Scholar]
- Ford, C.S.; Ayres, K.L.; Toomey, N.; Haider, N.; van Alphen Stahl, J.; Kelly, L.J.; Winstrom, N.; Hollingsworth, P.M.; Duff, R.J.; Hoot, S.B.; et al. Selection of candidate coding DNA barcoding regions for use on land plants. Bot. J. Linn. Soc. 2009, 159, 1–11. [Google Scholar] [CrossRef]
- Chen, S.; Yao, H.; Han, J.; Liu, C.; Song, J.; Shi, L.; Zhu, Y.; Ma, X.; Gao, T.; Pang, X.; et al. Validation of the ITS2 Region as a Novel DNA Barcode for Identifying Medicinal Plant Species. PLoS ONE 2010, 5, e8613. [Google Scholar] [CrossRef] [PubMed]
- Schneider, C.A.; Rasband, W.S.; Eliceiri, K.W. NIH Image to ImageJ: 25 years of image analysis. Nat. Methods 2012, 9, 671–675. [Google Scholar] [CrossRef]
- Schaffer, H.E.; Sederoff, R.R. Improved estimation of DNA fragment lengths from agarose gels. Anal. Biochem. 1981, 115, 113–122. [Google Scholar] [CrossRef]
- Culley, T.M. Population Genetic Analysis of ISSR Data. 2005. Available online: https://scholar.google.com/scholar?hl=el&as_sdt=0%2C5&q=Culley+T.M.+Population+Genetic+Analysis+of+ISSR+Data.&btnG= (accessed on 5 April 2025).
- Nei, M. Analysis of gene diversity in subdivided populations. Proc. Natl. Acad. Sci. USA 1973, 70, 3321–3323. [Google Scholar] [CrossRef]
- Nei, M. Estimation of average heterozygosity and genetic distance from a small number of individuals. Genetics 1978, 89, 583–590. [Google Scholar] [CrossRef]
- Yeh, F.C.; Yang, R.; Boyle, T. POPGENE, the User-Friendly Shareware for Population Genetic Analysis. Molecular Biology and Biotechnology Center. 1997. Available online: http://www.ualberta.ca/~fyeh/ (accessed on 13 March 2025).
- Peakall, R.; Smouse, P.E. GenAlEx 6.5: Genetic analysis in Excel. Population genetic software for teaching and research-an update. Bioinformatics 2012, 28, 2537–2539. [Google Scholar] [CrossRef]
- Excoffier, L.; Smouse, P.E.; Quattro, J.M. Analysis of molecular variance inferred from metric distances among DNA haplotypes: Application to human mitochondrial DNA restriction data. Genetics 1992, 131, 479–491. [Google Scholar] [CrossRef] [PubMed]
- Orloci, L. Multivariate Analysis in Vegetation Research; Dr. W. Junk B.V.: The Hague, The Netherlands, 1978. [Google Scholar]
- Pritchard, J.K.; Stephens, M.; Donnelly, P. Inference of population structure using multilocus genotype data. Genetics 2000, 155, 945–959. [Google Scholar] [CrossRef] [PubMed]
- Li, Y.L.; Liu, J.X. StructureSelector: A web based software to select and visualize the optimal number of clusters using multiple methods. Mol. Ecol. Resour. 2018, 18, 176–177. [Google Scholar] [CrossRef]
- Evanno, G.; Regnaut, S.; Goudet, J. Detecting the number of clusters of individuals using the software STRUCTURE: A simulation study. Mol. Ecol. 2005, 14, 2611–2620. [Google Scholar] [CrossRef]
- Kopelman, N.M.; Mayzel, J.; Jakobsson, M.; Rosenberg, N.A.; Mayrose, I. Clumpak: A program for identifying clustering modes and packaging population structure inferences across K. Mol. Ecol. Resour. 2015, 15, 1179–1191. [Google Scholar] [CrossRef] [PubMed]
- Hamrick, J.L.; Godt, J.W. Effects of life history traits on genetic diversity in plant species. Philos. Trans. R. Soc. London Ser. B Biol. Sci. 1996, 351, 1291–1298. [Google Scholar]
- Hamrick, J.L.; Godt, M.J.W. Allozyme diversity in plant species. In Plant Population Genetics, Breeding, and Genetic Resources; Brown, A.H.D., Clegg, M.T., Kahler, A.L., Weir, B.S., Eds.; Sinnauer Associates Inc.: Sunderland, MA, USA, 1990; pp. 43–63. [Google Scholar]
- Pillon, Y.; Fay, M.; Shipunov, A.; Chase, M. Species diversity versus phylogenetic diversity: A practical study in the taxonomically difficult genus Dactylorhiza (Orchidaceae). Biol. Conserv. 2006, 129, 4–13. [Google Scholar] [CrossRef]
- Pfeifer, M.; Jetschke, G. Influence of geographical isolation on genetic diversity of Himantoglossum hircinum (Orchidaceae). Folia Geobot. 2006, 41, 3–20. [Google Scholar] [CrossRef]
- Pfeifer, M.; Schatz, B.; Xavier Picó, F.; Passalacqua, N.G.; Fay, M.F.; Carey, P.D.; Jeltsch, F. Phylogeography and genetic structure of the orchid Himantoglossum hircinum (L.) Spreng. across its European central-marginal gradient. J. Biogeogr. 2009, 36, 2353–2365. [Google Scholar] [CrossRef]
- Vucetich, J.A.; Waite, T.A. Spatial patterns of demography and genetic processes across the species’ range: Null hypotheses for landscape conservation genetics. Conserv. Genet. 2003, 4, 639–645. [Google Scholar] [CrossRef]
- Hedrén, M.; Nordström Olofsson, S. High levels of genetic diversity in marginal populations of the marsh orchid Dactylorhiza majalis subsp. majalis. Nord. J. Bot. 2018, 36, e01747. [Google Scholar] [CrossRef]
- Gijbels, P.; De Hert, K.; Jacquemyn, H.; Honnay, O. Reduced fecundity and genetic diversity in small populations of rewarding versus deceptive orchid species: A meta-analysis. Plant Ecol. Evol. 2015, 148, 153–159. [Google Scholar] [CrossRef]
- Cozzolino, S.; Widmer, A. Orchid diversity: An evolutionary consequence of deception? Trends Ecol. Evol. 2005, 20, 487–494. [Google Scholar] [CrossRef]
- Forrest, A.D.; Hollingsworth, M.L.; Hollingsworth, P.M.; Sydes, C.; Bateman, R.M. Population genetic structure in European populations of Spiranthes romanzoffiana set in the context of other genetic studies on orchids. Heredity 2004, 92, 218–227. [Google Scholar] [CrossRef]
- Tremblay, R.L.; Ackerman, J. The genetic structure of orchid populations and its evolutionary importance. Lankesteriana 2003, 7, 87–92. [Google Scholar]
- Pillon, Y.; Chase, M.W. Taxonomic exaggeration and its effects on orchid conservation. Conserv. Biol. 2007, 21, 263–265. [Google Scholar] [CrossRef]
- Janes, J.K.; Steane, D.A.; Vaillancourt, R.E. What does population structure analysis reveal about the Pterostylis longifolia complex (Orchidaceae)? Ecol. Evol. 2012, 2, 2631–2644. [Google Scholar] [CrossRef]
- Hedrén, M.; Nordström, S.; Persson, H.; Pedersen, H.Æ.; Hansson, S. Patterns of polyploidy evolution in Greek Dactylorhiza (Orchidaceae) as revealed by allozymes, AFLPs and plastid DNA data. Am. J. Bot. 2007, 94, 1205–1218. [Google Scholar] [CrossRef]
- Anthoons, B.; Veltman, M.A.; Tsiftsis, S.; Gravendeel, B.; Drouzas, A.D.; de Boer, H.J.; Madesis, P. Exploring the Potential of Angiosperms353 Markers for Species Identification of Eastern Mediterranean Orchids. Mol. Phyl. Evol. 2005, 209, 108360. [Google Scholar] [CrossRef]
- Delforge, P. Contribution taxonomique et nomenclaturale au genere Himantoglossum (Orchidaceae). Nat. Belg. 1999, 80, 387–408. [Google Scholar]
- Ilves, A.; Metsare, M.; Seliškar, A.; García, M.B.; Vassiliou, L.; Pierce, S.; Tatarenko, I.; Tali, K.; Kull, T. Genetic diversity patterns of the orchid Anacamptis pyramidalis at the edges of its distribution range. Plant Syst. Evol. 2016, 302, 1227–1238. [Google Scholar] [CrossRef]
- Tian, H.Z.; Han, L.X.; Zhang, J.L.; Li, X.L.; Kawahara, T.; Yukawa, T.; Lopez-Pujol, J.; Kumar, P.; Chung, M.G.; Chung, M.Y. Genetic diversity in the endangered terrestrial orchid Cypripedium japonicum in East Asia: Insights into population history and implications for conservation. Sci. Rep. 2018, 8, 6467. [Google Scholar] [CrossRef] [PubMed]


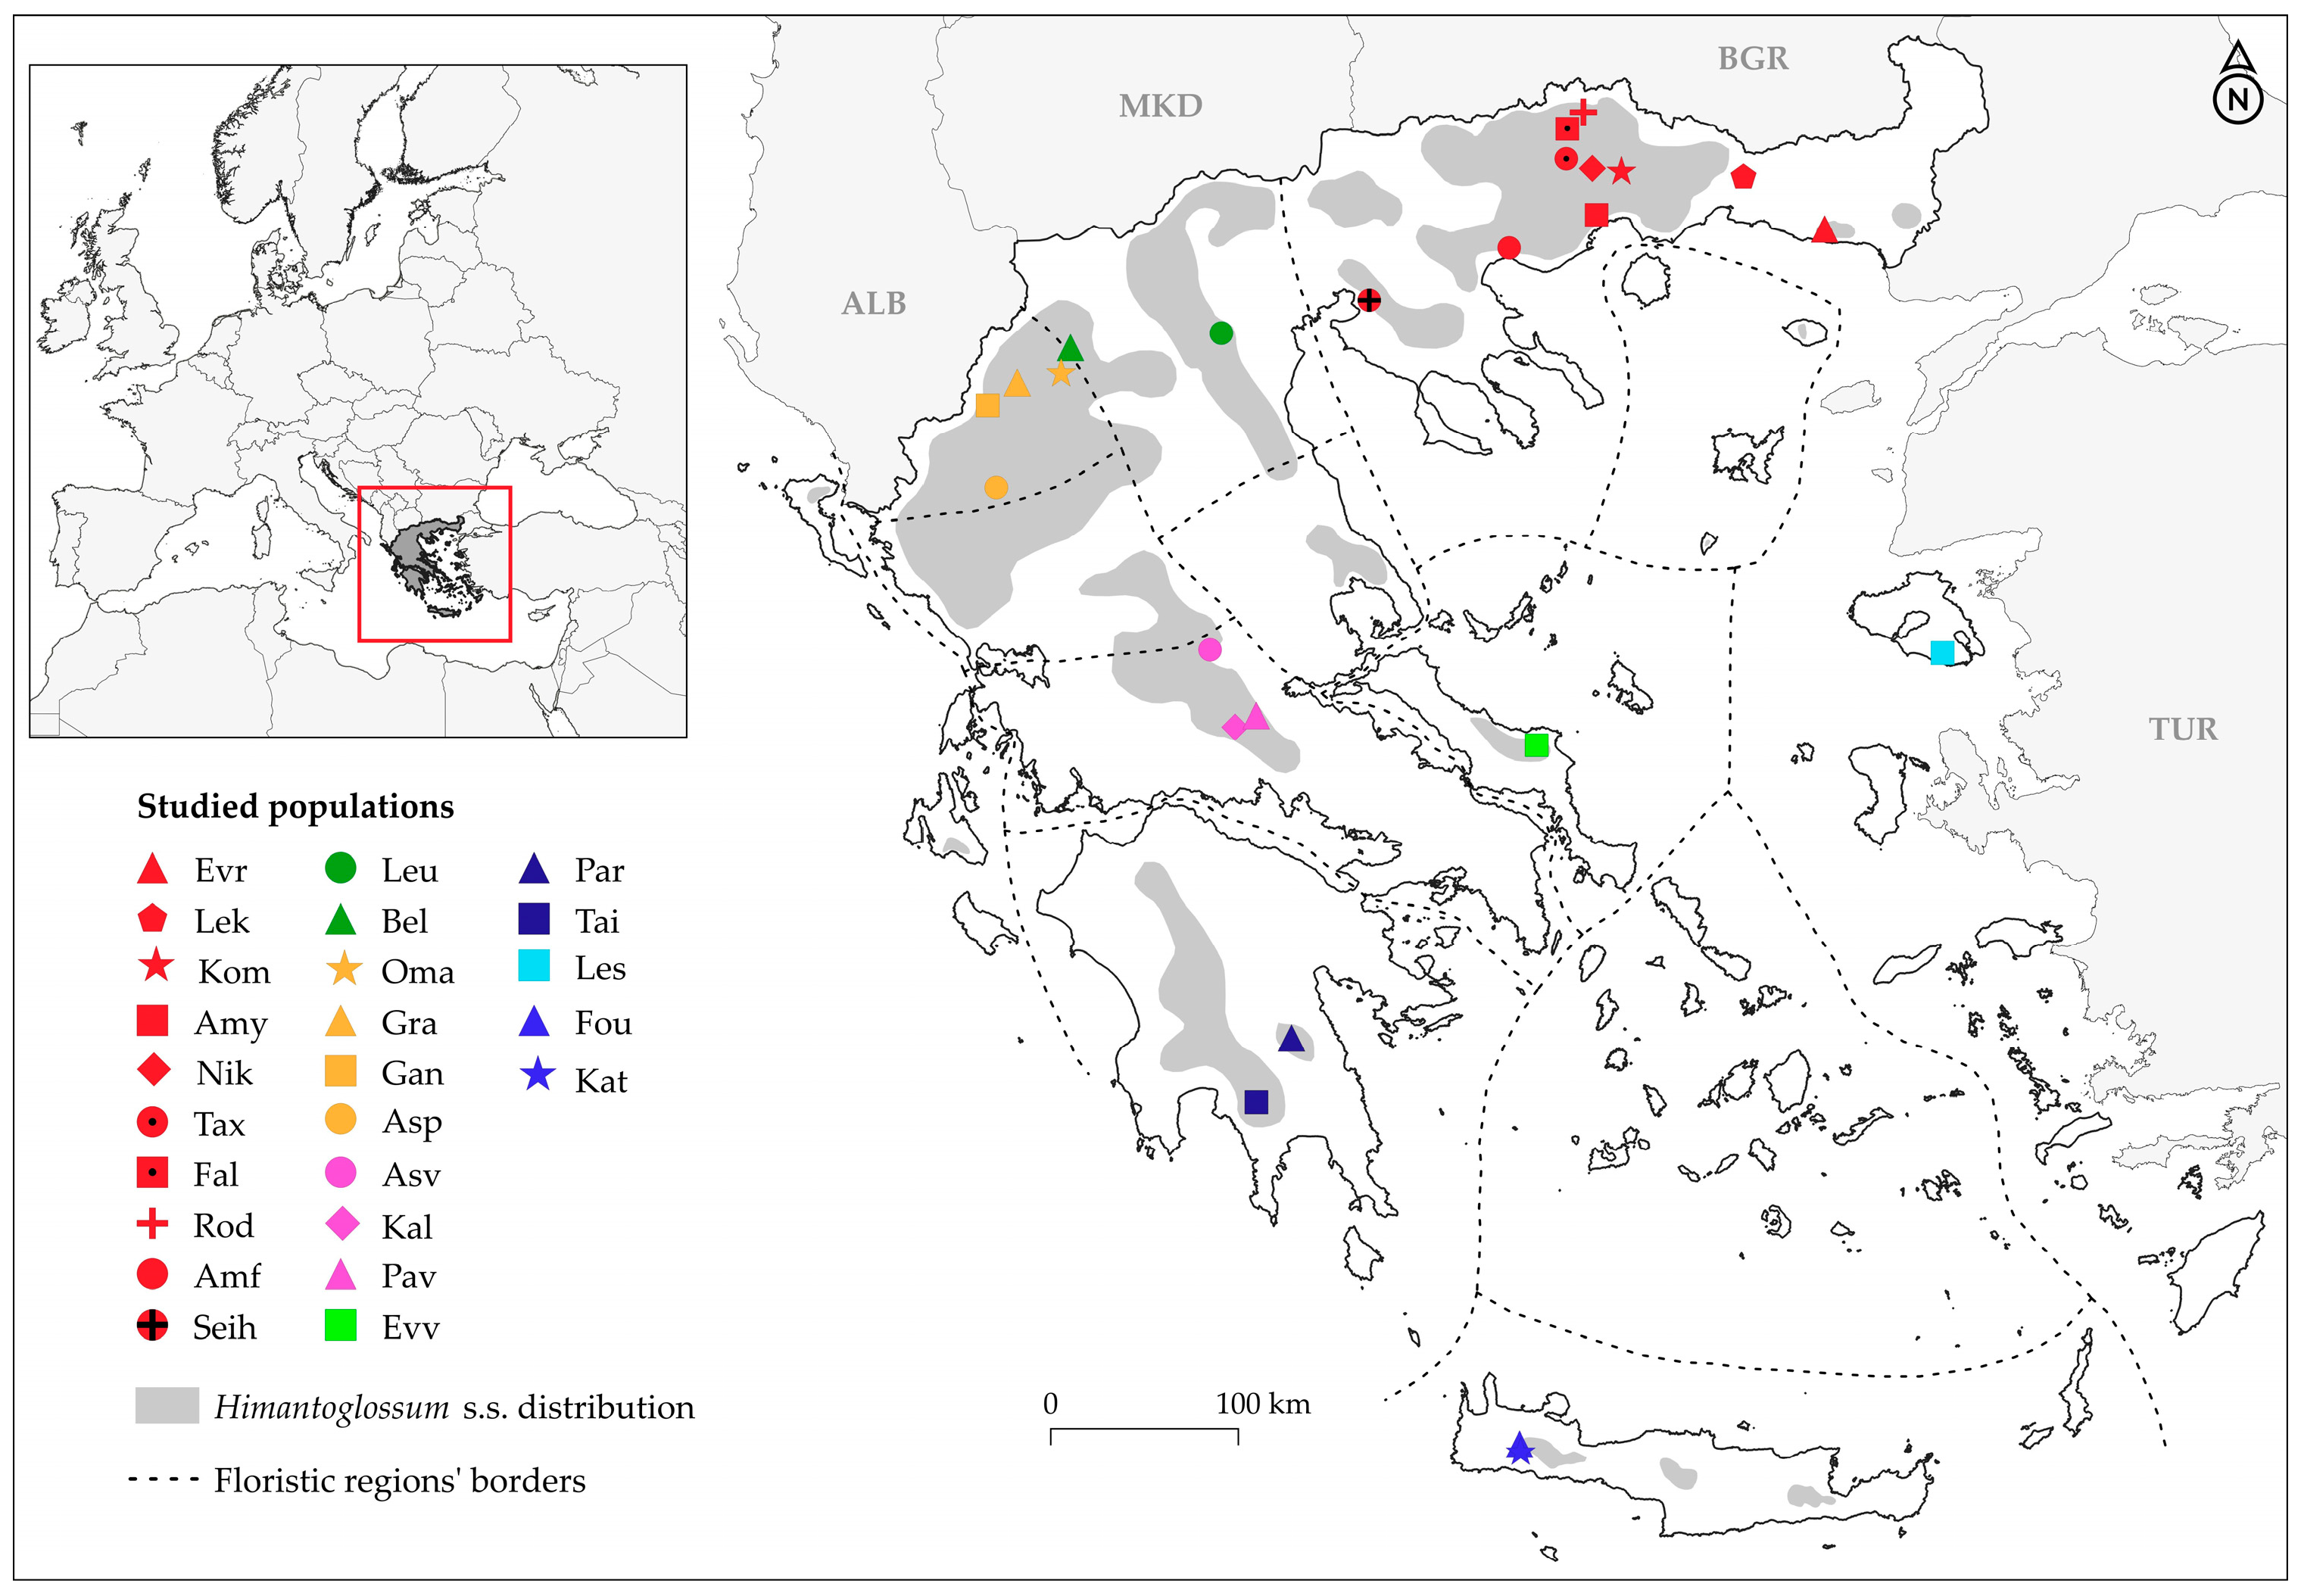
| Population | Population Code | Floristic Region of Greece | Latitude N | Longitude E | Elevation (m) | No of Individuals (Ns) | |
|---|---|---|---|---|---|---|---|
| 1 | Mt. Rodopi (Drama) | Rod | NE | 41°25′ | 24°17′ | 1035 | 7 |
| 2 | Mt. Falakron (Drama) | Fal | NE | 41°20′ | 24°11′ | 470 | 9 |
| 3 | Taxiarches (Drama) | Tax | NE | 41°12′ | 24°11′ | 380 | 7 |
| 4 | Nikiforos (Drama) | Nik | NE | 41°10′ | 24°20′ | 255 | 9 |
| 5 | Mt. Lekani (Kavala) | Lek | NE | 41°09′ | 24°30′ | 992 | 9 |
| 6 | Iasmos (Rodopi) | Kom | NE | 41°08′ | 25°12′ | 60 | 10 |
| 7 | Amygdaleonas (Kavala) | Amy | NE | 40°58′ | 24°21′ | 120 | 9 |
| 8 | Dikella (Evros) | Evr | NE | 40°54′ | 25°41′ | 230 | 11 |
| 9 | Amfipoli (Serres) | Amf | NE | 40°49′ | 23°51′ | 86 | 8 |
| 10 | Seih Sou (Thessaloniki) | Seih | NE | 40°35′ | 23°02′ | 290 | 8 |
| 11 | Leucopetra (Imathia) | Leu | NC | 40°26′ | 22°10′ | 554 | 3 |
| 12 | Belos (Kastoria) | Bel | NC | 40°23′ | 21°18′ | 620 | 8 |
| 13 | Omali (Kozani) | Oma | NPi | 40°16′ | 21°14′ | 810 | 6 |
| 14 | Mt. Grammos (Kastoria) | Gra | NPi | 40°13′ | 20°59′ | 788 | 8 |
| 15 | Ganadio (Ioannina) | Gan | NPi | 40°07′ | 20°49′ | 890 | 10 |
| 16 | Aspraggeloi (Ioannina) | Asp | NPi | 39°45′ | 20°52′ | 715 | 8 |
| 17 | Asvesti (Fthiotis) | Asv | StE | 39°02′ | 22°06′ | 730 | 9 |
| 18 | Kaloskopi (Fthiotis) | Kal | StE | 38°41′ | 22°18′ | 1200 | 3 |
| 19 | Nea Pavliani (Fthiotis) | Pav | StE | 38°44′ | 22°22′ | 905 | 6 |
| 20 | Evia Island (Evia) | Evv | WAe | 38°36′ | 24°00′ | 850 | 6 |
| 21 | Lesvos Island (Lesvos) | Les | Eae | 39°01′ | 26°22′ | 650 | 10 |
| 22 | Mt. Parnonas (Arcadia) | Par | Pe | 37°15′ | 22°35′ | 1420 | 2 |
| 23 | Mt. Taigetos (Lakonia) | Tai | Pe | 36°57′ | 22°22′ | 1119 | 4 |
| 24 | Omalos (Chania) | Fou | ΚΚ | 35°21′ | 23°54′ | 1110 | 7 |
| 25 | Katafygio (Samaria) | Kat | ΚΚ | 35°19′ | 23°55′ | 1211 | 3 |
| 26 | H. galilaeum | Gal | - | 32°59′ | 35°23′ | 3 | |
| Total | 183 |
| Primer | Sequence | Range of Fragments | Number of Bands |
|---|---|---|---|
| UBC-810 | (CA)8T | 500–2400 | 24 |
| UBC-811 | (GA)8 C | 450–2000 | 17 |
| UBC-815 | (GA)8YT | 500–1750 | 16 |
| UBC-834 | (AG)8 YT | 310–2800 | 23 |
| UBC-847 | (CA)8 RC | 350–2000 | 19 |
| Total | 99 |
| DNA Region | Primers | Sequence | Reference |
|---|---|---|---|
| psbA-trnH | psbA3_f | GTTATGCATGAACGTAATGCTC | [62] |
| trnHf_05 | CGCGCATGGTGGATTCACAATCC | [63] | |
| accD | accD-F | GGR GCA CGT ATG CAA GAA GG | [64] |
| accD-R | TCT TTT ACC CGC AAA TGC AAT | [64] | |
| ITS2 | ITS2-S2F | ATGCGATACTTGGTGTGAAT | [65] |
| ITS2-S3R | GACGCTTCTCCAGACTACAAT | [65] |
| Population Code-Floristic Region | No of Individuals (Ns) | Ne | P % | He | I | PB | P % | He | I | Gst | |
|---|---|---|---|---|---|---|---|---|---|---|---|
| 1 | Rod-NE | 7 | 1.271 | 43.4 | 0.158 | 0.235 | 0 | 93.9 | 0.223 | 0.357 | 0.334 |
| 2 | Fal-NE | 9 | 1.248 | 39.4 | 0.141 | 0.210 | 0 | ||||
| 3 | Tax-NE | 7 | 1.294 | 45.5 | 0.169 | 0.250 | 0 | ||||
| 4 | Nik-NE | 9 | 1.273 | 50.5 | 0.165 | 0.251 | 0 | ||||
| 5 | Lek-NE | 9 | 1.184 | 29.3 | 0.110 | 0.163 | 0 | ||||
| 6 | Kom-NE | 10 | 1.281 | 59.6 | 0.171 | 0.266 | 0 | ||||
| 7 | Amy-NE | 9 | 1.268 | 48.5 | 0.162 | 0.246 | 0 | ||||
| 8 | Evr-NE | 11 | 1.233 | 44.4 | 0.143 | 0.218 | 0 | ||||
| 9 | Amf-NE | 8 | 1.217 | 39.4 | 0.128 | 0.194 | 0 | ||||
| 10 | Seih-NE | 8 | 1.240 | 35.4 | 0.138 | 0.202 | 0 | ||||
| 11 | Leu-NC | 3 | 1.292 | 48.5 | 0.176 | 0.264 | 0 | 75.8 | 0.202 | 0.319 | 0.202 |
| 12 | Bel-NC | 8 | 1.279 | 55.6 | 0.165 | 0.254 | 0 | ||||
| 13 | Oma-NPi | 6 | 1.377 | 60.6 | 0.218 | 0.325 | 0 | 97.9 | 0.289 | 0.446 | 0.175 |
| 14 | Gra-NPi | 8 | 1.338 | 51.5 | 0.194 | 0.287 | 0 | ||||
| 15 | Gan-NPi | 10 | 1.407 | 74.8 | 0.246 | 0.374 | 1 | ||||
| 16 | Asp-NPi | 8 | 1.485 | 83.8 | 0.289 | 0.435 | 0 | ||||
| 17 | Asv-StE | 9 | 1.360 | 69.7 | 0.216 | 0.331 | 0 | 87.9 | 0.259 | 0.397 | 0.188 |
| 18 | Kal-StE | 3 | 1.400 | 57.6 | 0.228 | 0.334 | 0 | ||||
| 19 | Pav-StE | 6 | 1.324 | 57.6 | 0.190 | 0.288 | 0 | ||||
| 20 | Evv-WAe | 6 | 1.467 | 69.7 | 0.265 | 0.390 | 0 | 69.7 | 0.264 | 0.390 | - |
| 21 | Les-EAe | 10 | 1.373 | 75.8 | 0.227 | 0.350 | 1 | 75.8 | 0.227 | 0.350 | - |
| 22 | Par-Pe | 2 | 1.086 | 12.1 | 0.050 | 0.073 | 0 | 49.5 | 0.185 | 0.274 | 0.524 |
| 23 | Tai-Pe | 4 | 1.234 | 28.3 | 0.125 | 0.178 | 0 | ||||
| 24 | Fou-KK | 7 | 1.364 | 64.7 | 0.216 | 0.327 | 0 | 70.7 | 0.232 | 0.351 | 0.366 |
| 25 | Kat-KK | 3 | 1.087 | 14.1 | 0.052 | 0.078 | 0 | ||||
| 26 | Gal | - | 1.071 | 9.1 | 0.039 | 0.056 | 0 | - | - | - | - |
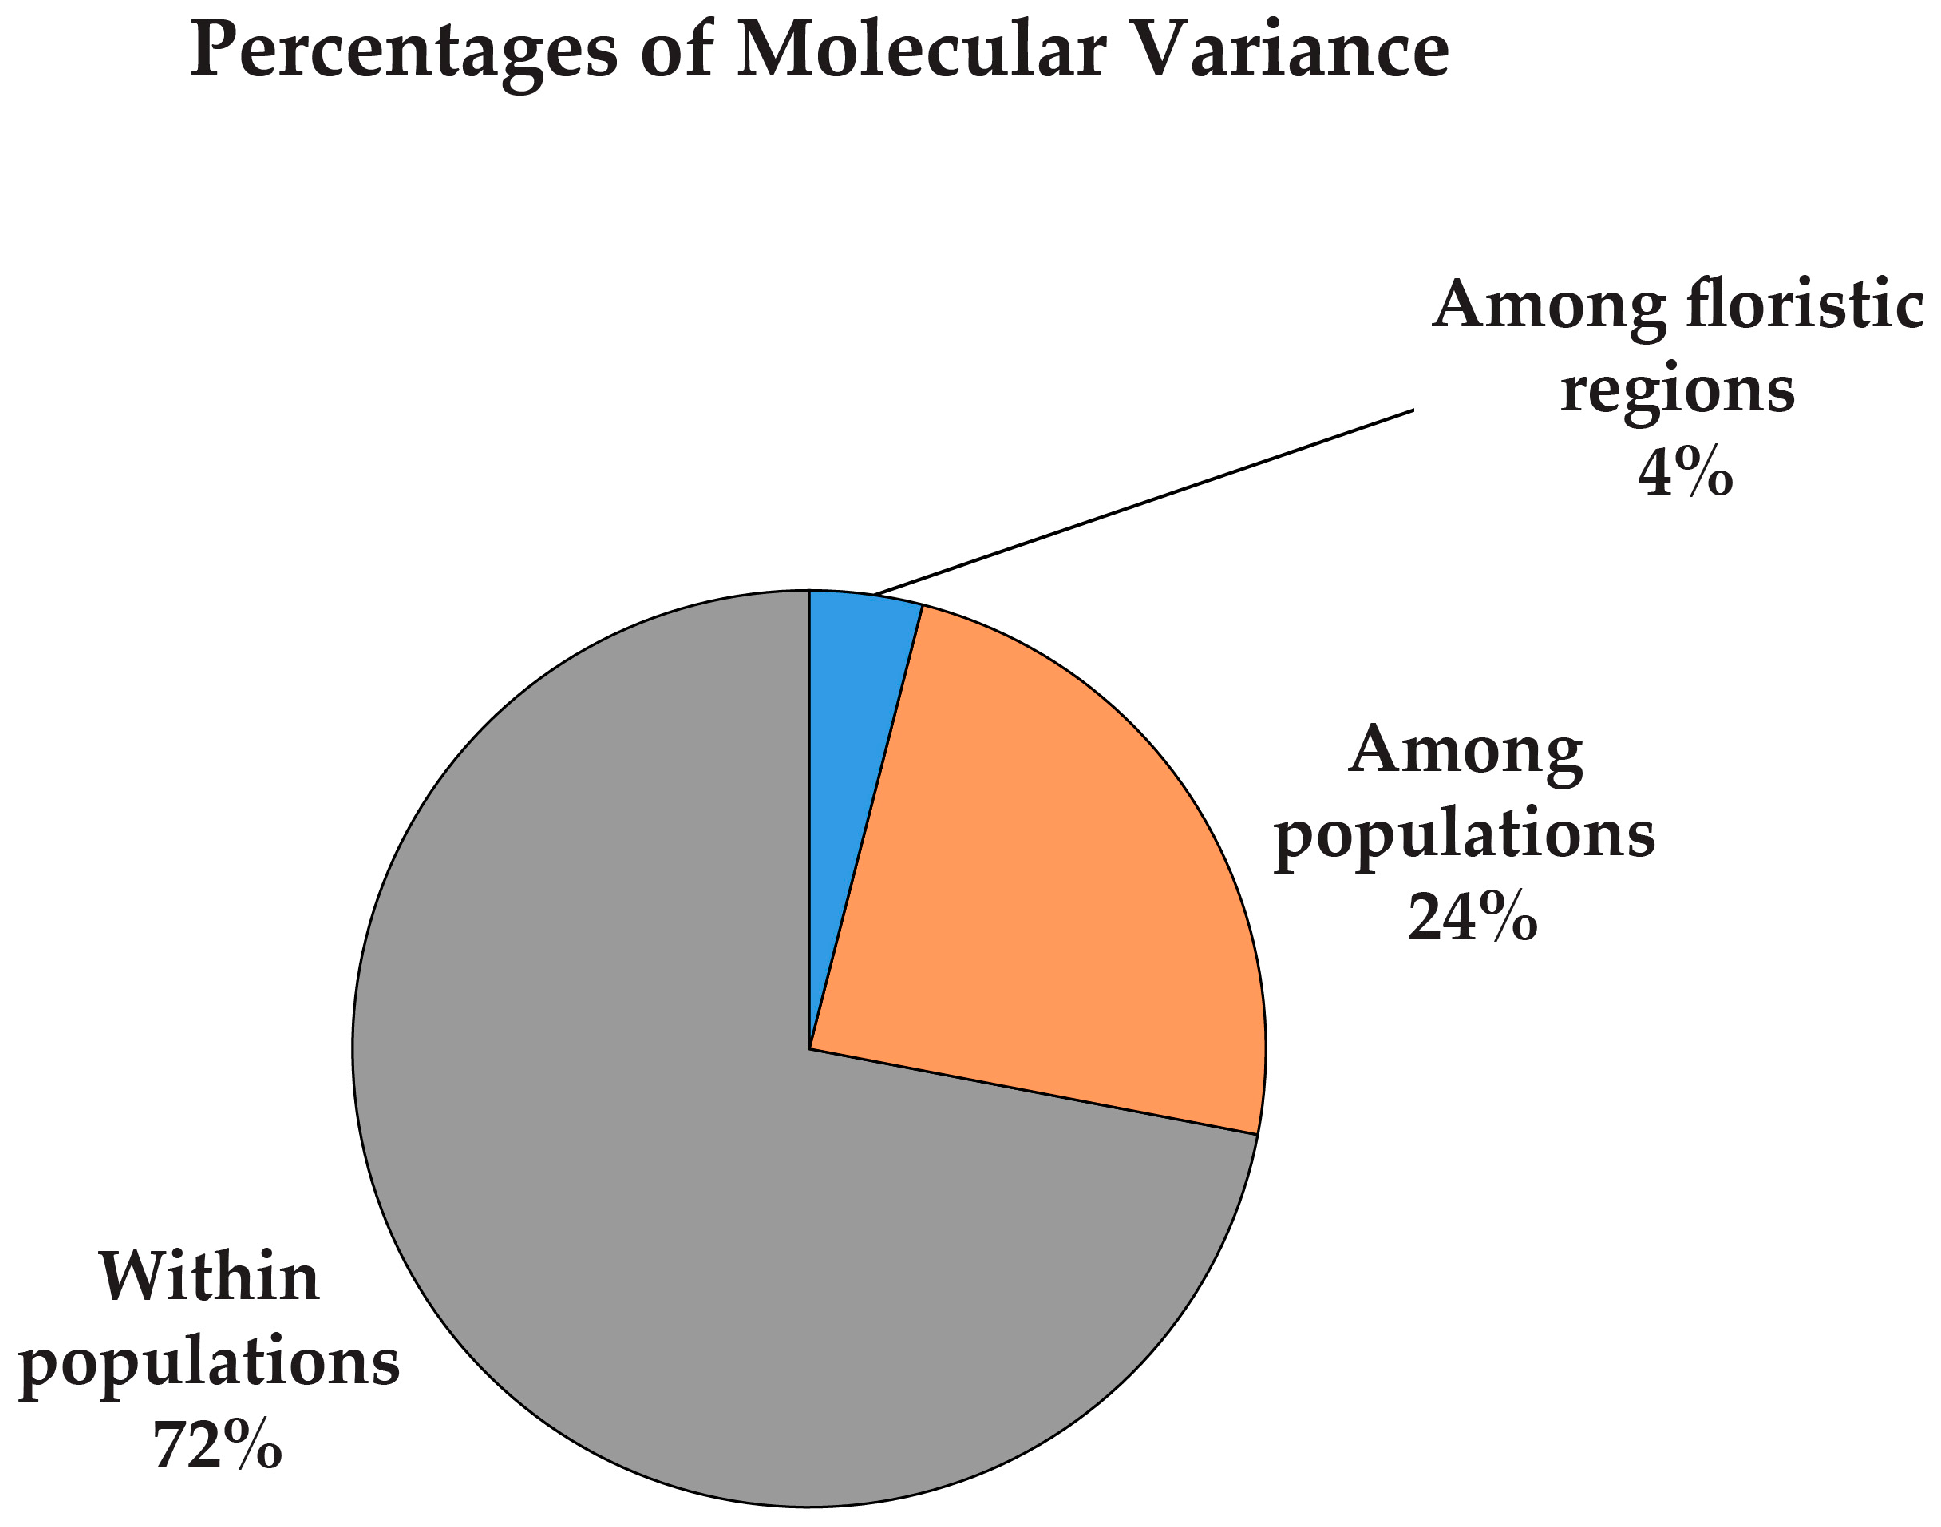
| Among the floristic regions | 0.159 | ||||||||||
| Overall | 1.287 | 99.0 | 0.269 | 0.422 | - | 99.0 | 0.269 | 0.422 | 0.398 |
| Taxon | N | Ne | He | I | P | Ht | Hs | Gst |
|---|---|---|---|---|---|---|---|---|
| H. jankae | 170 | 1.424 | 0.265 | 0.416 | 99.0 | 0.275 | 0.177 | 0.355 |
| H. samariense | 10 | 1.389 | 0.232 | 0.351 | 70.7 | 0.211 | 0.134 | 0.366 |
| Between the two taxa | 0.033 | |||||||
| Himantoglossum s.s. in Greece | 180 | 1.432 | 0.269 | 0.421 | 99.0 | 0.279 | 0.174 | 0.398 |
| psbA-trnH | ITS2 | ||||||
|---|---|---|---|---|---|---|---|
| Base Position | 244–255 | 603 | 29 | 104 | 204 | 207 | 247 |
| Sample | |||||||
| Rod7-NE | - - - - - - - - - - - | A | C/T | C | C | A | G/T |
| Fal1-NE | - - - - - - - - - - - | G | C | C/T | C | A/G | G |
| Lek13-NE | - - - - - - - - - - - | G | C/T | C/T | C | A | G |
| Evr3-NE | - - - - - - - - - - - | G | C/T | C/T | C | A/G | G/T |
| Amf4-NE | - - - - - - - - - - - | G | C | C/T | C | A/G | G |
| Seih1-NE | - - - - - - - - - - - | G | C | C/T | C | A/G | G |
| Bel6-NC | T A A G A T A A G T A | A | C/T | C/T | C | A/G | G |
| Gra14-NPi | - - - - - - - - - - - | A | C/T | C/T | C | A/G | G |
| Asp3-NPi | - - - - - - - - - - - | A | C/T | C/T | C | A/G | G/T |
| Asv9-StE | - - - - - - - - - - - | A | C | C/T | C | A/G | G |
| Pav1-StE | - - - - - - - - - - - | G | C | C/T | C | A/G | G |
| Evv9-WAe | - - - - - - - - - - - | A | C/T | C | C | A | G |
| Les15-EAe | - - - - - - - - - - - | A | C | T | C | G | G |
| Par1-Pe | - - - - - - - - - - - | A | C | C/T | C | A/G | G |
| Par2-Pe | - - - - - - - - - - - | A | C | T | C | A/G | G |
| Tai2-Pe | - - - - - - - - - - - | A | C | C/T | C | A/G | G |
| Fou1-KK | - - - - - - - - - - - | A | C | C/T | G/C | A/G | G |
| Fou2-KK | - - - - - - - - - - - | A | C | C/T | G/C | A/G | G |
| Fou5-KK | - - - - - - - - - - - | A | C | T | C | G | G |
| Fou7-KK | - - - - - - - - - - - | A | C | T | C | G | G |
| Kat1-KK | - - - - - - - - - - - | A | - | - | - | - | - |
| Kat3-KK | - - - - - - - - - - - | A | C | C/T | C | A/G | G |
| gal2 | - - - - - - - - - - - | A | - | - | - | - | - |
Disclaimer/Publisher’s Note: The statements, opinions and data contained in all publications are solely those of the individual author(s) and contributor(s) and not of MDPI and/or the editor(s). MDPI and/or the editor(s) disclaim responsibility for any injury to people or property resulting from any ideas, methods, instructions or products referred to in the content. |
© 2025 by the authors. Licensee MDPI, Basel, Switzerland. This article is an open access article distributed under the terms and conditions of the Creative Commons Attribution (CC BY) license (https://creativecommons.org/licenses/by/4.0/).
Share and Cite
Tsiftsis, S.; Charitonidou, M.; Madesis, P.; Drouzas, A.D. Genetic Variation and Differentiation of Himantoglossum s.s. in Greece. Diversity 2025, 17, 329. https://doi.org/10.3390/d17050329
Tsiftsis S, Charitonidou M, Madesis P, Drouzas AD. Genetic Variation and Differentiation of Himantoglossum s.s. in Greece. Diversity. 2025; 17(5):329. https://doi.org/10.3390/d17050329
Chicago/Turabian StyleTsiftsis, Spyros, Martha Charitonidou, Panagiotis Madesis, and Andreas D. Drouzas. 2025. "Genetic Variation and Differentiation of Himantoglossum s.s. in Greece" Diversity 17, no. 5: 329. https://doi.org/10.3390/d17050329
APA StyleTsiftsis, S., Charitonidou, M., Madesis, P., & Drouzas, A. D. (2025). Genetic Variation and Differentiation of Himantoglossum s.s. in Greece. Diversity, 17(5), 329. https://doi.org/10.3390/d17050329