Article

Multimarker Analysis Reveals Ecological Islands in Hybrid Complexes: The Case of Quercus castanea × Q. crassipes Complex (Fagaceae) in Central Mexico

by
Leticia Valencia-Cuevas
1,
Fidel Ocampo-Bautista
2,
Laura Alvarez
3,
Silvia Marquina-Bahena
3,
Oscar Ángel De Luna-Bonilla
4 and
Efraín Tovar-Sánchez
5,*
1
Escuela de Estudios Superiores del Jicarero, Universidad Autónoma del Estado de Morelos, Carretera Galeana-Tequesquitengo s/n, Comunidad El Jicarero, Jojutla 62915, Mexico
2
Facultad de Ciencias Biológicas, Universidad Autónoma del Estado de Morelos, Av. Universidad 1001, Col. Chamilpa, Cuernavaca 62210, Mexico
3
Centro de Investigaciones Químicas—IICBA, Universidad Autónoma del Estado de Morelos, Av. Universidad 1001, Col. Chamilpa, Cuernavaca 62210, Mexico
4
Instituto de Investigaciones en Ecosistemas y Sustentabilidad, Universidad Nacional Autónoma de México, Morelia 58190, Mexico
5
Centro de Investigación en Biodiversidad y Conservación, Universidad Autónoma del Estado de Morelos, Av. Universidad 1001, Col. Chamilpa, Cuernavaca 62210, Mexico
*
Author to whom correspondence should be addressed.
Diversity 2025, 17(4), 264; https://doi.org/10.3390/d17040264
Submission received: 10 March 2025 / Revised: 1 April 2025 / Accepted: 4 April 2025 / Published: 8 April 2025

Abstract

:
Hybridization is frequent in oaks and may drive various evolutionary and ecological effects on involved plant populations and their associated species. Quercus castanea is a species of Mexican red oak that has served as a valuable model for examining the effects of hybridization events. We used a multimarker approach to characterize the morphological expression patterns and chemical production in parental and hybrid genotypes of the Q. castanea × Q. crassipes complex in a hybrid zone in central Mexico. Leaf macro- and micro-morphological (stomata) characters were measured in 27 trees previously recognized as Q. castanea, Q. crassipes, and hybrids (nine trees/taxon). The expression of foliar shape and the production of secondary metabolites and nutritional chemicals between hybrids and parental species were also evaluated. We found that hybrids exhibit a mosaic of macro- and micro-morphological characters, including the expression of intermediate, parental, and transgressive attributes. Parental species were well differentiated based on foliar shapes, with hybrids overlapping in both species, having a greater affinity with Q. crassipes. Chemical analysis also supports three chemical groups, with hybrids producing new metabolites. This multimarker approach evidences the formation of ecological islands in this hybrid oak complex in which Q. castanea is involved, a fact that has consequences at higher levels of organization in ecology.

1. Introduction

Hybrid zones are natural environments that provide a chance to examine the ecological and evolutionary effects of genetic interactions among individuals belonging to different species [1]. Numerous research works have demonstrated the importance of natural hybridization, for example, hybrid zone formation, increased genetic and phenotypic diversity levels of interacting populations, hybrid speciation, species divergence, and introgression events [2,3,4,5]. Moreover, increasing research suggests that plant hybridization could influence the ecology of the individuals or populations participating in these occurrences [6], as well as their associated species and communities [7,8,9]. It is currently known that combining genomes from different species in hybrid organisms can generate significantly greater genetic diversity than seen in single species [10], and hybrids can produce novel phenotypes [11]. Therefore, it has been suggested that genetic recombination among species produces hybrid plants that represent new habitats, presenting a wider array of resources and conditions for the associated biota, and are considered biodiversity spots [10,12,13]. Thus, these host plants might symbolize ecological islands. An ecological island is defined as a small, isolated patch of unique habitat that supports large numbers of uncommon species [14,15]. For many years, botanists have acknowledged that rare plants, such as hybrids, are grouped into ecological “islands”: small and isolated habitat patches [16].
Phenotypic innovation in hybrid populations can lead to ecological novelty [11,17], which may influence parameters beyond the species level and alter community structure simultaneously or across different trophic levels [7,10,18]. For instance, multiple studies have indicated that the interspecific hybridization of plants may affect the quantity and distribution of herbivores among hybrids and their potential parents [13,19,20]. The authors propose that the varying reactions of herbivores result from differences in the expression of morphological, nutritional, or defensive chemical traits in various host plant genotypes within these systems [21,22].
Quercus castanea Née is an oak with a broad geographical range in Mexico and is a key element of temperate forest ecosystems [23]. This species shows distinctive morphological traits in allopatric zones. Moreover, unusual leaf shapes have been observed in oaks when this species cohabits with other red oak species in overlapping regions [23,24]. The quantity of red oak species related to Q. castanea varies in these regions, but the overlap of blooming times among these red oaks frequently occurs, indicating that hybridization might account for these distinctive characters. Given this information, we used Q. castanea as a model species to identify hybridization events and some of the evolutionary and ecological consequences. Initially, we investigated if the genetic structure and diversity levels of Q. castanea are correlated with the number of red oak species growing in overlapping zones with this species. We utilized 14 microsatellite (SSR) primers, comprising six nuclear and eight chloroplast primers, in 120 trees morphologically identified as Q. castanea associated with six populations (20 trees per site), where the number of red oak species associated varied from zero to five. We documented that the genetic variation in the Q. castanea population rises with the number of co-existing red oak species in sympatric areas [24]. These findings suggest that interspecific hybridization, with Q. castanea directly participating as one of the parent species, may lead to increased genetic diversity in the overlapping zones of Q. castanea. We subsequently presented genetic evidence of introgressive hybridization events in Q. castanea across a natural gradient of red oak species diversity [25]. We specifically documented that Q. castanea participates in introgressive hybridization events with Q. crassipes, Q. crassifolia, and Q. laurina, which are three prevalent red oak species that share habitats with Q. castanea in the temperate forests of the Trans-Mexican Volcanic Belt (TVB). We found F1 hybrids and introgressive genotypes, with the former being dominant. According to the literature, the phenotypic novelty that occurs in hybrid populations can lead to ecological novelty with effects at both the individual and population levels [9], which can have cascading effects on community structure, as has been repeatedly observed in arthropod systems associated with foundation species [7,12,18].
Quercus castanea is a species that exhibits traits of a foundation species, which are organisms that influence a community by establishing stable local conditions for other species and controlling and stabilizing vital ecosystem processes [26]. In this scenario, we suggested that if host plants exhibiting higher genetic diversity offer a broader range of resources and conditions available for insect use, then enhancing the genetic diversity of Q. castanea will encourage more diverse insect communities. To evaluate this hypothesis, we examined how the individual and population genetic diversity levels of Q. castanea affected its gall-inducing insect community and their associated parasitoids. We collected samples from the same 120 trees across six populations, spanning the previously identified genetic diversity gradient [24]. Overall, we found that the host plant’s genetic diversity has a positive influence on both species richness and the density of insect communities in the canopy. Additionally, indirect effects of genetic diversity were observed, affecting both species richness and insect density [27]. Our findings indicated that genetic diversity in Q. castanea might significantly influence the tri-trophic interactions involving oaks, herbivores, and parasitoids. Furthermore, we suggested that enhancing the genetic diversity of Q. castanea through hybridization events may lead to alterations in its morphological, phenological, architectural, and chemical traits, as previously noted in other hybrid systems [1,20,28,29,30]. These modifications can be reflected in the broader resources and conditions that may benefit canopy arthropod species [7,19,31].
In this research, we focus on the previously documented hybrid zone between Q. castanea and Q. crassipes in central Mexico [25], where hybrid and pure genotypes were identified using molecular markers (microsatellites), with F1 hybrid individuals as the dominant genotype. The objectives of this document were (1) to characterize the micro- and macro-morphological (traditional and geometric morphometry) expression and chemical production (nutritional and secondary metabolites) patterns of hybrids and their parental species, (2) to assess if phenotypic novelty exists in hybrids with respect to parental, and (3) discuss the potential ecological consequences of phenotypical expression in hybrids of this complex. Finally, given that the genetic diversity of hybrid individuals may favor the expression of different phenotypic traits compared to their parental species, we hypothesized that hybrid plants act as new ecological islands.

2. Materials and Methods

2.1. Study Site

For this research, we used the identical site and individual oak trees studied by Valencia-Cuevas et al. [25]. The Mexico City Ecological Park (PECM, an acronym in Spanish) was designated as a conservation area in 1989 [32]. It is located in the foothills of Ajusco with an elevation range of 2500 to 2800 m a.s.l. [33], covering approximately 728 hectares in central Mexico [32]. The yearly average temperature ranges from 12 to 14 °C, and the annual average rainfall is approximately 1000 mm. Precipitation primarily occurs from June to October, while the dry season lasts from November to May [34].
The research site is situated in the middle region of the PECM, featuring a landscape characterized by an oak forest dominated by Q. castanea, Q. crassipes, Q. frutex Trel., Q. glabrescens Benth., Q. obtusata Humb. & Bonpl., and Q. rugosa Née [35]. To mitigate the influence of environmental variables on the expression of morphological and chemical traits in individuals of the Q. castanea × Q. crassipes complex, we examined these characters on a fine spatial scale. Based on the soil formation level and the age of the volcanic base, two zones are identified in the oak forest: a closed canopy forest and a forest margin. The individuals were sampled in the transition between a dense forest and a scrub area. In this area, individual oaks are easily recognizable from a distance. They are established in areas of superficial volcanic soils that have some level of development and disturbed scrub growth around them.

2.2. Species Description

Quercus castanea and Q. crassipes (Lobatae: red oaks) are abundant species at the research location. Both can be readily recognized in the field by their leaf characters, including shape, size, color, and pubescence. Q. castanea includes trees ranging from 5 to 15 m in height with a trunk diameter of 30 to 60 cm. Leaves are obovate or oblanceolate, with underside veins conspicuously elevated and reticulate, margins with 2–5 (6) short aristate teeth, gray-greenish coloration, and trichomes fasciculate and sessile. The blooming period lasts from April to May, while the fruiting phase occurs from August to December [36,37]. This species is found across key Mexican mountain ranges at altitudes from 1180 to 2600 m a.s.l. Quercus crassipes consists of trees that can reach heights of 17 m and have trunk diameters of 1 m. The leaves are deciduous, leathery, narrow, elliptical, and lance-shaped; their upper surface is slightly shiny, while the underside is fluffy and grayish-white [38]. It flowers in May and bears fruit from September to January. It is distributed in the southeastern part of the Sierra Madre Oriental and the TVB, between 1900 m and 3500 m a.s.l. [36]. Atypical individuals possessing assumed intermediate leaf morphology are located in areas where these species’ distributions overlap in PECM. In a previous study using microsatellites, we documented that these oak individuals result from interspecific gene flow between Q. castanea and Q. crassipes [25]. Genetic analysis in this hybrid zone revealed that F1 individuals represented the dominant hybrid genotype, as Q values ranged from 0.581 to 0.444 [39]. A total of nine F1 individuals were genetically recognized in this area.

2.3. Leaf Macro-Morphological Data

Seventeen macro-morphological traits of leaves were assessed (Table 1) in 27 trees previously identified as Q. castanea, Q. crassipes, and Q. castanea × Q. crassipes hybrids (nine trees for each taxon) using morphology and molecular markers [25]. Thirty mature leaves, showing no visible damage, were randomly collected from branches in the middle canopy of each tree. A total of 810 leaves were measured for seventeen characters.

2.4. Leaf Micro-Morphological Data

Given that stomata are specialized cells that enable gas exchange in plants and allow the entry of CO2, which is essential for photosynthesis, we utilized stomata as a source of micromorphological information. For their characterization, we used the same 27 macro-morphologically characterized trees. We randomly selected three healthy and intact leaves from each plant, from which we manually removed all the trichomes. Three slides were made for each tree (n = 81). These slides were made to capture impressions of the leaf surface through the replica technique [40]. The impression was made by placing a drop of cyanoacrylate adhesive on the leaf surface. The leaf tissue was carefully detached after the adhesive had dried, typically within 1–2 h. The slides were subsequently examined using a microscope at 40x. Four parameters (stomata length [SL], width [SW], density [SD], and stomata coverage [SC]) were measured in 243 stomata (three stomata/slide).

2.5. Geometric Morphometrics

For the analysis employing geometric morphometric techniques, we utilized the identical 27 trees. A total of 270 leaves (10 leaves per tree) were sampled, pressed, and dried, then digitized using a Photo Capture scanner (Ortery Technologies, Irvine, CA, USA) and a Canon EOS Rebel T5i camera (Tokyo, Japan) at a resolution of 200 dpi. From the leaf images, two landmarks were placed (apex and insertion of the petiole with the lamina), and two curves were drawn with 32 equidistant points on each side of the leaf margin using the TpsDIG2.16 software [41]. Considering that hybridization may either diminish or elevate developmental instability levels (assessed as fluctuating asymmetry, FA) due to heightened heterozygosity or disturbance of coadapted gene complexes in hybrid genotypes [42], we analyzed FA levels among parental oak species and their hybrids in our investigation.

2.6. Foliar Chemical Composition of Oak Taxa

2.6.1. Preparation of Extracts from Quercus

Metabolites from the leaf tissue of the same 27 trees identified earlier were analyzed. For each tree, we chose leaf tissue from the middle of the canopy, which was dried in the shade at room temperature, and the leaves were crushed to yield 100 g from each sample. The dried and ground material was extracted with a 50:50 (v/v) mixture of dichloromethane and methanol (1.0 L/sample) by maceration for 3 days, three times. A Rotavapor R-114 (BUCHI, Zurich, Switzerland) was used to eliminate the solvent through reduced-pressure distillation. Once the extracts were obtained, they were filtered in an open column packed with 5 g of activated carbon and 10 g of silica to remove chlorophyll.

2.6.2. Chromatographic Analysis

The dried extracts of Q. castanea (4.8 g), Q. crassipes (5.2 g), and hybrids (4.6 g) were compared and gathered according to their chemical similarity using thin-layer chromatography (TLC). Analytical TLC was performed on silica gel 60 F254 chromatographic plates (Merck, Darmstadt, Germany), visualized under UV light, and then sprayed with Ce(SO4)2 2(NH4)2SO4 2H2O.
The organic extracts for each individual were examined using conventional chromatographic techniques. Specifically, thin-layer chromatography (TLC) using Ce(SO4)2 2(NH4)2SO4 2H2O for the detection of terpenes is reported to be a specific chemical reagent for this family of compounds (Fried and Sherman 1996) [43]. The extracts of each individual (3 mg) were analyzed using GC-MS (NIST 1.7a).

2.6.3. GC-MS Analysis

The examination of gas chromatography (GC) coupled with mass spectrometry (MS) was conducted utilizing an HP Agilent Technologies 6890 gas chromatograph paired with an MSD 5973 quadrupole mass detector (HP Agilent, Santa Clara, CA, USA), featuring a capillary column HP-5MS (length: 30 m; inside diameter: 0.25 mm; film thickness: 0.25 M). The carrier gas, helium, was adjusted to the column at a flow rate of 1 mL/min. The inlet temperature was set at 250 °C, while the oven temperature was initially 40 °C (held for 1 min) and then increased to 280 °C at a rate of 10 °C/min. The mass spectrometer functioned in positive electron impact mode with an ionization energy set at 70 eV. Detection was carried out using selective ion monitoring. The compounds were identified by comparing their retention times and fragmentation patterns with those of reference compounds in the NIST version 1.7a database. If the compound had a percentage greater than 80% between the theoretical and experimental fragmentation patterns, it was considered a correct compound name.

2.6.4. Nutritional Chemistry

Foliar tissue of the same 27 trees. The samples were air-dried at room temperature in a shaded area, and the leaves were crushed to obtain 5 g from each individual. The dried and ground material was analyzed for nitrogen percentage (%N), carbon percentage (%C), and total phosphorus (P). The Kjeldahl method was used to determine the nitrogen percentage [44]. Ultimately, the C/N ratio was determined by dividing the carbon percentage by the nitrogen percentage.

2.7. Statistical Analysis

One-way variance analyses (ANOVA) were performed to assess the effect of the taxon (Q. castanea, Q. crassipes, hybrid) on the variability of macro- and micro-morphological leaf traits (Table 1). Taxon served as the independent variable, while each morphological trait was treated as a dependent variable. Percentage data were transformed using X = arcsin (%)½, and discontinuous data were adjusted using X = (x)½ + 0.5 [45]. Significant differences between taxa were determined using the Tukey multiple range test. Hybrid traits were classified as transgressive, intermediate, or parental-like based on comparisons with parental species [46].
Discriminant function analysis (DFA) was performed using all macro- and micro-morphological traits to identify the most effective characters for distinguishing taxa and visually assessing individual groupings. Taxon (Q. castanea, hybrid, and Q. crassipes) was used as the predictor variable.
To analyze foliar shape expression in hybrids relative to parental species, the coordinates of landmarks and curves data were processed in R using the Geomorph package 4.0.3, where Procrustes superimposition was performed. At the same time, the mshape function averaged individual leaf shapes. Once the shapes of the individuals were averaged, a principal component analysis was performed using the gm.prcom function, and the results were visualized in scatter plots using ggplot 3.5.1 [47] Procrustes ANOVA was also performed to explore asymmetry effects, generating graphs of leaf deformation for both symmetric and asymmetric components.
One-way ANOVA was also employed to evaluate the effects of taxon on total phosphorus, carbon, nitrogen percentages, and the C/N ratio. Percentage data were corrected as X = arcsin (%)½.
Non-metric multidimensional scaling (NMDS) was employed to assess differences in metabolite and nutritional chemical composition among taxa, utilizing 14 metabolites and four nutritional chemicals. NMDS generated a dissimilarity matrix using the Bray–Curtis coefficient [48]. ANOSIM assessed the variations among metabolites, nutritional chemical makeup, and tree taxa. Bootstrap analysis, known as ANOSIM, was employed to assess group differences through 9999 random reassignments and to determine if the resulting dissimilarity matrix differed significantly from that expected by random chance [49].
A similarity percentage (SIMPER) analysis was used to determine the metabolites and nutritional compounds that had the greatest influence on the Bray–Curtis dissimilarity in their concentrations across different pairs of taxa. Additionally, the SIMPER analysis results were used to identify the metabolites and nutritional chemicals that contributed most to the dissimilarity among taxa. For metabolites, we utilized species-specific markers that were unique to a single species but not necessarily present in all individuals within that species [50]. Statistical analyses were conducted using the software programs STATISTICA 8.0 [51] and Past ver. 4.06 [52].

3. Results

3.1. Expression of Macro- and Micro-Foliar Morphology

ANOVA of leaf macro- and micro-morphological characters revealed that the taxon (Q. castanea, Q. crassipes, hybrid) had a significant effect on all morphological characters except for petiole percentage (%P) (Table 2). Furthermore, after post hoc comparisons, the hybrids showed an intermediate phenotype between their parental species in ten of the examined macro-morphological characters. Of the seven remaining evaluated characters, three were negative transgressive, three were similar to some parental species (one Q. castanea-like and two Q. crassipes-like), and one characteristic did not show significant differences from the parents (parental-like; Table 2). Additionally, for micro-morphological characters, we found that two were intermediate and two were similar to Q. crassipes (Table 2). Considering both macro- and micro-morphological characters, analysis of hybrids in this hybrid zone revealed the expression of transgressive (14.28%), parental-like (28.58%), and intermediate characters (57.14%).
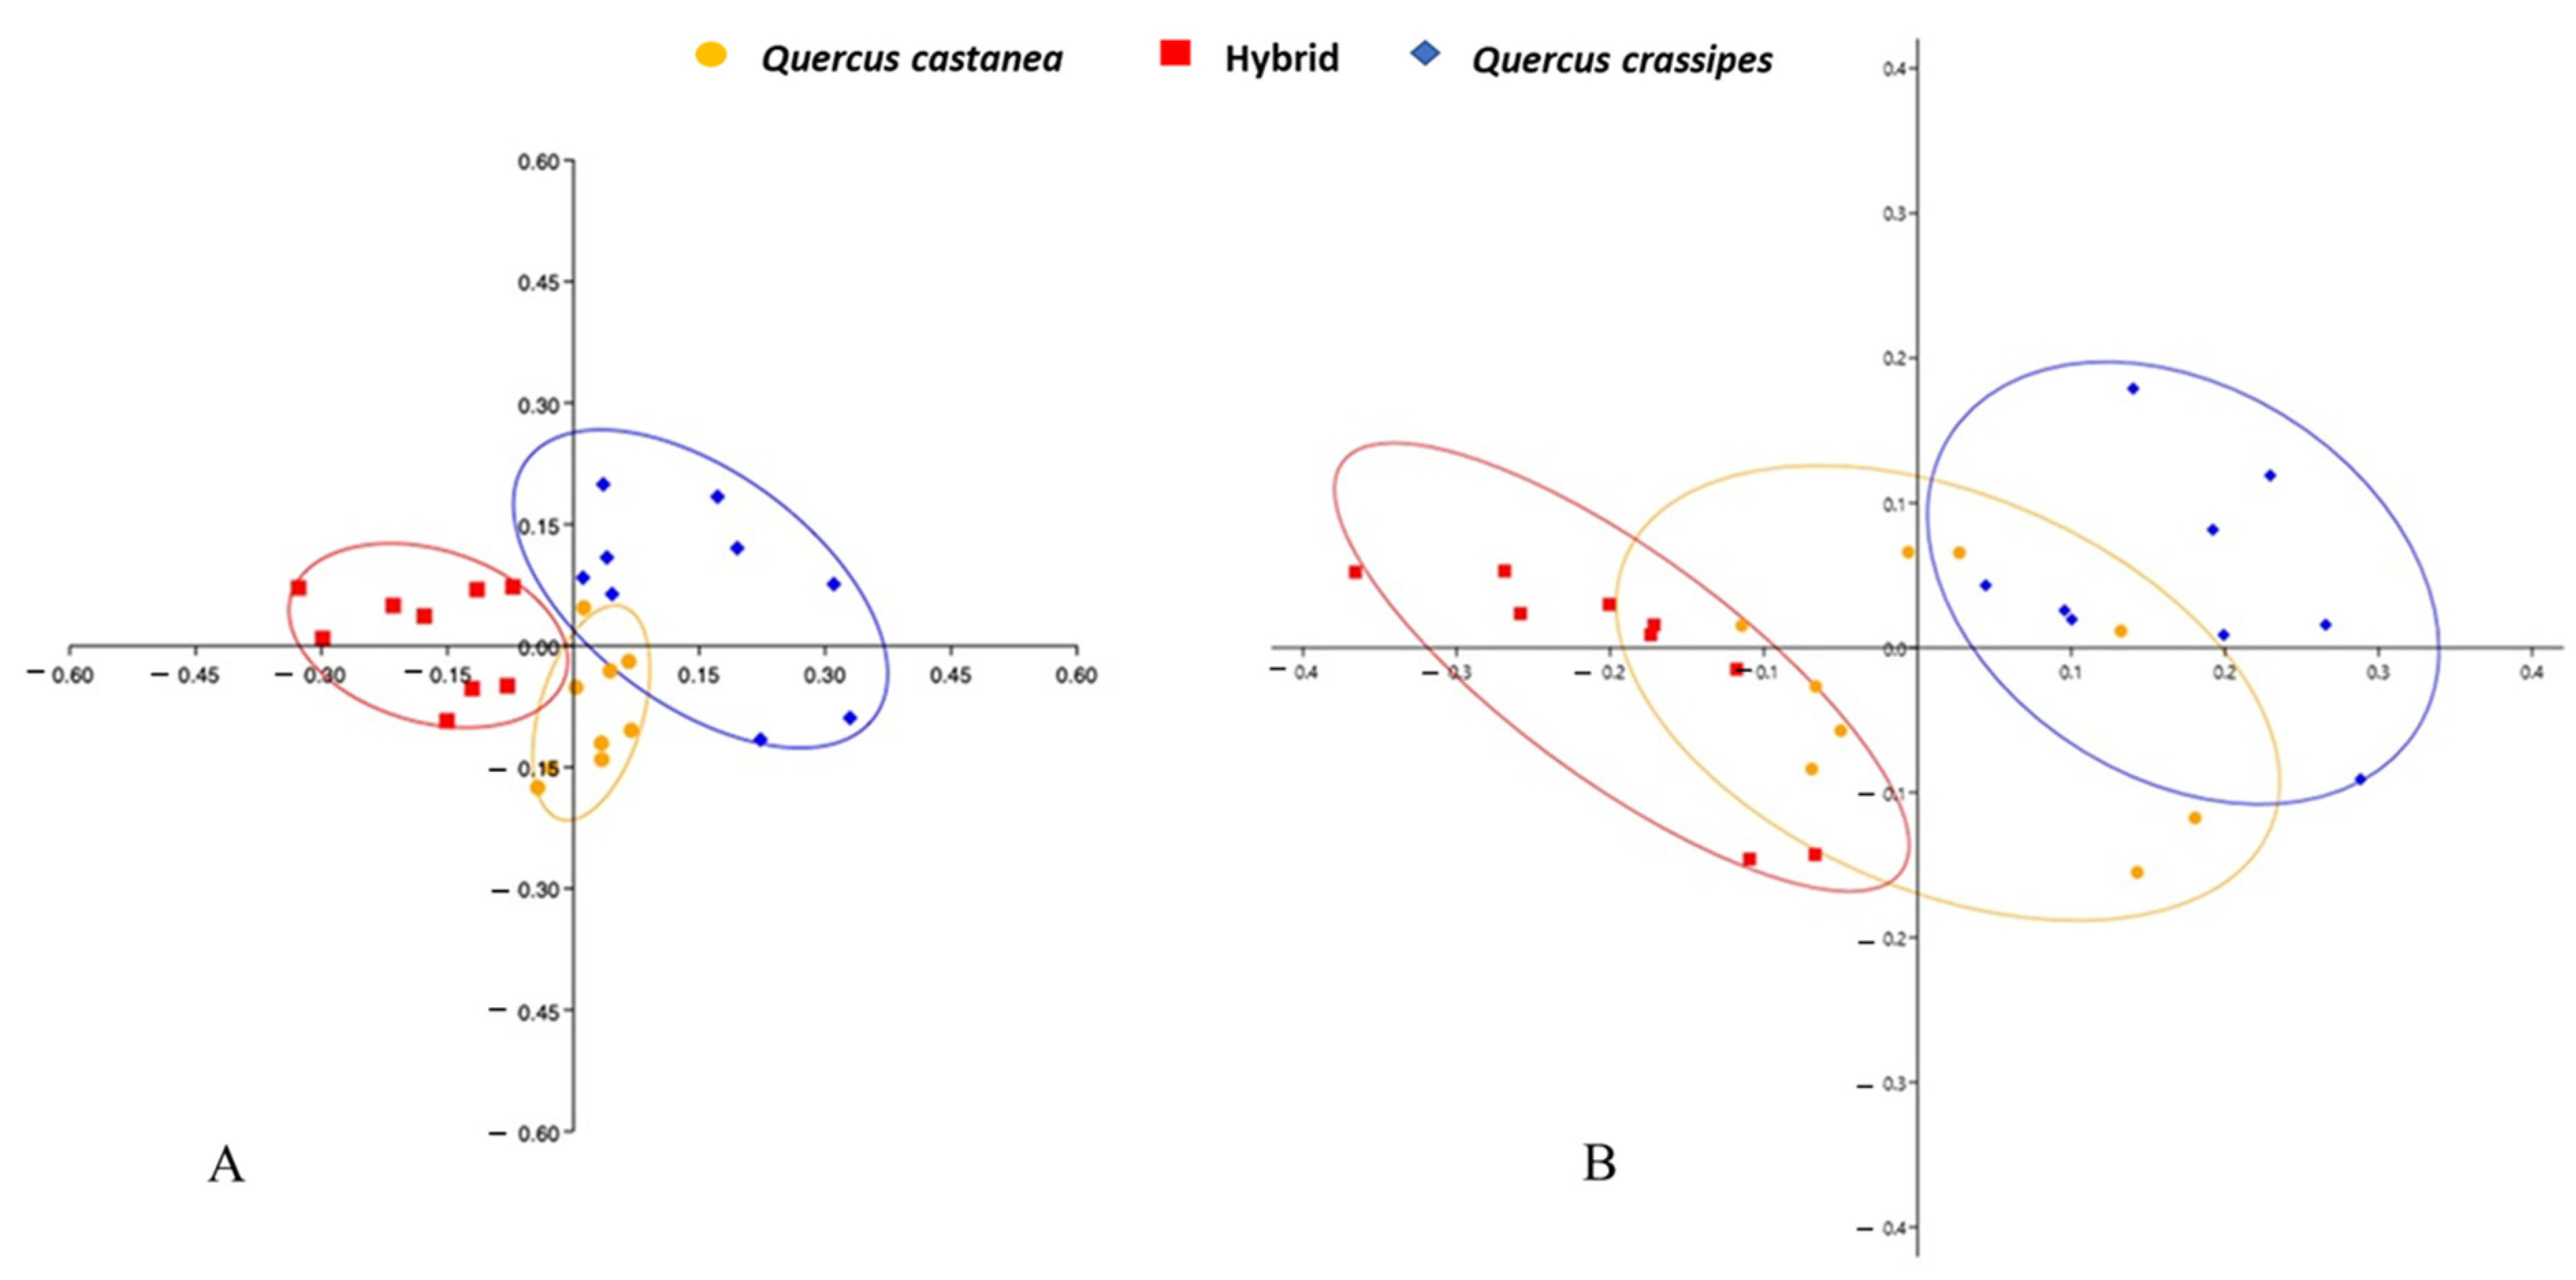
Discriminant function analysis for leaf macro-morphological variation as a dependent variable resulted in two DFs that accounted for 100% of the variation in the original traits data set (Figure 1A). In general, the petiole length, lamina length, and leaf length total were the characters that contributed to the highest value of the ordination model for the first and second axes (Appendix A.1). The DF1 versus DF2 plot indicated that individuals from all three taxa displayed nearly no overlap in the ordination space. Hybrid individuals were positioned in a middle ground between members of both parental species, though somewhat biased towards Q. crassipes (Figure 1A). Classification analysis (Appendix A.2) showed high percentages of correct classification in all taxa (97.9%).
Discriminant function analysis, with taxon as the predictor variable and micro-morphological traits (stomata) as dependent variables, yielded two discriminant functions (DFs) that explained 100% of the variation in the original data set (Figure 1B). In DF1, the variable with the highest standardized discriminant coefficients was stoma density. In contrast, stoma length exhibited the highest standardized discriminant coefficients in DF2 (Appendix A.1). The plot of DF2 vs. DF1 showed that individuals of Q. castanea, hybrid, and Q. crassipes show significant overlap in the ordination space (Figure 1B). However, classification analysis through DFA with stoma characters showed that 72.65% of individuals were correctly classified. Classification analyses indicated that the parent species were not incorrectly classified among themselves. Nonetheless, certain plants of the parent species were categorized as hybrids. Also, some hybrids were classified as Q. crassipes or Q. castanea individuals (Appendix A.2).

3.2. Expression of Foliar Shape

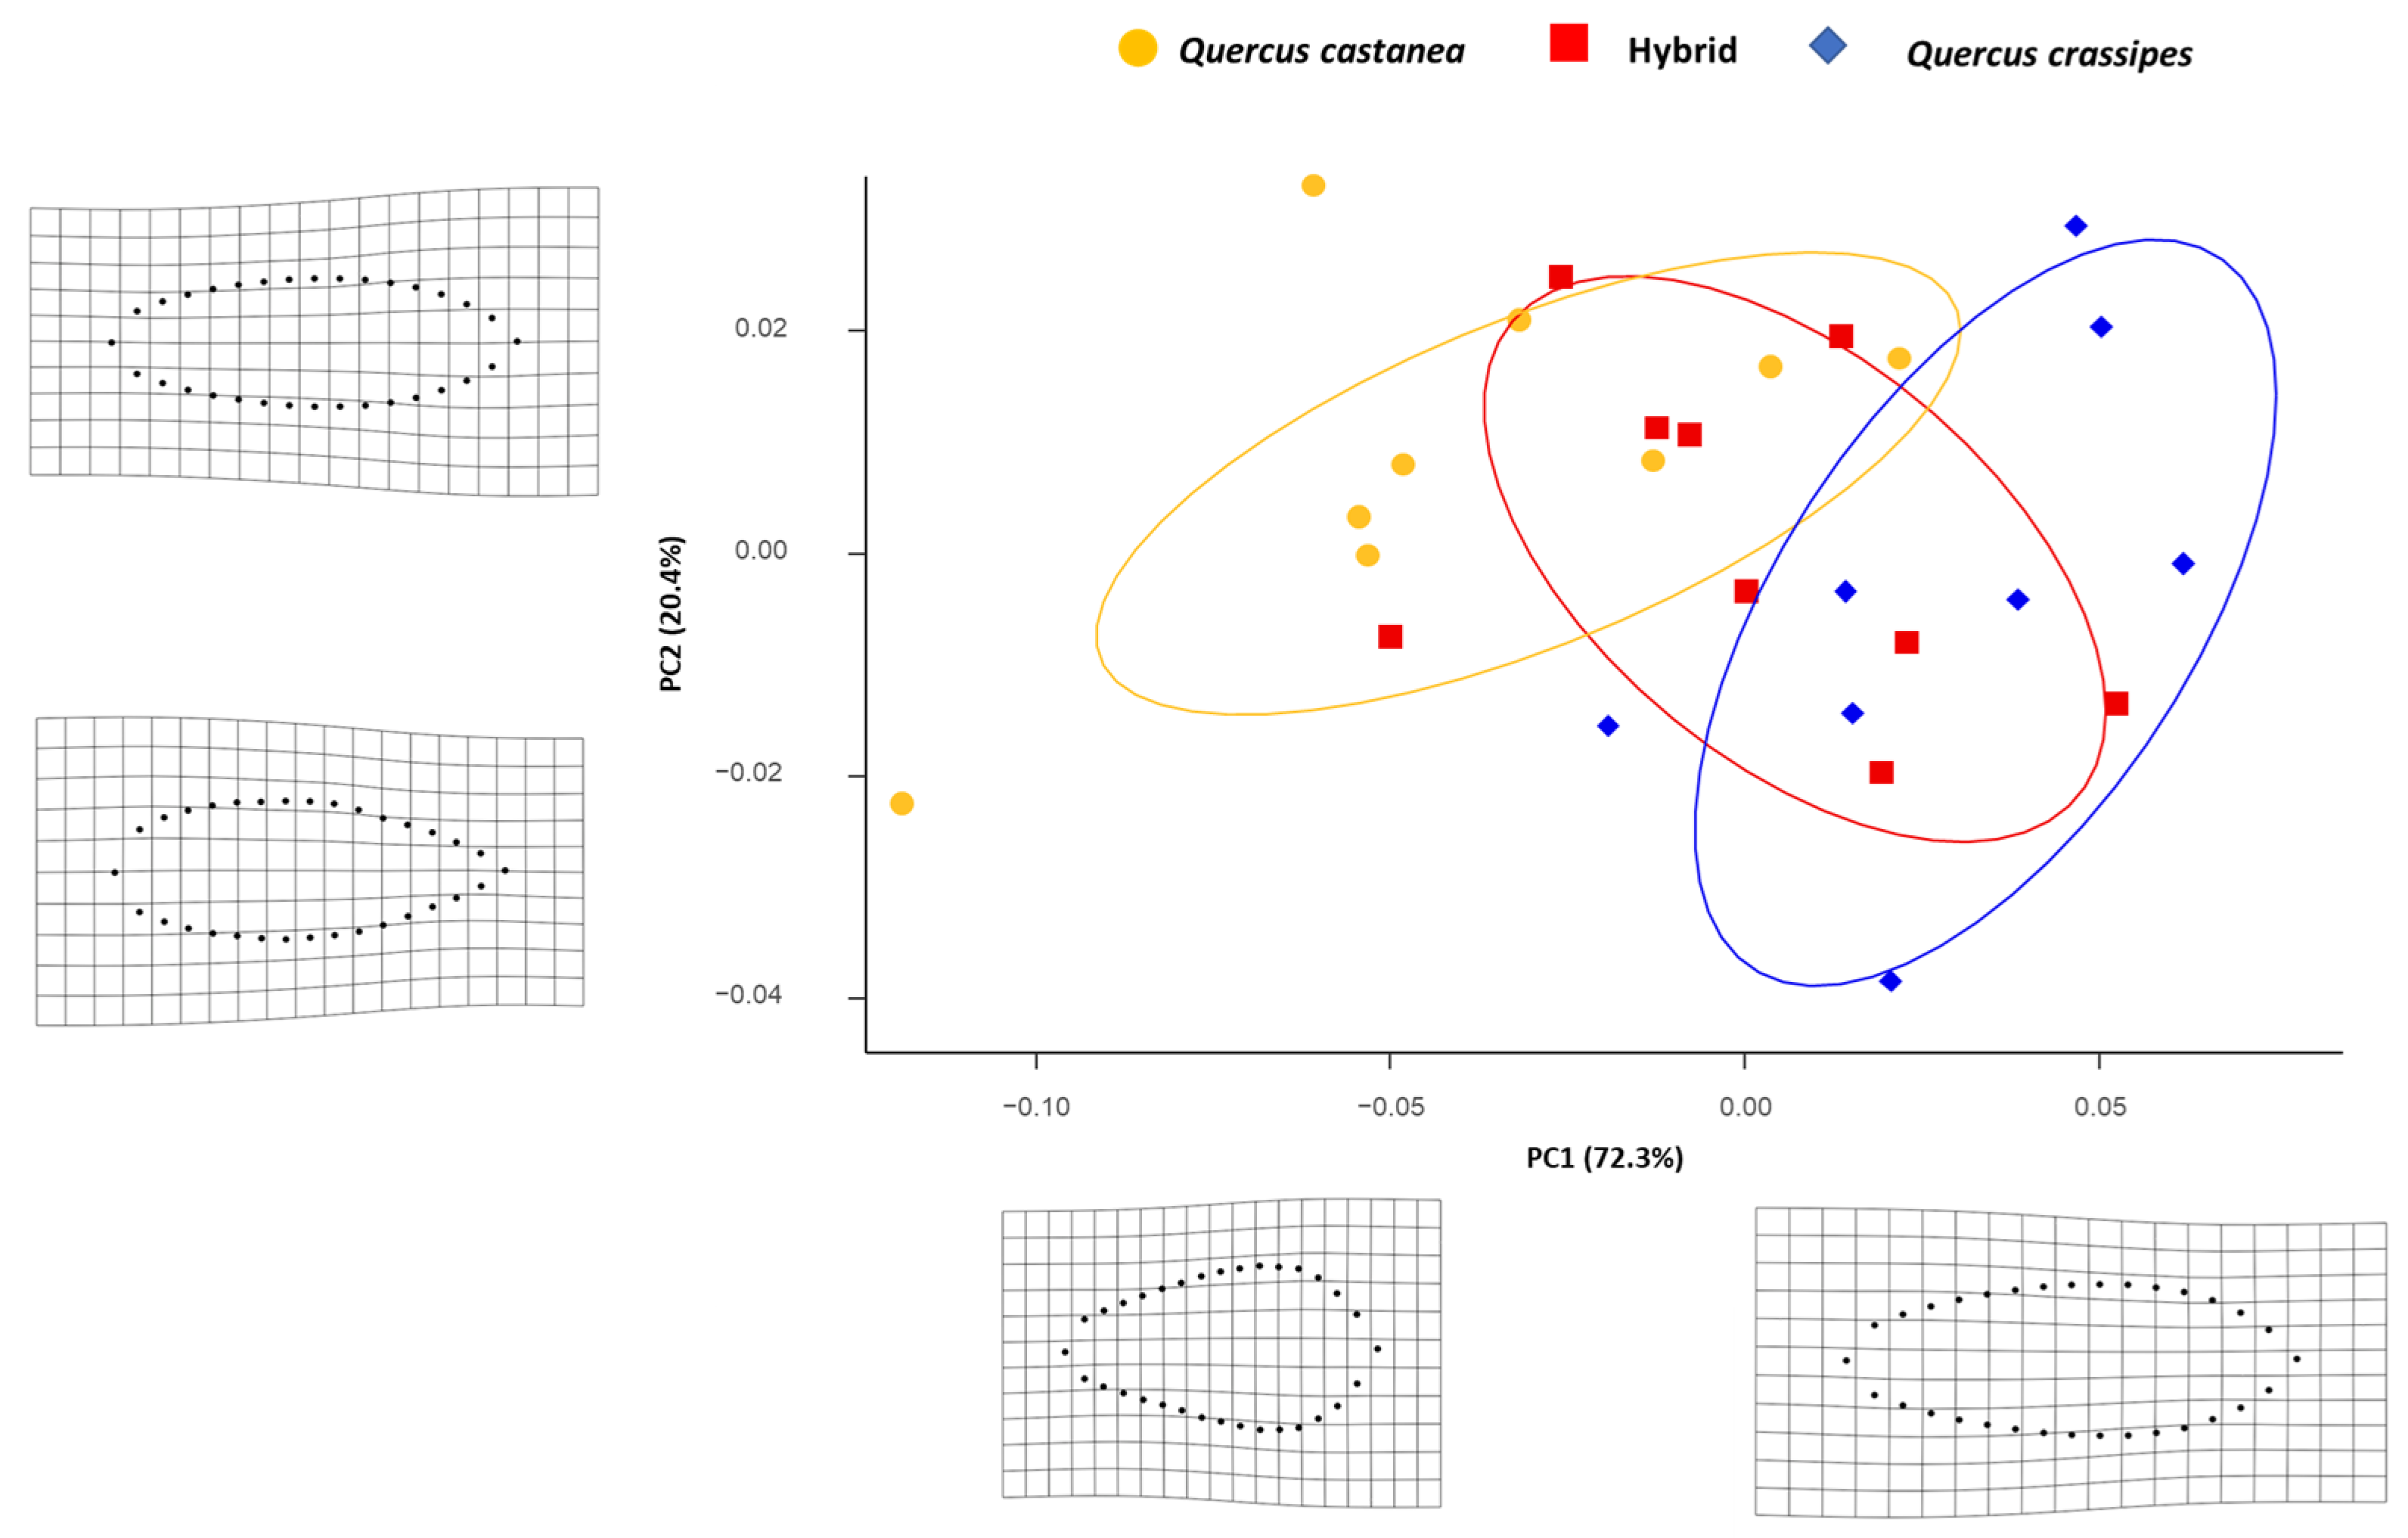
The principal component analysis recovered almost 93% of the leaf variation within its first two components. PC1 allows for the separation of individuals of Q. crassipes and Q. castanea with minimal overlap (Figure 2), supporting the taxonomic delimitation of the two taxa. Also, we observed that individuals assigned as hybrids overlap with both species, having a greater affinity with Q. crassipes. On the other hand, Procrustes ANOVA evidences a large effect of fluctuating asymmetry on both taxa, higher on Q. castanea (Rsq = 0.651) followed by hybrids (Rsq = 0.552) and, finally, on Q. crassipes (Rsq = 0.410) (Table 3). Thus, asymmetry explains a large amount of the leaf morphological variation in all three groups. Visually, asymmetry in Q. crassipes is located towards the base of the lamina, in Q. castanea towards the apex, while in the hybrids, it is focused in the mid-basal zone of the leaf (Figure 2).

3.3. Qualitative and Quantitative Production of Secondary Metabolites

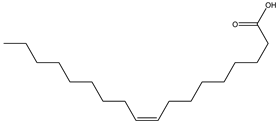
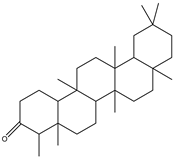
The chemical analysis evidenced 14 foliar metabolites in the Q. castanea × Q. crassipes complex that were useful to distinguish between taxa. Three were expressed in most Q. castanea individuals (oleic acid; 2,3,10,14,18,22-tetracosahexane,2,6,10,15,19,23-hexamethyl-(all-E)-; Friedelin) and three in most Q. crassipes individuals (Nonacosanol; 2-cyclohexen-1-one; 4-(3-hydroxybutyl)-3,5,5-trimethyl-10-octadecenoic acid, methyl ester). These metabolites were considered species-specific markers (Table 4). In addition, the hybrids presented eight new compounds (Table 4). Also, three compounds were found to be present in both parent species but not in the hybrids (propanoic acid, 2-methyl-1-(1,1-dimethylethyl)-2-methyl-1,3-propanediyl ester; α-tocopherol; 2-cyclohexen-1-one,4-(3-hydroxybutyl)-3,5,5-trimethyl. The SIMPER test showed the most important secondary metabolites that, in terms of concentration, contributed to the dissimilarity between groups (Appendix B.1). We found significant differences in metabolite composition among tree taxa (ANOSIM r = 0.6285, n = 27, p < 0.0001), indicating that these groups differ significantly from each other (Figure 3A).

3.4. Nutritional Chemistry

One-way variance analyses (ANOVA) of leaf nutritional chemical characters revealed that taxon had a significant effect on %N, C/N proportion and total phosphorus (Table 5). After post hoc comparisons, the hybrids showed that %N was similar to that of the parental species Q. castanea, while total phosphorus was intermediate and C/N proportion was transgressive (+) (Table 5). In general, the SIMPER analysis identified that the C/N proportion and the carbon percentage are the most important nutritional chemicals that, in terms of concentration, contributed to the dissimilarity between groups (Appendix B.2). We found significant differences in nutritional chemical concentration among tree taxa (ANOSIM r = 0.6140, n = 27, p < 0.0001), demonstrating that these groups are notably distinct from each other (Figure 3B).

4. Discussion

4.1. Expression of Macro- and Micro-Morphology and Shape Foliar in the Quercus castanea × Q. crassipes Complex

Expression of macro- and micro-foliar morphology revealed that hybrids exhibited intermediate, parental-like, and transgressive phenotypes compared to those of Q. castanea and Q. crassipes. On the other hand, through geometric morphometry, we demonstrated that hybrids resemble their parental species in shape and size (Q. castanea and Q. crassipes). Both outcomes suggest that hybrids comprise a mosaic of phenotypes, exhibiting traits from both parents, intermediate traits, and novel traits. These results are consistent with a previous study, which used molecular markers to document the presence of hybrid genotypes with evidence of a mixture between Q. castanea and Q. crassipes (Q values oscillated between 0.581 and 0.444) [25]. Additionally, the literature indicates that true hybrids do not always exhibit an intermediate phenotype. In this sense, Craft et al. [53] identified phenotypically intermediate trees that showed little evidence of mixed ancestry, as determined by microsatellites, among Q. lobata (valley oak) and Q. douglasii (blue oak) (Fagaceae). Additionally, only one of the four trees with the highest probability of hybrid ancestry appeared to be intermediate. In this sense, the results of this study indicate that F1 hybrids, genotypically identified by microsatellites [25], exhibit a broader range of phenotypic characters.
Hybridization can either decrease or elevate the levels of developmental instability (assessed as fluctuating asymmetry: FA) due to heightened heterozygosity or the disturbance of coadapted gene complexes of each species within hybrids [42]. We compared the level of FA among parental oak species and hybrids in our study. Furthermore, from an ecological perspective, assessing FA levels is essential, as differences in nutritional quality or secondary chemistry between symmetric and asymmetric leaves have been documented [54,55]. Therefore, leaf size and shape differences between parental species and hybrid individuals may influence herbivore consumption levels and insect distribution [56]. In this study, the outcomes of the Procrustes ANOVA revealed random variation (FA) between the left and right sides of the leaves across all analyzed taxa (Q. castanea, Q. crassipes, and hybrids). Levels of FA were higher in Q. castanea compared with hybrids and Q. crassipes individuals. Our result contrasts with other studies in which F1 hybrids and backcrosses showed more levels of FA than pure taxa, e.g., Q. magnoliifolia and Q. resinosa [57]; Betula pubescens and B. pendula [58]. In these cases, the authors suggest that hybridization might increase FA due to the disruption of the coadapted gene complexes of the parental species. However, hybridization does not always lead to elevated FA. The probability of hybridization disrupting genomic coadaptation largely depends on the particular populations involved [59]. This disruption is least likely to occur when the populations are genetically very similar or in hybrid swarms that have persisted long enough for coadaptation to re-establish [60]. Consequently, analyzing FA is most valuable in cases where hybridization has occurred recently. Unfortunately, this information is not currently available for Q. castanea × Q. crassipes complex. In the future, it would be interesting to assess the degree of genetic differentiation between Q. castanea and Q. crassipes, as well as the age of the hybrid complex. On the other hand, we have documented hybridization events between Q. castanea and at least two other oak species in central Mexico (Q. laurina and Q. crassifolia) [25]. Also, Q. castanea is considered a species with a wide geographic distribution, as its presence has been reported in 15 states of Mexico, resulting in considerable morphological variation throughout its distribution in Mexico. Twenty-one taxa have been recognized as synonyms of Q. castanea [23]. Both processes can explain the higher levels of FA in this species compared to Q. crassipes and hybrids. Therefore, the widespread distribution of oak species, such as Q. castanea, increases their likelihood of encountering and hybridizing with multiple closely related species across different ecological and environmental gradients [25]. This hybridization can have significant consequences for the developmental stability of the resulting hybrids, producing individuals with variable developmental stability [61], influenced by genetic compatibility between hybridizing species [57], local adaptation [59], and ecological interactions [60]. Therefore, some hybrids may thrive due to hybrid vigor, while others may experience instability and be selected against, ultimately influencing the formation of hybrid zones and shaping evolutionary trajectories [61]. In the case of Q. crassipes, we have observed that its phenotypic plasticity is limited [29]. If some hybrids exhibit morphological characters similar to this species, this condition may explain the lower FA values found in this study for both taxa.

4.2. Production of Secondary Metabolites and Nutritional Chemicals

We found 14 useful foliar metabolites to distinguish between taxa in the Q. castanea × Q. crassipes complex. Three were expressed in most Q. castanea individuals and three in most Q. crassipes individuals. Additionally, the hybrids presented eight new compounds that were not found in either of the parental species, while three compounds found in both parent species were absent in the hybrids. According to Orians [1] and Cheng et al. [30], a change in the genotype, as occurs in hybridization events, can result in the recombination of metabolic pathways and create distinct chemotypes. These results suggest that hybridization plays a key role in generating plant chemical diversity, which can facilitate local adaptations [30,59]. On the other hand, we detected three compounds that were present in both parent species but not in the hybrids, suggesting that compounds with high specificity may be found in oak species [58], which prevents them from becoming part of the genetic mix that the hybrids inherit. Cheng et al. [30] reported that at least two mechanisms could generally explain the inhibition of the production of SM post-hybridization: (1) variation at the loci that regulate the expression of metabolites in the parent organisms and (2) the extension of certain stages in the metabolic pathway. Also, hybrids can be distinguished from both parental species based on metabolite concentration, clustering intermediately between parents based on NMDS. In this study, it was determined that the parental species and their hybrids have qualitatively and quantitatively distinct chemical profiles. Particularly, it can be observed that the compounds that presented a greater contribution to the dissimilarity between the different genotypes (Q. castanea, Q. crassipes, hybrids), according to the SIMPER analysis, are terpenoids. Terpenes have generally been characterized as SM, which allows plants to protect themselves against insect pests and pathogens [59,62,63]. It has also been observed that some terpenoid compounds, such as triterpenes, exhibit allelopathic biological activity by inhibiting seed germination and root growth and affecting photosystem II functioning [64]. Other triterpenes, such as α-amyrin, have been reported to exhibit antimicrobial activity [65,66,67], while β-amyrin displays antifungal, antimicrobial, and antibacterial activity [67]. This information leads us to assume that the differences in SM production in this oak complex will affect various ecological processes [68].
Similarly, parental species (Q. castanea and Q. crassipes) exhibited significant differences in two of the nutritional chemicals evaluated (nitrogen and total phosphorus), while hybrids showed that %N was more like Q. castanea and total phosphorus was intermediate between the parents. However, quantitatively, we can observe three groups, suggesting differences exist in the concentration of nutritional chemicals between taxa. To our knowledge, this is the first study that evaluates the effect of natural hybridization on the production of nutritional chemicals in oaks. This information is relevant because nutrition influences many aspects of organisms, such as their life history, behavior, and physiology [69]. For example, herbivores’ insect performance response to foliar nutritional quality has been documented in the larval performance of Lymantria dispar (Lepidoptera) that feed on the red oak Q. rubra [70]. In this work, we observed that the nutritional chemical that contributed most to the differentiation between groups was the C/N ratio. In the literature, it has been reported that the palatability of plants to herbivores depends on the C/N ratio in the leaves [71]. Similarly, for edaphic microorganisms, the C/N ratio is related to low substrate quality [72]. Additionally, the nutritional quality of the plants can affect the rest of the trophic chain through its impact on herbivores or decomposers. Finally, these qualitative and quantitative changes in plant metabolism’s secondary and nutritional chemicals may mediate interactions with natural enemies, including herbivores, and interactions with their abiotic environment [73].

4.3. Ecological Consequences of Hybridization Between Q. castanea and Q. crassipes

Multiple studies have highlighted the effects of hybridization events on the community composition of various groups associated with hybridizing populations of foundation species [10,13,27,31,74], including different ecosystem-level processes. For instance, it has been recorded that the SM makeup of Populus hybrids affects the community structure of arthropods residing in the canopy [75], bark endophytic fungi [76], and aquatic macroinvertebrates that feed on fallen leaves in rivers or streams [77]. Similarly, the variation in the concentration of tannins in P. fremontii, P. angustifolia, and their putative hybrids explained 63% of the variation in nitrogen mineralization in the soil, while LeRoy et al. (2006) [77], using the same system, found that the variation in the concentration of tannins explained 97% of the leaf decomposition rate.
In this study, we observed that hybridization events between Q. castanea and Q. crassipes result in hybrids that exhibit differences in morphological and chemical traits compared to their parental species. In a previous study, Valencia-Cuevas et al. [27] evidenced that the genetic diversity level of Q. castanea resulting from hybridization events directly affects its gall-induced insect communities and indirectly modifies its parasitoid. These alterations can be represented as a broader mosaic of resources and conditions that may influence insects associated with the canopy, including herbivores and parasitoids. In this study, we have now demonstrated that the hybrid genotypes between Q. castanea and Q. crassipes exhibit differences in morphological, nutritional, and defensive chemical traits compared to their parental genotypes. This information is important because herbivore preference, performance, and distribution within hybrid complexes [78] are influenced by these plant traits, which are modified during hybridization events [13,30,79]. In this oak complex, we found evidence that Q. castanea showed higher levels of leaf asymmetry compared to the hybrids and Q. crassipes. Additionally, we observed differences in leaf morphology, size, and shape, as well as in nutritional and defensive chemicals. These differences could promote variation in insect distribution among taxa [54,56,80]. This discrimination among host plants based on their phenotype can subsequently impact community structure and arthropod diversity [20,31,81]. Therefore, the hybridization events between Q. castanea and Q. crassipes create areas of biodiversity, resulting in new habitats for dependent fauna. So, we propose that hybrid host plants represent ecological islands. In other words, they represent small and isolated habitat patches [16]. Considering that phenotypic diversity in plants fulfills several relevant roles, as previously described, we suppose that the range of phenotypes emerging after hybridization events in this oak complex can have ecological and adaptive roles. It would be interesting to test this hypothesis in the future. This study offers valuable insights into the ecological consequences of hybridization between Q. castanea and Q. crassipes. However, its findings are based on a single hybrid zone in Mexico City. Future research should aim to expand sampling efforts to include other hybrid zones of this complex across the distribution ranges of both species. Incorporating data from multiple hybrid zones would provide a more comprehensive understanding of the ecological dynamics of hybridization between these oak species.

5. Conclusions

We utilized phytochemical and morphological biomarkers to characterize the morphological expression patterns and chemical production of the parental and hybrid genotypes of the Q. castanea × Q. crassipes complex in a previously identified hybrid zone, complementing the results obtained with molecular markers. As expected, hybrids exhibit a mosaic of characters, including the expression of new metabolites. This multimarker approach reveals the formation of ecological islands within the hybrid oak complex, which can have significant consequences at higher levels of ecological organization. Therefore, additional research is required to clarify the potential adaptive roles or effects of hybridization among these red oak species (including Q. castanea) over time and across different environments, as well as their interactions with related organisms.

Author Contributions

Conceptualization, E.T.-S.; methodology, L.V.-C., F.O.-B., S.M.-B. and O.Á.D.L.-B.; validation, E.T.-S.; formal analysis, L.V.-C. and E.T.-S.; investigation, L.V.-C.; resources, E.T.-S. and L.A.; writing—original draft preparation, L.V.-C.; writing—review and editing, E.T.-S. and L.V.-C.; supervision, E.T.-S. All authors have read and agreed to the published version of the manuscript.

Funding

This work was supported by the Consejo Nacional de Humanidades, Ciencia y Tecnología (CONAHCyT), Mexico (Grants 42554) under the program “Programa de Becas Posdoctorales” through a postdoctoral fellowship granted to Leticia Valencia Cuevas.

Institutional Review Board Statement

Not applicable.

Data Availability Statement

The data supporting this study’s findings are available from the corresponding author upon reasonable request.

Acknowledgments

We thank Miguel Santoyo Martínez and Tonatzin Romero Rosales for their technical assistance.

Conflicts of Interest

All the authors have no conflict of interest regarding this research.

Appendix A

Appendix A.1

Standardized canonical coefficients of each macro- and micro-morphological variable derived from DFA of a hybrid zone between Quercus castanea and Q. crassipes.

Appendix A.2

Classification analysis performed by DFA overall Quercus taxa. The percentages of assignments to each category (taxa) are shown for foliar macro- and micro-morphological characters (stomata).

Appendix B

Appendix B.1

SIMPER results show the average concentration of discriminating secondary metabolites in each genetic class, their contribution (%) to the dissimilarity between groups, and the cumulative total (%) of contributions (75% cut-off).

Appendix B.2

SIMPER results show the average concentration of discriminating nutritional chemicals in each taxon, their contribution (%) to the dissimilarity between groups, and the cumulative total (%) of contributions (75% cut-off).

References

  1. Orians, C.M. The effects of hybridization in plants on secondary chemistry: Implications for the ecology and evolution of plant–herbivore interactions. Am. J. Bot. 2000, 87, 1749–1756. [Google Scholar] [CrossRef] [PubMed]
  2. Arnold, M.L. Evolution Through Genetic Exchange; Oxford University Press: New York, NY, USA, 2006. [Google Scholar]
  3. Todesco, M.; Pascual, M.A.; Owens, G.L.; Ostevik, K.L.; Moyers, B.T.; Hübner, S.; Heredia, S.M.; Hahn, M.A.; Caseys, C.; Bock, D.G.; et al. Hybridization and extinction. Evol. Appl. 2016, 9, 892–908. [Google Scholar] [CrossRef]
  4. Goulet, B.E.; Roda, F.; Hopkins, R. Hybridization in plants: Old ideas, new techniques. Plant Physiol. 2017, 173, 65–78. [Google Scholar] [CrossRef]
  5. Ocampo-Bautista, F.; Mussali-Galante, P.; Alvarez, L.; Marquina-Bahena, S.; Valencia-Cuevas, L.; Valencia-A, S.; Tovar-Sánchez, E. Natural Hybridization between Bursera bicolor × B. glabrifolia (Burseraceae) Complex: Molecular and Chemical Evidence. Forest 2023, 14, 1382. [Google Scholar] [CrossRef]
  6. Shang, H.; Yan, Y. Natural Hybridization and Biodiversity Conservation. Biodivers. Sci. 2017, 25, 683. [Google Scholar] [CrossRef]
  7. Whitham, T.G.; Gehring, C.A.; Lamit, L.J.; Wojtowicz, T.; Evans, L.M.; Keith, A.R.; Smith, D.S. Community specificity: Life and afterlife effects of genes. Trends Plant Sci. 2012, 17, 271–281. [Google Scholar] [CrossRef]
  8. López-Caamal, A.; Tovar-Sánchez, E. Genetic, morphological, and chemical patterns of plant hybridization. Rev. Chil. Hist. Nat. 2014, 87, 16. [Google Scholar] [CrossRef]
  9. Porretta, D.; Canestrelli, D. The ecological importance of hybridization. Trends Ecol. Evol. 2023, 38, 1097–1108. [Google Scholar] [CrossRef] [PubMed]
  10. Whitham, T.G.; Martinsen, G.D.; Keim, P.; Floate, K.D.; Dungey, H.S.; Potts, B.M. Plant hybrid zones affect biodiversity: Tools for a genetic-based understanding of community structure. Ecology 1999, 80, 416–428. [Google Scholar] [CrossRef]
  11. Soltis, P.S. Hybridization, speciation and novelty. J. Evol. Biol. 2023, 26, 291–293. [Google Scholar] [CrossRef]
  12. Whitham, T.G.; Morrow, P.A.; Potts, B.M. Plant hybrid zones as centers of biodiversity: The herbivore community of two endemic Tasmanian eucalypts. Oecologia 1994, 97, 481–490. [Google Scholar] [CrossRef] [PubMed]
  13. Tovar-Sánchez, E.; Oyama, K. Effect of hybridization of the Quercus crassifolia × Quercus crassipes complex on the community structure on endophagous insects. Oecologia 2006, 147, 702–713. [Google Scholar] [CrossRef] [PubMed]
  14. Collins, B.; White, P.; Imm, D. Introduction to ecology and management of rare plants of the Southeast. Nat Area J. 2001, 21, 4–11. [Google Scholar]
  15. Loehle, C. Endemic plant distributions in eastern North America: Implications for conservation. J. For. 2006, 104, 415–418. [Google Scholar] [CrossRef]
  16. Cartwright, J. Ecological islands: Conserving biodiversity hotspots in a changing climate. Front. Ecol. Environ. 2019, 17, 331–340. [Google Scholar] [CrossRef]
  17. Hughes, J.M.; Schmidt, D.J.; McLean, A.; Wheatley, A. Population genetic structure in stream insects: What have we learned? In Aquatic Insects: Challenges to Populations; Lancaster, J., Briers, R.A., Eds.; CAB International: Wallingford, UK, 2008; pp. 268–288. [Google Scholar] [CrossRef]
  18. Whitham, T.G.; Bailey, J.K.; Scheweitzer, J.A.; Shuster, S.M.; Bangert, R.K.; LeRoy, C.J.; Lonsdorf, E.V.; Allan, G.J.; DiFazio, S.P.; Potts, B.M.; et al. A framework for community and ecosystem genetics: Form genes to ecosystems. Nature 2006, 7, 510–523. [Google Scholar] [CrossRef]
  19. Dungey, H.S.; Potts, B.M.; Whitham, T.G.; Li, H.-F. Plant genetics affects arthropod community richness and composition: Evidence from a synthetic eucalypt hybrid population. Evolution 2000, 54, 1938–1946. [Google Scholar]
  20. Bangert, R.K.; Turek, R.J.; Martinsen, G.D.; Wimp, G.M.; Bailey, J.K.; Whitham, T.G. Benefits of conservation of plant genetic diversity to arthropod diversity. Conserv. Biol. 2005, 19, 379–390. [Google Scholar] [CrossRef]
  21. Valencia-Cuevas, L.; Tovar-Sánchez, E. Oak canopy arthropod communities: Which factors shape its structure? Rev. Chil. Hist. Nat. 2015, 88, 15. [Google Scholar] [CrossRef]
  22. Whitehead, S.R.; Bass, E.; Corrigan, A.; Kessler, A.; Poveda, K. Interaction diversity explains the maintenance of phytochemical diversity. Ecol. Lett. 2021, 24, 1205–1214. [Google Scholar] [CrossRef]
  23. Valencia, S. Diversidad del género Quercus en México. Bol. Soc. Bot. Méx. 2004, 75, 33–53. [Google Scholar] [CrossRef]
  24. Valencia-Cuevas, L.; Piñero, D.; Mussali-Galante, P.; Valencia, S.; Tovar-Sánchez, E. Effect of a red oak species gradient on genetic structure and diversity of Quercus castanea (Fagaceae) in Mexico. Tree Genet. Genomes 2014, 10, 641–652. [Google Scholar] [CrossRef]
  25. Valencia-Cuevas, L.; Mussali-Galante, P.; Piñero, D.; Castillo-Mendoza, E.; Rangel-Altamirano, G.; Tovar-Sánchez, E. Hybridization of Quercus castanea (Fagaceae) across a red oak species gradient in Mexico. Plant Syst. Evol. 2015, 301, 1085–1097. [Google Scholar] [CrossRef]
  26. Ellison, A.M.; Bank, M.S.; Clinton, B.D.; Colburn, E.A.; Elliott, K.; Ford, C.R.; Foster, D.R.; Kloeppel, B.D.; Knoepp, J.D.; Lovett, G.M.; et al. Loss of foundation species: Consequences for the structure and dynamics of forested ecosystems. Front. Ecol. Environ. 2005, 3, 479–486. [Google Scholar] [CrossRef]
  27. Valencia-Cuevas, L.; Mussali-Galante, P.; Cano-Santana, Z.; Pujade-Villar, J.; Equihua-Martínez, A.; Tovar-Sánchez, E. Genetic variation in foundation species governs the dynamics of trophic interactions. Curr. Zool. 2018, 64, 13–22. [Google Scholar] [CrossRef] [PubMed]
  28. Hunter, M.D.; Varley, G.C.; Gradwell, G.R. Estimating the relative roles of top-down and bottom-up forces on insect herbivore populations: A classic study revisited. Proc. Natl. Acad. Sci. USA 1997, 94, 9176–9181. [Google Scholar] [CrossRef]
  29. Tovar-Sánchez, E.; Oyama, K. Natural hybridization and hybrid zones between Quercus crassifolia and Quercus crassipes (Fagaceae) in Mexico: Morphological and molecular evidence. Am. J. Bot. 2004, 91, 1352–1363. [Google Scholar] [CrossRef]
  30. Cheng, D.; Vrieling, K.; Klinkhammer, P.G.L. The effect of hybridization on secondary metabolites and herbivore resistance: Implications for the evolution of chemical diversity in plants. Phytochem. Rev. 2011, 10, 107–117. [Google Scholar] [CrossRef]
  31. Wimp, G.M.; Wooley, S.; Bangert, R.K.; Young, W.P.; Martinsen, G.D.; Keim, P.; Rehill, B.; Lindroth, R.L.; Whitham, T.G. Plant genetics predicts intra-annual variation in phytochemistry and arthropod community structure. Mol. Ecol. 2007, 16, 5057–5069. [Google Scholar] [CrossRef]
  32. Diario Oficial de la Federación: Decreto de Expropiación: pp. 31–39. 28 de junio, 1989. 1989. Available online: https://dof.gob.mx/nota_to_pdf.php?fecha=10/07/1989&edicion=MAT (accessed on 1 January 2025).
  33. Tovar-Sanchez, E. Canopy arthropods community within and among oak species in central Mexico. Current Zool. 2009, 55, 132–144. [Google Scholar] [CrossRef]
  34. White, E.S.; Reyes, C.M.; Ortega, R.J.; Valastro, S., Jr. El Ajusco: Geomorfología Volcánica y Acontecimientos Glaciales Durante el Pleistoceno Superior y Comparación con las Series Glaciales Mexicanas y de las Montañas Rocallosas. Colección Científica 212; INAH: Mexico City, Mexico, 1990; p. 77. [Google Scholar]
  35. Rzedowski, J. Vegetación del Pedregal de San Ángel, Distrito Federal México. In Reserva Ecológica del Pedregal de San Ángel: Ecología, Historia Natural y Manejo; Rojo, A., Ed.; UNAM: Mexico City, Mexico, 1994; pp. 9–65. [Google Scholar]
  36. Valencia, S. Contribución al Conocimiento del Género Quercus (Fagaceae) en el Estado de Guerrero, México; Contribuciones del Herbario de la Facultad de Ciencias, UNAM: Mexico City, Mexico, 1995; p. 154. [Google Scholar]
  37. Vázquez, M.L. Trichome morphology in selected Mexican red oak species (Quercus section Lobatae). Sida Contribut. Bot. 2006, 22, 1091–1110. [Google Scholar]
  38. Rzedowski, G.C.D.; Rzedowski, J. Flora Fanerogámica del Valle de México; Comisión Nacional para el Conocimiento y Uso de la Biodiversidad: Mexico City, Mexico, 2001. [Google Scholar]
  39. Vähä, J.P.; Primmer, C.R. Efficiency of model-based Bayesian methods for detecting hybrid individuals under different hybridization scenarios and with different numbers of loci. Mol. Ecol. 2006, 15, 63–72. [Google Scholar] [CrossRef] [PubMed]
  40. Wilson, C.L. Plant epidermal sections and imprints using cyanoacrylate adhesives. Can J. Plant Sci. 1981, 61, 781–783. [Google Scholar] [CrossRef]
  41. Rohlf, F.J. tpsDig; Department of Ecology and Evolution, State University of New York: Stony Brook, NY, USA, 2010. [Google Scholar]
  42. Klingenberg, C.P.; Barluenga, M.; Meyer, A. Shape analysis of symmetric structures: Quantifying variation among individuals and asymmetry. Evolution 2002, 56, 1909–1920. [Google Scholar] [CrossRef]
  43. Fried, B.; Sherma, J. Practical Thin-Layer Chromatography: A Multidisciplinary Approach; CRC Press: Boca Raton, FL, USA, 1996. [Google Scholar]
  44. Kjeldahl, C. A new method for the determination of nitrogen in organic matter. Fresenius J. Anal. Chem. 1883, 22, 366. [Google Scholar]
  45. Zar, J.H. Biostatistical Analysis; Prentice-Hall, Inc.: Upper Saddle River, NJ, USA, 2010. [Google Scholar]
  46. Schwarzbach, A.E.; Donovan, L.A.; Rieseberg, L.H. Transgressive character expression in a hybrid sunflower species. Am. J. Bot. 2001, 88, 270–277. [Google Scholar]
  47. Wickham, H. ggplot2: Elegant Graphics for Data Analysis; Springer: New York, NY, USA, 2016; ISBN 978-3-319-24277-4. Available online: https://ggplot2.tidyverse.og (accessed on 1 January 2025).
  48. Faith, D.P.; Minchin, P.R.; Belbin, L. Compositional dissimilarity as a robust measure of ecological distance. Vegetatio 1987, 69, 57–68. [Google Scholar] [CrossRef]
  49. Warwick, R.M.; Clarke, K.R. A statistical analysis of coral community responses to the 1982–1983 El Nino in the thousand islands, Indonesia. Coral Reefs 1990, 8, 171–179. [Google Scholar] [CrossRef]
  50. Howard, D.J.; Preszler, R.W.; Williams, J.; Fenchel, S.; Boecklen, W.J. How discrete are oaks species? Insights from a hybrid zone between Quercus grisea and Quercus gambelii. Evolution 1997, 51, 747–755. [Google Scholar] [CrossRef]
  51. Statsoft, Inc. STATISTICA for Windows; Statsoft, Inc.: Tulsa, OK, USA, 2007. [Google Scholar]
  52. Hammer, Ø.; Harper, D.A.T.; Ryan, P.D. PAST: Paleontological statistics software package for education and data analysis. Palaeontol. Electron. 2001, 4, 9. [Google Scholar]
  53. Craft, K.J.; Ashley, M.V.; Koenig, W.D. Limited hybridization between Quercus lobata and Quercus douglasii (Fagaceae) in a mixed stand in central coastal California. Am. J. Bot. 2002, 89, 1792–1798. [Google Scholar] [CrossRef] [PubMed]
  54. Cornelissen, T.; Stiling, P. Perfect is best: Low leaf fluctuating asymmetry reduces herbivory by leaf miners. Oecologia 2005, 142, 46–56. [Google Scholar] [CrossRef]
  55. Cornelissen, T.; Stiling, P. Small variations over large scales: Fluctuating asymmetry over the range of two oak species. Inter. J. Plant Scie. 2010, 171, 303–309. [Google Scholar]
  56. Cattell, M.V.; Stilling, P. Tritrophic interactions and trade-offs in herbivore fecundity on hybridising host plants. Ecol. Entomol. 2004, 29, 255–263. [Google Scholar] [CrossRef]
  57. Albarrán-Lara, A.L.; Mendoza-Cuenca, L.; Valencia-Avalos, S.; Gonzalez-Rodriguez, A.; Oyama, K. Leaf fluctuating asymmetry increases with hybridization and introgression between Quercus magnoliifolia and Quercus resinosa (Fagaceae) through an altitudinal gradient in Mexico. Int. J. Plant Sci. 2010, 171, 310–322. [Google Scholar] [CrossRef]
  58. Wilsey, B.J.; Haukioja, E.; Koricheva, J.; Sulkinoja, M. Leaf fluctuating asymmetry increases with hybridization and elevation in tree-line birches. Ecology 1998, 79, 2092–2099. [Google Scholar] [CrossRef]
  59. Leary, R.F.; Allendorf, F.W. Fluctuating asymmetry as an indicator of stress: Implications for conservation biology. Trends Ecol. Evol. 1989, 4, 214–217. [Google Scholar] [CrossRef]
  60. Cuevas-Reyes, P.; Canché-Delgado, A.; Maldonado-López, Y.; Fernandes, G.W.; Oyama, K.; González-Rodríguez, A. Patterns of herbivory and leaf morphology in two Mexican hybrid oak complexes: Importance of fluctuating asymmetry as indicator of environmental stress in hybrid plants. Ecol. Indic. 2018, 90, 164–170. [Google Scholar] [CrossRef]
  61. Hochwender, C.G.; Fritz, S. Fluctuating asymmetry in a Salix hybrid system: The importance of genetic versus environmental causes. Evolution 1999, 53, 408–416. [Google Scholar]
  62. Huber, D.P.W.; Bohlmann, J. Terpene synthases and the mediation of plant–insect ecological interactions by terpenoids: A mini-review. In Plant Adaptation: Molecular Genetics and Ecology, Proceedings of an International Workshop Vancouver, British Columbia, Canada, 11–13 December 2002; Cronk, Q.C.B., Whitton, J., Ree, H.E., Taylor, I.E.P., Eds.; NRC Research Press: Ottawa, ON, Canada, 2004; pp. 70–81. [Google Scholar]
  63. Ninkuu, V.; Zhang, L.; Yan, J.; Fu, Z.; Yang, T.; Zeng, H. Biochemistry of Terpenes and Recent Advances in Plant Protection. Int. J. Mol. Sci. 2021, 22, 5710. [Google Scholar] [CrossRef]
  64. Wang, C.; Chen, H.; Li, T.; Weng, J.; Jhan, Y.; Lin, S.; Chou, C. The Role of Pentacyclic Triterpenoids in the Allelopathic Effects of Alstonia scholaris. J. Chem. Ecol. 2014, 40, 90–98. [Google Scholar] [CrossRef] [PubMed]
  65. Castillo-Mendoza, E.; Salinas-Sánchez, D.; Valencia-Cuevas, L.; Zamilpa, A.; Tovar-Sánchez, E. Natural hybridisation among Quercus glabrescens, Q. rugosa and Q. obtusata (Fagaceae): Microsatellites and secondary metabolites markers. Plant Biol. 2019, 21, 110–121. [Google Scholar] [CrossRef] [PubMed]
  66. El-Hagrassi, A.M.; Ali, M.M.; Osman, A.F.; Shaaban, M. Phytochemical investigation and biological studies of Bombax malabaricum flowers. Nat. Product Res. 2011, 25, 141–151, ISSN 1029-2349. [Google Scholar] [CrossRef] [PubMed]
  67. Hernández, L.; Palazon, J.; Navarro-Ocaña, A. The Pentacyclic Triterpenes α, β-amyrins: A Review of Sources and Biological Activities. In Phytochemicals—A Global Perspective of Their Role in Nutrition and Health; Rao, V., Ed.; IntechOpen: London, UK, 2012; pp. 487–502. ISBN 978-953-51-0296-0. [Google Scholar]
  68. Volf, M.; Renoult, S.A.; Panthee, S.; van Dam, N.M. Quantifying various aspects of chemical diversity in hybrid plants can help understanding ecological consequences of hybridization. Am. J. Bot. 2024, 111, e16283. [Google Scholar] [CrossRef]
  69. Costantini, D. Oxidative Stress and Hormesis in Evolutionary Ecology and Physiology: A Marriage Between Mechanistic and Evolutionary Approaches, 1st ed.; Springer Science & Business Media: Berlin, Germany, 2014. [Google Scholar]
  70. Barbehenn, R.V.; Niewiadomski, J.; Pecci, C. Physiological benefits of feeding in the spring by Lymantria dispar caterpillars on red oak and sugar maple leaves: Nutrition versus oxidative stress. Chemoecology 2013, 23, 59–70. [Google Scholar] [CrossRef]
  71. Schädler, M.; Jung, G.; Auge, H.; Brandl, R. Does the Fretwell–Oksanen model apply to invertebrates? Oikos 2003, 100, 203–207. [Google Scholar] [CrossRef]
  72. van der Heijden, M.G.A.; Bardgett, R.D.; van Straalen, N.M. The unseen majority: Soil microbes as drivers of plant diversity and productivity in terrestrial ecosystems. Ecol. Lett. 2008, 11, 296–310. [Google Scholar] [CrossRef]
  73. Kirk, H.; Choi, Y.H.; Kim, H.K.; Verpoorte, R.; Van Der Maijden, E. Comparing metabolomes: The chemical consequences of hybridization in plants. New Phytol. 2005, 167, 613–622. [Google Scholar] [CrossRef]
  74. Lamit, L.J.; Wojtowicz, T.; Kovacs, Z.; Wooley, S.C.; Zinkgraf, M.; Whitham, T.G.; Lindroth, R.L.; Gehring, C.A. Hybridization among foundation tree species influences the structure of associated understory plant communities. Botany 2011, 89, 165–174. [Google Scholar] [CrossRef]
  75. Wimp, G.M.; Martinsen, G.D.; Floate, K.D.; Bangert, R.K.; Whitham, T.G. Plant genetic determinants of arthropod community structure and diversity. Evolution 2005, 59, 6–169. [Google Scholar] [CrossRef]
  76. Bailey, J.K.; Deckert, R.; Schweitzer, J.A.; Rehill, B.J.; Lindroth, R.L.; Gehring, C.; Whitham, T.G. Host plant genetics affect hidden ecological players: Links among Populus, condensed tannins, and fungal endophyte infection. Canad. J. Bot. 2005, 83, 356–361. [Google Scholar]
  77. LeRoy, C.J.; Whitham, T.G.; Keim, P. Plant genes link forests and streams. Ecology 2006, 87, 255–261. [Google Scholar] [CrossRef] [PubMed]
  78. Pérez-López, G.; González-Rodríguez, A.; Oyama, K.; Cuevas-Reyes, P. Effects of plant hybridization on the structure and composition of a highly rich community of cynipid gall wasps: The case of the oak hybrid complex Quercus magnoliifolia x Quercus resinosa in Mexico. Biodivers. Conserv. 2016, 25, 633–651. [Google Scholar] [CrossRef]
  79. Bangert, R.K.; Turek, R.J.; Rehill, B.; Wimp, G.M.; Schweitzer, J.A.; Allan, G.J.; Bailey, J.K.; Martinsen, G.D.; Leim, P.; Lindroth, R.L.; et al. A genetic similarity rule determines arthropod community structure. Mol. Ecol. 2006, 15, 1379–2139. [Google Scholar] [CrossRef] [PubMed]
  80. Fritz, R.S.; Moulia, C.; Newcombe, G. Resistance of hybrid plants and animals to herbivores, pathogens, and parasites. Ann. Rev. Ecol. Syst. 1999, 35, 565–591. [Google Scholar]
  81. Caseys, C.; Stritt, C.; Glauser, G.; Blanchard, T.; Lexer, C. Effects of hybridization and evolutionary constraints on secondary metabolites: The genetic architecture of phenylpropanoids in European Populus species. PLoS ONE 2015, 10, e0128200. [Google Scholar] [CrossRef]
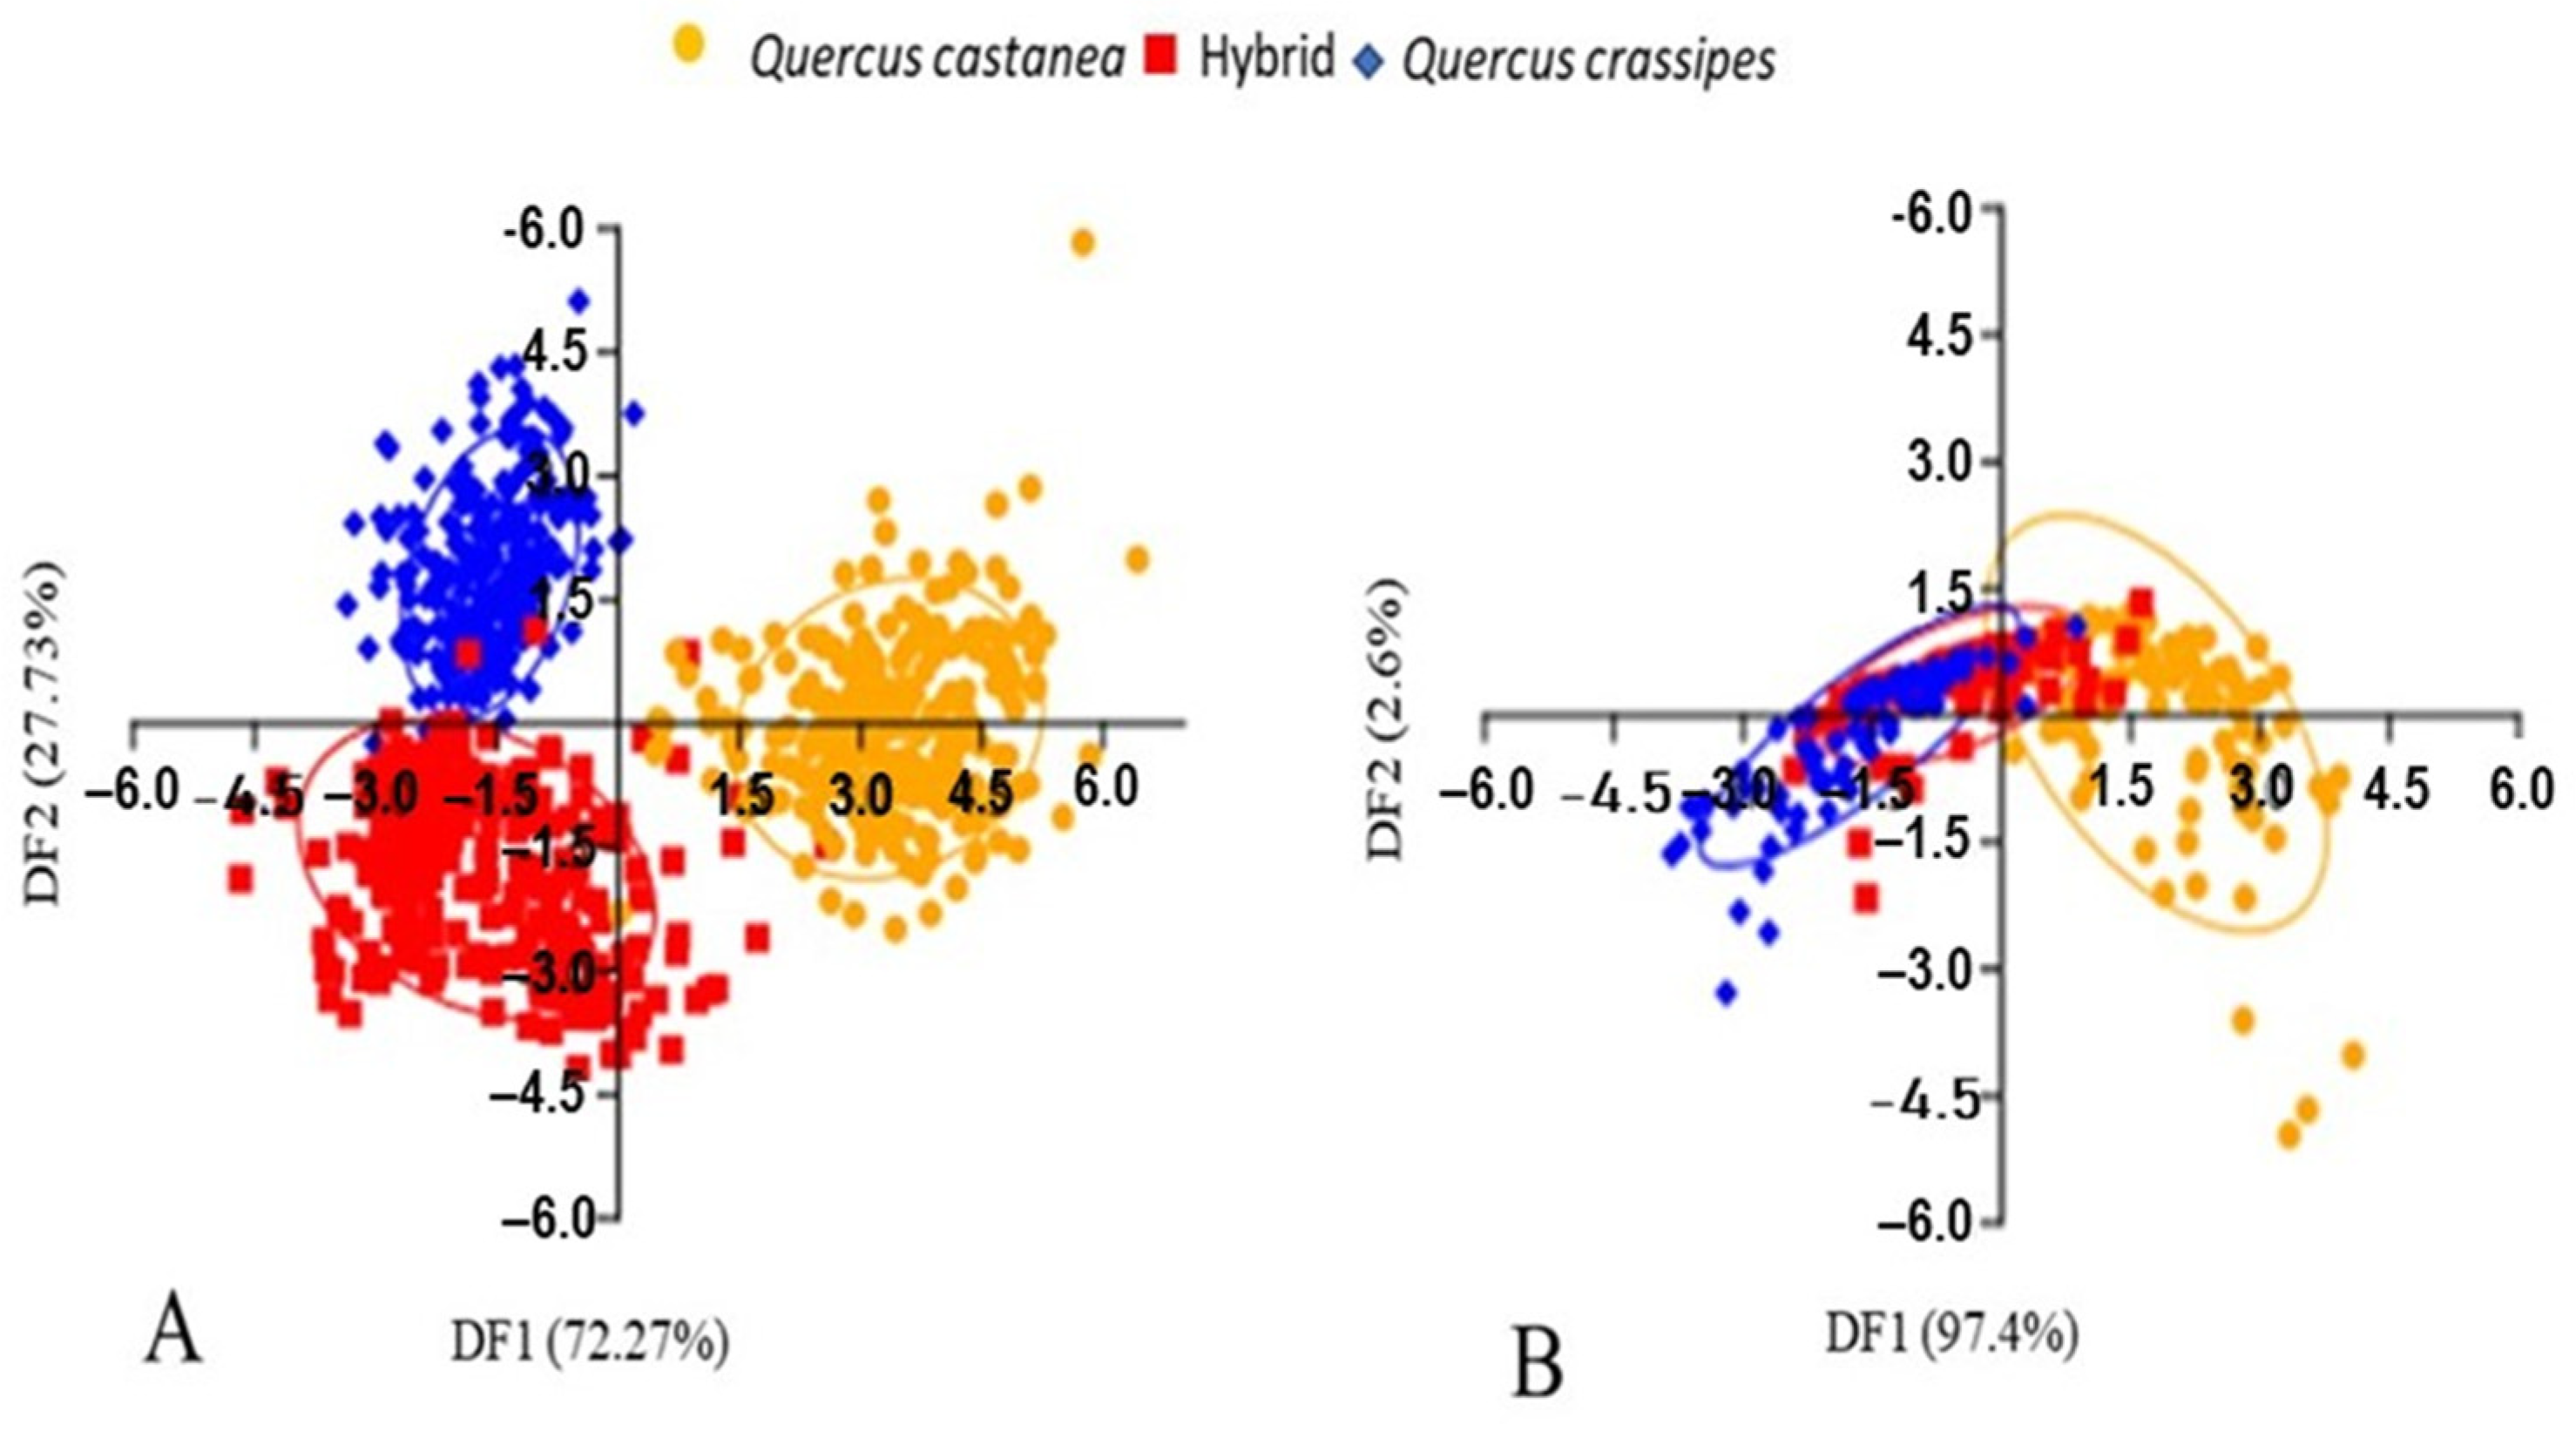
Figure 1. Plot of Discriminant Function Analysis (DFA) performed utilizing all macro (A) and micro-morphological traits (stomata) (B) of Quercus castanea (orange circles), hybrid (red squares), and Q. crassipes (blue diamonds) in central Mexico. Discriminant function axes values: macro (DF1 = 72.27% and DF2 = 27.73%) and micromorphology (DF1 = 97.4% and DF2 = 2.6%). Confidence ellipses at 75%.
Diversity 17 00264 g001
Figure 2. Principal component analysis shows the average shape for each individual: Quercus castanea (orange circles), hybrid (red squares), and Q. crassipes (blue diamonds) in central Mexico. Confidence ellipse at 75%.
Diversity 17 00264 g002
Figure 3. NMDS of secondary metabolites (A) and nutritional chemicals (B) of Quercus castanea (orange circles), hybrid (red squares), and Q. crassipes (blue diamonds) in central Mexico. Confidence ellipses at 75%.
Diversity 17 00264 g003
Table 1. List of the leaf macro- and micro-morphological characters examined for the Q. castanea × Q. crassipes complex in a hybrid zone in central Mexico.
AbbreviationsDescription
Macro-morphological characters
PLLength of petiole
LLLength of lamina
TLLTotal leaf length (LL + LP)
MWLMaximal width of lamina
HMWHeight of maximal width (length of lamina from base to widest part)
PDPetiole diameter
MDMidvein diameter
NVNumber of veins
LWBLeaf width at basal 1/3 of leaf
LWALeaf width at apical 1/3 of leaf
NANumber of aristae
LLBWLength of lamina from base to widest part (LL—HMW)
Combinations of characters
P (%)Length of petiole × 100/total leaf length
HW (%)Height of maximal width × 100/total leaf length
DW (%)Length of lamina from base to widest part × 100/total leaf length
LL/MWLLength of lamina/maximal width of lamina
LLBW/MWLLength of lamina from base to widest part/maximal width of lamina
Micro-morphological characters
(stomata)
SLStomata length
SWStomata width
SCStomata coverture [(Stoma length + Stoma width)/4]2 π
SDStomata density at 40x
Table 2. Mean ± standard error and ANOVA results (F statistics) for all macro- and micro-morphological characters of Quercus castanea, hybrids, and Q. crassipes in central Mexico. Different letters indicate significant differences between taxa (Tukey test p < 0.05). F significant at p < 0.001 (***), p <0.01 (**), ns = no significant; (−) = negative. Abbreviations of characters are described in Table 1.
CharacterUnitsQ. castaneaHybridQ. crassipesF Taxa
(df = 2807)
Hybrid Phenotype
Macro-morphological characters
PLcm0.45 ± 0.01 a0.43 ± 0.01 a0.34 ± 0.07 b30.86 ***Q. castanea-like
LLcm6.24 ± 0.09 a5.70 ± 0.09 ab4.73 ± 0.05 b87.40 **intermediate
TLLcm6.69 ± 0.09 a6.13 ± 0.09 ab5.08 ± 0.06 b90.20 **intermediate
MWLcm2.19 ± 0.04 a1.67 ± 0.02 ab1.39 ± 0.01 b226.49 **intermediate
HMWcm4.17 ± 0.07 a2.91 ± 0.04 ab2.67 ± 0.04 b225.10 **intermediate
PDmm1.14 ± 0.06 a0.90 ± 0.01 b0.92 ± 0.00 b11.87 ***Q. crassipes-like
MDmm0.08 ± 0.01 a0.05 ± 0.01 c0.07 ± 0.01 b398.49 **transgressive (−)
NVNo.18.31 ± 0.28 a22.1 ± 0.28 ab24.09 ± 0.21 b161.10 **intermediate
LWBcm1.79 ± 0.02 a1.41 ± 0.02 ab1.30 ± 0.01 b134.95 **intermediate
LWAcm2.05 ± 0.03 a1.58 ± 0.02 ab1.27 ± 0.01 b229.50 **intermediate
NANo.8.60 ± 0.16 a2.21 ± 0.11 ab1.00 ± 0.00 b1514.98 **intermediate
LLBWcm3.89 ± 0.06 a2.54 ± 0.04 b2.40 ± 0.04 b256.83 **Q. crassipes-like
Combinations of characters
P%6.77 ± 0.15 a7.19 ± 0.13 a6.79 ± 0.10 a3.42 nsparental-like
HW%62.54 ± 0.57 a47.86 ± 0.33 ab52.63 ± 0.49 b264.51 **intermediate
DW%58.19 ± 0.52 a41.66 ± 0.34 c47.19 ± 0.50 b322.69 **transgressive (−)
LL/MWL 1.53 ± 0.02 a1.96 ± 0.01 ab2.36 ± 0.05 b148.68 **intermediate
LLBW/MWL 1.78 ± 0.02 a1.52 ± 0.01 c1.72 ± 0.02 b52.09 **transgressive (−)
Micro-morphological characters
SLµm27.44 ± 0.29 a23.03 ± 0.29 ab20.57 ± 0.29 b135.10 **intermediate
SWµm18.24 ± 0.27 a14.61 ± 0.27 b14.02 ± 0.27 b68.18 **Q. crassipes-like
SCµm2415.20 ± 7.85 a281.30 ± 7.85 ab237.80 ± 7.85 b138.60 **intermediate
SDNo./µm23.30 ± 0.02 a3.18 ± 0.02 b3.12 ± 0.02 b16.74 ***Q. crassipes-like
Table 3. Procrustes ANOVA. Directional asymmetry (side) and fluctuating asymmetry (individual: side) of Quercus castanea, hybrids, and Q. crassipes in central Mexico.
TaxaSourcedfSSMSRsqFZPr (>F)
Q. castanea
individual80.180750.0225940.188315.49517.2910.001
side10.154130.1541350.1605837.48766.62670.001
individual: side1520.624970.0041120.65111
Total1610.95985
Q. crassipes
individual70.167570.0239390.2970414.37513.81550.001
side10.165090.1650870.2926399.1317.81660.001
individual: side1390.231480.0016650.41033
Total1470.56414
Hybrid
individual80.292370.0365470.273839.67289.45560.001
side10.185920.1859240.1741349.20857.64010.001
individual: side1560.589410.0037780.55203
Total1651.06771
Table 4. Species-specific markers for parental species Quercus castanea and Q. crassipes and novel compounds produced in putative hybrids (Q. castanea × Q. crassipes).
Compound NameCompound TypeRetention TimeChemical Formula
Q. castanea
Oleic acidFatty acid20.98Diversity 17 00264 i001
2,6,10,14,18,22-tetracosahexane, 2,6,10,15,19,23-hexamethyl-. (all-E)-Triterpene29.31Diversity 17 00264 i002
FriedelinTriterpene41.52Diversity 17 00264 i003
Q. crassipes
NonacosanolAlcohol28.616Diversity 17 00264 i004
2-Cyclohexen-1-one,4-(3-hydroxybutyl)-3,5,5-trimethylMonoterpene16.62Diversity 17 00264 i005
10-Octadecenoic acid, methyl esterFatty acid20.33Diversity 17 00264 i006
Hybrids
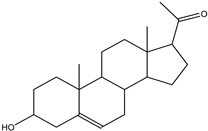
PregnenoloneSteroid27.82Diversity 17 00264 i007
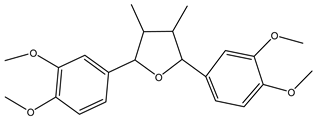
Furan,2,5-bis(3,4-dimethoxyphenyl)tetrahydro-3,4-dimethyl-,[2R-(2a,3b,4b,5a)]Lignan30.75Diversity 17 00264 i008
2-Pentadecanone,6,10,14-
trimethyl-
Isoprenoide 17.82Diversity 17 00264 i009
8,11-Ocatdecadienoic acid, methyl esterFatty acid20.26Diversity 17 00264 i010
3,7,11,15-Tetramethylhexadeca-1,6,10,14-tetraen-3-olDiterpene alcohol19.68Diversity 17 00264 i011
Benzenepropanol,4-hydroxy-α-methyl-,(R)-Monoterpene15.03Diversity 17 00264 i012
3,7,11,15-Tetramethylhexadeca-1,6,10,14-tetraen-3-olDiterpene alcohol19.68Diversity 17 00264 i011
D;B-Friedo-B;A:-neogammacer-5-en-3-ol,(3B)-Triterpene38.11Diversity 17 00264 i013
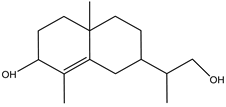
2-Naphthalenol,2,3,4,4a,5,6,7-octahydro-1,4a-dimethyl-7-(2-hydroxy-1-methylethyl)Sesquiterpene18.204Diversity 17 00264 i014
Table 5. Mean ± standard error and ANOVA results (F statistics) for four nutritional characters of Quercus castanea, hybrid, and Q. crassipes in central Mexico. Different letters indicate significant differences between taxa (Tukey test p < 0.05). F significant at p < 0.001 (***), p < 0.05 (*), ns = no significant.
Nutritional CharacterUnitsQ. castaneaHybridQ. crassipesFTaxa
(df = 2, 24)
Hybrid Phenotype
Carbon%21.53 ± 0.91 a23.34 ± 0.89 a21.56 ± 0.74 a1.269 nsparental-like
Nitrogen%1.03 ± 0.06 a0.97 ± 0.14 a1.34 ± 0.07 b3.542 *Q. castanea-like
Total phosphorousppm3.39 ± 0.18 a4.37 ± 0.18 ab4.53 ± 0.18 b10.97 ***intermediate
C/N ratio 21.06 ± 1.92 a29.42 ± 5.54 b15.49 ± 1.78 c5.197 *Transgressive (+)
Disclaimer/Publisher’s Note: The statements, opinions and data contained in all publications are solely those of the individual author(s) and contributor(s) and not of MDPI and/or the editor(s). MDPI and/or the editor(s) disclaim responsibility for any injury to people or property resulting from any ideas, methods, instructions or products referred to in the content.