Article

Diversity and Composition of Soil Microbes Associated with Barringtonia racemosa Communities

1
College of Biology and Pharmacy, Yulin Normal University, Yulin 537000, China
2
Key Laboratory of Mountain Biodiversity Conservation, Education Department of Guangxi Zhuang Autonomous Region, Yulin Normal University, Yulin 537000, China
3
Guangxi Subtropical Crops Research Institute, Guangxi Academy of Agricultural Sciences, Nanning 530001, China
4
Guangxi Key Laboratory of Quality and Safety Control for Subtropical Fruits, Nanning 530001, China
5
College of Smart Agriculture, Yulin Normal University, Yulin 537000, China
6
Guangxi Zhuang Autonomous Region Engineering Research Center of Facility Agriculture, Yulin 537000, China
*
Author to whom correspondence should be addressed.
These authors contributed equally to this work.
Diversity 2025, 17(4), 249; https://doi.org/10.3390/d17040249
Submission received: 1 March 2025 / Revised: 24 March 2025 / Accepted: 25 March 2025 / Published: 30 March 2025

Abstract

:
Understanding soil microbial community assembly in endangered mangrove ecosystems is crucial for ecological conservation. This study investigated the diversity and drivers of soil microbiomes across Barringtonia racemosa communities (pure: T1; associated: T2, T3) in China’s Leizhou Peninsula, using SMRT sequencing and phospholipid fatty acid analysis. The results reveal that pure B. racemosa communities (T1) harbored the highest microbial diversity (Chao1: 2980 bacteria, 14,378 fungal OTUs), with Pseudomonadota (37.6%) and Ascomycota (52.6%) as dominant phyla. Fungal communities exhibited 3.2-fold higher β-diversity variability than bacteria across communities (Bray–Curtis; p < 0.01). Redundancy analysis identified soil organic carbon (SOC), available nitrogen (SAN), and leaf manganese as primary drivers, collectively explaining 72.4% of microbial variation (p = 0.003). Notably, pure communities showed an elevated SOC (74.3 mg/kg) and fungal: bacterial ratio (0.19 vs. 0.13–0.14 in associated communities), indicating fungal dominance in carbon-rich sediments. Conversely, rice field controls displayed distinct SAP/SAK patterns reflecting agricultural impacts. These findings demonstrate that the B. racemosa community structure differentially regulates fungal assemblages more strongly than bacterial communities, providing critical insights for mangrove restoration through microbial-informed management.

1. Introduction

Mangrove forests are unique intertidal ecosystems that serve as critical buffer zones between terrestrial and marine environments, providing indispensable coastal protection services through wave attenuation and sediment stabilization [1]. These forests provide various beneficial services, including carbon sequestration, nutrient cycling, and sediment stabilization [2,3,4]. They are rich in organic matter and thus support diverse microbial communities, including bacteria, fungi, and actinomycetes [5,6]. As the major soil microbial communities, bacteria regulate organic matter breakdown, and nutrient cycling [7], and drive various ecosystem processes [8]. However, the composition and diversity of microbes in the mangrove communities remain less studied compared with other terrestrial and marine environments.
Studies have identified a feedback interaction between plants and microorganisms in soil [9,10]. The plant roots provide nutrients and habitats for microorganisms, while the microbes regulate plant processes [11]. Specifically, the composition of microbial communities in the subsurface soil plays a crucial role in shaping plant traits, influencing plant species richness and diversity, and, ultimately, ecosystem productivity [12]. Therefore, understanding the changes in microbial traits will help us assess the impact of environmental changes on the structure and functions of plants, such as the mangroves.
Soil properties, like pH, moisture, and nutrient availability, greatly influence the composition of microbial communities [13]. Studies on mangrove ecosystems have proven that the impact of these factors on soil microbes differs at the regional scale [14]. Investigating this interaction at a smaller spatial scale, like the community scale, is necessary to address various ecological concerns, such as species coexistence. Various environmental factors, including biotic and abiotic ones, influence the abundance and diversity of soil microbes [15,16]. Moreover, the impact of the rhizosphere on microbial traits, particularly community diversity and structure, differs from that of the bulk soils [17]. However, the effects of various factors on soil microbes in mangrove ecosystems remain elusive.
Research on soil microbes in the mangrove ecosystems of China is limited compared with other countries. Studies have shown differences in rhizosphere microbial communities among mangrove species, with the microbial species diversity linked to soil organic matter and pH [18,19]. Barringtonia racemosa represents a characteristic semi-mangrove species; however, it exhibits greater vulnerability to direct anthropogenic disturbances relative to true mangrove species. In recent years, due to severe anthropogenic disturbances to its habitat, the wild resources of B. racemosa in China have continued to deteriorate, with declining habitat quality and intensified habitat fragmentation, making its conservation situation increasingly critical. The China Biodiversity Red List (Volume of Higher Plants), published in 2013, has classified B. racemosa as an endangered plant in China [20]. Recent studies have systematically investigated its physiological and biochemical responses to combined flooding and salinity stress [21], and the effects of cadmium on the species’ drought stress response [22]. Furthermore, field studies have demonstrated that these physiological adaptations occur within a complex ecological context, where interspecific competition and survival pressures significantly influence population dynamics in mainland China’s B. racemosa habitats [23].However, the community composition and structure of soil microbes in the pure and associated communities of B. racemosa remain unknown. Understanding these aspects is essential for elucidating their roles in assisting plant growth and protecting mangrove ecosystems.
Therefore, the present study investigated the factors influencing the composition, diversity, and function of soil microbes in the coastal mangrove wetlands of the Leizhou Peninsula of China. We analyzed the differences in soil physicochemical properties, plant traits, and microbial variables among various B. racemosa communities. We hypothesized that leaf traits and soil nutrient input would influence the response of soil bacterial and fungal communities in pure and associated communities of B. racemosa. Thus, the specific objectives of the study were to (i) examine the variations in soil properties, vegetation communities, and microbial characteristics across distinct B. racemosa communities; (ii) assess the variations in fungal and bacterial diversity under different community types; and (iii) determine the major factors influencing the soil microbial community composition and diversity across mangrove ecosystems.

2. Materials and Methods

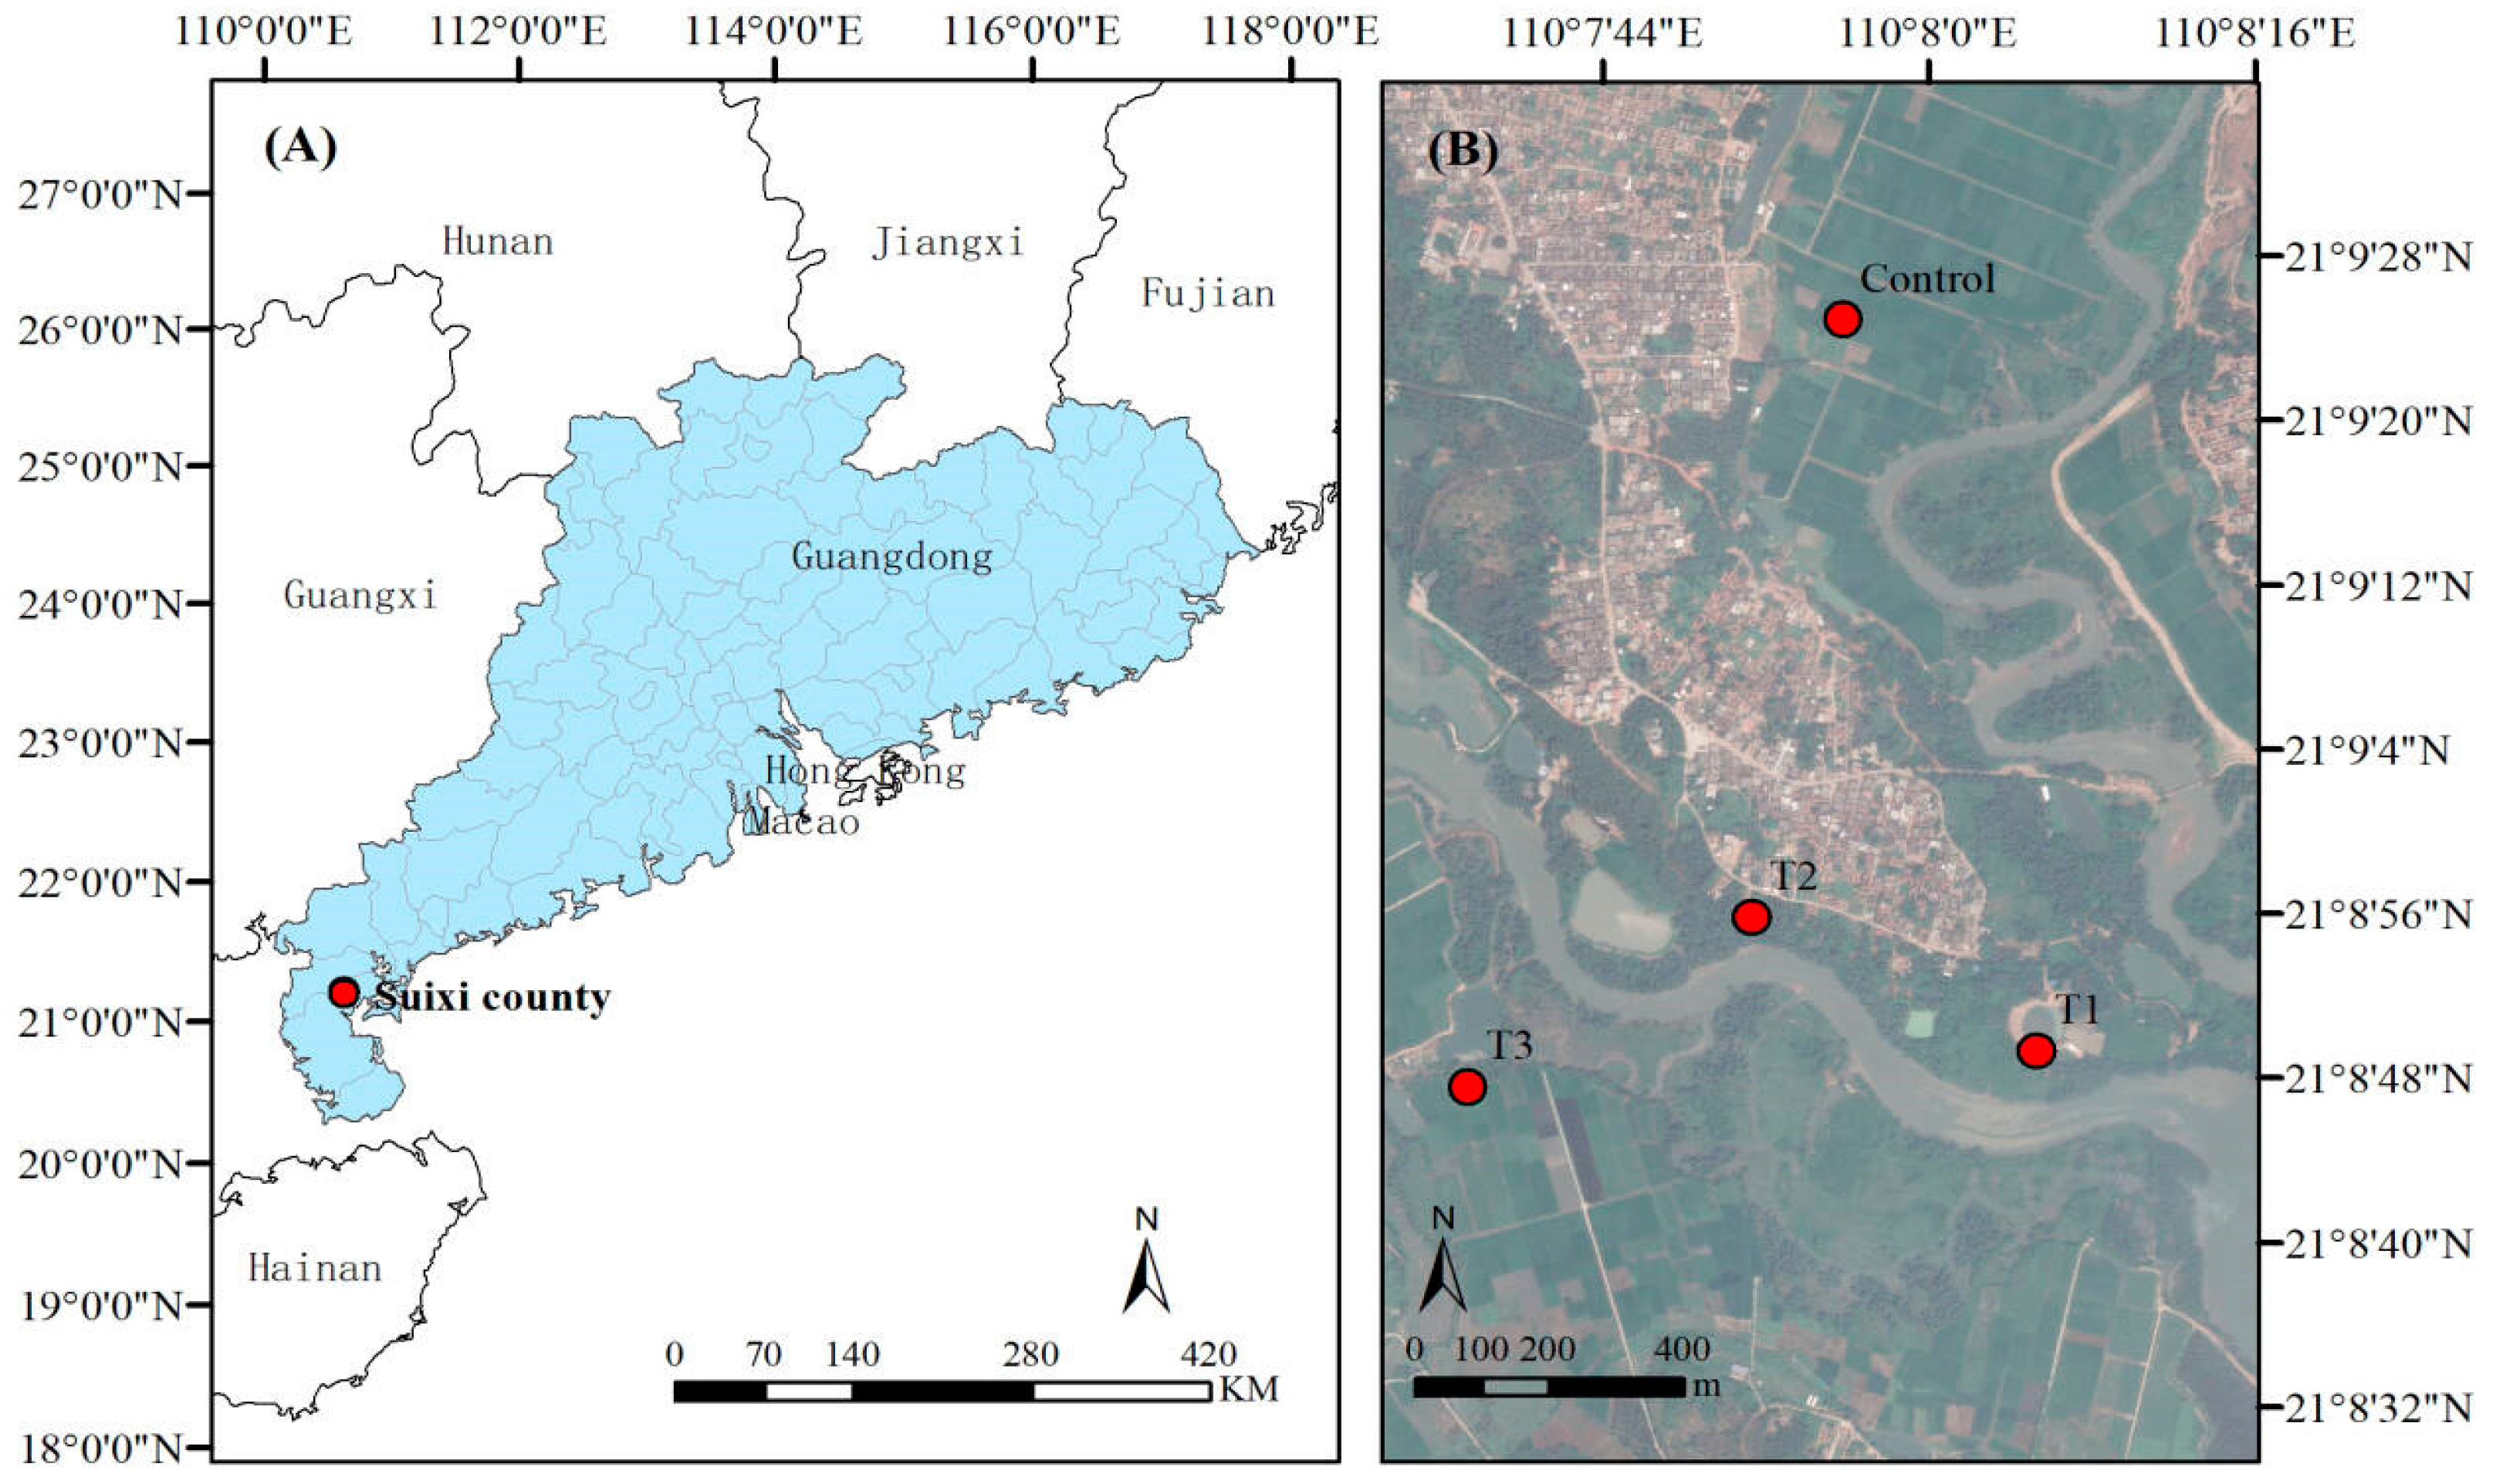
2.1. Study Sites and Sample Collection

The Leizhou Peninsula, with the largest expanse of mangrove forests in Guangdong Province, has been designated a mangrove reserve since 1991 [24]. Over the past five years, the region has experienced an annual average temperature of 23.86 °C and received an average yearly precipitation of 1910.96 mm, according to meteorological data obtained from the WorldClim data website (https://www.worldclim.org/data/monthlywth.html#). This location harbors the largest known B. racemosa community in mainland China. The soil and plant samples for this study were collected from the mangrove communities in the coastal regions situated in the Xibian Village Group (21°8′50.00″ N/110°8′2.00″ E; 21°9′10.30″ N/110°8′2.90″ E) and the Xipo Village (110°07′34″ E; 21°08′50″ N) in the Chengyue Town of Suixi County (Zhanjiang City, Guangdong Province, China; Table 1 and Figure 1).
Three sites (T1, T2, and T3) were selected in the region with B. racemosa communities and the rice field was control (CK), following the conventional sampling method. T1 and T2 were chosen from the bank of the Chengyue River in the Xibian Village Group, featuring a B. racemosa pure community and B. racemosa with associates such as Sonneratia apetala, Talipariti tiliaceum, Acanthus ilicifolius, Acrostichum aureum, and Derris trifoliata. T3 was chosen from the tidal gully of the Chengyue River in Xipo Village, featuring B. racemosa and associates such as Pongamia pinnata, T. tiliaceum, Pandanus tectorius, A. aureum, and S. apetala. Samples were collected from 3 replicate plots (10 m × 10 m) established on each site, and the samples collected from the rice field were maintained as the control (CK).
Soil samples were collected in triplicates from the root zone of the rice field (CK), the pure community of B. racemosa (T1) and the community of B. racemosa with associates (T2 and T3). samples were collected from 3 points, each of which were 1 to 3 m apart in each plot. The soil types at the four sampling sites were largely consistent, with lateritic soil being the predominant type across all locations. Around 500 g of soil sample was collected during low tide from the top 20 cm layer using a 1.5 L soil core sampler (10 cm diameter). The soil would be used to determine all soil physicochemical properties and soil microbial traits. Approximately 250 g of the soil sample was stored at −20 °C for DNA extraction, while another 250 g was stored at room temperature for subsequent analysis of the physicochemical properties. DNA sequencing and physicochemical analysis were carried out for all 12 samples with 3 replicate samples for each community (CK, T1, T2, T3).

2.2. Analysis of Soil Physicochemical Properties

The physical and chemical properties of soil were analyzed following standard laboratory procedures. Soil moisture content was determined gravimetrically after freeze-drying (−20 °C) the fresh sample to a constant value [25]. The pH was measured using a soil suspension in distilled water (v:v; 1:2.5) with a water analyzer. The total carbon [TC; equivalent to soil organic carbon (SOC) content] and total nitrogen (TN) contents of the soil sample were measured using an elemental analyzer (Flash 2000 Elemental Analyzer; Thermo Fisher Scientific, Hillsboro, USA). Available P was extracted from the soil following the Olsen procedure and measured using the molybdenum blue method. The soil’s exchangeable cations, such as K+, Mg2+, Na+, and Ca2+, were extracted with ammonium acetate and determined by atomic absorption/emission spectrometry [26]. Total phosphorus (TP) content was measured using the ammonium molybdate spectrophotometer method. Additionally, soil available nitrogen (SAN) was analyzed using the alkaline hydrolysis diffusion method, and soil available potassium (SAK) was determined using the flame photometric method.

2.3. Analysis of Plant Traits

The experimental materials were collected from plants of different communities (B. racemosa, A. ilicifolius, T. tiliaceum, and P. pinnata). Paddy soil was used as the CK group, which is not a B. racemosa community and thus no plant sampling was conducted. From each community, six healthy and phenotypically consistent individuals of each species were selected as standard trees for sampling. Mature leaves were collected from the upper-middle canopy of each standard tree in four directions (east, west, south, and north), with 20 leaves collected per direction. These leaves were mixed to form one sample. For each species, six standard trees were sampled, and the leaf samples from these six trees were thoroughly mixed and then divided into three independent subsamples, serving as three replicates. The fresh parts were separated from the dead parts, stored in envelopes (4 °C), incubated at 80 °C for 2 h, and subsequently at 60 °C for 48 h. The dried sample was then powdered, sieved through a 0.25 mm sieve, and digested with a mixture of H2SO4 and H2O2. The digested sample was filtered through a fine mesh, and the nitrogen (N) and phosphorus (P) levels in the filtered extract were analyzed using the Kjeldahl and vanadium molybdate colorimetric methods, respectively [27].
The concentration of trace elements in the mangrove leaves was determined using a Varian 820 ICP-MS system (Varian, Palo Alto, CA, USA). Approximately 0.04 g of leaf was weighed accurately into a Teflon cup and mixed with 1.5 mL of hydrofluoric acid and 0.5 mL of nitric acid. The cup was sealed and placed in an oven at 180 °C for 12 h. After cooling, the cup was placed on an electric hot plate at 150 °C to allow acid evaporation. Then, 1 mL of nitric acid and 1 mL of water were added to the cup, sealed, and placed in the oven at 150 °C for another 12 h; the cup was taken out and cooled to room temperature. Finally, the samples were weighed and diluted to 40 g (dilution ratio of about 1000) to determine the levels of trace elements, including leaf potassium ([K]), calcium ([Ca]), magnesium ([Mg]), Ferrum [Fe], manganese ([Mn]), zinc ([Zn]), and sodium [Na] content, using ICP-MS.

2.4. PLFA Analysis to Identify the Rhizosphere Microorganisms

Phospholipid fatty acid (PLFA) analysis was carried out to assess the composition of the microbial community in the mangrove rhizosphere. The lipids were extracted from 10 g of the freeze-dried soil sample using a single-phase mixture of chloroform, methanol, and citrate buffer (1:2:0.8; v:v:v) [28]. The extract was further passed through a silicic acid column to separate the lipids, which were saponified and methylated to form fatty acid methyl esters (FAMEs). The FAMEs were then dissolved in 200 μL of hexane, analyzed using gas chromatography (Agilent Technologies Inc, Santa Clara, CA, USA), and categorized into groups indicative of gram-positive (G+) bacteria, gram-negative (G) bacteria, and fungi. The concentration of each fatty acid was calculated by comparing the peak area of the sample with that of the internal standard and represented as nmol g−1 dry soil.
A total of 43 fatty acids were analyzed to measure the total biomass and determine the overall microbial (bacteria and fungi) community composition. The 18:2ω6.9 and 18:1ω9 fatty acids represented the saprotrophic and ectomycorrhizal fungal (hereafter fungal) biomass [29]. Meanwhile, the sum of the concentrations of nine fatty acids (i15:0, a15:0, i16:0, i17:0, a17:0, 16:1ω9, 16:1ω7, cy17:0, and cy19:0) were calculated to represent bacterial biomass; the first five and the last four fatty acids were used as biomarkers for gram-positive (G+) and gram-negative (G) bacteria, respectively [30]. The C16:1ω5 fatty acid was used as the biomarker for arbuscular mycorrhizal fungi (AMF) [29]. The total PLFAs and the specific PLFAs in the soil samples were quantified and expressed per gram of dry soil. Finally, the microbial community composition was determined based on the G+:G bacteria ratio and the total fungi: bacteria (F:B) ratio [31].

2.5. Soil Microbial Analysis

2.5.1. Sequencing and Data Analysis

Single-molecule real-time (SMRT) sequencing of DNA fragments was carried out on a Pacbio Sequel next-generation sequencing platform for both 16S rRNA and ITS in this study. The DNA sequences were denoised following the Vsearch method, involving primer removal, mass filtering, deduplication, chimera decongestion, clustering, and other steps [32]. After obtaining the representative operational taxonomic unit (OTU) sequences, their length distributions were determined to compare with the sequencing target. Further, the SILVA database (Release 138, http://www.arb-silva.de, accessed on 17 November 2023) [33] was used to perform taxonomic annotation for the bacterial 16S rRNA sequences, and the UNITE database (Release 8.0, https://unite.ut.ee/, accessed on 25 November 2023) was used to perform taxonomic annotation for the fungal ITS sequences [34]. We then used FastTree, based on the maximum likelihood method, to construct a phylogenetic tree of these sequences to investigate the genetic distance or kinship between the sequences. Finally, the results on the composition distribution of microbes at six taxonomic levels, including phylum, class, order, family, genus, and species, were presented as histograms. The rarefaction method was used to randomly select a certain number of sequences to a uniform depth and predict the observed OTUs and their relative abundance at that sequencing depth in each sample [35].

2.5.2. Alpha Diversity Index

The abundance of the microbes was determined using the Chao1 and observed species indexes, the diversity using the Shannon and Simpson indexes, and the evolution-based diversity using Faith’s PD index. Pielou’s evenness index was used to represent the evenness of a community, and Good’s coverage index was used to represent the coverage. The size of the alpha diversity index was related to the flattening depth of the OTU table, and a rarefaction curve was drawn to explore the trend of alpha diversity of the microbes in each sample.

2.5.3. Species Composition Analysis

Further, to compare the composition of different microbial species and determine the species abundance distribution trend in each sample, a heat map was generated. We used the abundance data of the top 20 genera to plot the heat map. Unweighted pair group method with arithmetic mean (UPGMA) clustering based on the Euclidean distance of the species composition was performed to assess the changes in bacterial and fungi community structure. The Venn diagram was created in R with the package VennDiagram (https://CRAN.R-project.org/package=VennDiagram, accessed on 17 November 2023) was drawn to explore the unique and shared microbial species across the samples.
Mantel’s test of Pearson’s correlations between the microbial community and the soil and plant properties was conducted by the GENESCLOUD website (https://www.genescloud.cn/chart/NetHeatmap, accessed on 25 November 2023).

2.5.4. Principle Coordinates Analysis (PCoA)

The differences in OTUs among the samples were evaluated based on beta diversity indexes such as Jaccard, Bray–Curtis, and unweighted UniFrac distances. The principle coordinates analysis (PCoA) was performed to determine the distance matrix at a lower dimension scale and compare the samples. Finally, the coordinates of the output were analyzed in R using the R script and plotted as a two-dimensional scatter plot.

2.6. Statistical Analyses

All data are represented as mean ± standard error (SE) of the mean of triplicates. Two-way analysis of variance (ANOVA) and Tukey’s test (GraphPad Prism 8.0.1) were applied to assess the differences among the mangrove communities (p < 0.01). Shannon, Chao1, Simpson, Faith’s PD, Pielou’s evenness, and Good’s coverage indexes of the bacterial and fungal communities were calculated using the Vegan and Picante packages in R software (v.3.6.1). Multiple t-tests were performed to assess the differences in these indexes (p < 0.01). The Vegan package was also used to visualize the bacterial composition at the phylum and genus levels. The similarities in the bacterial communities among the mangrove communities were assessed using PCoA performed in R software.

3. Results

3.1. Differences in Soil Physicochemical Characteristics Among the B. Racemosa Pure and Associated Communities

Initial analysis revealed that the soil physicochemical characteristics of the B. racemosa ecosystem (T1, T2, and T3) were significantly different from the rice ecosystem (CK) (Table 2). The SOC, SOM, SN, SAN, SP, SK, SMg, SFe, SWC, soil pH, and SProtein were higher in the mangrove ecosystem (T1, T2, and T3) than in the rice field (CK). However, the SAP and SAK of T1, T2, and T3 were significantly lower than that of the CK. Specifically in the mangrove ecosystem, SOC, SOM, SN, SAN, SP, WSM, SNa, SCa, SMn, SWC, SProtein, and soil pH were in the following order: T1 (B. racemosa) > T2 (B. racemosa + A. ilicifolius) > T3 (B. racemosa + T. tiliaceum + P. pinnata).

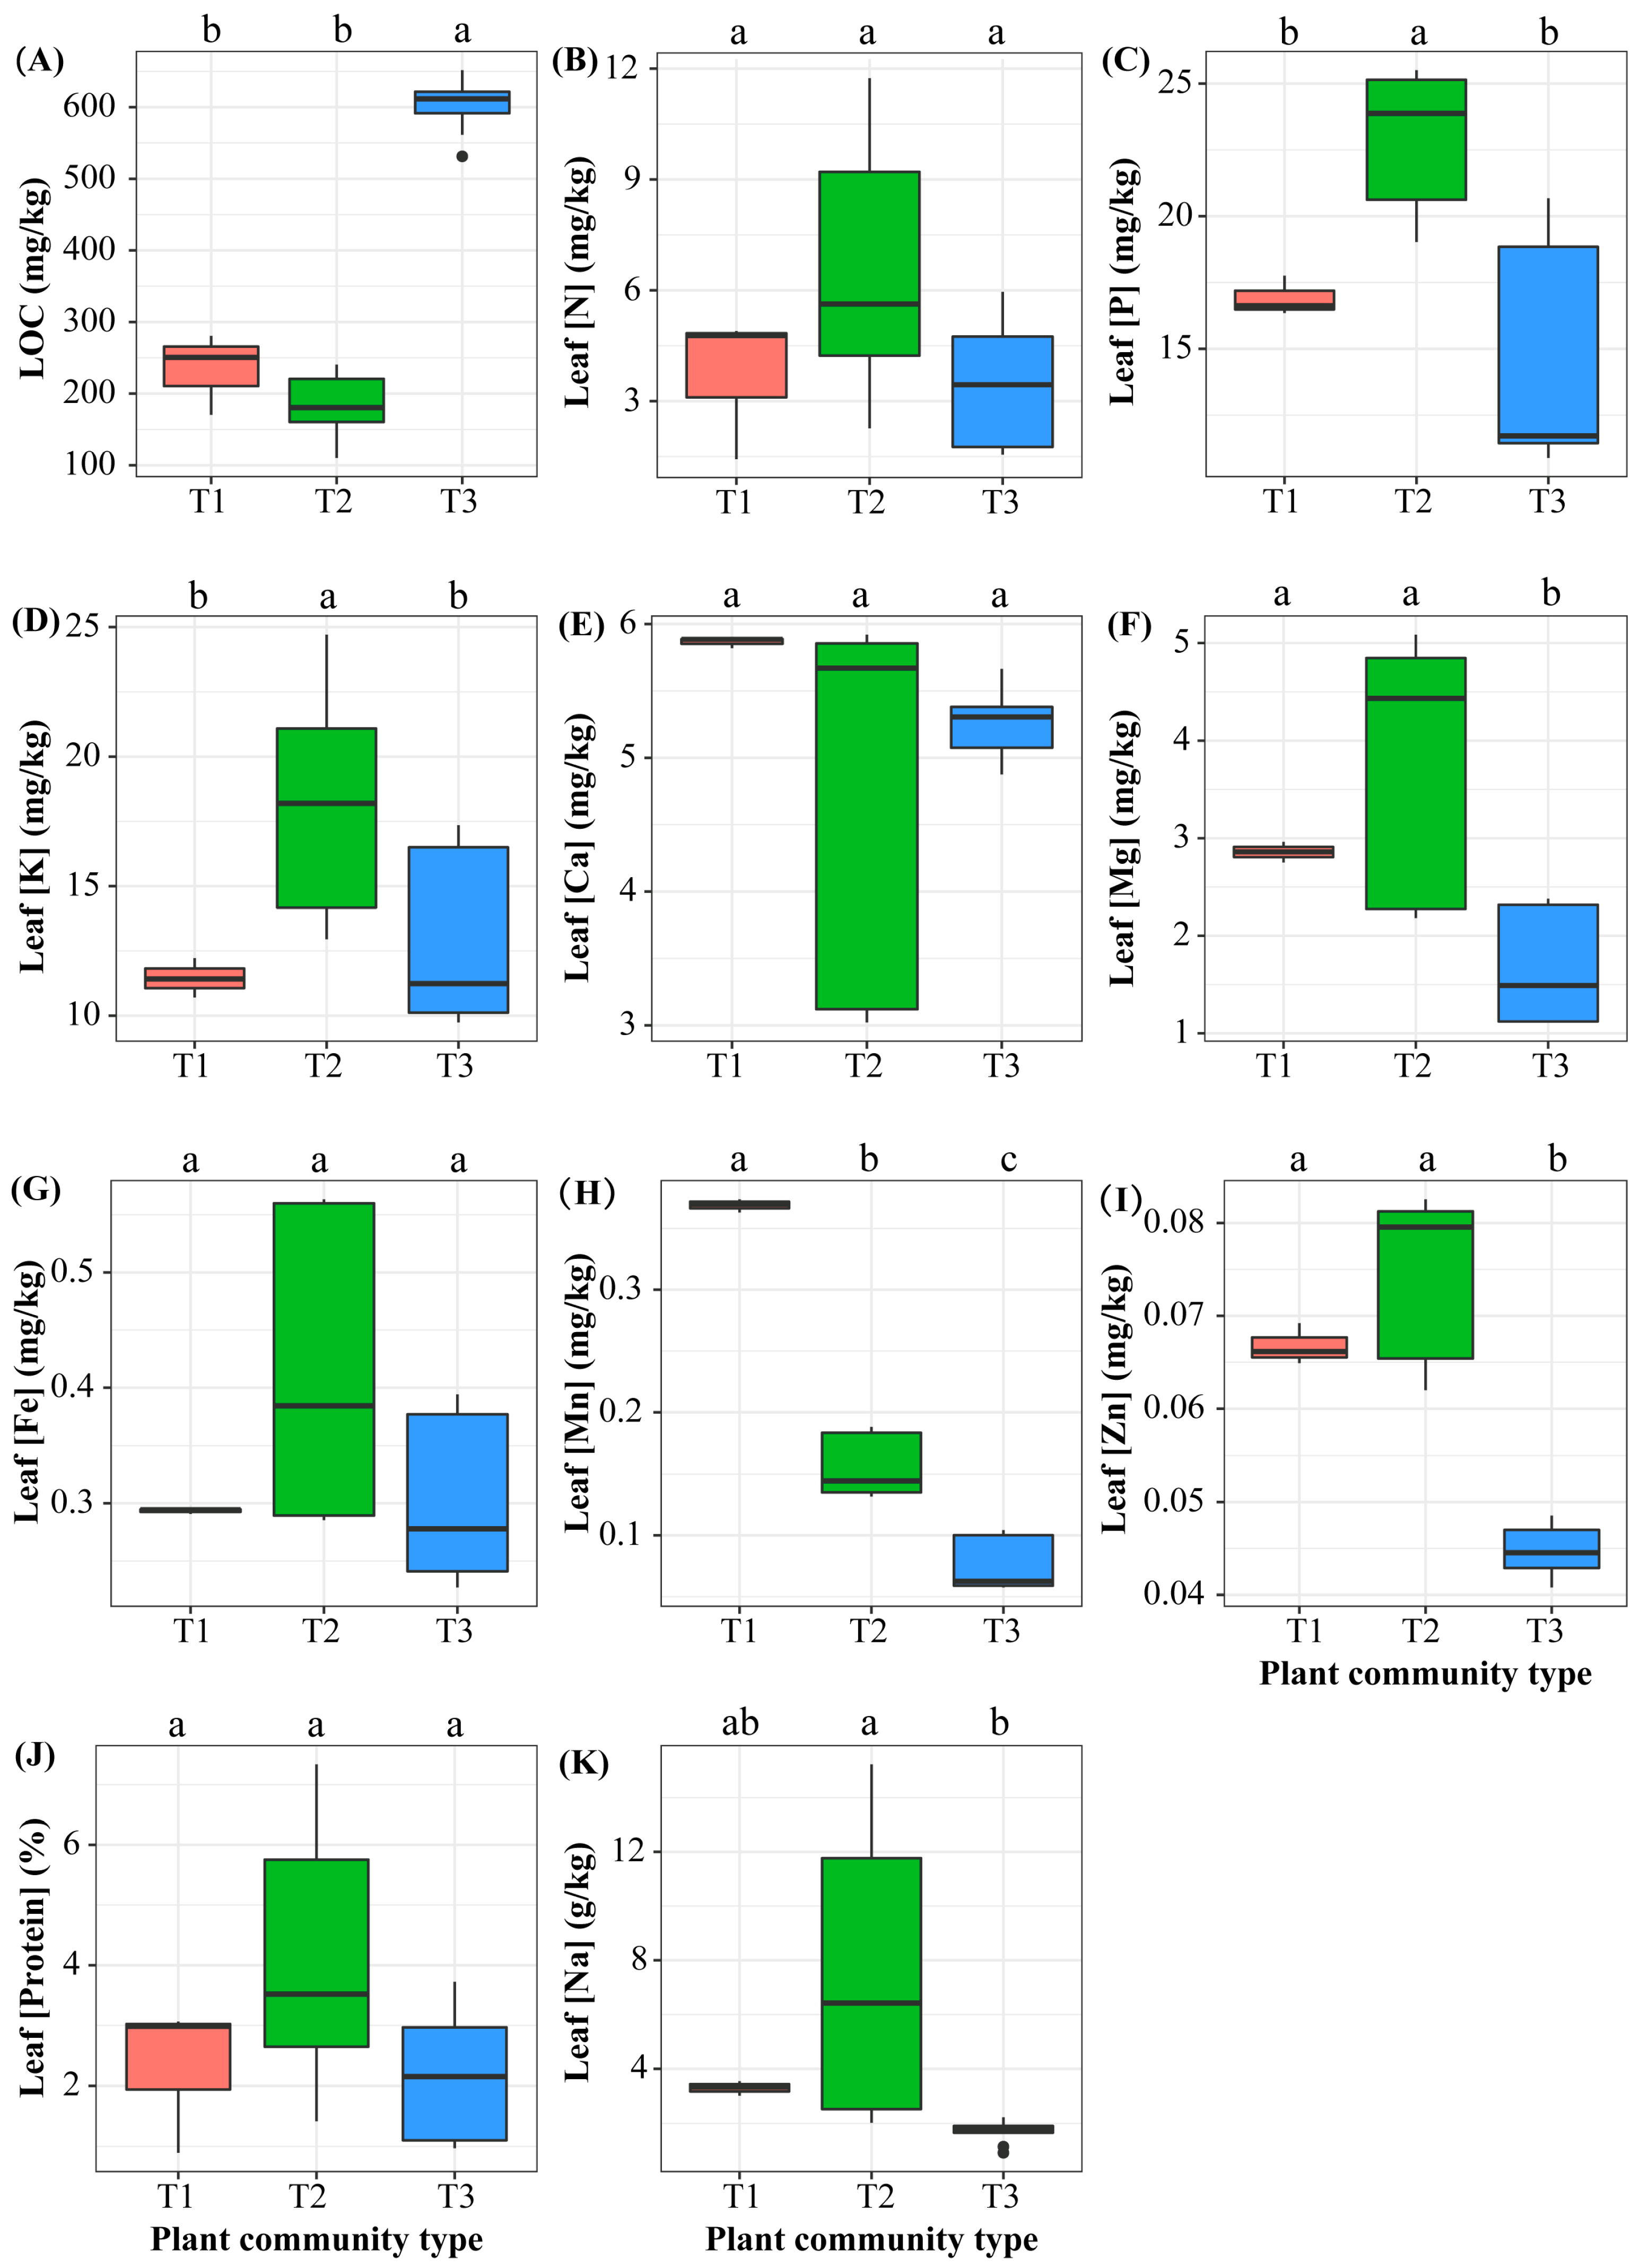
3.2. Differences in Leaf Traits Among the B. racemosa Pure and Associated Communities

The plants of different mangrove ecosystems (T1, T2, T3) exhibited differences in leaf nutrient concentrations (Figure 2). The LOC of T3 (601.51 mg/kg) was significantly higher than that of T1 (233.92 mg/kg) and T2 (202.17 mg/kg), while leaf [Mg] and leaf [Zn] of T1 (2.86 mg/kg Mg, 0.37 mg/kg Zn) and T2 (3.32 mg/kg Mg, 0.17 mg/kg Zn) were higher than those of T3 (1.65 mg/kg Mg, 0.07 mg/kg Zn). Furthermore, leaf [P] and [K] of T2 (22.64 mg/kg P, 16.23 mg/kg K) were significantly higher than those of T1 (16.91 mg/kg P, 11.45 mg/kg K) and T3 (14.47 mg/kg P, 12.71 mg/kg K). The leaf [Mn] concentration also differed among the three communities and was in the following order: T1 > T2 > T3. However, the different mangrove communities had similar levels of leaf [N], [Ca], [Fe], [Protein], and [Na].

3.3. Composition and Diversity of Soil Microbes Associated with B. Racemosa Pure and Associated Communities

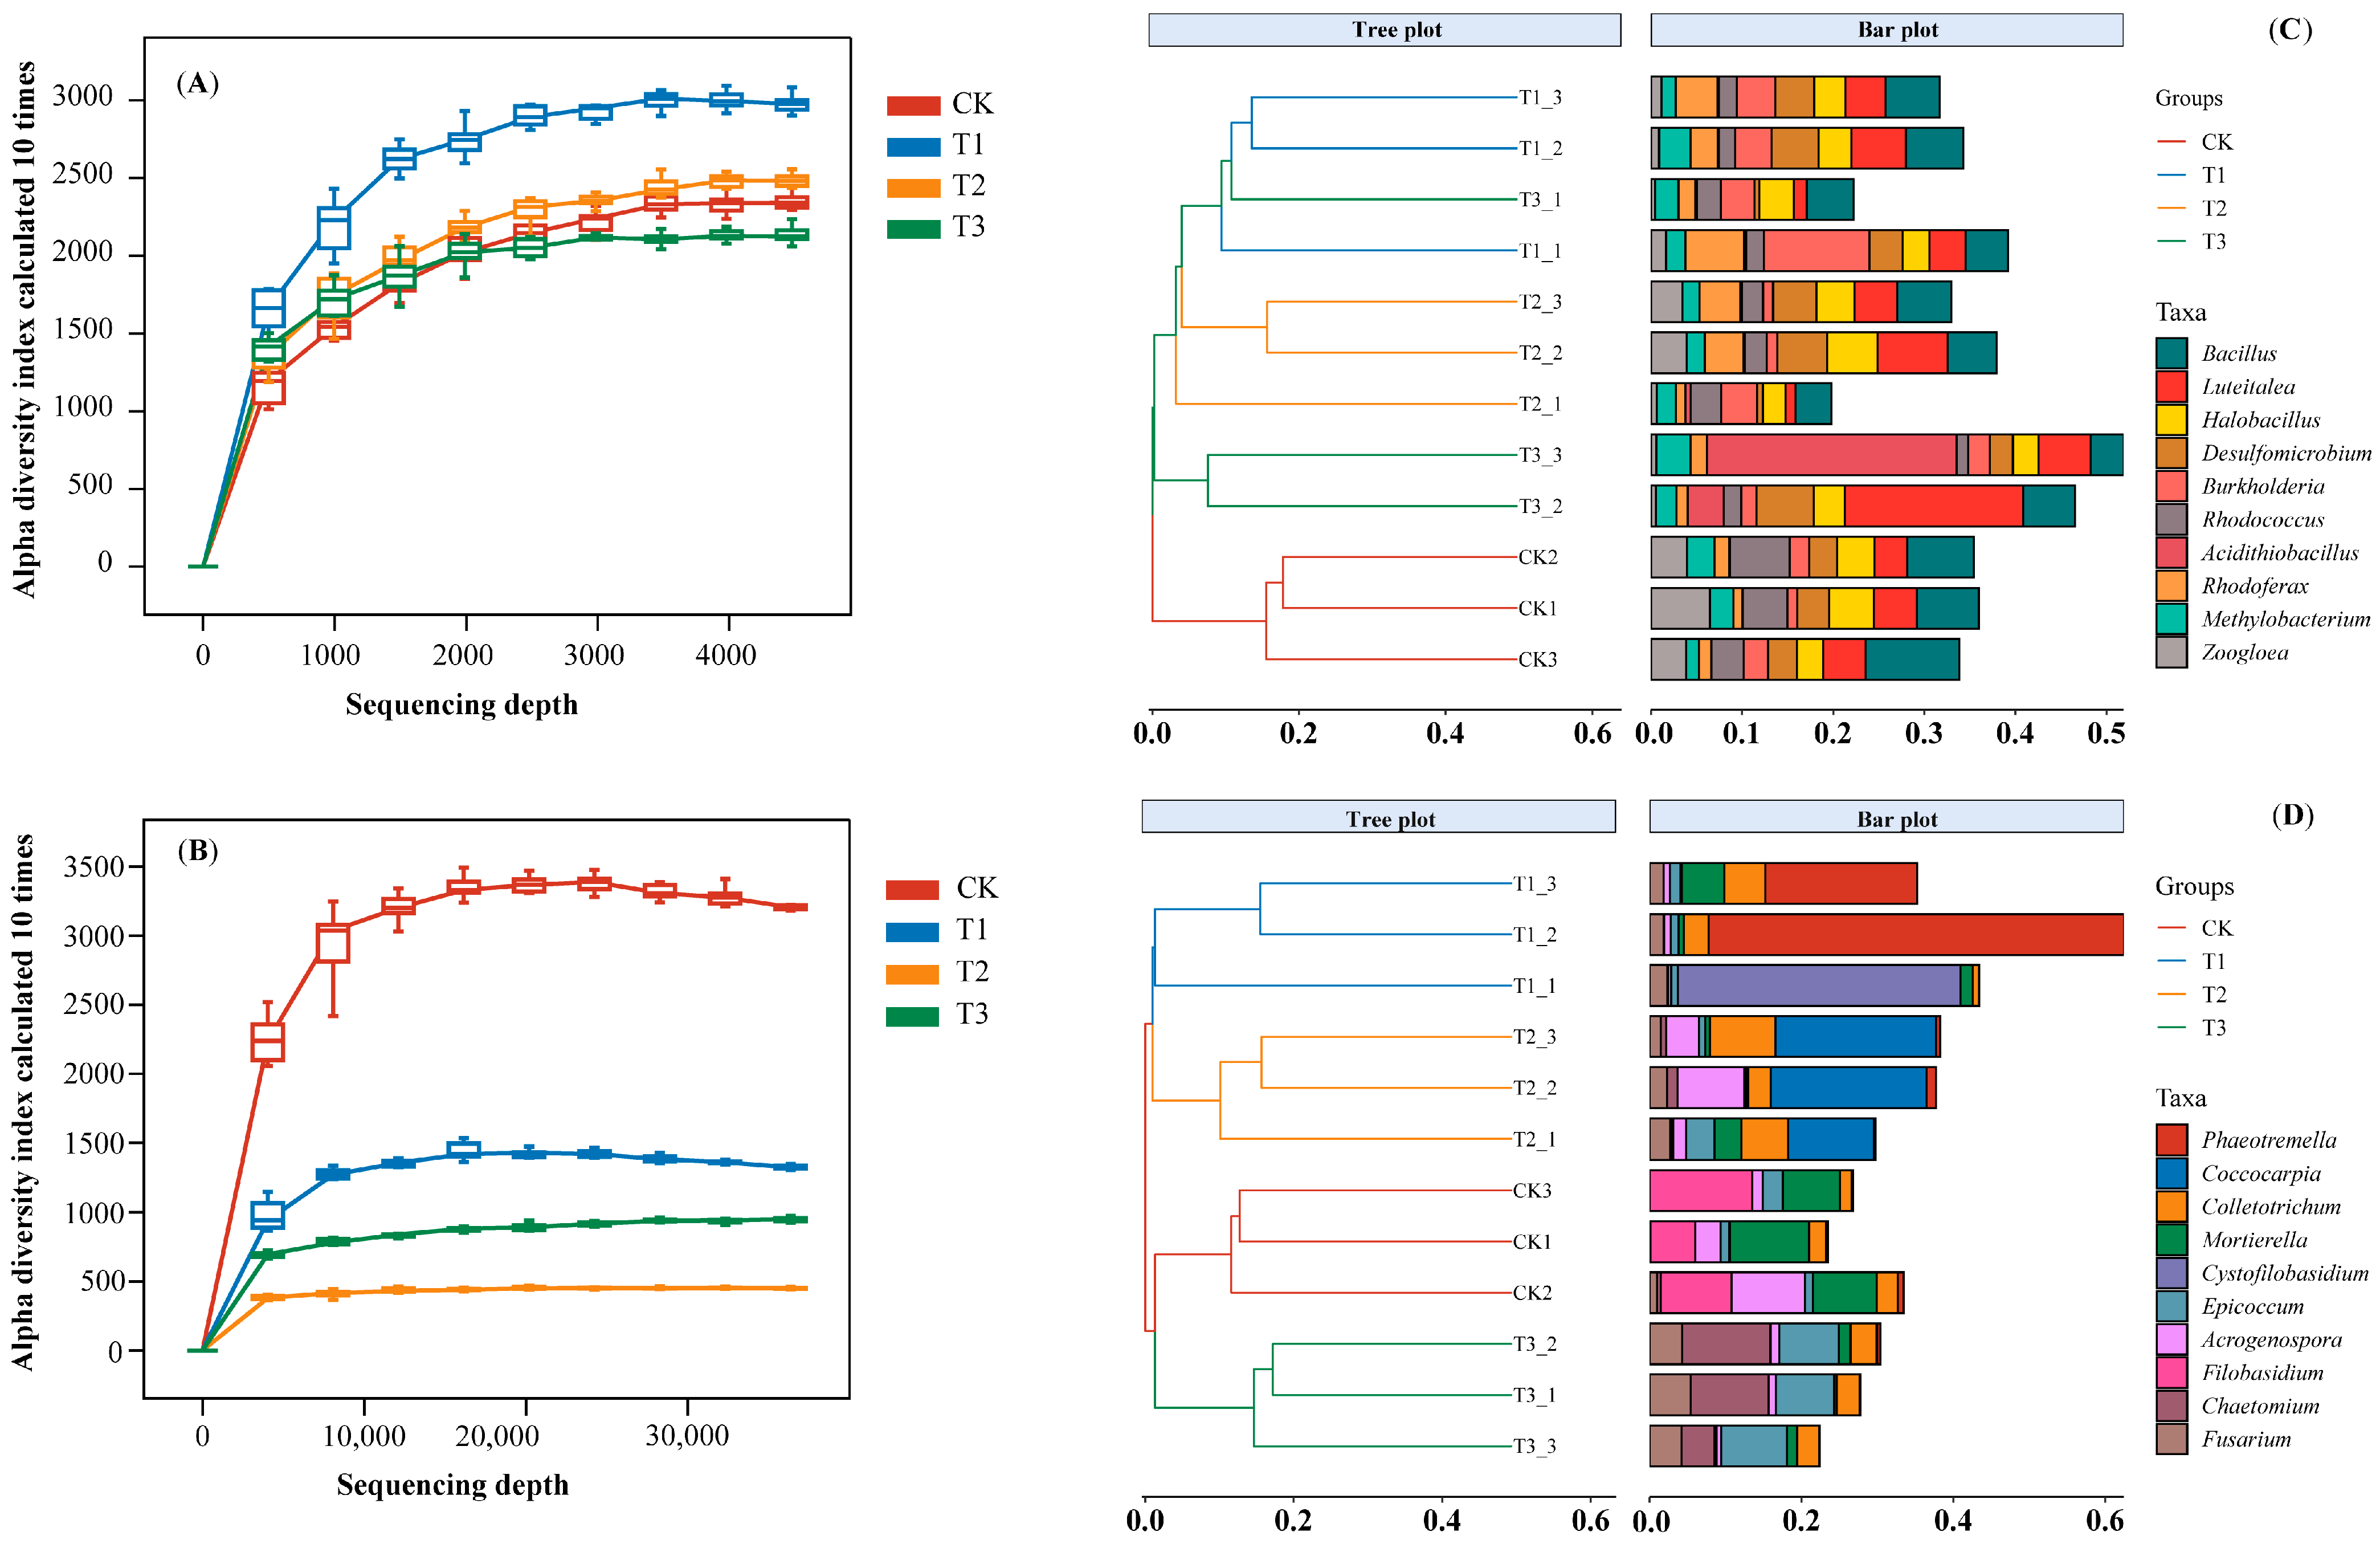
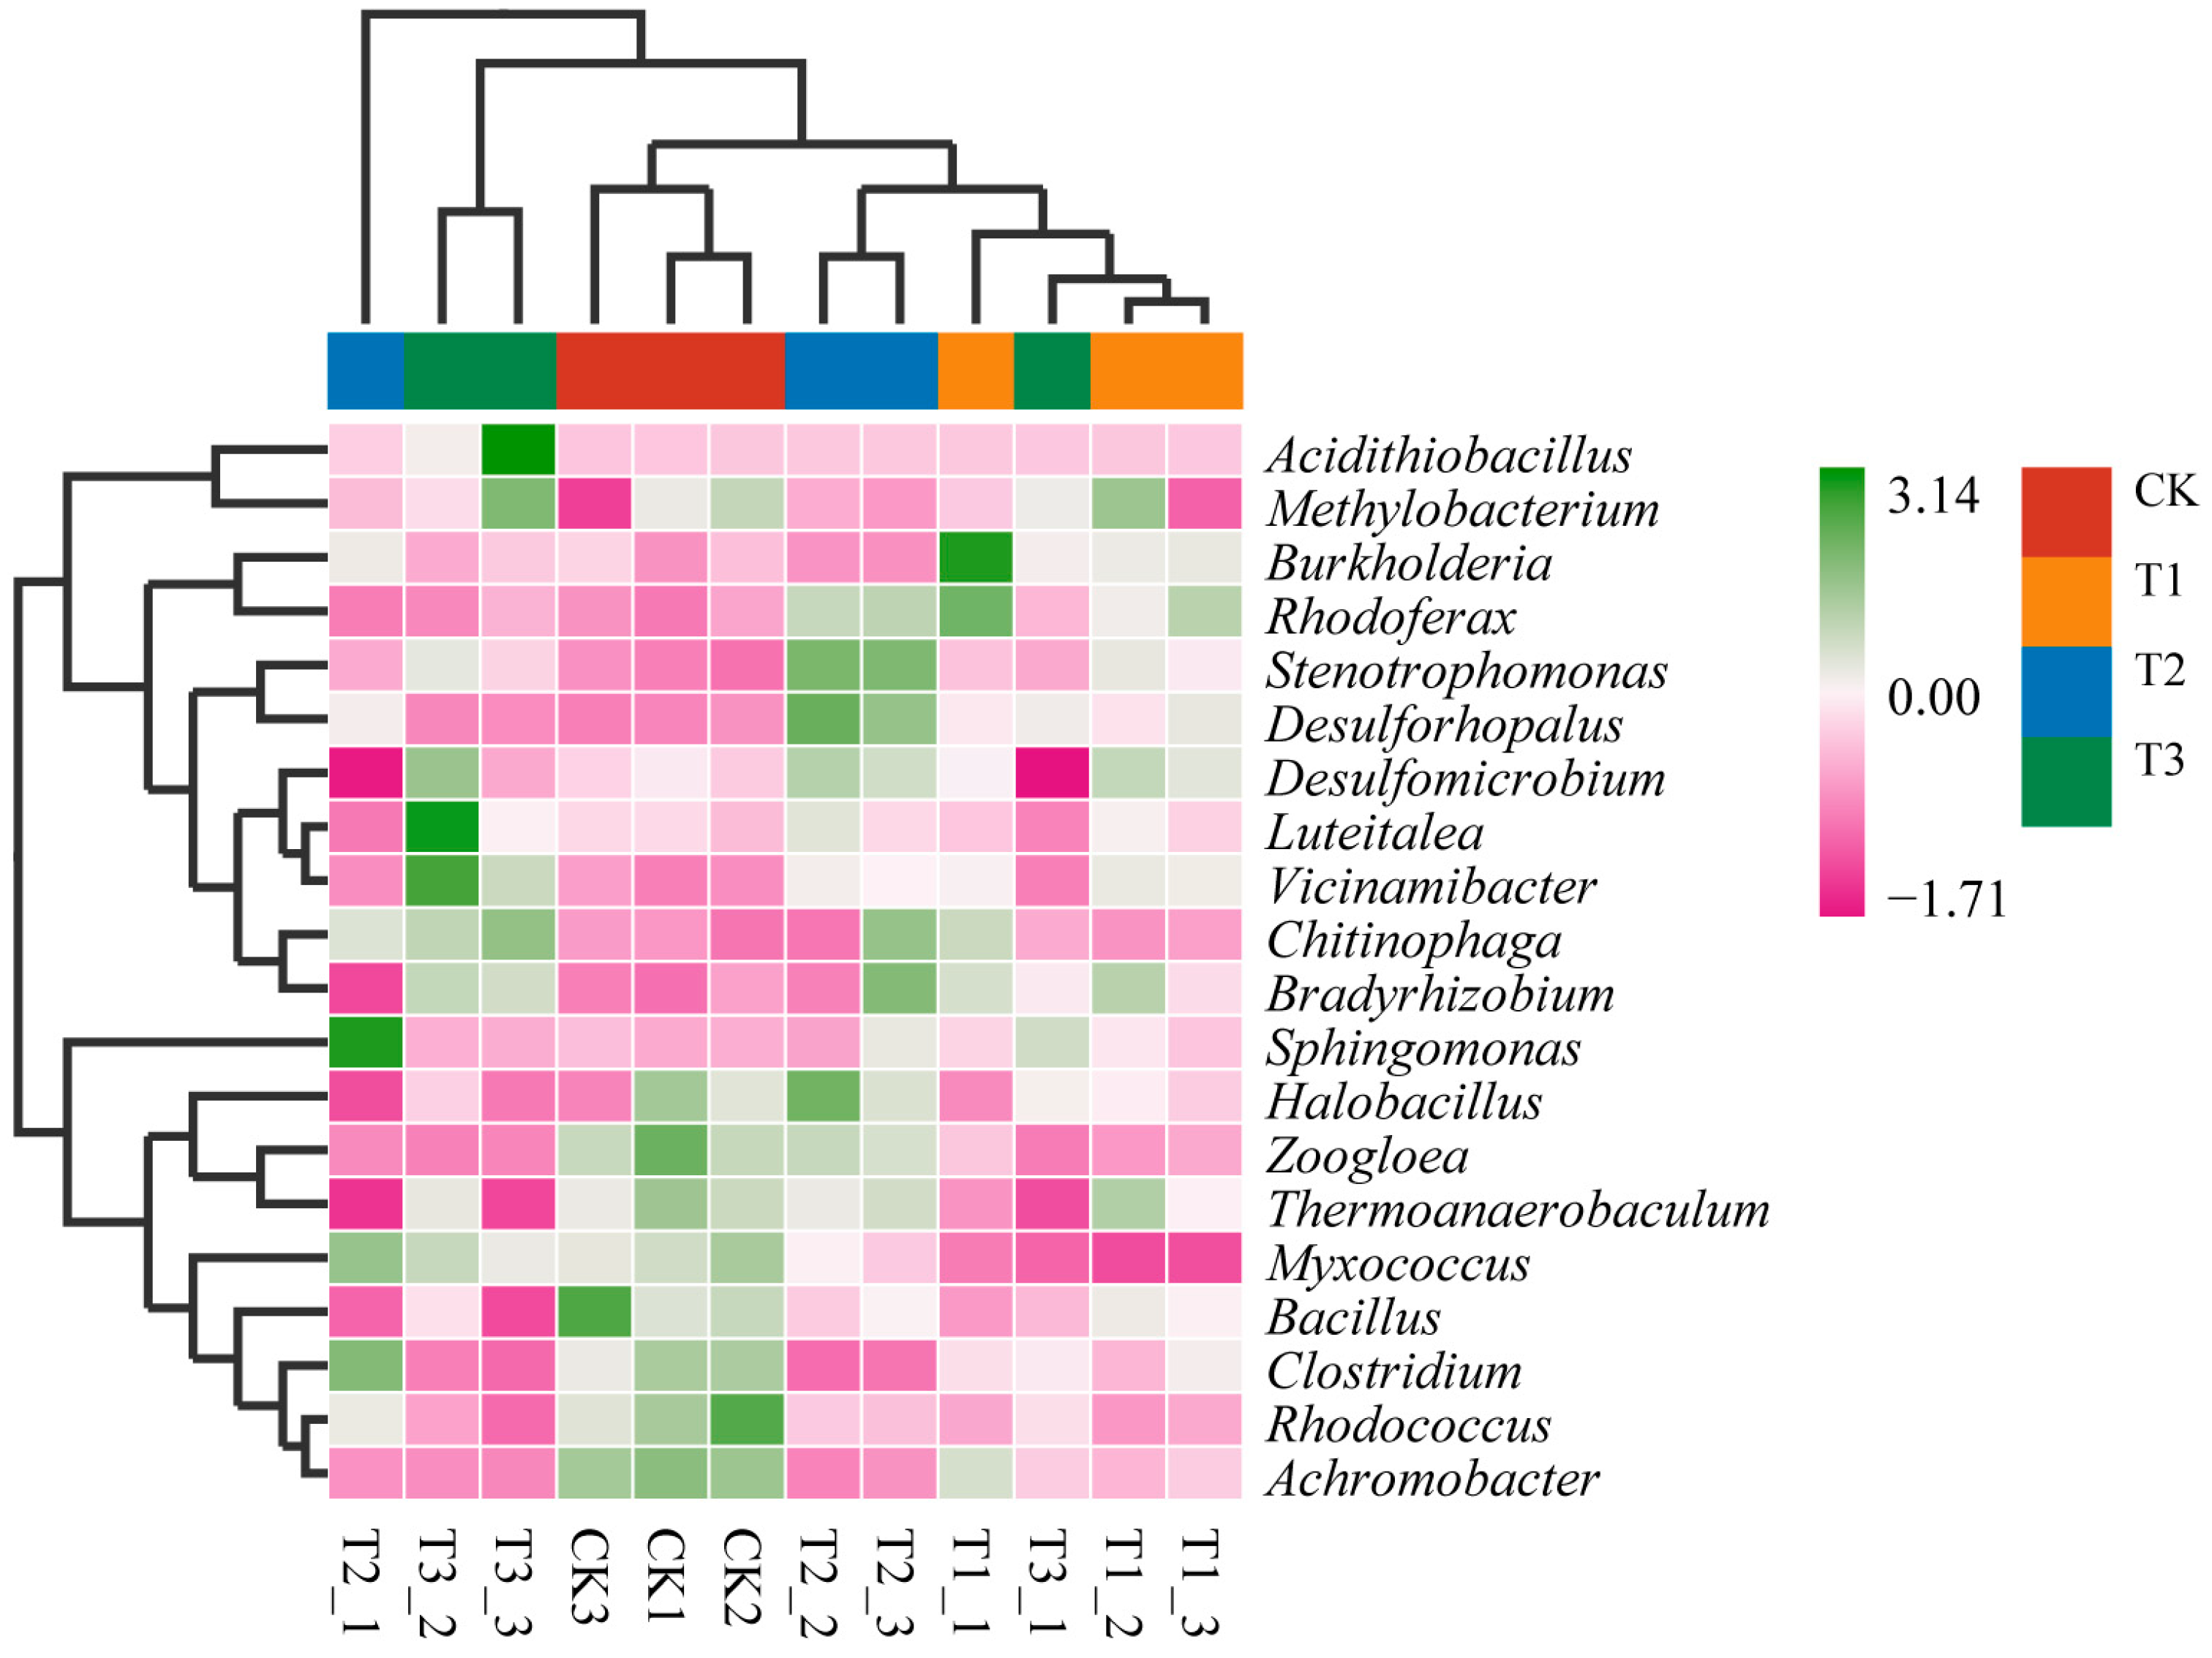
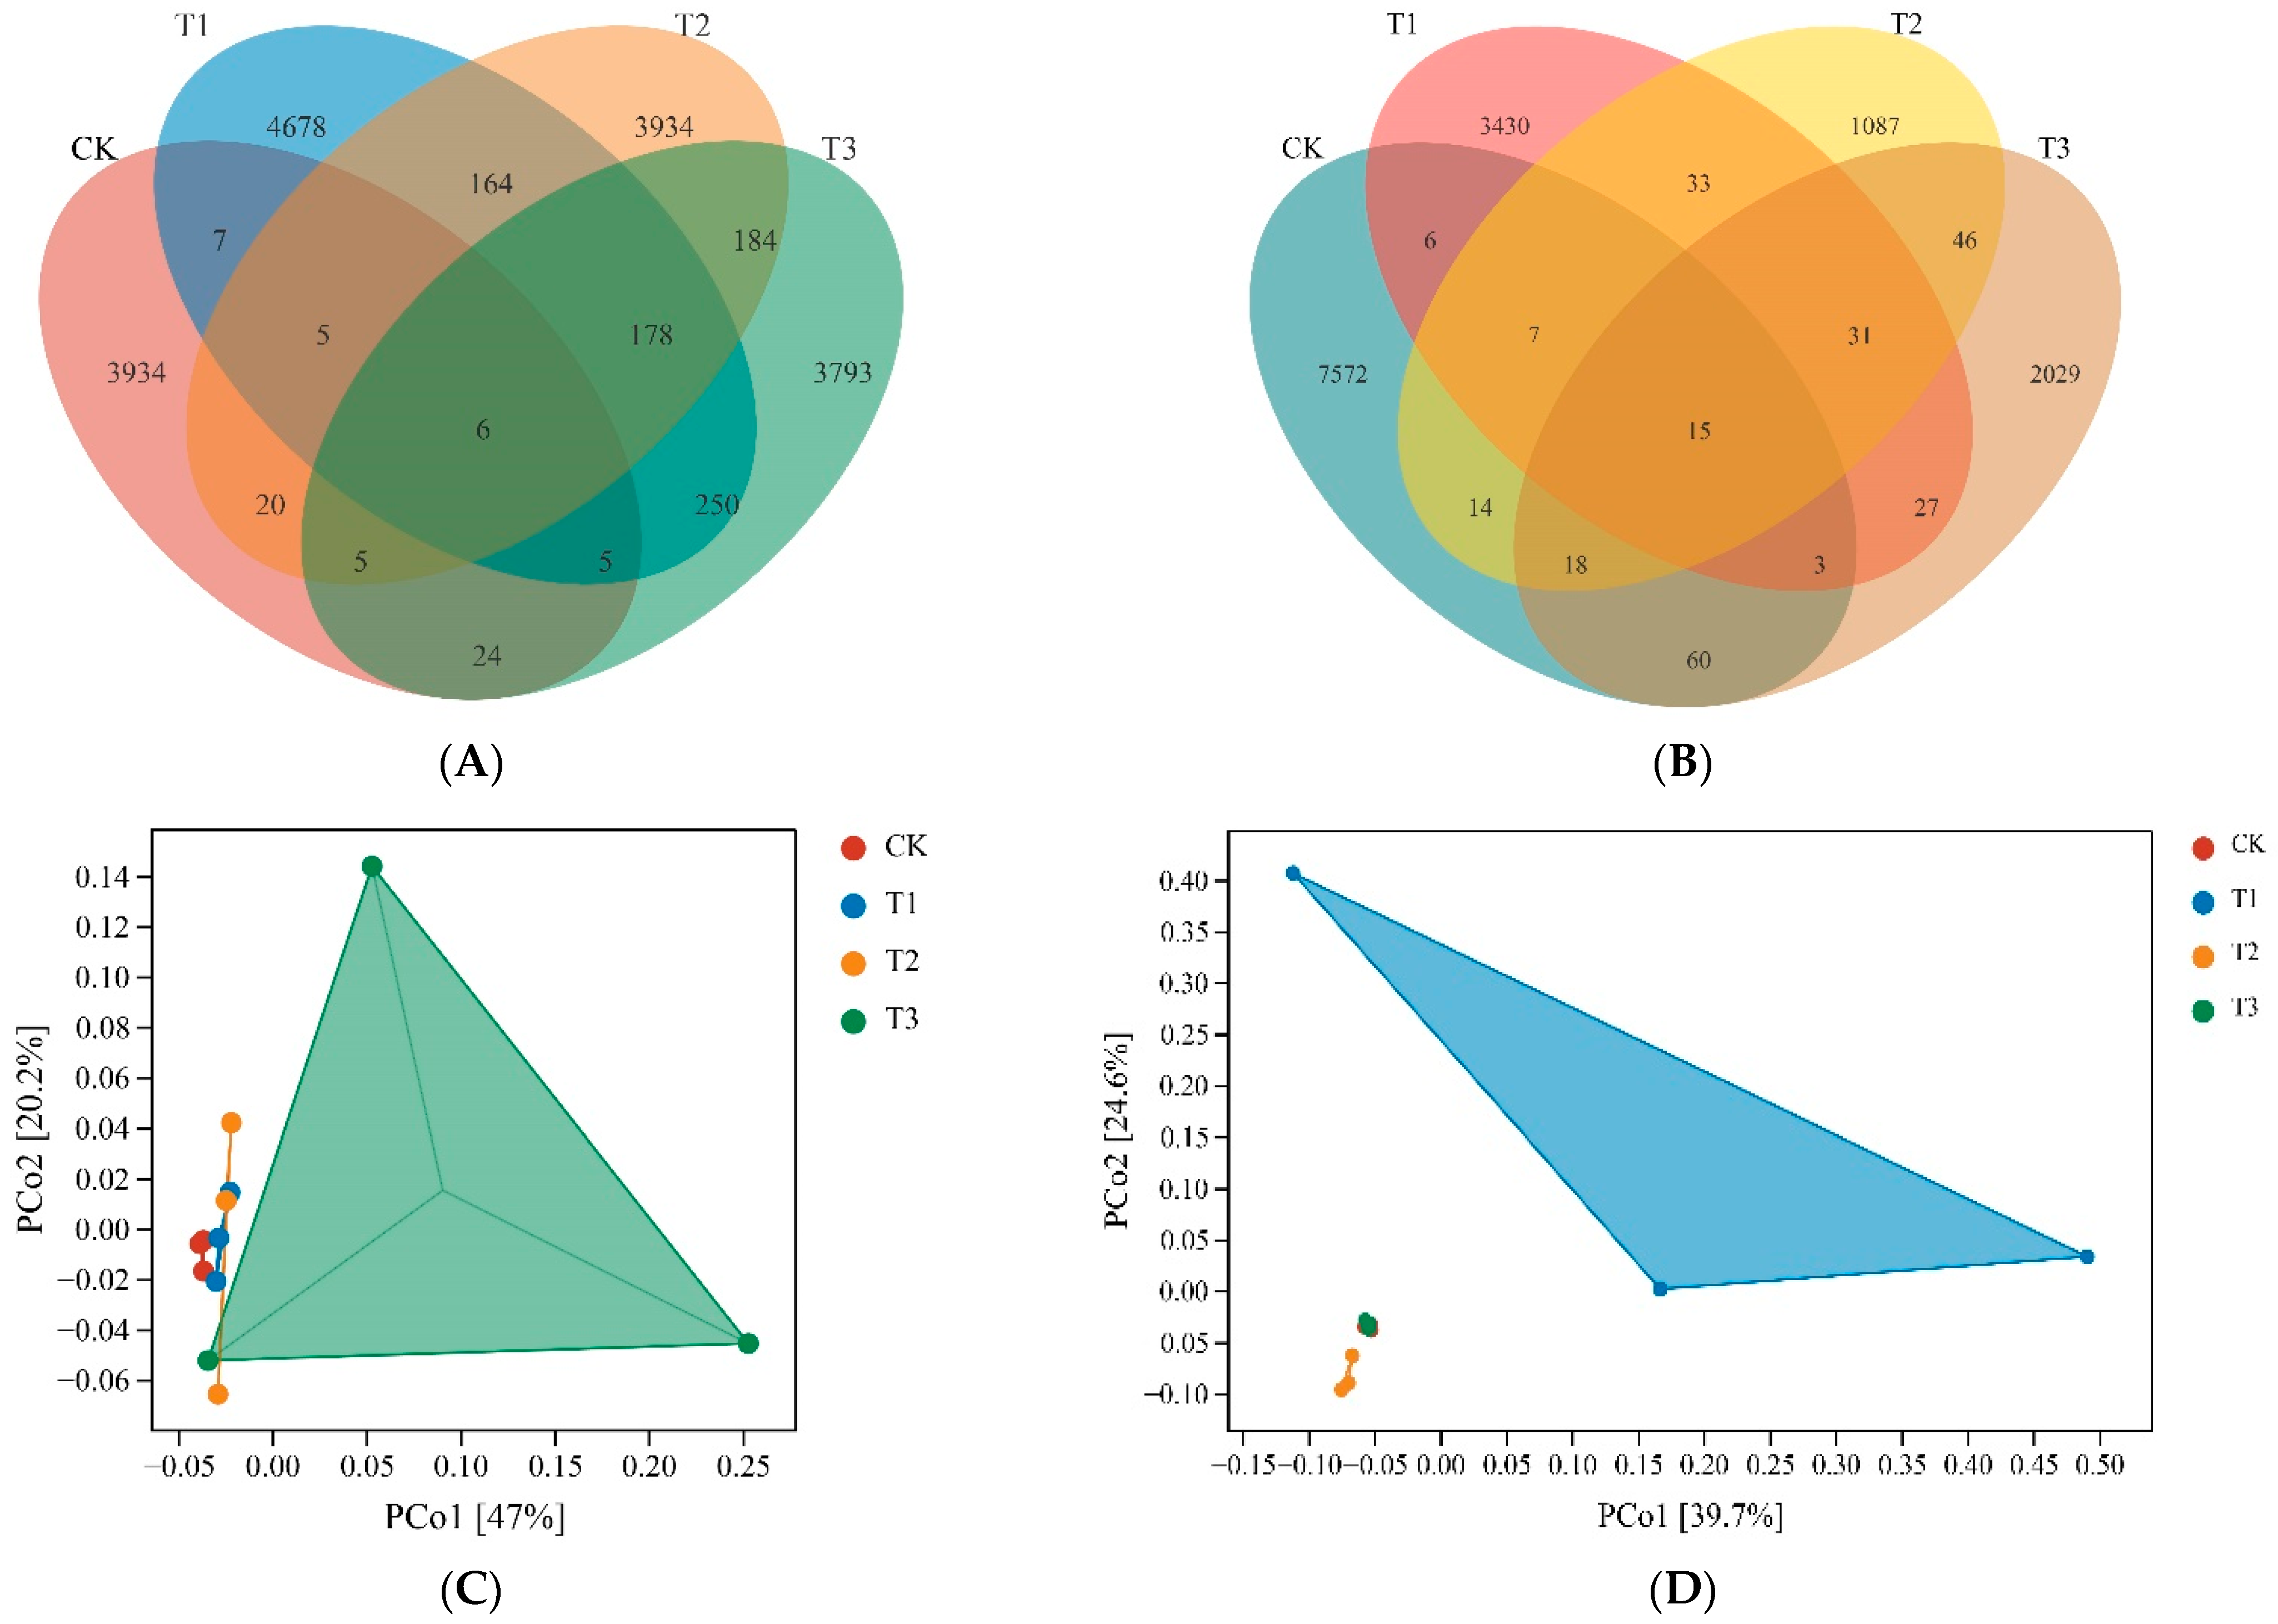
3.3.1. Taxonomy and Composition of Soil Microbes

We performed PFLA analysis to determine the taxonomy and composition of the soil microbial community of the mangrove ecosystems. The two-way ANOVA of these data showed that the plant community type substantially affected the soil microbial communities’ composition (Table 3, Figure 3). The content of fungi and all bacteria, including the G+ bacteria, the G bacteria, aerobic bacteria, and hylophilus thermolyticus, of the B. racemosa pure community (T1) were significantly higher than that in the other communities, including the rice field (p < 0.05; Figure 3). Among the various microbes, the aerobic bacteria were the lowest in these soils (Table 3). For the ratio of fungi to bacteria (F:B), the B. racemosa pure community (T1) and the rice field (CK) were significantly higher than the B. racemosa + Acanthus ilicifolius community (T2) and the B. racemosa + Talipariti tiliaceum + Pongamia pinnata community (T3).
Furthermore, the soil samples were sequenced to assess the composition and diversity of soil bacteria and fungi associated with different B. racemosa communities. After processing the raw reads, 329,092 and 837,661 high-quality sequences were obtained for the bacterial and fungal datasets, which were further clustered into 17,187 and 14,378 OTUs at 97% similarity levels. The rarefaction curves demonstrated good sequencing depth coverage (around 3000 and 20,000, respectively) and indicated differences in the bacterial (Figure 4A) and fungal (Figure 4B) communities. Further hierarchical clustering analysis based on Euclidean distance showed that the bacterial communities in the rice field (CK) clustered as one group, while those in the mangrove communities (T1, T2, T3) clustered as another group (Figure 4C). Meanwhile, the fungal communities of CK and T3 clustered as one group, while those of the T1 and T2 mangrove forests clustered as another group (Figure 4D). The bar charts showed that, although the microbial composition was similar, their abundance was different.
Further analysis of the relative abundance of the microbes revealed that the dominant bacterial phyla in the soil of the mangrove communities were Pseudomonadota (37.58 ± 3.67%), Bacillota (18.47 ± 2.15%), Acidobacteriota (11.46 ± 3.27%), Actinomycetota (9.14 ± 1.74%), Thermodesulfobacteriota (8.88 ± 2.07%), Cyanobacteria (3.37 ± 2.86%), Bacteroidota (2.96 ± 1.26%), Myxococcota (2.75 ± 0.60%), Planctomycetota (2.20 ± 0.70%), Chloroflexota (1.06 ± 0.50%), and others (2.12 ± 0.68%) (Figure 5A). Meanwhile, the dominant fungal phyla were Ascomycota (52.64 ± 14.09%), Basidiomycota (35.33 ± 14.60%), Mucoromycota (8.67 ± 4.35%), Zoopagomycota (1.53 ± 0.77%), Chytridiomycota (1.48 ± 1.14%), Blastocladiomycota (0.33 ± 0.36%), and others (0.03 ± 0.04%) (Figure 5B).
Then, a hierarchical clustering and heatmap based on the abundance of the phyla was performed to assess the structure of the microbial communities (Figure 6). Unweighted pair group method with arithmetic mean (UPGMA) clustering based on the Euclidean distance of the species composition showed that the changes in bacterial community structure were significantly correlated with the relative abundance of Desulfomicrobium, Myxococus, and Thermoanaerobaculum in the B. racemosa pure and associated communities (Figure 6). An increase in the abundance of these three genera led to high diverse microbial community and soil environmental heterogeneity among the four mangrove plant communities.

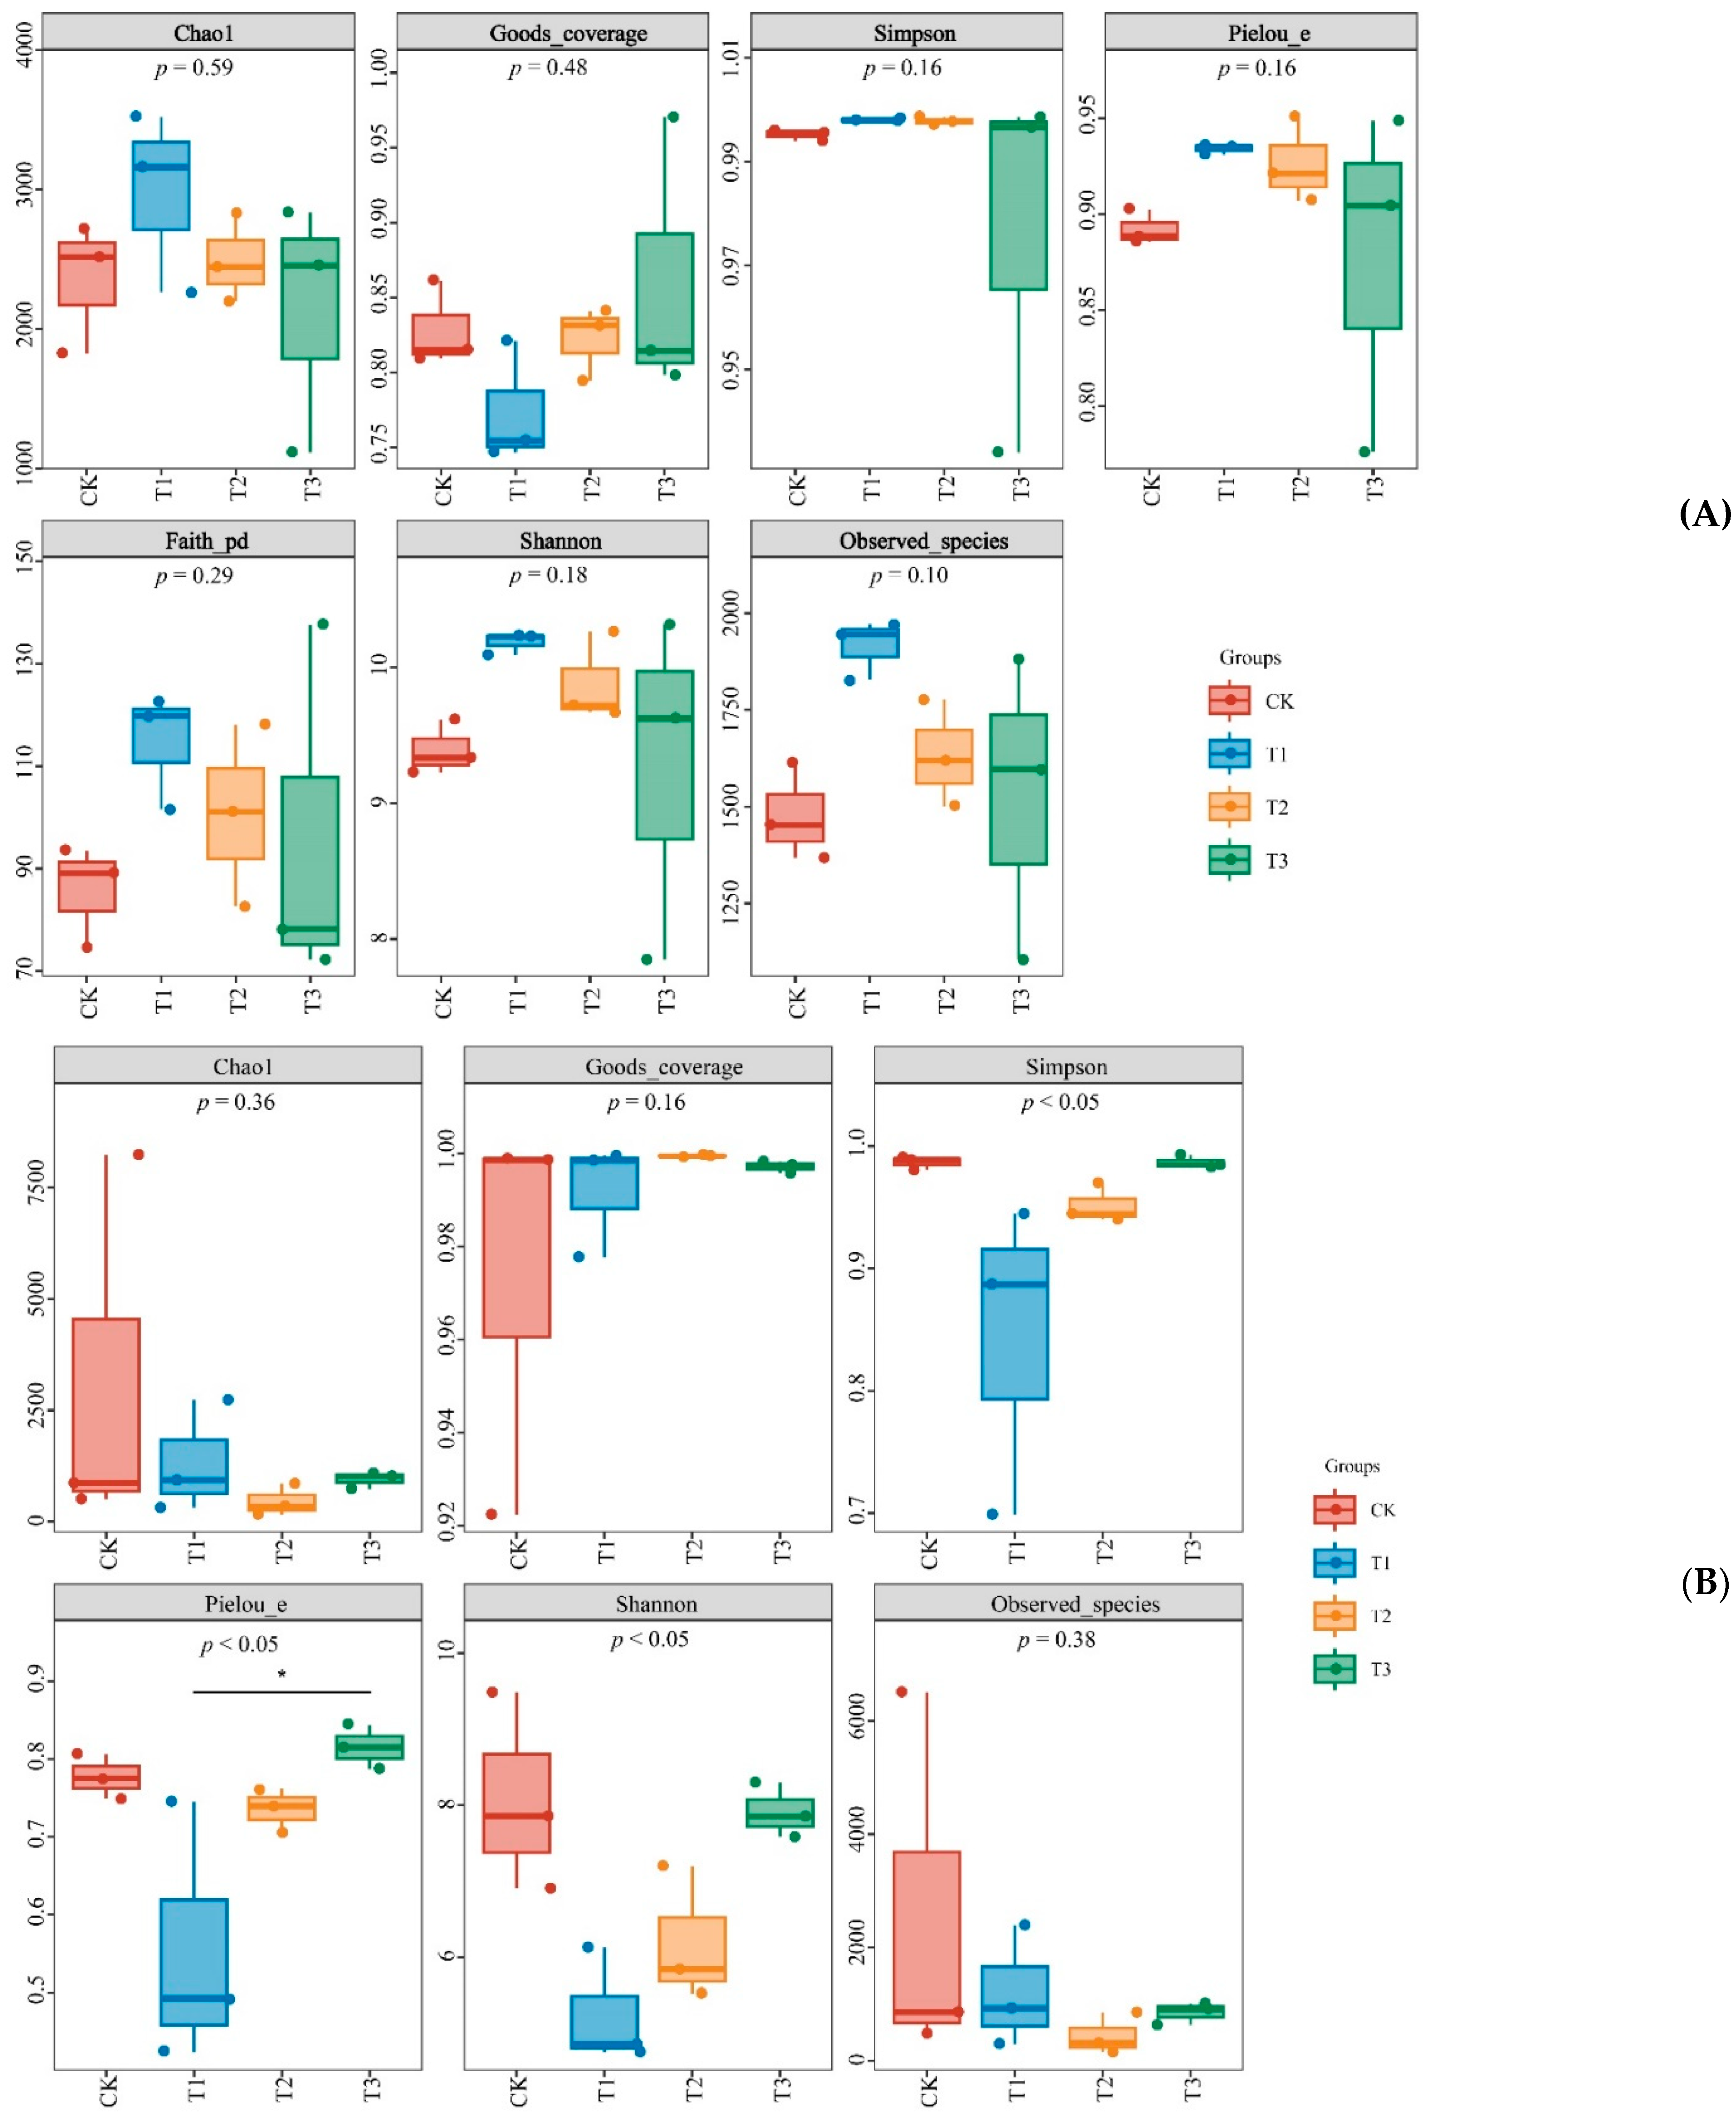
3.3.2. Microbial Diversity

Further analysis of the α-diversity indexes of the microbes at the OTU level revealed no significant differences in bacterial diversity between the rice field (CK) and the mangrove communities (p > 0.05; Figure 7). The bacterial community did not present great variation in α-diversity and species richness indexes among the different plant community types (Figure 7A). The bacterial community showed high and similar values of the diversity indexes such as Chao1, Goods_coverage, and Faith_pd, indicating high homogeneity among plant communities. The Chao1 richness estimates for CK, T1, T2, and T3 were 2354, 2980, 2491, and 2135, respectively, suggesting the highest bacterial community richness in T1. The average Shannon index values of CK, T1, T2, and T3 were 9.4, 10.2, 9.9, and 9.3, respectively (Figure 7). Meanwhile, the fungal Simpson, Pielou_e, and Shannon indexes significantly differed among the plant community types (p < 0.05; Figure 7B), indicating a high diversity of fungal composition in B. racemosa communities but not the rice field.

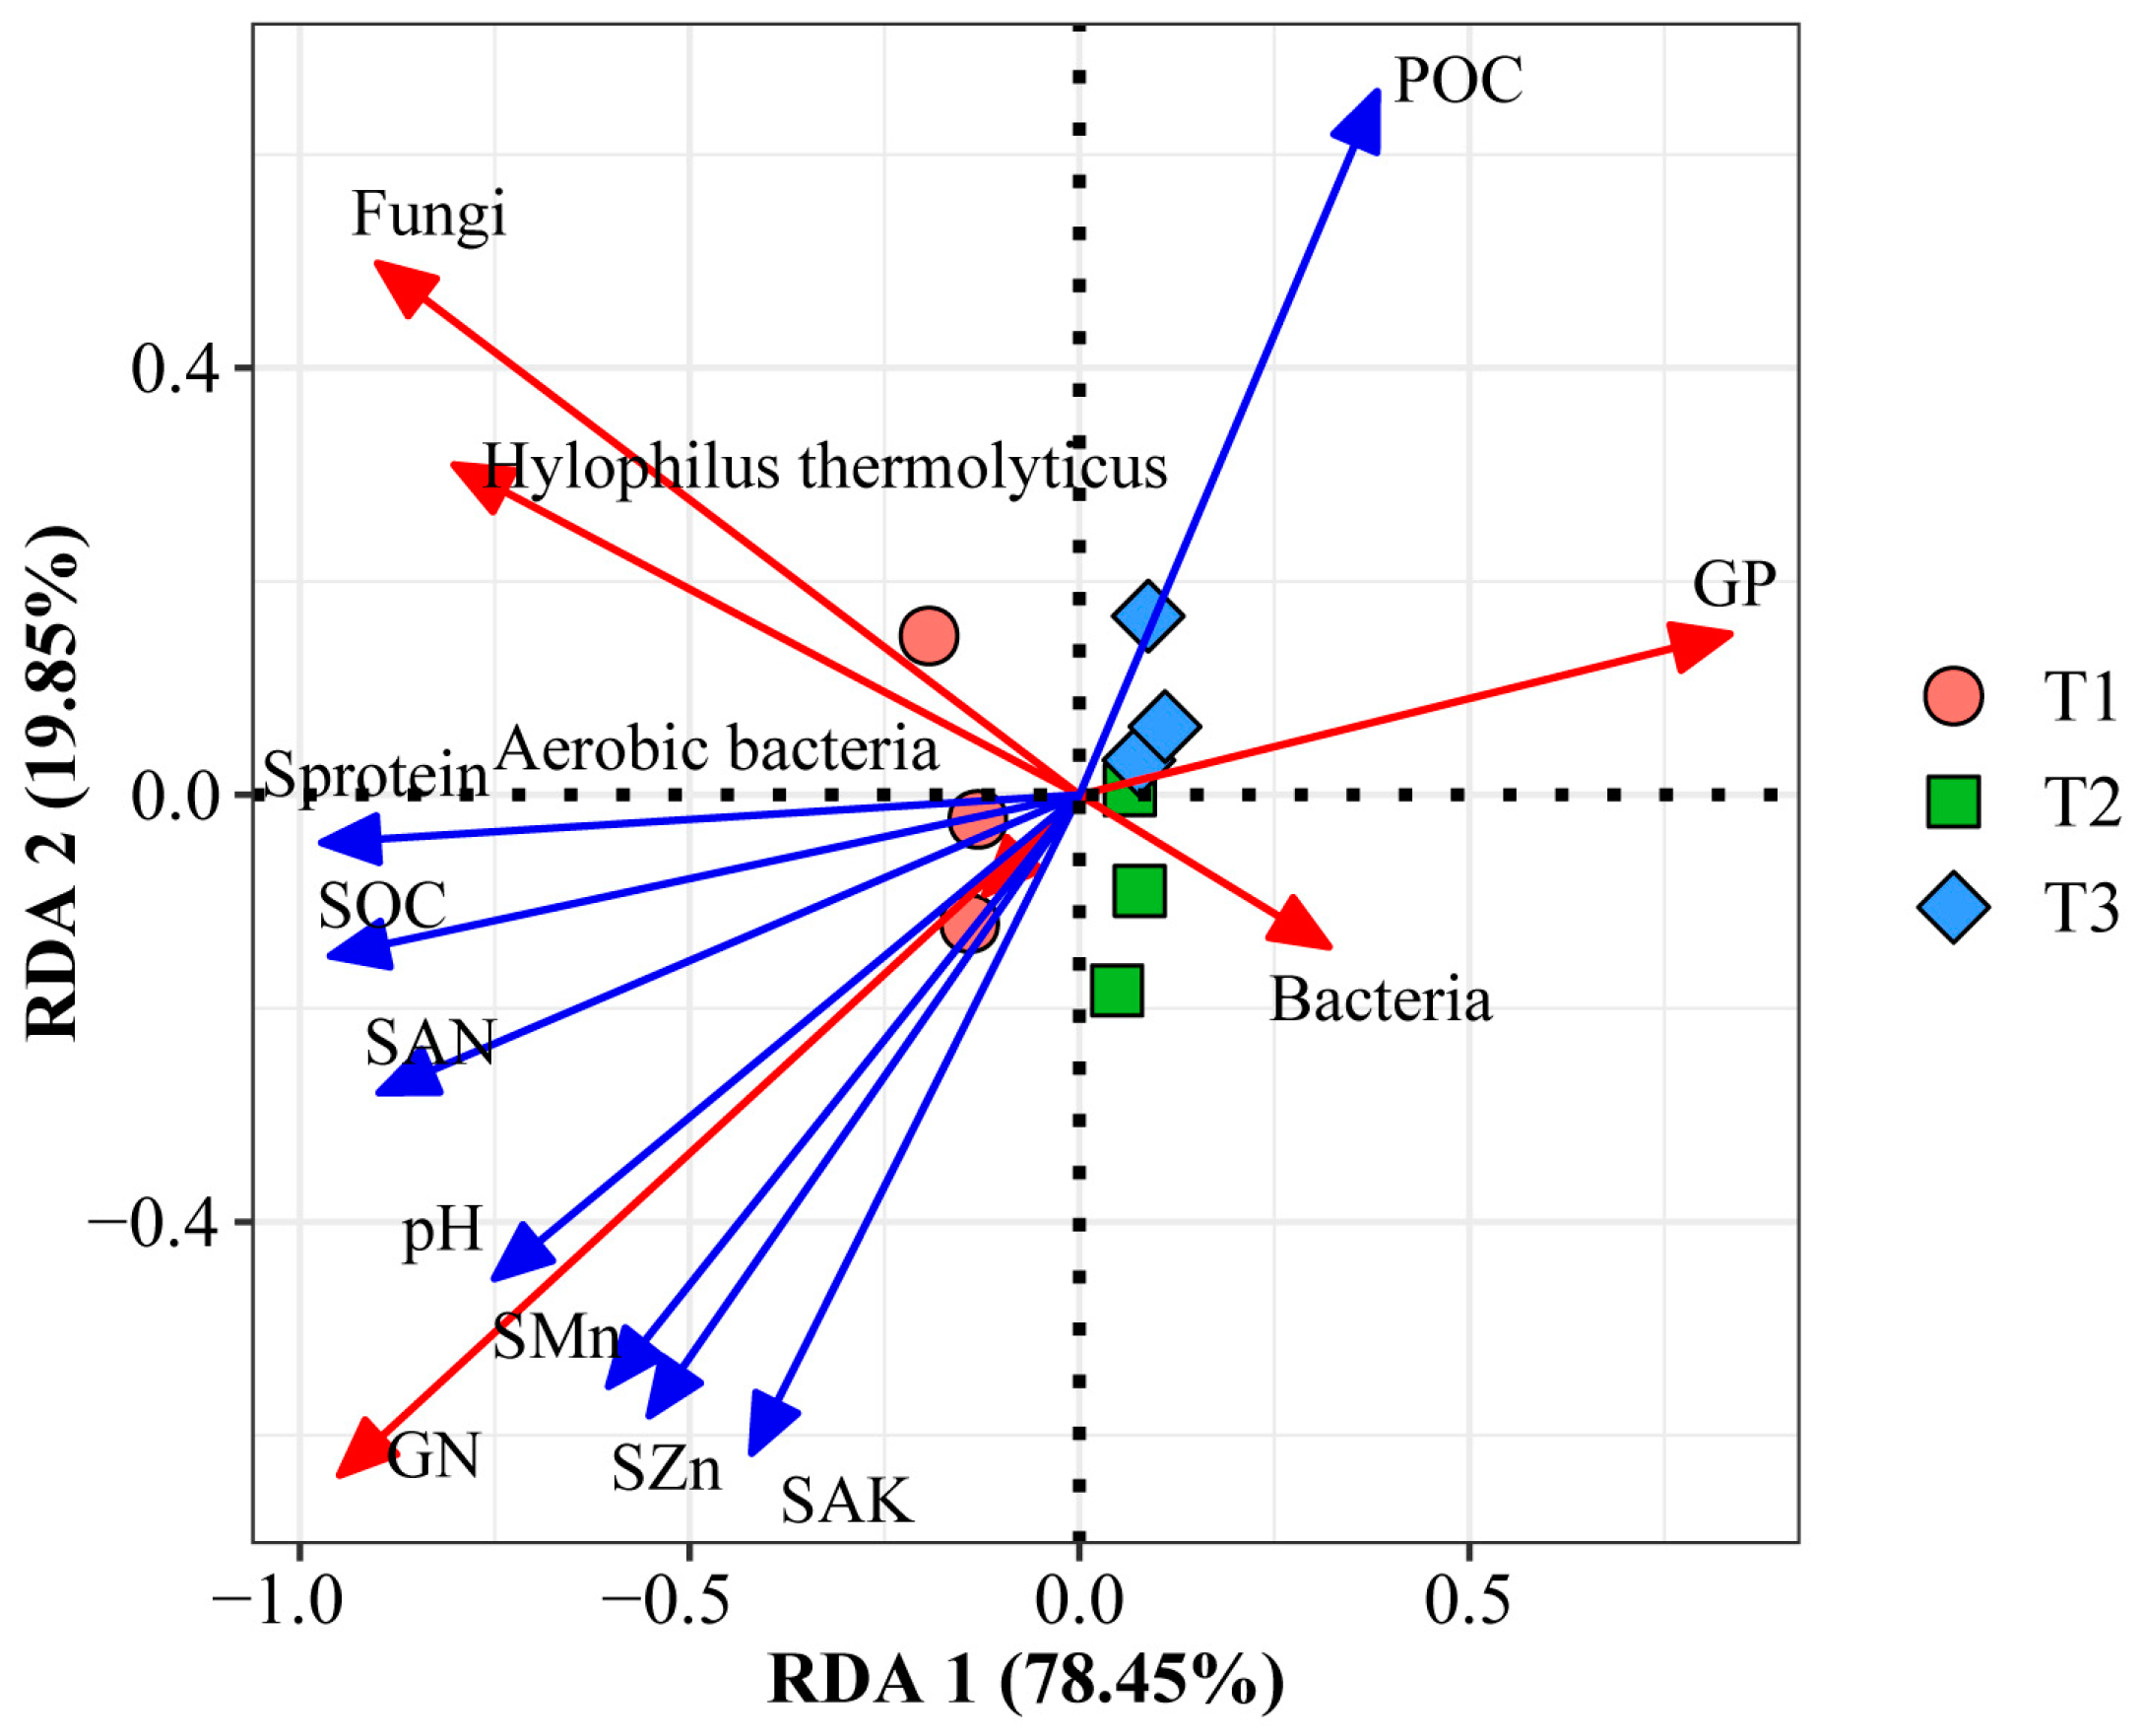
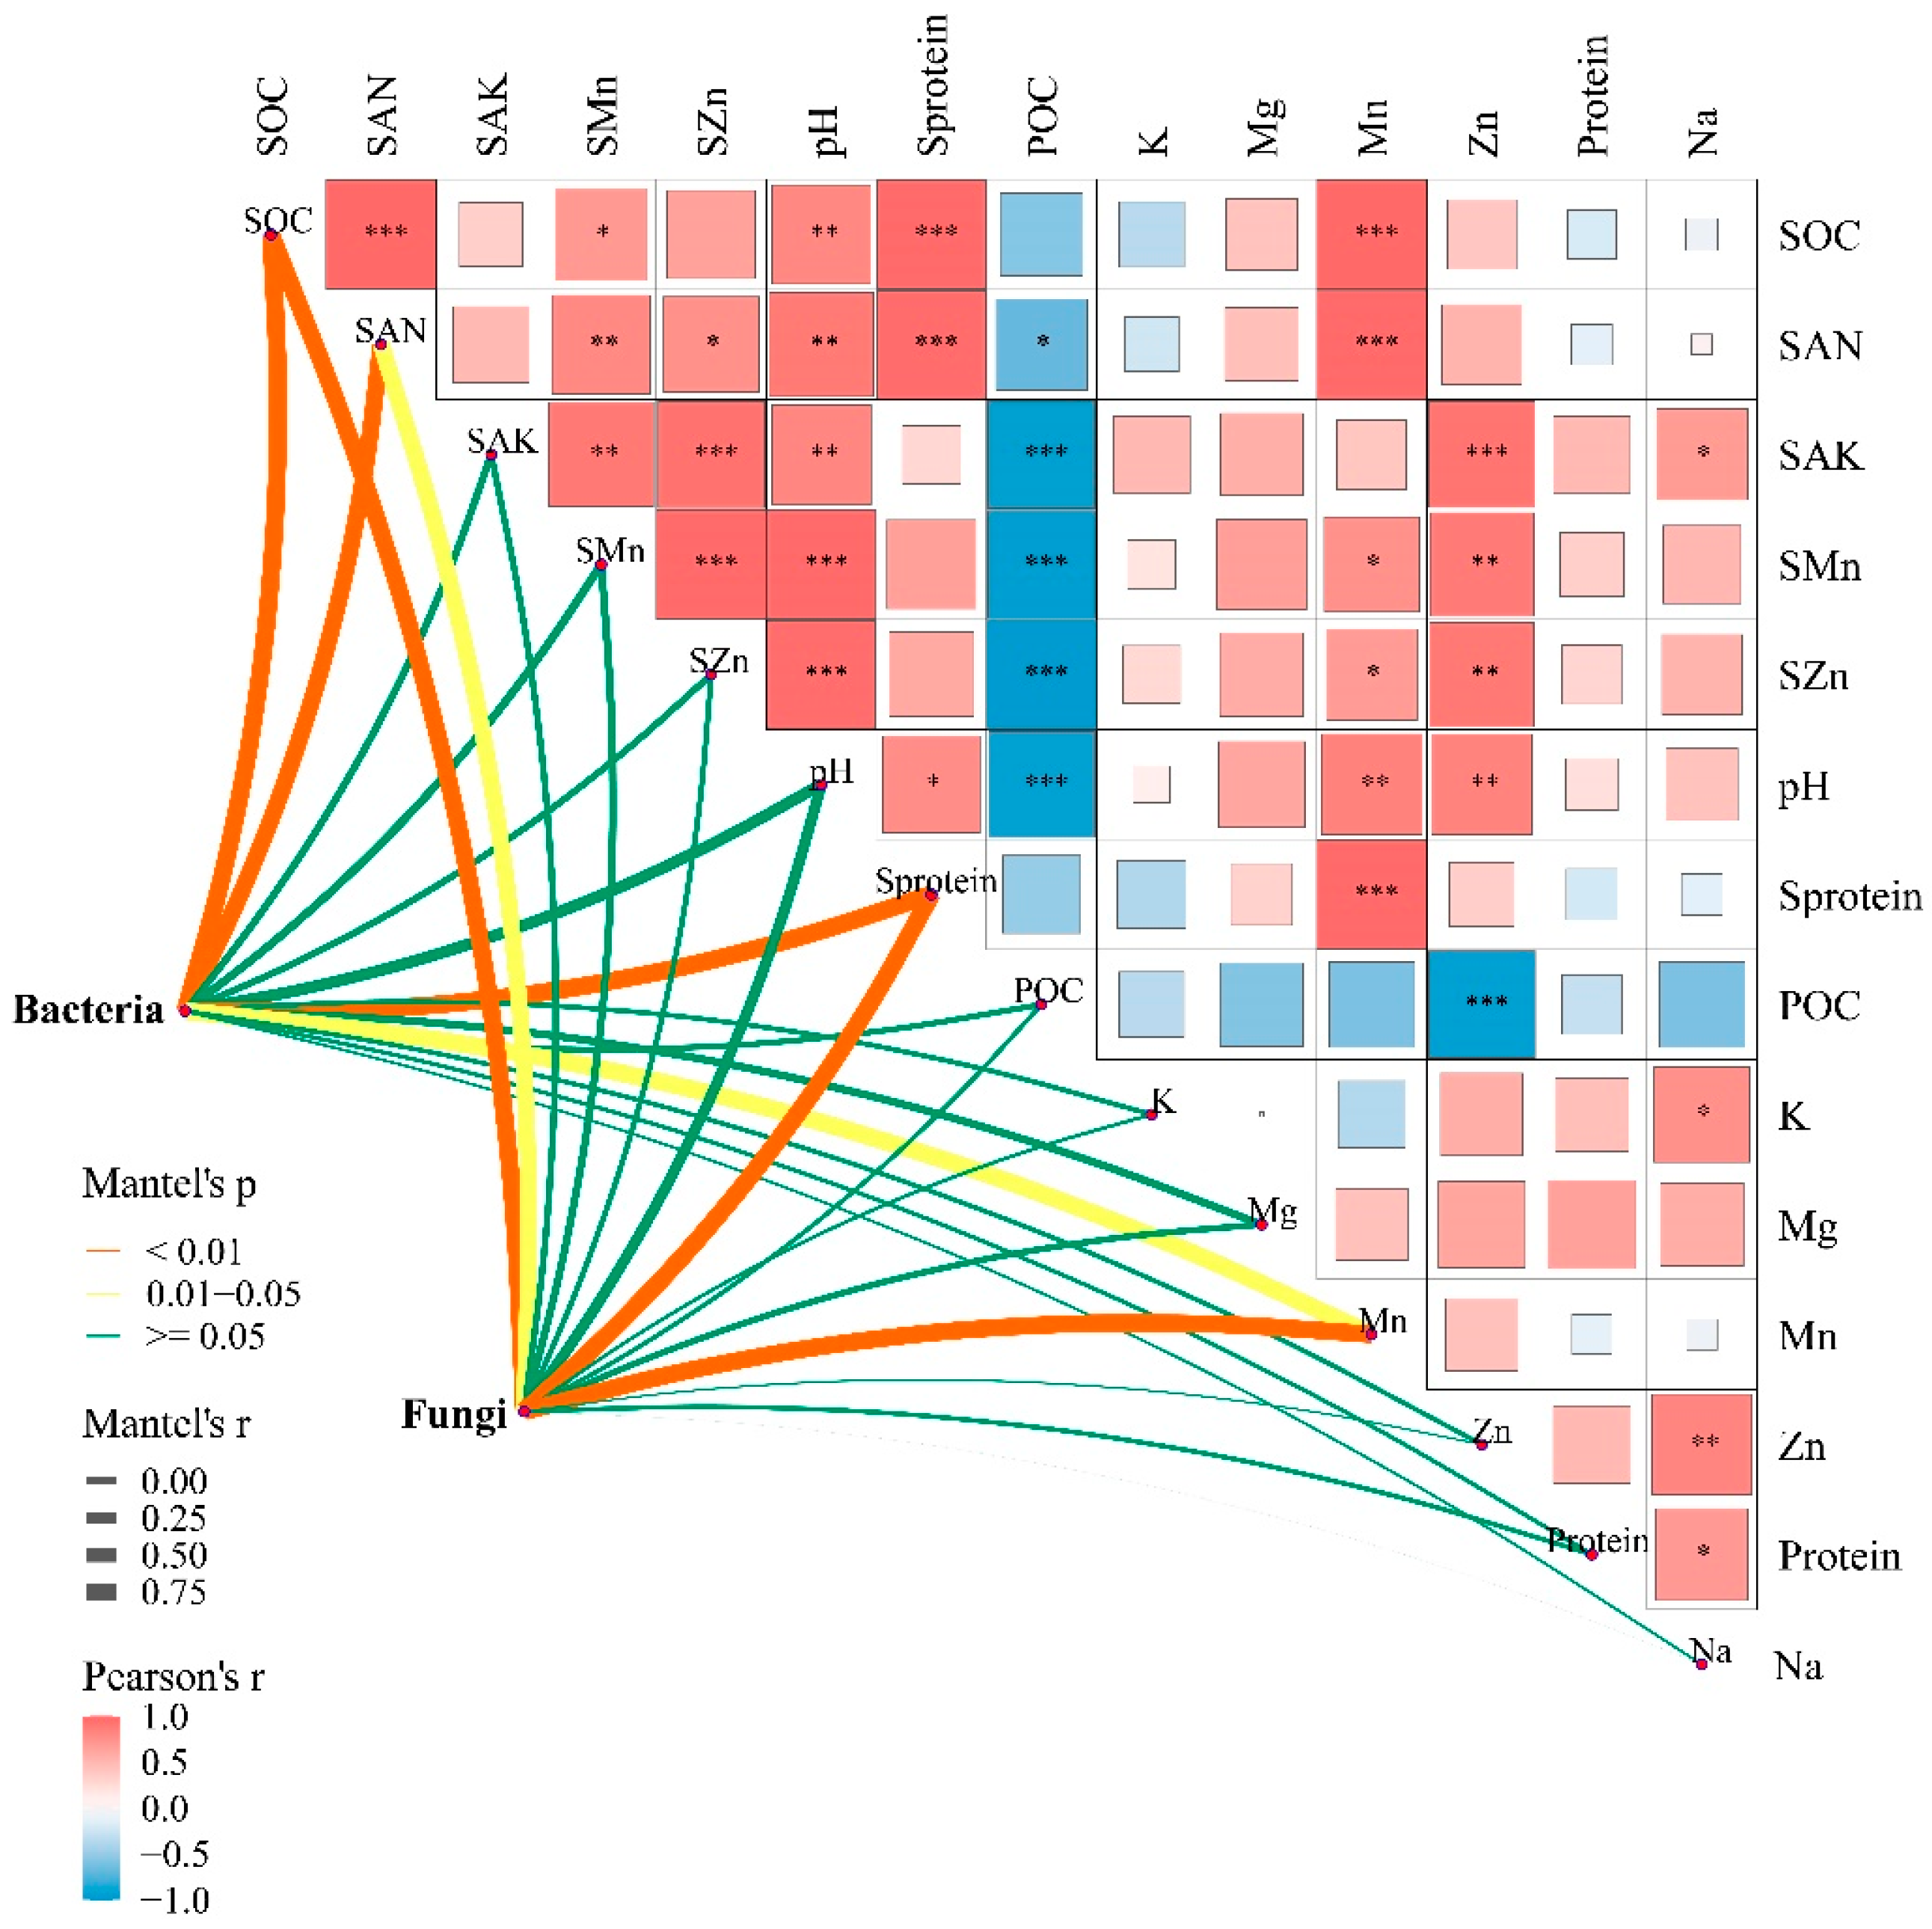
3.4. Major Factors Regulating the Composition of Soil Microbes of the B. Racemosa Pure and Associated Communities

Further, RDA was performed to investigate the correlation of soil physicochemical properties and plant traits with the soil microbial community. Here, axes 1 and 2 explained 98.30% of the variation in soil microbes of B. racemosa pure and associated mangrove forests (Figure 8). The composition of the microbial community in the B. racemosa pure forest (T1) was correlated with high SOC, SAN, soil pH, and Sprotein content. Similarly, the microbes of the B. racemosa + Talipariti tiliaceum + Pongamia pinnata community (T3) were correlated with elevated plant organic carbon content and low SAK, SZn, and SMn contents. However, the environmental factors had no outstanding impact on the microbes in T2.
Furthermore, Mantel’s test of Pearson’s correlations between the microbial community and the soil and plant features was performed to assess the specific effect of various factors on the microbial composition and diversity (Figure 9). The soil properties SOC, Sprotein, and SAN and the plant trait leaf Mn content jointly improved the abundance of the bacterial and fungal groups in the mangrove ecosystems (p < 0.05). On the other hand, SZn, SAK, leaf Mg, and leaf protein content had weak regulatory effects on the soil microbes (Figure 9).
Finally, we aimed to identify the species common and unique to different plant communities. The Venn diagram shows that the four plant community types, CK, T1, T2, and T3, shared six cores bacterial OTUs (Figure 10A) and fifteen core fungal OTUs (Figure 10B). PCoA based on the Bray–Curtis distances showed that the mangrove community type significantly influenced the structure of the bacterial and fungal communities (Figure 10C,D). For the bacterial communities, the PCoA plot showed the clustering of CK, T1, and T2 into a group, while T3 formed a distinct cluster (Figure 10C). In terms of the fungal communities, a vast difference was detected between T1 and other groups (CK, T2, and T3) (Figure 10D).

4. Discussion

4.1. Soil Physicochemical Characteristics and Plant Traits Influence Soil Microbial Community in the B. Racemosa Pure and Associated Communities

Multivariate characterization of edaphic and biotic factors across plant successional gradients demonstrates that plant assemblage identity exerts hierarchical control over belowground biogeochemical processes, with cascading effects on microbial community structure and ecosystem functionality [36,37]. The present study observed differences in soil physicochemical properties and plant traits among the various B. racemosa communities (T1, T2, T3) and compared them with the rice field (CK), underscoring the profound influence of vegetation type on soil quality and plant health. Specifically, the B. racemosa pure forests (T1) exhibited elevated levels of soil organic carbon (SOC), soil organic matter (SOM), and soil pH, indicative of enhanced soil fertility and optimal conditions for microbial growth. These soil features also indicate high soil microbial activity and nutrient supply, supporting the mangrove ecosystems’ growth and sustainability. Conversely, the high levels of available phosphorus (SAP) and available potassium (SAK) in the soil of CK suggest a distinct nutrient management of rice fields, potentially related to agricultural practices, such as fertilization. Additionally, we found excellent leaf traits for the plants in the B. racemosa mangrove ecosystems, such as high leaf organic carbon (LOC) in T3 and high leaf magnesium (Mg) in T1. These observations imply that the B. racemosa pure and associated communities influence leaf nutrient dynamics, considerably affecting plant–microbe interactions and overall ecosystem productivity.
Rampelotto et al. found consistency in bacterial composition across ten mangrove sites and identified Proteobacteria, Acidobacteria, and Actinobacteria as the most abundant phyla of mangrove ecosystems [38]. In the present study, the B. racemosa + Talipariti tiliaceum + Pongamia pinnata community (T3), with considerable soil water content, promoted the abundance of Acidobacteria (Figure 3), known for their ability to thrive in low-nutrient environments and considered as slow-growing K-strategists [39]. Additionally, in mangrove communities, Cyanobacterium was the dominant fungal genus, which probably plays a key role in maintaining ecosystem productivity. We also found Pseudomonas as an important part of the bacterial community in the mangrove ecosystem (Figure 3), consistent with earlier reports on their role in degrading hydrocarbon pollutants of these ecosystems [4]. Furthermore, the study detected differences in the composition and diversity of the microbial communities among the different B. racemosa ecosystems, illustrating the impact of plant types on soil microbes. The detailed analysis identified Pseudomonadota, Bacillota, and Acidobacteriota as the predominant bacterial phyla and Ascomycota and Basidiomycota as the dominant fungal phyla of the mangrove communities. A significantly higher bacterial abundance was detected in T1, highlighting the conditions favorable for microbial proliferation in the pure B. racemosa ecosystem. Furthermore, the difference among the community types in the clustering (Bray–Curtis distances) of the bacterial and fungal communities reinforces that microbial ecosystems are associated with plant communities [40]. For instance, the bacterial communities of T1, T2, and T3 samples clustered as one but appeared distinct from those of the rice field (CK) (Figure 4C). This observation suggests that the mangrove ecosystem favors specific microbial consortia, different from the standard agricultural systems, such as the rice field. Thus, our study demonstrates differences in soil physicochemical characteristics and plant traits among the B. racemosa pure and associated communities, which probably influence the composition and structure of soil microorganisms.

4.2. Factors Driving the Soil Bacterial and Fungal Communities in B. racemosa Pure and Associated Communities

Plant diversity and soil features have been strongly associated with soil microbial diversity [41,42]. Specifically, complex vegetation during secondary succession provides more carbon and nutrients for microbial growth [43,44,45]. Moreover, studies have proven that the changes in carbon substrates in the soil impact the microbiota; the soil microbial community exhibits changes with minor variations in soil carbon content [46,47]. Notably, we found a clear separation of the bacteria and fungi of CK from other mangrove ecosystems, potentially due to the nutrient support from the mangrove plants. Research has proven that litter composition significantly impacts both soil microbial biomass and community composition [48]. Mangroves provide a large amount of litter into the soil, and the nutrients from mangrove secretions and residue decomposition strongly influence microbial populations in mangrove sediments [4]. Generally, mangrove sediments have more acidic humic substances due to the continuous input of leaves and detritus. In this study, the pure B. racemosa forest (T1) exhibited a high level of bacterial α-diversity but a low level of fungal α-diversity (Figure 7), while the associated communities T2 and T3 displayed an opposite trend, which indicated potential differences in the impact of mangrove species on the composition and structure of bacterial and fungal communities. These findings confirm that the mangrove community significantly influences the distribution of dominant soil fungi but has a minimal impact on the distribution of major bacteria (Figure 4 and Figure 7). These observations also suggest that soil fungal communities exhibit more excellent responsiveness to changes in habitat, including those in mangrove ecosystems [49].
The observed shifts in microbial life strategies underscore fundamental ecological trade-offs governing community assembly in dynamic intertidal systems, where organic carbon availability impose selective pressures on microbial functional guilds [50,51]. In this study, the F:B ratio of the fields with rice was higher than that of the fields with dominant trees (mangroves) (p < 0.05, Table 3), suggesting a shift in soil microbial communities from K-strategists (fungi) to r-strategists (bacteria) to adapt to the complex conditions in the mangrove ecosystems. Furthermore, soil organic carbon, protein, and available nitrogen demonstrated a greater impact on bacteria and fungi than other environmental features (Figure 9). Specifically, SOC was identified as an important factor influencing microbial communities (Figure 9), crucial for soil nutrient cycling and organic matter breakdown [52]. The RDA of this study indicated the role of environmental factors in shaping microbial community structure in the mangrove ecosystem. The elevated levels of SOC, Sprotein, and SAN in the B. racemosa pure forest (T1) promoted soil microbial diversity and abundance, reflecting a robust nutrient supply and favorable habitat for both bacteria and fungi. In addition, a close relation was found between leaf organic carbon content (LOC) and the gram-positive bacterial abundance in the B. racemosa and associated communities (T2, T3). In our study, these effects of the soil and plant traits, such as SOC, SAN, and LOC, on microbial abundance confirm the intricate relationships between plant and microbial communities and their shared environment in mangrove ecosystems. Subsequently, the PCoA scatter plot based on the microbial composition exhibited a clear separation of the B. racemosa pure and associated communities from the rice field (Figure 10), emphasizing that distinct environmental conditions induce specific adaptative responses in the microbial communities.
Notably, our findings unravel a tripartite interplay between plant-mediated biogeochemical cycling, microbial community dynamics, and ecosystem functionality. We further found a positive correlation between leaf Mn content and the abundance of soil bacteria and fungi in the mangrove ecosystems. Additionally, mangrove plants demonstrated a significant impact on the growth of soil fungi by providing carbon through litter, and the differences in plant type led to variations in soil fungi composition across the different ecosystems. Like bacteria, soil fungi also enhance plant growth by forming symbiotic relationships with plants and breaking down complex compounds. The plants, in turn, influence soil microbial communities through litter and rhizosphere features. Studies have shown that the organic inputs from plant litter promote nutrient utilization by microbes [53], and soil carbon and nitrogen dynamics impact the composition of the fungal community, particularly that of basidiomycetes, which metabolize organic substrates [54]. These findings suggest the importance of biodiversity and complex interactions in maintaining mangrove ecosystems’ balance and functional resilience.

4.3. Limitations and Future Directions in Plant-Microbe Interaction Studies

While this study provides critical insights into soil microbiome dynamics, it does not address plant-associated microbial communities (e.g., root endophytes, phyllosphere microbes). This limitation arises from our focused research design prioritizing soil–plant feedbacks mediated through physicochemical parameters rather than direct plant–microbe colonization patterns. Our PLFA and sequencing protocols were optimized for soil matrix analysis, lacking the spatial resolution required to differentiate rhizoplane vs. bulk soil microbiomes. Future investigations should integrate metatranscriptomic profiling of root tissues and leaf surfaces to disentangle host-specific microbial recruitment mechanisms from environmental filtering effects.

5. Conclusions

Our findings validate the initial hypotheses by demonstrating tiered ecological linkages across Barringtonia racemosa communities. First, multivariate analysis revealed significant variations in soil properties (SOC, SAN), vegetation traits (leaf Mn, Mg), and microbial characteristics (F:B ratio, β-diversity) between pure and associated communities, with T1 exhibiting superior nutrient retention capacity. Second, while bacterial α-diversity remained stable across communities, fungal diversity showed marked sensitivity to plant composition, aligning with global patterns of fungal responsiveness to habitat specificity. Third, redundancy analysis identified SOC, SAN, and leaf Mn as dominant drivers of microbial assembly, explaining 72% of community variance—a mechanistic insight corroborating recent studies on mangrove nutrient–microbe coupling. Crucially, the pure B. racemosa community’s microbial profile, enriched in lignolytic Myxococcus and Mnoxidizing Ascomycota, underscores its ecological uniqueness compared with anthropogenically influenced rice fields. These results advance mangrove restoration strategies by prioritizing SOC enhancement and Mn-cycling plant species in microbial-informed conservation frameworks.

Author Contributions

Conceptualization, X.T. and F.L.; methodology, J.H., Y.Y., X.Y., L.L., Y.T., Z.D. and Y.W.; software, Y.L.; formal analysis, F.L. and Y.L.; investigation, X.T. and F.L.; data curation, J.H., Y.Y., X.Y., L.L., Y.T., Z.D. and Y.W.; writing—original draft preparation, Y.L., X.T. and F.L.; writing—review and editing, all authors; funding acquisition, Y.L., X.T., Y.Y., L.L. and F.L. All authors have read and agreed to the published version of the manuscript.

Funding

This research was funded by “Natural Science Foundation of Guangxi Province, China, grant number 2022GXNSFBA035540”, “National Natural Science Foundation of China, grant number 31660226”, “Science and Technology Foundation of Guangxi Zhuang Autonomous Region, grant number Guike AD23026080”, “Young Talents Scientific Research Start-up Project of Guangxi Zhuang Autonomous Region, grant number 2025QMZK07”, “Special Project for Basic Scientific Research of Guangxi Academy of Agricultural Sciences, grant number Guinongke 2024YP134, 2024YP135 and 2025YP133”, and the Project for Enhancing Young and Middle-aged Teacher’s Research Basic Ability in Colleges of Guangxi, grant number 2024KY0591.

Institutional Review Board Statement

Not applicable.

Data Availability Statement

The data generated in the study are included in the article. Further inquiries can be directed to the corresponding authors.

Conflicts of Interest

The authors declare that they have no known competing financial interests or personal relationships that could have appeared to influence the work reported in this paper.

References

  1. Andreote, F.D.; Jiménez, D.J.; Chaves, D.; Dias, A.C.F.; Luvizotto, D.M.; Dini-Andreote, F.; Fasanella, C.C.; Lopez, M.V.; Baena, S.; Taketani, R.G.; et al. The microbiome of Brazilian mangrove sediments as revealed by metagenomics. PLoS ONE 2012, 7, e38600. [Google Scholar] [CrossRef]
  2. Alongi, D.M. Carbon cycling and storage in mangrove forests. Annu. Rev. Mar. Sci. 2014, 6, 195–219. [Google Scholar] [CrossRef]
  3. Jusoff, K. Malaysian mangrove forests and their significance to the coastal marine environment. Pol. J. Environ. Stud. 2013, 22, 979–1005. [Google Scholar]
  4. Holguin, G.; Vazquez, P.; Bashan, Y. The role of sediment microorganisms in the productivity, conservation, and rehabilitation of mangrove ecosystems: An overview. Biol. Fertil. Soils 2001, 33, 265–278. [Google Scholar] [CrossRef]
  5. Arfi, Y.; Buée, M.; Marchand, C.; Levasseur, A.; Record, E. Multiple markers pyrosequencing reveals highly diverse and host-specific fungal communities on the mangrove trees Avicennia marina and Rhizophora stylosa. FEMS Microbiol. Ecol. 2012, 79, 433–444. [Google Scholar] [CrossRef] [PubMed]
  6. Hong, K.; Gao, A.H.; Xie, Q.Y.; Gao, H.; Zhuang, L.; Lin, H.P.; Yu, H.P.; Li, J.; Yao, X.S.; Goodfellow, M.; et al. Actinomycetes for marine drug discovery isolated from mangrove soils and plants in China. Mar. Drugs 2009, 7, 24–44. [Google Scholar] [CrossRef]
  7. Yang, Y.; Chen, X.; Liu, L.; Li, T.; Dou, Y.; Qiao, J.; Wang, Y.; An, S.; Chang, S.X. Nitrogen fertilization weakens the linkage between soil carbon and microbial diversity: A global meta-analysis. Glob. Change Biol. 2022, 28, 6446–6461. [Google Scholar] [CrossRef]
  8. Banerjee, S.; van der Heijden, M.G.A. Soil microbiomes and one health. Nat. Rev. Microbiol. 2023, 21, 6–20. [Google Scholar] [CrossRef]
  9. Wu, Y.T.; Gutknecht, J.; Nadrowski, K.; Geißler, C.; Kühn, P.; Scholten, T.; Both, S.; Erfmeier, A.; Böhnke, M.; Bruelheide, H.; et al. Relationships between soil microorganisms, plant communities, and soil characteristics in Chinese subtropical forests. Ecosystems 2012, 15, 624–636. [Google Scholar] [CrossRef]
  10. Smith, M.E.; Facelli, J.M.; Cavagnaro, T.R. Interactions between soil properties, soil microbes and plants in remnant-grassland and old-field areas: A reciprocal transplant approach. Plant Soil 2018, 433, 127–145. [Google Scholar] [CrossRef]
  11. Hawkins, A.P.; Crawford, K.M. Interactions between plants and soil microbes may alter the relative importance of intraspecific and interspecific plant competition in a changing climate. AoB Plants 2018, 10, ply039. [Google Scholar] [CrossRef]
  12. Meng, F.; Hu, A.; Wang, J. Microbial traits shed light on species distributions, assembly processes and ecosystem functions. Acta Microbiol. Sin. 2020, 60, 1784–1800. [Google Scholar] [CrossRef]
  13. Lan, G.; Quan, F.; Yang, C.; Sun, R.; Chen, B.; Zhang, X.; Wu, Z. Driving factors for soil fungal and bacterial community assembly in topical forest of China. Appl. Soil Ecol. 2022, 177, 104520. [Google Scholar] [CrossRef]
  14. Li, J.; Cooper, J.M.; Lin, Z.a.; Li, Y.; Yang, X.; Zhao, B. Soil microbial community structure and function are significantly affected by long-term organic and mineral fertilization regimes in the North China Plain. Appl. Soil Ecol. 2015, 96, 75–87. [Google Scholar] [CrossRef]
  15. Barreto, C.R.; Morrissey, E.M.; Wykoff, D.D.; Chapman, S.K. Co-occurring mangroves and salt marshes differ in microbial community composition. Wetlands 2018, 38, 497–508. [Google Scholar] [CrossRef]
  16. Lin, X.; Zhu, B.; Peng, Y.; Lin, G.; Sun, D.; Ye, W. Responses of microbial communities and greenhouse gas production to land use change in mangrove wetland sediments. Limnol. Oceanogr. 2025. [Google Scholar] [CrossRef]
  17. Fu, X.; Huang, Y.; Fu, Q.; Qiu, Y.; Zhao, J.; Li, J.; Wu, X.; Yang, Y.; Liu, H.; Yang, X.; et al. Critical transition of soil microbial diversity and composition triggered by plant rhizosphere effects. Front. Plant Sci. 2023, 14, 1252821. [Google Scholar] [CrossRef]
  18. Li, Q.; Feng, J.; Wu, J.; Jia, W.; Zhang, Q.; Chen, Q.; Zhang, D.; Cheng, X. Spatial variation in soil microbial community structure and its relation to plant distribution and local environments following afforestation in central China. Soil Tillage Res. 2019, 193, 8–16. [Google Scholar] [CrossRef]
  19. Muwawa, E.M.; Makonde, H.M.; Obieze, C.C.; de Oliveira, I.G.; Jefwa, J.M.; Kahindi, J.H.P.; Khasa, D.P. Diversity and assembly patterns of mangrove rhizosphere mycobiome along the coast of Gazi Bay and Mida Creek in Kenya. PLoS ONE 2024, 19, e0298237. [Google Scholar] [CrossRef]
  20. Qin, H.; Yang, Y.; Dong, S.; He, Q.; Jia, Y.; Zhao, L.; Yu, S.; Liu, H.; Liu, B.; Yan, Y.; et al. Threatened species list of China’s higher plants. Biodivers. Sci. 2017, 25, 696–744. [Google Scholar] [CrossRef]
  21. Liang, F.; Tan, X.; Deng, X.; Wu, Y.; Wu, M.; Yang, X.; Li, J. Growth and physiological responses of semi-mangrove plant Barringtonia racemosa to waterlogging and salinity stress. Guihaia 2021, 41, 872–882. [Google Scholar] [CrossRef]
  22. Zhang, S.; Tan, X.; Zhou, Y.; Liu, N. Effects of a heavy metal (cadmium) on the responses of subtropical coastal tree species to drought stress. Environ. Sci. Pollut. Res. 2023, 30, 12682–12694. [Google Scholar] [CrossRef] [PubMed]
  23. Liang, F.; Hu, J.; Lin, Y.; Li, L.; Yu, Y.; Liu, B.; Meng, Z.; Xiang, Z.; Tan, X. Interspecific competition and survival pressures in endangered Barringtonia racemosa populations of Mainland China. Sci. Rep. 2024, 14, 31190. [Google Scholar] [CrossRef]
  24. Guo, C.; Chen, Q.; Xu, S.; Chen, H.; Li, W.; Pan, T. The disturbance mechanism and potential ecological loss of the Barringtonia racemosa community on the east coast of Leizhou Peninsula. J. South China Norm. Univ. (Nat. Sci. Ed.) 2019, 51, 67–75. [Google Scholar] [CrossRef]
  25. Lin, X.; Hou, L.; Liu, M.; Li, X.; Zheng, Y.; Yin, G.; Gao, J.; Jiang, X. Nitrogen mineralization and immobilization in sediments of the East China Sea: Spatiotemporal variations and environmental implications. J. Geophys. Res. Biogeosciences 2016, 121, 2842–2855. [Google Scholar] [CrossRef]
  26. Jiang, L.; Geng, Z.; Li, S.; She, D.; He, X.; Zhang, Q.; Liang, C.; Liu, D.; Jing, W.; Wang, S. Soil cation exchange capacity and exchangeable base cation content in the profiles of four typical soils in the Xi-Shui Forest Zone of the Qilian Mountains. Acta Ecol. Sin. 2012, 32, 3368–3377. [Google Scholar] [CrossRef]
  27. Bao, X.; Focke, M.; Pollard, M.; Ohlrogge, J. Understanding in vivo carbon precursor supply for fatty acid synthesis in leaf tissue. Plant J. 2000, 22, 39–50. [Google Scholar] [CrossRef]
  28. Yu, W.; Gao, H.; Kang, H. Ester Linked Fatty Acid (ELFA) method should be used with caution for interpretating soil microbial communities and their relationships with environmental variables in forest soils. PLoS ONE 2021, 16, e0251501. [Google Scholar] [CrossRef]
  29. Olsson, P.A. Signature fatty acids provide tools for determination of the distribution and interactions of mycorrhizal fungi in soil. FEMS Microbiol. Ecol. 1999, 29, 303–310. [Google Scholar] [CrossRef]
  30. Zelles, L. Fatty acid patterns of phospholipids and lipopolysaccharides in the characterisation of microbial communities in soil: A review. Biol. Fertil. Soils 1999, 29, 111–129. [Google Scholar] [CrossRef]
  31. Landesman, W.J.; Dighton, J. Response of soil microbial communities and the production of plant-available nitrogen to a two-year rainfall manipulation in the New Jersey Pinelands. Soil Biol. Biochem. 2010, 42, 1751–1758. [Google Scholar] [CrossRef]
  32. Rognes, T.; Flouri, T.; Nichols, B.; Quince, C.; Mahé, F. VSEARCH: A versatile open source tool for metagenomics. PeerJ 2016, 4, e2584. [Google Scholar] [CrossRef] [PubMed]
  33. Quast, C.; Pruesse, E.; Yilmaz, P.; Gerken, J.; Schweer, T.; Yarza, P.; Peplies, J.; Glöckner, F.O. The SILVA ribosomal RNA gene database project: Improved data processing and web-based tools. Nucleic Acids Res. 2013, 41, D590–D596. [Google Scholar] [CrossRef] [PubMed]
  34. Kõljalg, U.; Nilsson, R.H.; Abarenkov, K.; Tedersoo, L.; Taylor, A.F.; Bahram, M.; Bates, S.T.; Bruns, T.D.; Bengtsson-Palme, J.; Callaghan, T.M.; et al. Towards a unified paradigm for sequence-based identification of fungi. Mol. Ecol. 2013, 22, 5271–5277. [Google Scholar] [CrossRef]
  35. Kemp, P.F.; Aller, J.Y. Bacterial diversity in aquatic and other environments: What 16S rDNA libraries can tell us. FEMS Microbiol. Ecol. 2004, 47, 161–177. [Google Scholar] [CrossRef]
  36. Zhao, M.; Yang, Y.; Zhang, H.; Li, Q.; Zhao, X.; Guo, X.; Liu, W.; Wan, F. Asymmetric succession in soil microbial communities enhances the competitive advantage of invasive alien plants. Microbiome 2024, 12, 265. [Google Scholar] [CrossRef] [PubMed]
  37. Kivlin, S.N.; Mann, M.A.; Lynn, J.S.; Melanie, R.K.; Taylor, D.L.; Jennifer, A.R. Grass species identity shapes communities of root and leaf fungi more than elevation. ISME Commun. 2022, 2, 25. [Google Scholar] [CrossRef]
  38. Rampelotto, P.H.; de Siqueira Ferreira, A.; Barboza, A.D.; Roesch, L.F. Changes in diversity, abundance, and structure of soil bacterial communities in Brazilian Savanna under different land use systems. Microb. Ecol. 2013, 66, 593–607. [Google Scholar] [CrossRef]
  39. Lasa, A.V.; Fernández-González, A.J.; Villadas, P.J.; Toro, N.; Fernández-López, M. Metabarcoding reveals that rhizospheric microbiota of Quercus pyrenaica is composed by a relatively small number of bacterial taxa highly abundant. Sci. Rep. 2019, 9, 1695. [Google Scholar] [CrossRef]
  40. Gschwend, F.; Hartmann, M.; Mayerhofer, J.; Hug, A.-S.; Enkerli, J.; Gubler, A.; Meuli, R.G.; Frey, B.; Widmer, F. Site and land-use associations of soil bacteria and fungi define core and indicative taxa. FEMS Microbiol. Ecol. 2021, 97, fiab165. [Google Scholar] [CrossRef]
  41. Zak, D.R.; Holmes, W.E.; White, D.C.; Peacock, A.D.; Tilman, D. Plant diversity, soil microbial communities, and ecosystem function: Are there any links? Ecology 2003, 84, 2042–2050. [Google Scholar] [CrossRef]
  42. van der Heijden, M.G.; Bardgett, R.D.; van Straalen, N.M. The unseen majority: Soil microbes as drivers of plant diversity and productivity in terrestrial ecosystems. Ecol. Lett. 2008, 11, 296–310. [Google Scholar] [CrossRef] [PubMed]
  43. Teixeira, H.M.; Cardoso, I.M.; Bianchi, F.J.J.A.; da Cruz Silva, A.; Jamme, D.; Peña-Claros, M. Linking vegetation and soil functions during secondary forest succession in the Atlantic forest. For. Ecol. Manag. 2020, 457, 117696. [Google Scholar] [CrossRef]
  44. Shao, S.; Zhao, Y.; Zhang, W.; Hu, G.; Xie, H.; Yan, J.; Han, S.; He, H.; Zhang, X. Linkage of microbial residue dynamics with soil organic carbon accumulation during subtropical forest succession. Soil Biol. Biochem. 2017, 114, 114–120. [Google Scholar] [CrossRef]
  45. Liu, Q.; Zhao, W. Plant–soil microbe feedbacks drive seedling establishment during secondary forest succession: The ‘successional stage hypothesis’. J. Plant Ecol. 2023, 16, rtad021. [Google Scholar] [CrossRef]
  46. Tang, J.; Yin, J.; Davy, A.J.; Pan, F.; Miao, R.; Han, X. Changes in soil fertility and microbial communities following cultivation of native grassland in Horqin Sandy Land, China: A 60-year chronosequence. Ecol. Process. 2023, 12, 18. [Google Scholar] [CrossRef]
  47. Zhang, Y.; Cong, J.; Lu, H.; Yang, C.; Yang, Y.; Zhou, J.; Li, D. An integrated study to analyze soil microbial community structure and metabolic potential in two forest types. PLoS ONE 2014, 9, e93773. [Google Scholar] [CrossRef]
  48. Chen, Y.; Ma, S.; Jiang, H.; Hu, Y.; Lu, X. Influences of litter diversity and soil moisture on soil microbial communities in decomposing mixed litter of alpine steppe species. Geoderma 2020, 377, 114577. [Google Scholar] [CrossRef]
  49. Jiang, S.; Xing, Y.; Liu, G.; Hu, C.; Wang, X.; Yan, G.; Wang, Q. Changes in soil bacterial and fungal community composition and functional groups during the succession of boreal forests. Soil Biol. Biochem. 2021, 161, 108393. [Google Scholar] [CrossRef]
  50. Ho, A.; Di Lonardo, D.P.; Bodelier, P.L. Revisiting life strategy concepts in environmental microbial ecology. FEMS Microbiol. Ecol. 2017, 93, fix006. [Google Scholar] [CrossRef]
  51. Ona, L.; Kost, C. Cooperation increases robustness to ecological disturbance in microbial cross-feeding networks. Ecol. Lett. 2022, 25, 1410–1420. [Google Scholar] [CrossRef] [PubMed]
  52. You, Y.; Wang, J.; Huang, X.; Tang, Z.; Liu, S.; Sun, O.J. Relating microbial community structure to functioning in forest soil organic carbon transformation and turnover. Ecol. Evol. 2014, 4, 633–647. [Google Scholar] [CrossRef] [PubMed]
  53. Ren, C.; Zhao, F.; Kang, D.; Yang, G.; Han, X.; Tong, X.; Feng, Y.; Ren, G. Linkages of C:N:P stoichiometry and bacterial community in soil following afforestation of former farmland. For. Ecol. Manag. 2016, 376, 59–66. [Google Scholar] [CrossRef]
  54. Prescott, C.E.; Grayston, S.J. Tree species influence on microbial communities in litter and soil: Current knowledge and research needs. For. Ecol. Manag. 2013, 309, 19–27. [Google Scholar] [CrossRef]
Figure 1. Sampling sites exhibited in administrative map (A) and regional satellite map (B) across the mangrove communities in Leizhou Peninsula. Control (CK), T1, T2, and T3 indicate the rice field, B. racemosa community, B. racemosa + Acanthus ilicifolius community, and B. racemosa + Talipariti tiliaceum + Pongamia pinnata community, respectively.
Diversity 17 00249 g001
Figure 2. Leaf traits of different mangrove communities. LOC, leaf organic carbon (A); Leaf [N], leaf nitrogen (B); Leaf [P], leaf phosphorus (C); Leaf [K], leaf potassium (D); Leaf [Ca], leaf calcium (E); Leaf [Mg], leaf magnesium (F); Leaf [Fe], leaf iron (G); Leaf [Mn], leaf manganese (H); Leaf [Zn], leaf zinc (I); Leaf [Protein], leaf protein (J); Leaf [Na], leaf sodium (K). Lowercase letters indicate significant differences among different mangrove community types based on the Duncan test (p < 0.05). Error bars indicate standard error (SE, n = 3). T1, T2, and T3 indicate the B. racemosa pure community, the B. racemosa + Acanthus ilicifolius community, and the B. racemosa + Talipariti tiliaceum + Pongamia pinnata community, respectively.
Diversity 17 00249 g002
Figure 3. Composition and content of soil bacteria (A) and fungi (B) associated with different plant communities based on PLFA analysis. GP, gram-positive bacteria (C); GN, gram-negative bacteria (D); AB, aerobic bacteria (E); HT, hylophilus thermolyticus (F). Lowercase letters indicate significant differences among the plant community types (p < 0.05). Error bars indicate standard errors (SE, n = 3). CK, T1, T2, and T3 indicate the rice field, the B. racemosa pure community, the B. racemosa + Acanthus ilicifolius community, and the B. racemosa + Talipariti tiliaceum + Pongamia pinnata community, respectively.
Diversity 17 00249 g003
Figure 4. Rarefaction curves of the soil bacterial (A) and fungal (B) OTUs associated with different plant community types and their hierarchical clustering analysis (C,D). CK, T1, T2, and T3 indicate the rice field, the B. racemosa pure community, the B. racemosa + Acanthus ilicifolius community, and the B. racemosa + Talipariti tiliaceum + Pongamia pinnata community, respectively.
Diversity 17 00249 g004
Figure 5. Histogram shows the relative abundance of bacterial (A) and fungal (B) phyla associated with different plant community types. Only the top 10 most abundant taxa are shown; the remaining taxa were combined and shown as others. CK, T1, T2, and T3 represent the rice field, the B. racemosa pure community, the B. racemosa + Acanthus ilicifolius community, and the B. racemosa + Talipariti tiliaceum + Pongamia pinnata community, respectively.
Diversity 17 00249 g005
Figure 6. Hierarchical clustering and heatmap show the relative abundance of soil microbial species associated with different plant communities. Only the top 20 abundant taxa are shown. The dendrogram at the top represents the hierarchical clustering of samples. The color tags of the plant community types are shown on the right side.
Diversity 17 00249 g006
Figure 7. Alpha diversity indexes of soil bacterial (A) and fungal (B) genera associated with different plant communities. CK, T1, T2, and T3 along the X-axis indicate the rice field, the B. racemosa pure community, the B. racemosa + Acanthus ilicifolius community, and the B. racemosa + Talipariti tiliaceum + Pongamia pinnata community, respectively. The upper and lower end lines of the box refer to the upper and lower quartile; the difference between the quartiles is the interquartile range (IQR); the median line refers to the median; the upper and lower edges of the box refer to the maximum and minimum values (extremes within the range of 1.5 times IQR); asterisks indicate outliers. The numbers under the diversity index label are the p-values of the Kruskal–Wallis test.
Diversity 17 00249 g007
Figure 8. Ordination plots of the results from the redundancy analysis (RDA) performed to identify the relationships between the microbial community (red arrows) and the plant and soil characteristics (blue arrows). T1, T2, and T3 indicate the B. racemosa pure community, the B. racemosa + Acanthus ilicifolius community, and the B. racemosa + Talipariti tiliaceum + Pongamia pinnata community, respectively. SOC, soil organic carbon; SAN, soil available nitrogen; SAK, soil available potassium; SMn, soil manganese; SZn, soil zinc; SProtein, soil total protein; pH, soil pH; POC, plant leaf organic carbon.
Diversity 17 00249 g008
Figure 9. Mantel’s test of Pearson’s correlations between the soil microbes and the plant and soil variables. ***, **, and * indicate correlations are significant at p < 0.001, p < 0.01, and p < 0.05, respectively. Blank squares indicate correlations are not significant. The size of the square represents the size of the correlation coefficient. SOC, soil organic carbon; SAN, soil available nitrogen; SAK, soil available potassium; SMn, soil manganese; SZn, soil zinc; SProtein, soil total protein; pH, soil pH; POC, plant leaf organic carbon; K, leaf potassium; Mg, leaf magnesium; Mn, leaf manganese; Zn, leaf zinc; Protein, leaf protein; Na, leaf sodium. The blue and red boxes indicate positive and negative relations, respectively. The line thickness indicates Mantel’s correlation between the microbes and the plant and soil variables, and the line colors represent the p-value range. The size of the boxes indicates the degree of the correlation.
Diversity 17 00249 g009
Figure 10. Venn diagram of the bacterial (A) and fungal (B) OTUs, and the principal coordinates analysis (PCoA) plots based on the Bray–Curtis distances of the bacteria (C) and fungi (D) associated with different plant communities. Here, CK, T1, T2, and T3 indicate the rice field, the B. racemosa pure community, the B. racemosa + Acanthus ilicifolius community, and the B. racemosa + Talipariti tiliaceum + Pongamia pinnata community, respectively.
Diversity 17 00249 g010
Table 1. Overview of Barringtonia racemosa sites analyzed in this study.
Plot NumberCommunity TypesLongitude and LatitudeSlope PositionSlopeSlope DirectionElevation
CKRice field21°9′26.20″ N/110°7′55″ EMiddle1.72Northwest3 m
T1B. racemosa pure forest21°8′50.00″ N/110°8′2.00″ EUphill0.75North6 m
T2B. racemosa + Acanthus ilicifolius21°9′10.30″ N/110°8′2.90″ EMiddle3.37North3 m
T3B. racemosa + Talipariti tiliaceum + Pongamia pinnata21°8′50.00″ N/110°7′34.00″ EMiddle2.13Southwest4 m
Table 2. Physicochemical characteristics of soil under B. racemosa pure and associated communities. SOC, soil organic carbon; SOM, soil organic matter; SN, soil total nitrogen; SAN, soil available nitrogen; SP, soil phosphorus; SAP, soil available phosphorus; SK, soil potassium; SAK, soil available potassium; WSM, water-soluble salts; SNa, soil sodium; SCa, soil calcium; SMg, soil magnesium; SMn, soil manganese; SFe, soil iron; SZn, soil zinc; SWC, soil water content; SProtein, soil total protein. Values shown are the means ± standard error (SE; n = 3). Lowercase letters indicate significant differences among the different plant communities based on the Duncan test (p < 0.05). CK, T1, T2, and T3 indicate the rice field, the B. racemosa pure community, the B. racemosa + Acanthus ilicifolius community, and the B. racemosa + Talipariti tiliaceum + Pongamia pinnata community, respectively.
Soil Physicochemical CharacteristicsCKT1T2T3
SOC (mg kg−1)28.20 ± 0.94 d74.32 ± 0.48 a50.93 ± 0.40 b44.91 ± 1.01 c
SOM (%)4.86 ± 0.16 d12.81 ± 0.08 a8.78 ± 0.07 b7.74 ± 0.17 c
SN (mg kg−1)8.20 ± 0.64 c22.00 ± 0.72 a13.26 ± 0.53 b11.63 ± 0.54 b
SAN (g kg−1)0.13 ± 0.01 d0.81 ± 0.01 a0.47 ± 0.02 b0.29 ± 0.01 c
SP (mg kg−1)0.78 ± 0.01 d26.24 ± 0.30 a19.69 ± 0.06 b8.32 ± 0.08 c
SAP (mg kg−1)0.26 ± 0.00 a0.11 ± 0.00 c0.14 ± 0.00 b0.06 ± 0.00 d
SK (g kg−1)5.42 ± 0.06 d10.57 ± 0.38 b1.07 ± 0.01 a7.84 ± 0.16 c
SAK (mg kg−1)1.06 ± 0.03 a0.72 ± 0.01 b12.55 ± 0.29 a0.15 ± 0.00 c
WSM (g kg−1)1.74 ± 0.08 b3.02 ± 0.16 a2.79 ± 0.14 a0.92 ± 0.04 c
SNa (g kg−1)2.09 ± 0.14 b4.08 ± 0.14 a3.65 ± 0.23 a2.15 ± 0.11 b
SCa (g kg−1)1.12 ± 0.08 c2.54 ± 0.18 a2.13 ± 0.12 b1.12 ± 0.09 c
SMg (g kg−1)1.74 ± 0.12 d4.51 ± 0.14 b5.03 ± 0.10 a2.29 ± 0.15 c
SMn (g kg−1)0.13 ± 0.01 b1.76 ± 0.07 a1.65 ± 0.07 a0.22 ± 0.01 b
SFe (g kg−1)24.49 ± 0.52 c51.75 ± 2.27 a53.92 ± 1.48 a29.26 ± 0.58 b
SZn (mg kg−1)34.35 ± 1.16 b105.43 ± 1.72 a107.95 ± 2.32 a36.46 ± 2.32 b
SWC (%)20.42 ± 0.21 d65.65 ± 1.17 a58.07 ± 1.29 b30.27 ± 2.31 c
Soil pH5.80 ± 0.01 d6.29 ± 0.01 a6.23 ± 0.01 b6.04 ± 0.01 c
SProtein (%)5.13 ± 0.40 c13.75 ± 0.45 a8.29 ± 0.33 b7.27 ± 0.34 b
Table 3. The soil microbial content of different mangrove communities based on PLFA analysis. Lowercase letters indicate significant differences among the plant community types (p < 0.05). Error bars represent standard errors (SE, n = 3). CK, T1, T2, and T3 indicate the rice field, the B. racemosa pure community, the B. racemosa + Acanthus ilicifolius community, and the B. racemosa + Talipariti tiliaceum + Pongamia pinnata community, respectively.
CKT1T2T3
Bacteria (nmol g−1)29.84 ± 2.82 b92.72 ± 6.86 a37.73 ± 4.95 b38.46 ± 4.15 b
Fungi (nmol g−1)5.37 ± 0.72 b17.28 ± 2.85 a4.99 ± 0.79 b5.49 ± 0.43 b
F:B0.18 ± 0.01 a0.19 ± 0.02 a0.13 ± 0.01 b0.14 ± 0.01 b
Hylophilus thermolyticus (nmol g−1)2.15 ± 0.18 b11.02 ± 1.54 a3.03 ± 0.41 b3.35 ± 0.43 b
Aerobic bacteria (nmol g−1)1.11 ± 0.06 b2.33 ± 0.17 a0.91 ± 0.15 bc0.79 ± 0.09 c
Gram-positive bacteria (nmol g−1)24.31 ± 2.11 b70.99 ± 6.05 a30.48 ± 3.92 b32.17 ± 3.61 b
Gram-negative bacteria (nmol g−1)5.53 ± 0.76 b21.72 ± 0.87 a7.25 ± 1.16 b6.29 ± 0.60 b
Disclaimer/Publisher’s Note: The statements, opinions and data contained in all publications are solely those of the individual author(s) and contributor(s) and not of MDPI and/or the editor(s). MDPI and/or the editor(s) disclaim responsibility for any injury to people or property resulting from any ideas, methods, instructions or products referred to in the content.

