Article

Tracking Biosecurity Through the Diversity and Network Structure of International Trade

1
Animal and Plant Health Agency, Manchester M90 5PZ, UK
2
Department for Environment, Food & Rural Affairs, London SW1P 4DF, UK
*
Authors to whom correspondence should be addressed.
Diversity 2025, 17(3), 213; https://doi.org/10.3390/d17030213
Submission received: 31 January 2025 / Revised: 10 March 2025 / Accepted: 10 March 2025 / Published: 14 March 2025

Abstract

:
Effective and evidence-based biosecurity measures are essential to prevent trade disruption, protect industries and contain the chains of biological invasions. There are increasing demands for analysts to use quantitative data to monitor this system, with the goals of early detection and forecasting. However, standard approaches often struggle with the incomplete and complex nature of trade data, which tends to include non-normality, temporal and spatial autocorrelation, and limited observations. In this study, a time series of open access import data spanning three years was used to generate measures of diversity indices and network topology, alongside detailed analyses of import pathways and interception records of harmful organisms, revealing their dynamic patterns across different trade routes. Patterns of annual seasonality were evident across the board. A combination of Inverse Simpson’s diversity and network Linkage density optimised the monitoring power of import data for interceptions of harmful taxa. Traditional correlations to total number of interceptions remained intractable, but machine learning tools demonstrated predictive power to forecast these temporal patterns. Combined, these methods provide a novel approach for biosecurity monitoring in plant and animal trade across international borders. These indicators complement more conventional economic metrics, giving actionable insights into trade complexity and biosecurity status.

1. Introduction

Biosecurity is a cornerstone of global health, as the internationalization of trade has inadvertently associated with the movement of pests and diseases across borders, threatening agriculture, biodiversity, and trade systems [1,2,3]. National biosecurity programmes aim to prevent the introduction of harmful organisms while minimizing disruptions to trade flows [4,5]. These systems are subject to increasing interest in the context of expanding international trade and evolving trade agreements [6].
Before the UK’s departure from the European Union (EU), goods traded between the two operated under a unified customs framework, reducing the need for sanitary and phytosanitary (SPS) checks or rules of origin (RoO) declarations [7]. Following EU Exit significant changes were implemented, including the requirement for customs declarations, pre-notifications for plant trade, and a phased introduction of SPS checks for agri-food imports [7]. In 2023 the Border Target Operating Model (BTOM) was published, to modernize and streamline import processes through advanced technology and risk-based assessments while maintaining robust biosecurity measures [7].
In the UK approximately 18.6 million tonnes of plants and plant products, valued at GBP 14.5 billion, were imported in 2021 [8]. Most of these imports are subject to plant health controls, such as certification requirements and the phased application of SPS measures for goods from the EU [7]. Systems like plant passports monitor the health of regulated plants, while phytosanitary certificates govern international movements, ensuring adherence to pest and disease management standards [9].
The role of trade networks in shaping biosecurity has been demonstrated in multiple studies [10,11,12,13]. Colunga-Garcia et al. [11] highlighted how the intensity and diversity of trade pathways influence invasion pressures using US maritime import data. Similarly, Buddenhagen et al. [10] identified the importance of network position, trade volume, and trading connections in driving biosecurity patterns in New Zealand. Further, Marshall [12] emphasized the value of analysing geographic distribution and network metrics related to commodity movements. These studies underline the utility of network analysis in understanding and mitigating biosecurity threats.
The global trade network for plants and plant products dates back to the 18th and 19th centuries, with thousands of genera now being utilized in commerce [14]. However, this pathway has been a conduit for the introduction of non-native pests [13]. For example, nearly 90% of human-assisted introductions of plant pests in Great Britain are attributed to plant trade [15]. Monitoring of such species becomes increasingly challenging with the growth of international trade, exacerbating the risks of plant disease outbreaks, including threats from Phytophthora spp., Oriental chestnut gall wasp (Dryocosmus kuriphilus Yasumatsu, 1951), and Asian longhorn beetle (Anoplophora glabripennis Motschulsky, 1853) [9,16]. A notable example is the discovery in 2012 of a small, established population of A. glabripennis Motschulsky, 1853 in Paddock Wood, Kent [17]. This outbreak was linked to a commercial site that had previously imported stone and slate with wooden packaging material from China, marking the first recorded instance of this pest in the UK [17]. The eradication programme for A. glabripennis Motschulsky, 1853 was expensive and extensive, with survey work costing an estimated GBP 150,000, while tree felling, burning, administration, and public outreach added an additional GBP 500,000. Altogether, the total cost of the programme was approximately GBP 1.9 million [17,18].
Biological invasions of organisms compromise resilience, degrade ecosystems and negatively impact the economy [19]. Between 1960 and 2020, damages from alien organisms in Europe were estimated at USD 140.2 billion (EUR 116.61 billion). The greatest damages were caused to the United Kingdom, Spain, France and Germany [20].
Taxonomic interception data serve as a critical resource for biosecurity, providing evidence of pest and disease presence at points of entry [21]. Such data offer insights into the organisms associated with specific import pathways and inform risk analyses at the level of species, taxon, or pathway [21,22,23]. These insights enable targeted biosecurity measures such as pre-border inspections, phytosanitary treatments and prohibitions, to mitigate risks effectively.
Trade flow patterns have also been modelled as networks to examine their resilience and vulnerabilities [13,24]. For instance, the COVID-19 pandemic highlighted how network structures influence the spread of pathogens and guide policy decisions [25]. Similarly, the dynamics of pests and diseases in trade networks may exhibit analogous patterns, where network metrics can inform biosecurity strategies [26]. Despite their potential, few studies have analysed the network structure of regional and international trade in relation to biosecurity risks.
This is the first study to utilize open access datasets of UK plant imports and harmful organism interception records to examine the dynamics of diversity and trade. Our objective is to address the following research questions:
(i)
Does the network structure and diversity of import pathways vary over time?
(ii)
Do import interceptions vary over time?
(iii)
Are there associations between (i) and (ii)?
(iv)
Can machine learning tools be used to predict interception levels?

2. Materials and Methods

2.1. Imports Data

Bulk import datasets for each year were downloaded from the HM Revenue & Customs (HMRC) online archive (https://www.uktradeinfo.com/trade-data/latest-bulk-datasets/bulk-datasets-archive/#imports-(bds-imp-yymm) accessed on 1 December 2024) [27], appended with commodity code, country, and transport mode lookups, and subset to the commodity codes listed in the Phytosanitary Conditions Regulation (EU 2019/2072) [28]. The processed datasets contained 101,078, 95,282, and 74,501 consignment rows respectively for the years 2022, 2023, and 2024.

2.2. Interceptions Data

Interception datasets for 2022–2024 were downloaded from the UK Plant Health Information Portal (https://planthealthportal.defra.gov.uk/trade/imports/alert-list/ accessed on 1 December 2024) [29] and appended with exporting country, week, year, type of commodity, botanical taxa, harmful organism taxa, action taken, reason for interception, and total number of interceptions. Interceptions occur as part of the biosecurity inspection process, where imported plant consignments are examined for compliance with sanitary and phytosanitary regulations. Samples are drawn from consignments to detect the presence of harmful organisms (e.g., arthropods, bacteria, fungi, nematodes, and viruses), which are subsequently diagnosed in laboratories. Inspections also identify documentary infringements, such as missing or incomplete phytosanitary certificates that fail to meet import requirements. Harmful organisms are intercepted and classified during inspections, typically identified at species level whenever possible, or at genus or higher level if species identification is not feasible. For this study, we filtered the datasets to include only those interceptions where presence of harmful organisms was the reason. The final dataset comprised 1466 records between January 2022 and September 2024.
We focussed on the interception variables that represent the classic measures of abundance and richness, namely the number of interceptions (i.e., the total count of harmful organisms intercepted at the border) and the number of intercepted taxa (i.e., the total number of distinct of harmful organisms intercepted at the border).

2.3. R Packages

The commodity diversity of plant imports per month was calculated using the vegan package [30]. Network topology metrics were computed using the bipartite package [31], and graphical outputs were generated with ggplot2 [32]. Machine learning models were run in randomForest [33] and xgboost [34], and variable importance was assessed with vip [35]. All analyses were conducted using R version 4.2.2 [36], and the associated scripts are provided as Supplementary Materials.

2.4. Network Topology

Bipartite networks were constructed from interaction matrices, with ports of entry representing the higher-level nodes and countries of dispatch representing the lower-level nodes. A range of monthly network-level indices were calculated to examine network structure and dynamics. Redundancy among indices was assessed by plotting them against each other to identify correlated metrics. Based on this assessment, the following four indices were selected for analysis: Alatalo interaction evenness, Linkage density, Interaction Strength Asymmetry, and Nestedness.
For each index and month, 500 null models were generated using the ‘r2dtable’ algorithm [37]. This method randomly modifies cell values while preserving the row and column sum constant. The z-scores were then checked against the observed network structures with random network models.

2.4.1. Alatalo Interaction Evenness

This index measures the equality of linkages within a network and is calculated using a modified Hill’s ratio [38] as proposed by Alatalo [39]. A lower evenness in plant trade suggests dominance by a few suppliers, potentially creating a ’small-world‘ topology that facilitates the efficient transmission of pests and pathogens.
A l a t a l o   I n t e r a c t i o n   E v e n n e s s = N 2 1 N 1 1
where N1 = eH’, the antilogarithmic Shannon entropy (where H’ = -∑pi ln(pi)), and N2 = Reciprocal of Simpson’s index (1/∑pi2)

2.4.2. Linkage Density

Linkage density quantifies network complexity as the average number of links per node, weighted by interaction diversity [40]. Higher values indicate greater robustness and stability, though they may also suggest increased biosecurity risks from the widespread dissemination of pests and pathogens [41].
L i n k a g e   D e n s i t y = L I + J
where L is the number of realized links in the network, and J is the number of higher-level nodes

2.4.3. Interaction Strength Asymmetry

This measure reflects the distribution of interactions within the network, distinguishing between more connected (’generalized’) nodes and less connected (’specialized’) nodes. In other words, it indicates whether one node disproportionately affects the fitness of others [42]. A high value suggests that certain nodes rely heavily on specific interactions, indicating an uneven distribution of dependency where some nodes play a dominant role. In contrast, a low value reflects a more balanced dependency across the network, where interactions are spread more evenly among nodes.
I n t e r a c t i o n   S t r e n g t h   A s y m m e t r y = b i j b j i b i j + b j i
where bij = aij/Ai and bji = aij/Aj; aij is the number of interactions of type i with its partner type j; and Ai and Aj are the total number of interactions recorded for i and j, respectively.

2.4.4. Nestedness

Nestedness measures whether nodes with many interactions are connected to nodes with fewer interactions. The index is computed using the BINMATNEST algorithm [43], which generates a matrix “temperature” based on interaction patterns. Lower temperatures indicate more nested structures, often associated with mutualistic networks. Nestedness is a key property of stable networks and has been linked to resilience under various perturbations [44,45].

2.5. Diversity

A range of measures of type diversity and evenness were reviewed in the literature, with one non-parametric (based on the Inverse Simpson Index) and one parametric (Fisher’s α) method selected for use in this study.

2.5.1. Inverse Simpson Index of Diversity (‘1—D’)

The Simpson index [46] measures the degree of concentration when individuals are categorized into types. It is calculated as the weighted arithmetic mean of the proportional abundances of these types (e.g., commodity types in the current context) and represents the probability that two individuals randomly selected from the dataset belong to the same type. The index inherently emphasizes the most abundant types, making it relatively less sensitive to richness compared to other diversity indices. In this study, the Simpson Index was transformed into its inverse to resolve the counterintuitive nature of the original metric, where higher values signify lower diversity.
I n v e r s e   S i m p s o n   I n d e x = 1   ÷ ( 1   n i n i 1 N   N 1 )
where ni is the number of individuals that belong to type I, and N is the total number of individuals.

2.5.2. Fisher’s Alpha Parameter (α)

Fisher’s alpha estimates the diversity parameter (α) of a logarithmic series, making it particularly suitable for datasets with a long tail of rare types [47]. The parameter (α) can be directly estimated through the maximum likelihood relationship:
S = α ln 1 + n α  
where S is the number of types, n is the number of individuals, and α is Fisher’s alpha parameter.

2.6. Machine Learning Models

Two machine learning algorithms, Random Forest [48] and eXtreme Gradient Boosting (XGBoost) [49], were deployed to model the relationship between features and target variables in the dataset. Random Forest, an ensemble method, constructs multiple decision trees and averages their outputs to improve predictive accuracy. It is robust to overfitting and does not require feature scaling. XGBoost, a gradient boosting algorithm, builds decision trees sequentially, with each tree correcting errors made by its predecessors. XGBoost is recognized for its scalability, ability to handle complex relationships, robustness to missing data, and superior performance on high-dimensional datasets. These attributes made it particularly suitable for this study’s predictive tasks.

2.6.1. Dataset and Preprocessing

The dataset consisted of temporal observations with predictors (features) and response variables (targets) derived from interception data. Features included the total number of import pathways, commodity type richness, Inverse Simpson Diversity, Fisher’s alpha, Alatalo interaction evenness, Linkage density, Interaction Strength Asymmetry, Nestedness, proportion of imports by road, year and month. The response variables were the total number of interceptions and the total number of intercepted taxa. Log transformations were applied to the response variables and scaling to the numeric explanatory variables to address the skewed distributions and stabilize variance, enabling the models to better capture the relationships between features and targets by reducing the impact of extreme values.

2.6.2. Data Splitting and Modelling

The dataset was divided into training and testing subsets to evaluate model performance under different scenarios. A random split was generated, where 80% of the data were randomly assigned to the training set and 20% were reserved for testing. This approach was used to assess the models’ generalization on unseen data.
For the Random Forest model, the number of decision trees was set to 100, and the default splitting rules were used for automatic optimization. For the XGBoost model, the number of boosting rounds was also set to 100, and the objective function was specified as “reg:squarederror” for the regression tasks.

2.6.3. Evaluation Metrics

Model performance was assessed using two metrics. The first metric, mean absolute error (MAE), measures the average absolute difference between predicted and actual values, reflecting the accuracy of the model.
M e a n   A b s o l u t e   E r r o r = 1 n i = 1 n |   ŷ i y i   |
where ŷi are the actual values and yi are the predicted values.
The second metric, the coefficient of determination (R2), indicates the proportion of variance in the target variable explained by the model.
C o e f f i c i e n t   o f   D e t e r m i n a t i o n = 1 i = 1 n y i ŷ i 2 i = 1 n y i 2
where yi are the actual values, ŷi are the predicted values, and ỹi is the mean of the actual values.
Evaluations were conducted separately for each model and split configuration to determine their ability to generalize and forecast effectively.

3. Results

3.1. Import Pathways

The volume of declared plant imports exhibited a consistent seasonal pattern throughout the observed period (Figure 1). The year 2022 recorded slightly higher overall import volumes compared to 2023 and the partial data available for 2024 (up to September). Across all three years, import volumes rose steadily from January to a peak in March or April, followed by a gradual decline to the lowest levels in August or September. This was then followed by an increase toward a secondary, smaller peak in November.
The ports of Dover and the Eurotunnel consistently handled the largest volumes of declared plant imports throughout the period. Other ports, including Felixstowe, Southampton and London Gateway also contributed significantly.

3.2. Interception Patterns

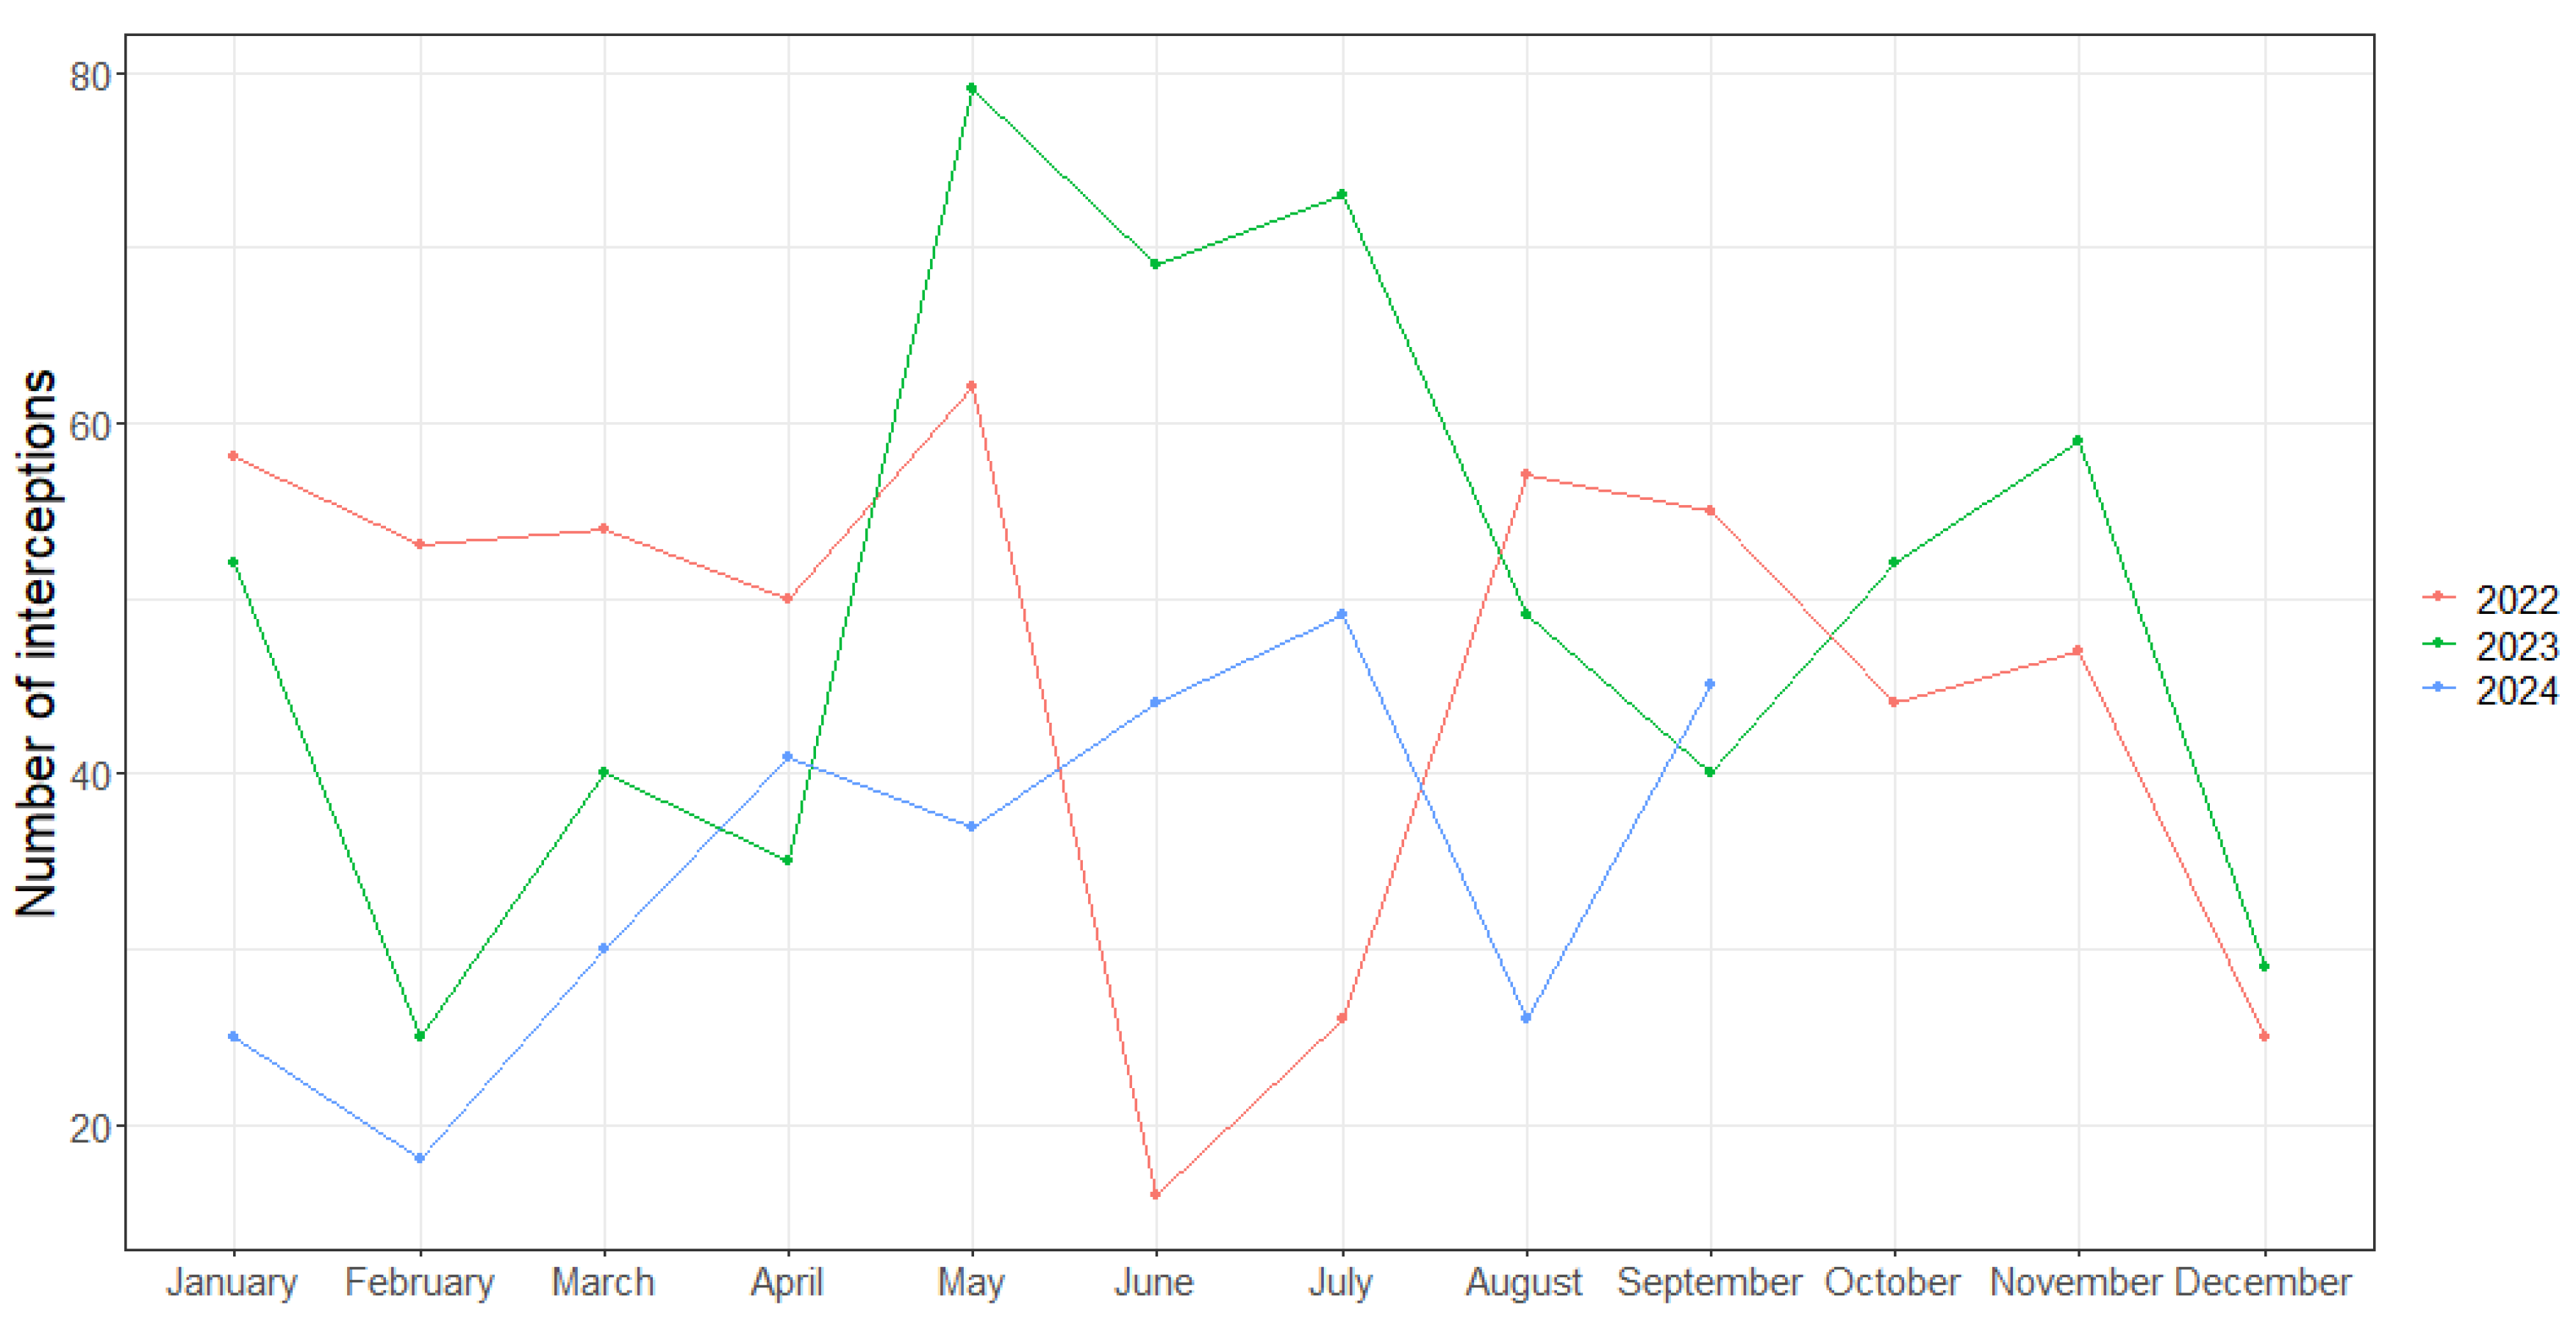
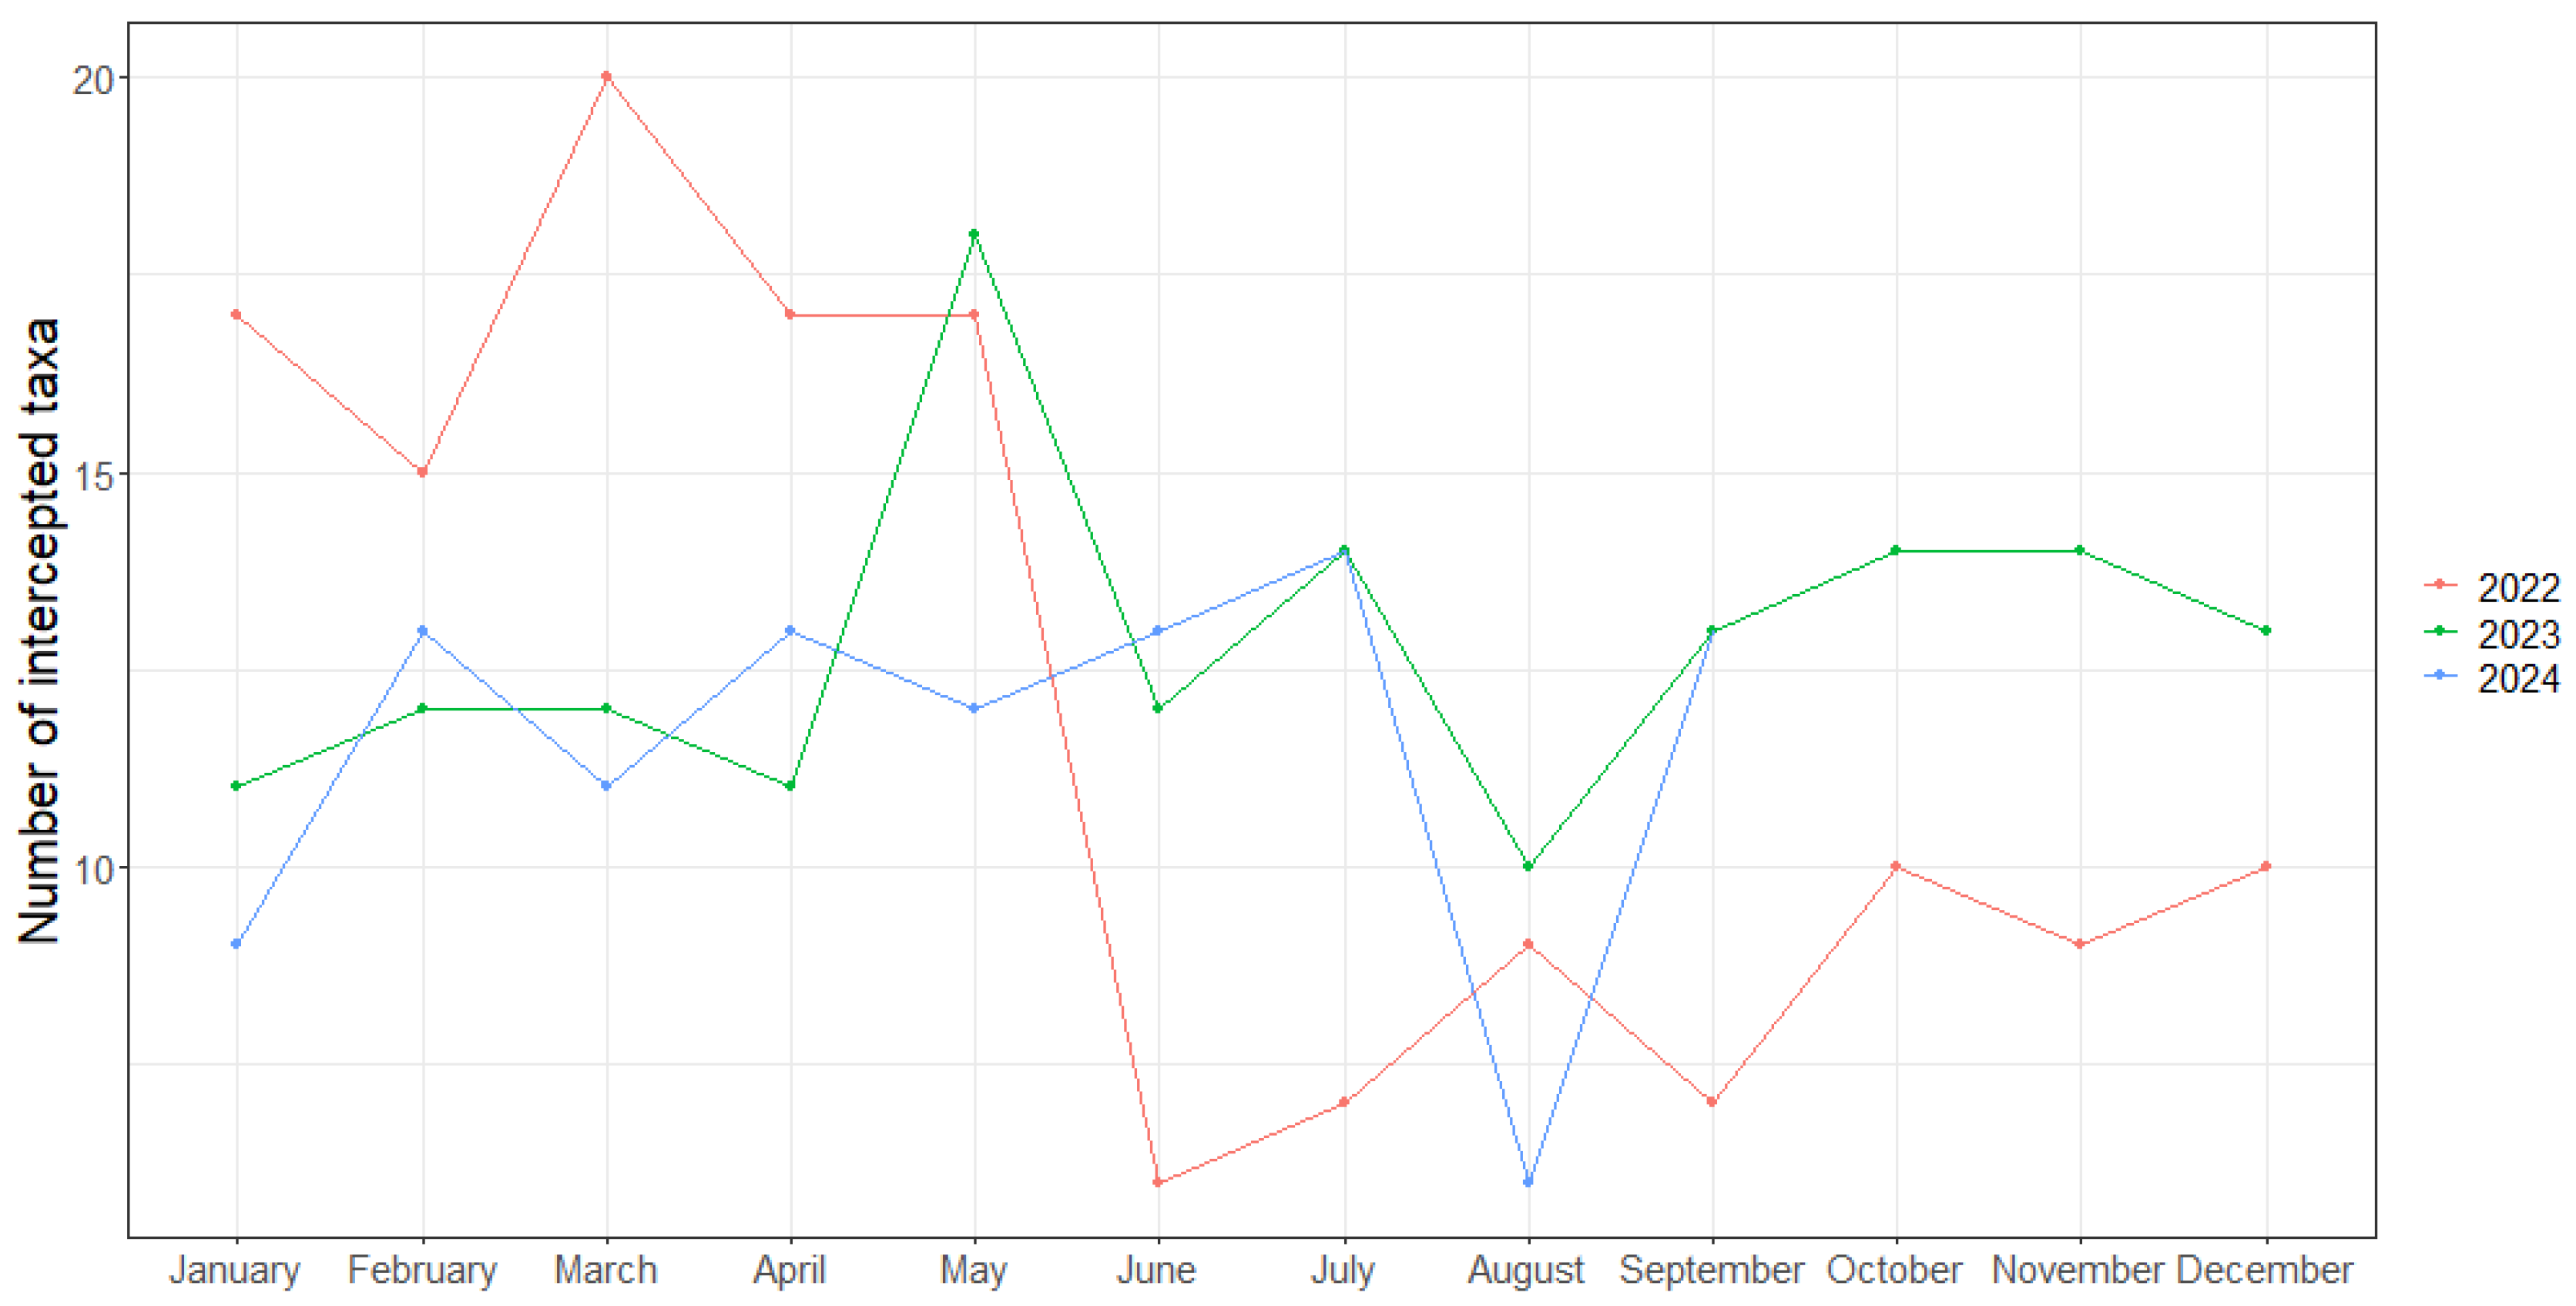
Interceptions followed a broadly similar yet not entirely comparable trajectory over the years of study (Figure 2 and Figure 3). The total number of interceptions (Figure 2) and the number of intercepted taxa (Figure 3) displayed a general pattern of increasing activity, culminating in peaks during May, followed by a pronounced trough in the summer months of June, July, or August.
Seasonal peaks in interceptions and intercepted taxa consistently occurred during the spring months (March–May) across all years, with mid-year troughs observed during the summer. However, the variability observed in 2022 contrasted with the steadier patterns of 2023 and 2024, reflecting potential year-to-year differences in interception dynamics. Notably, the numbers of intercepted taxa for 2023 and 2024 tracked closely with each other, while those in 2022 fluctuated more, exhibiting higher peaks and lower troughs.

3.3. Network Structure, Diversity Indices and Transport Mode

For conciseness, detailed plots illustrating network structure metrics are provided in Supplementary Materials Figure S1.
Across all months, the Alatalo interaction evenness of 2022 was generally lower than that of 2023 and 2024, indicating a less balanced distribution of interactions within the trade network during that year (Supplementary Information Figure S1a). Conversely, the Linkage density of 2022 was consistently higher compared to 2023 and 2024, reflecting a greater network complexity and a higher average number of connections per node (Supplementary Information Figure S1b). These differences suggest notable variations in network topology between 2022 and the subsequent years, potentially linked to shifts in trade pathways or import dynamics. Seasonal patterns in both metrics were also evident, with peaks and troughs aligning with broader trends in trade and interception activity.
Interaction Strength Asymmetry (Supplementary Information Figure S1c) varied significantly from month to month across the study period, with alternating peaks and troughs. The observed fluctuations highlighted dynamic shifts that were structured over time, with some periods showing a stronger reliance on specific trade routes and others indicating a more evenly distributed interaction network.
Nestedness exhibited distinct seasonal variations from 2022 to 2024, with peaks generally observed in February and September, indicating periods of increased structural organization within the network (Supplementary Information Figure S1d). In contrast, lower Nestedness values were typically recorded in March, June, and December, reflecting reduced interaction coherence during these months. These fluctuations underscore the dynamic nature of interaction patterns within the trade network, with periods of heightened stability interspersed with phases of structural variability.
Inverse Simpson Diversity displayed a clear seasonal trend across the study period. Diversity was consistently highest in January and peaked again in May, reflecting a greater diversity in trade pathways during these months (Supplementary Information Figure S1e). Following the May peak, diversity steadily declined, reaching its lowest levels in August or September (Supplementary Information Figure S1e). A modest recovery in diversity was observed in October, with slight increases continuing into December (Supplementary Information Figure S1e). These trends suggest dynamic shifts in trade diversity, with periods of higher diversity at the start and middle of the year, and reduced diversity during late summer and early autumn.
Fisher’s alpha exhibited greater stochasticity, with diversity levels fluctuating inconsistently across months and years. This variability highlights irregular patterns in trade diversity between 2022 and 2024 (Supplementary Information Figure S1f).
The proportion of regulated plant imports transported by road exhibited a clear declining trend from January to July across all years (Supplementary Information Figure S1g). This decline was most pronounced in the early months, with the highest proportions recorded in January (Supplementary Information Figure S1g). The proportion stabilized at lower levels, with only minor month-to-month fluctuations observed through to December (Supplementary Information Figure S1g).

3.4. Relationships Between Import Network, Diversity and Interceptions

Regression analysis of network and diversity metrics against import variables indicated Linkage density to be the most predictive network measure, while Inverse Simpson emerged as the strongest among the diversity indices (Table 1).
None of the tested variables demonstrated significant relationships with number of interceptions, suggesting that interception counts alone cannot be effectively explained by these network or diversity indices.
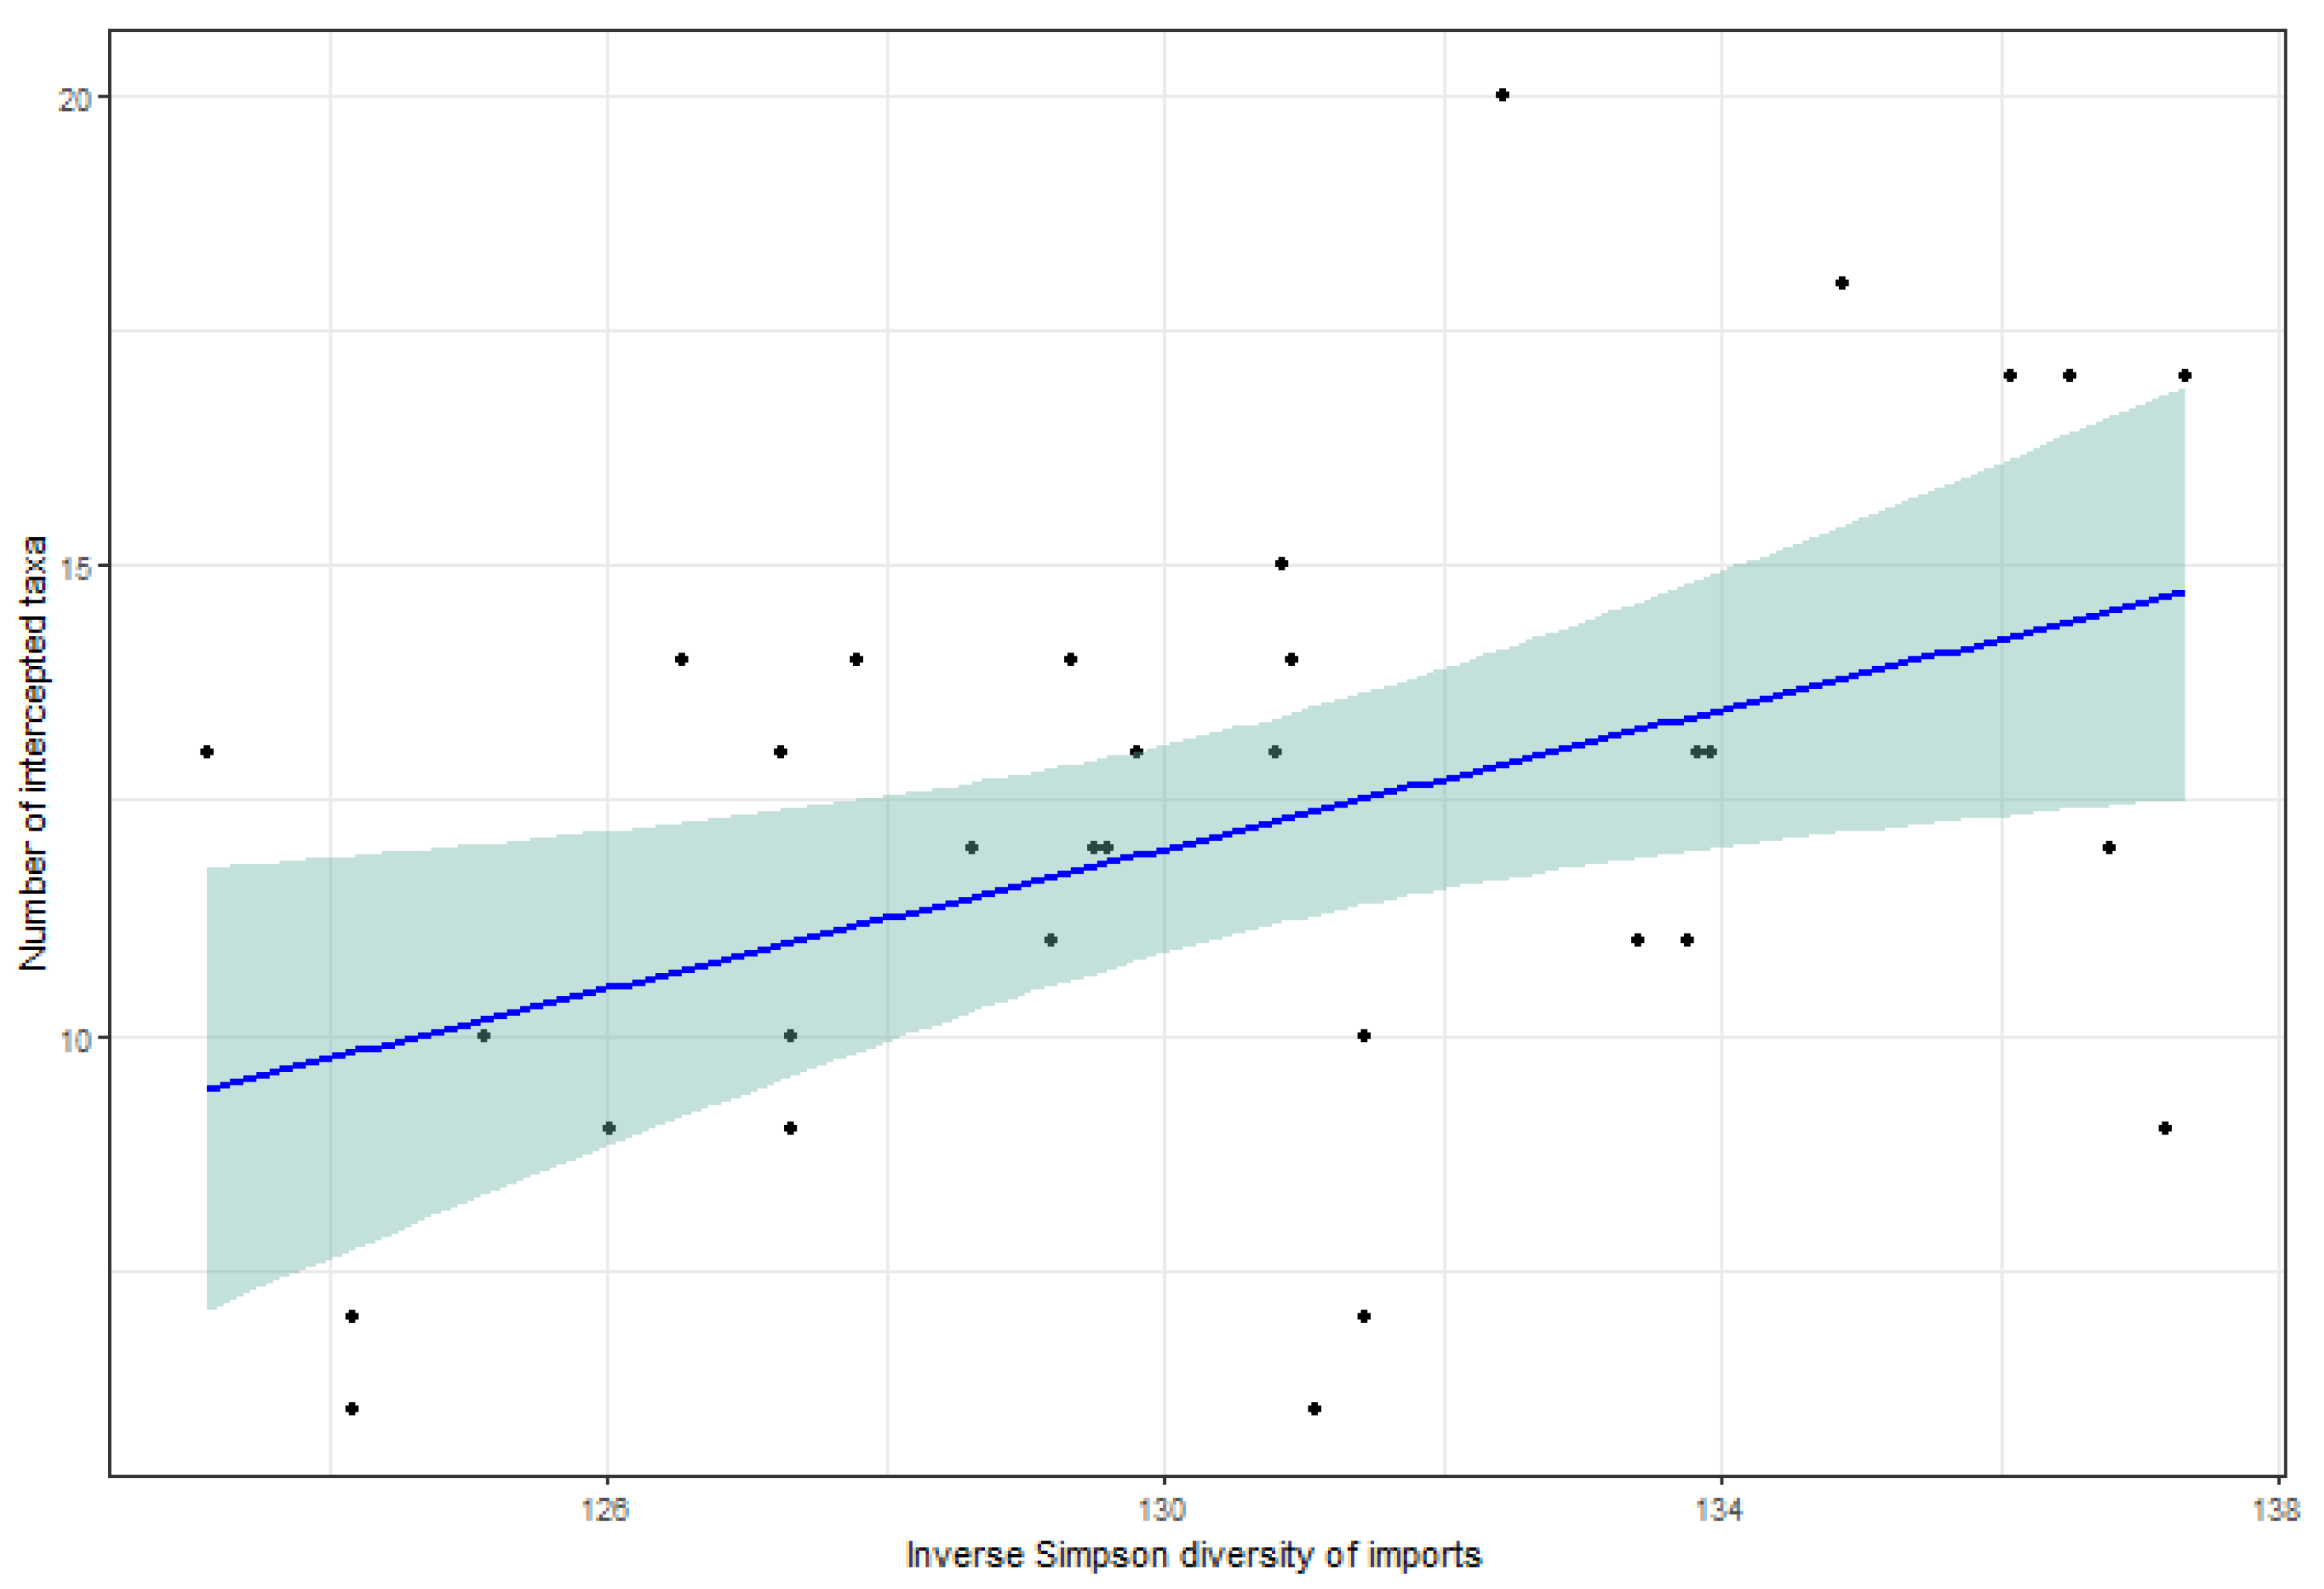
In contrast, the number of intercepted taxa showed a positive relationship with two key variables. Linkage density displayed a moderate positive relationship (adjusted R2 = 0.106), while the Inverse Simpson Index had a stronger positive association (adjusted R2 = 0.166) (Table 1).
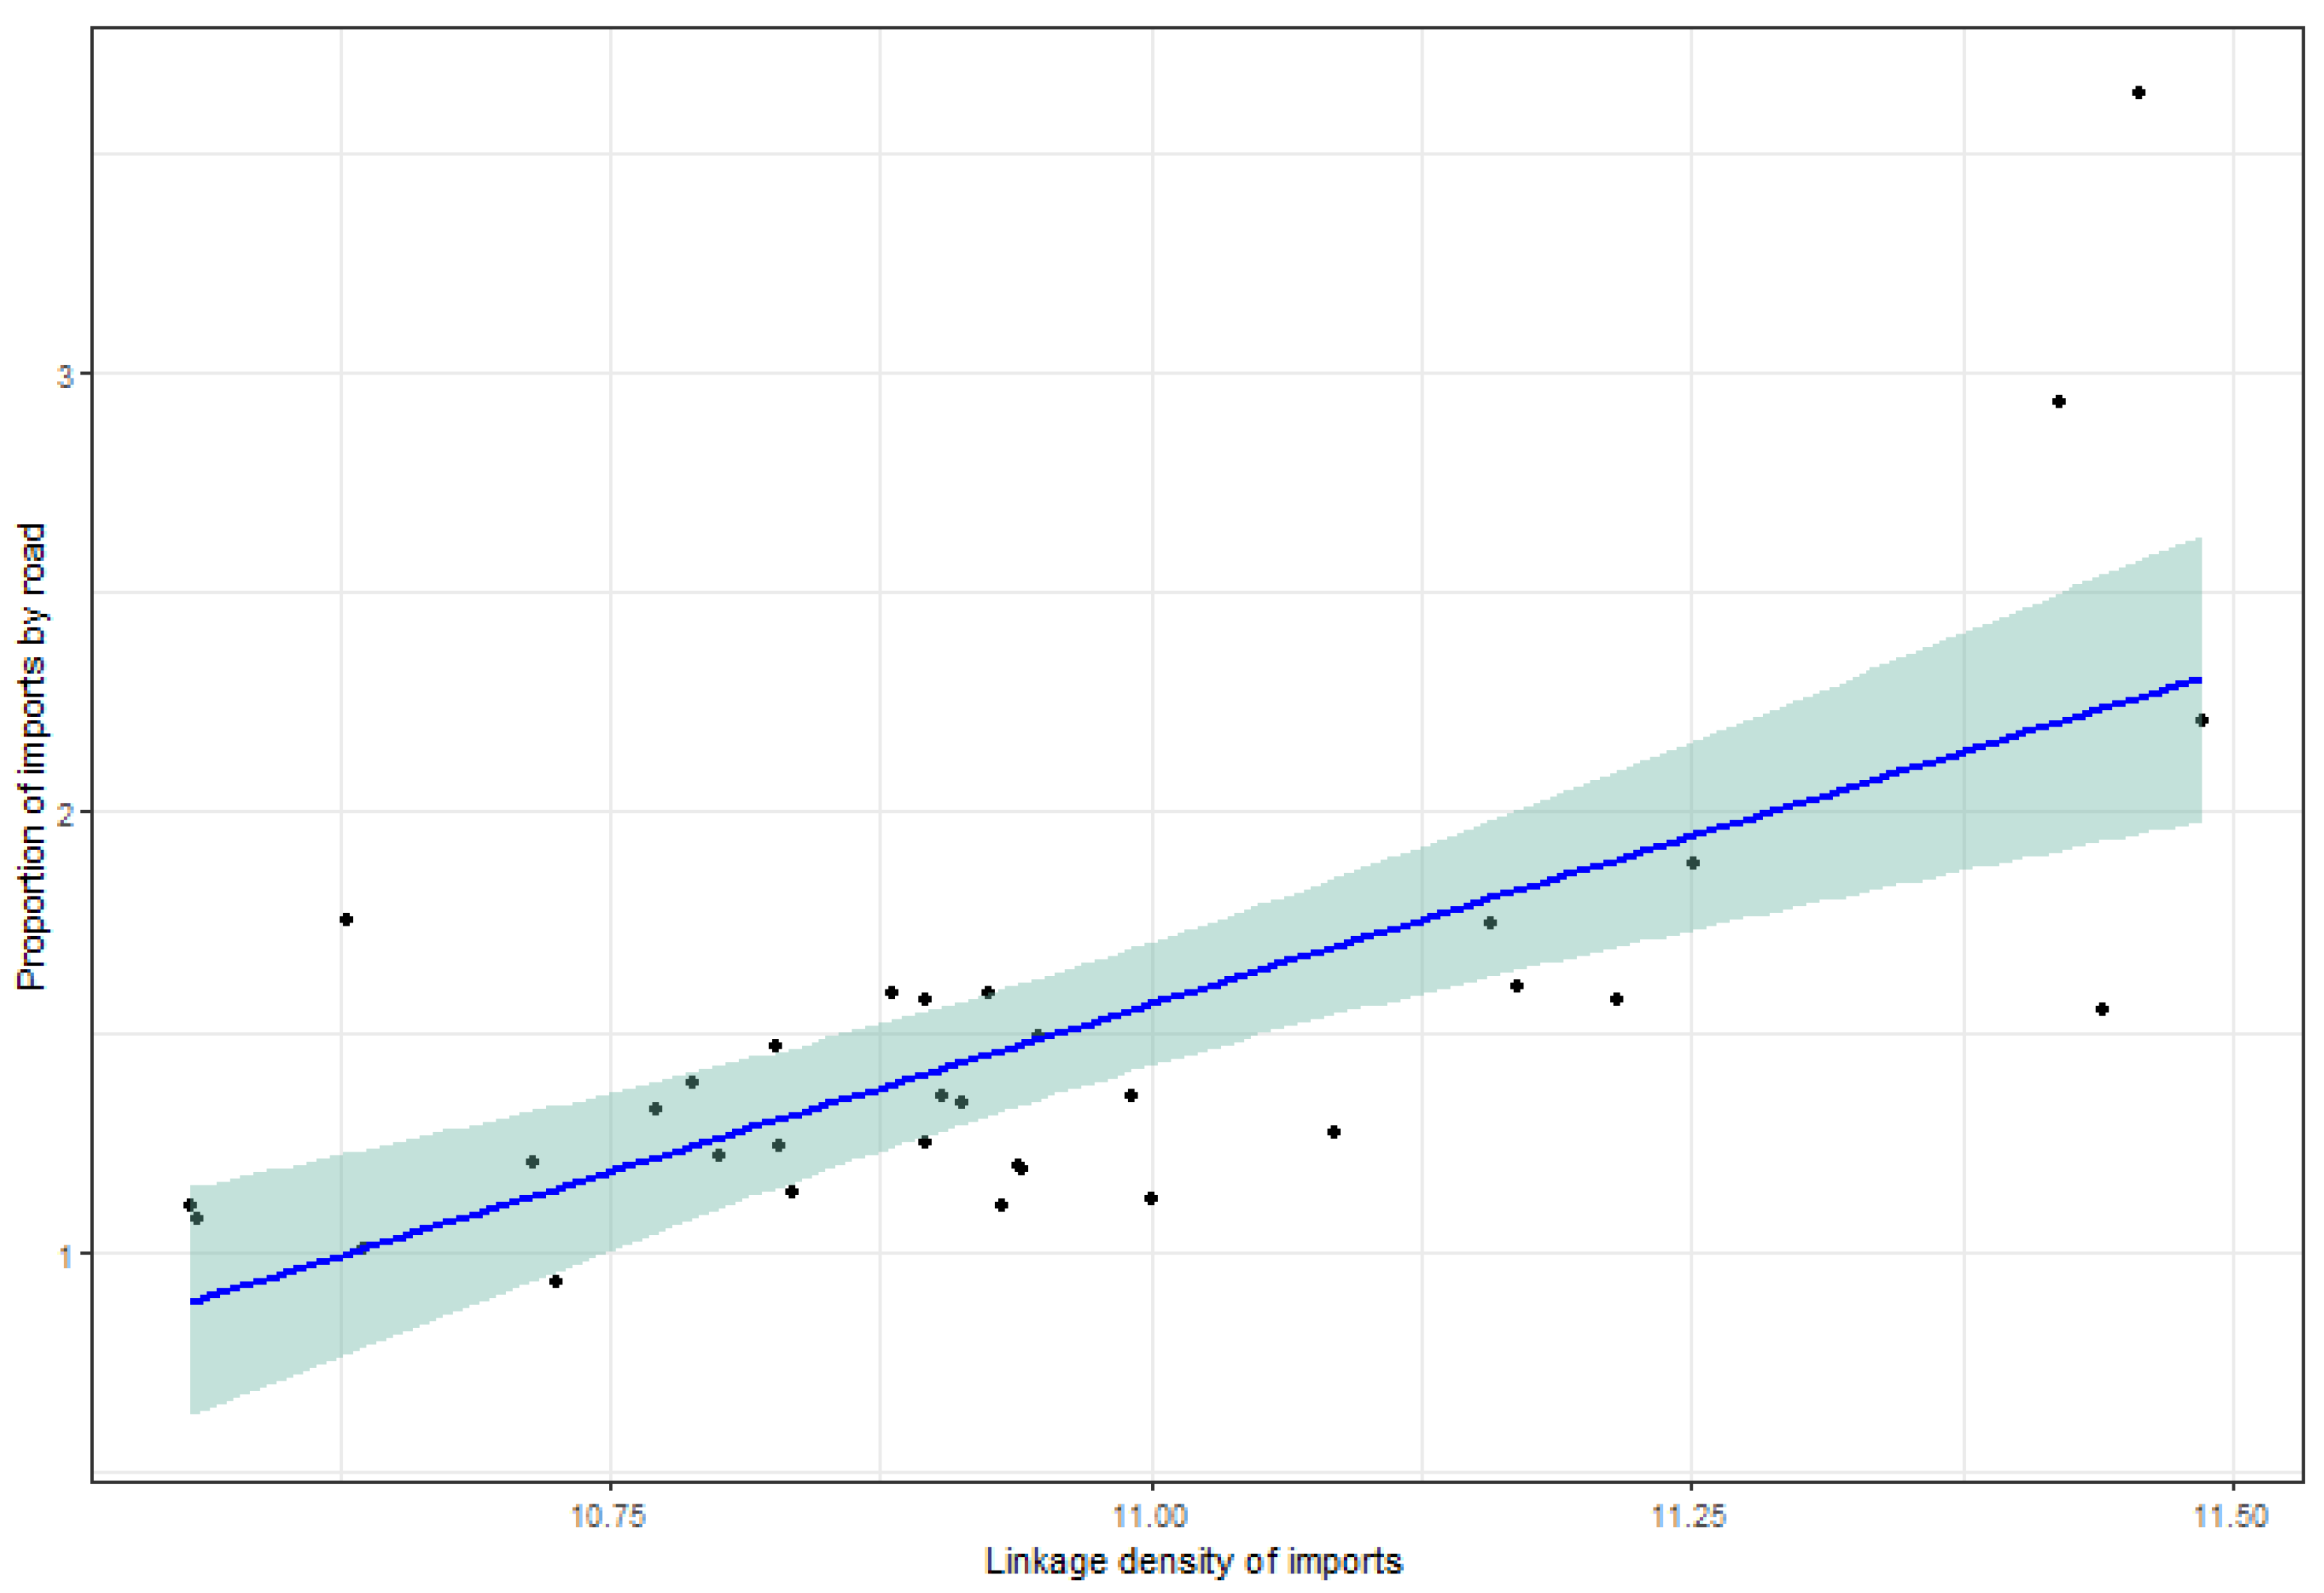
The proportion of imports transported by road revealed the most diverse set of significant relationships. Among the network metrics, Linkage density had the strongest positive relationship (adjusted R2 = 0.487), followed by Nestedness (adjusted R2 = 0.321), Alatalo interaction evenness (adjusted R2 = 0.255), and Interaction Strength Asymmetry (adjusted R2 = 0.110) (Table 1). For the diversity indices, the Inverse Simpson Index demonstrated a positive association (adjusted R2 = 0.170) (Table 1).
Linear plots with standard error bands are drawn for the preferred predictor of number of intercepted taxa (Figure 4) and proportion of imports by road (Figure 5). No preferred predictor variable was found for number of interceptions alone.

3.5. Machine Learning

The machine learning frameworks of Random Forest and eXtreme Gradient Boosting (XGBoost) were used to build predictive models for the two response variables: number of interceptions, and number of intercepted taxa. Supplementary Materials Table shows the mean absolute error (MAE) and coefficient of determination (R2) of each model generated.
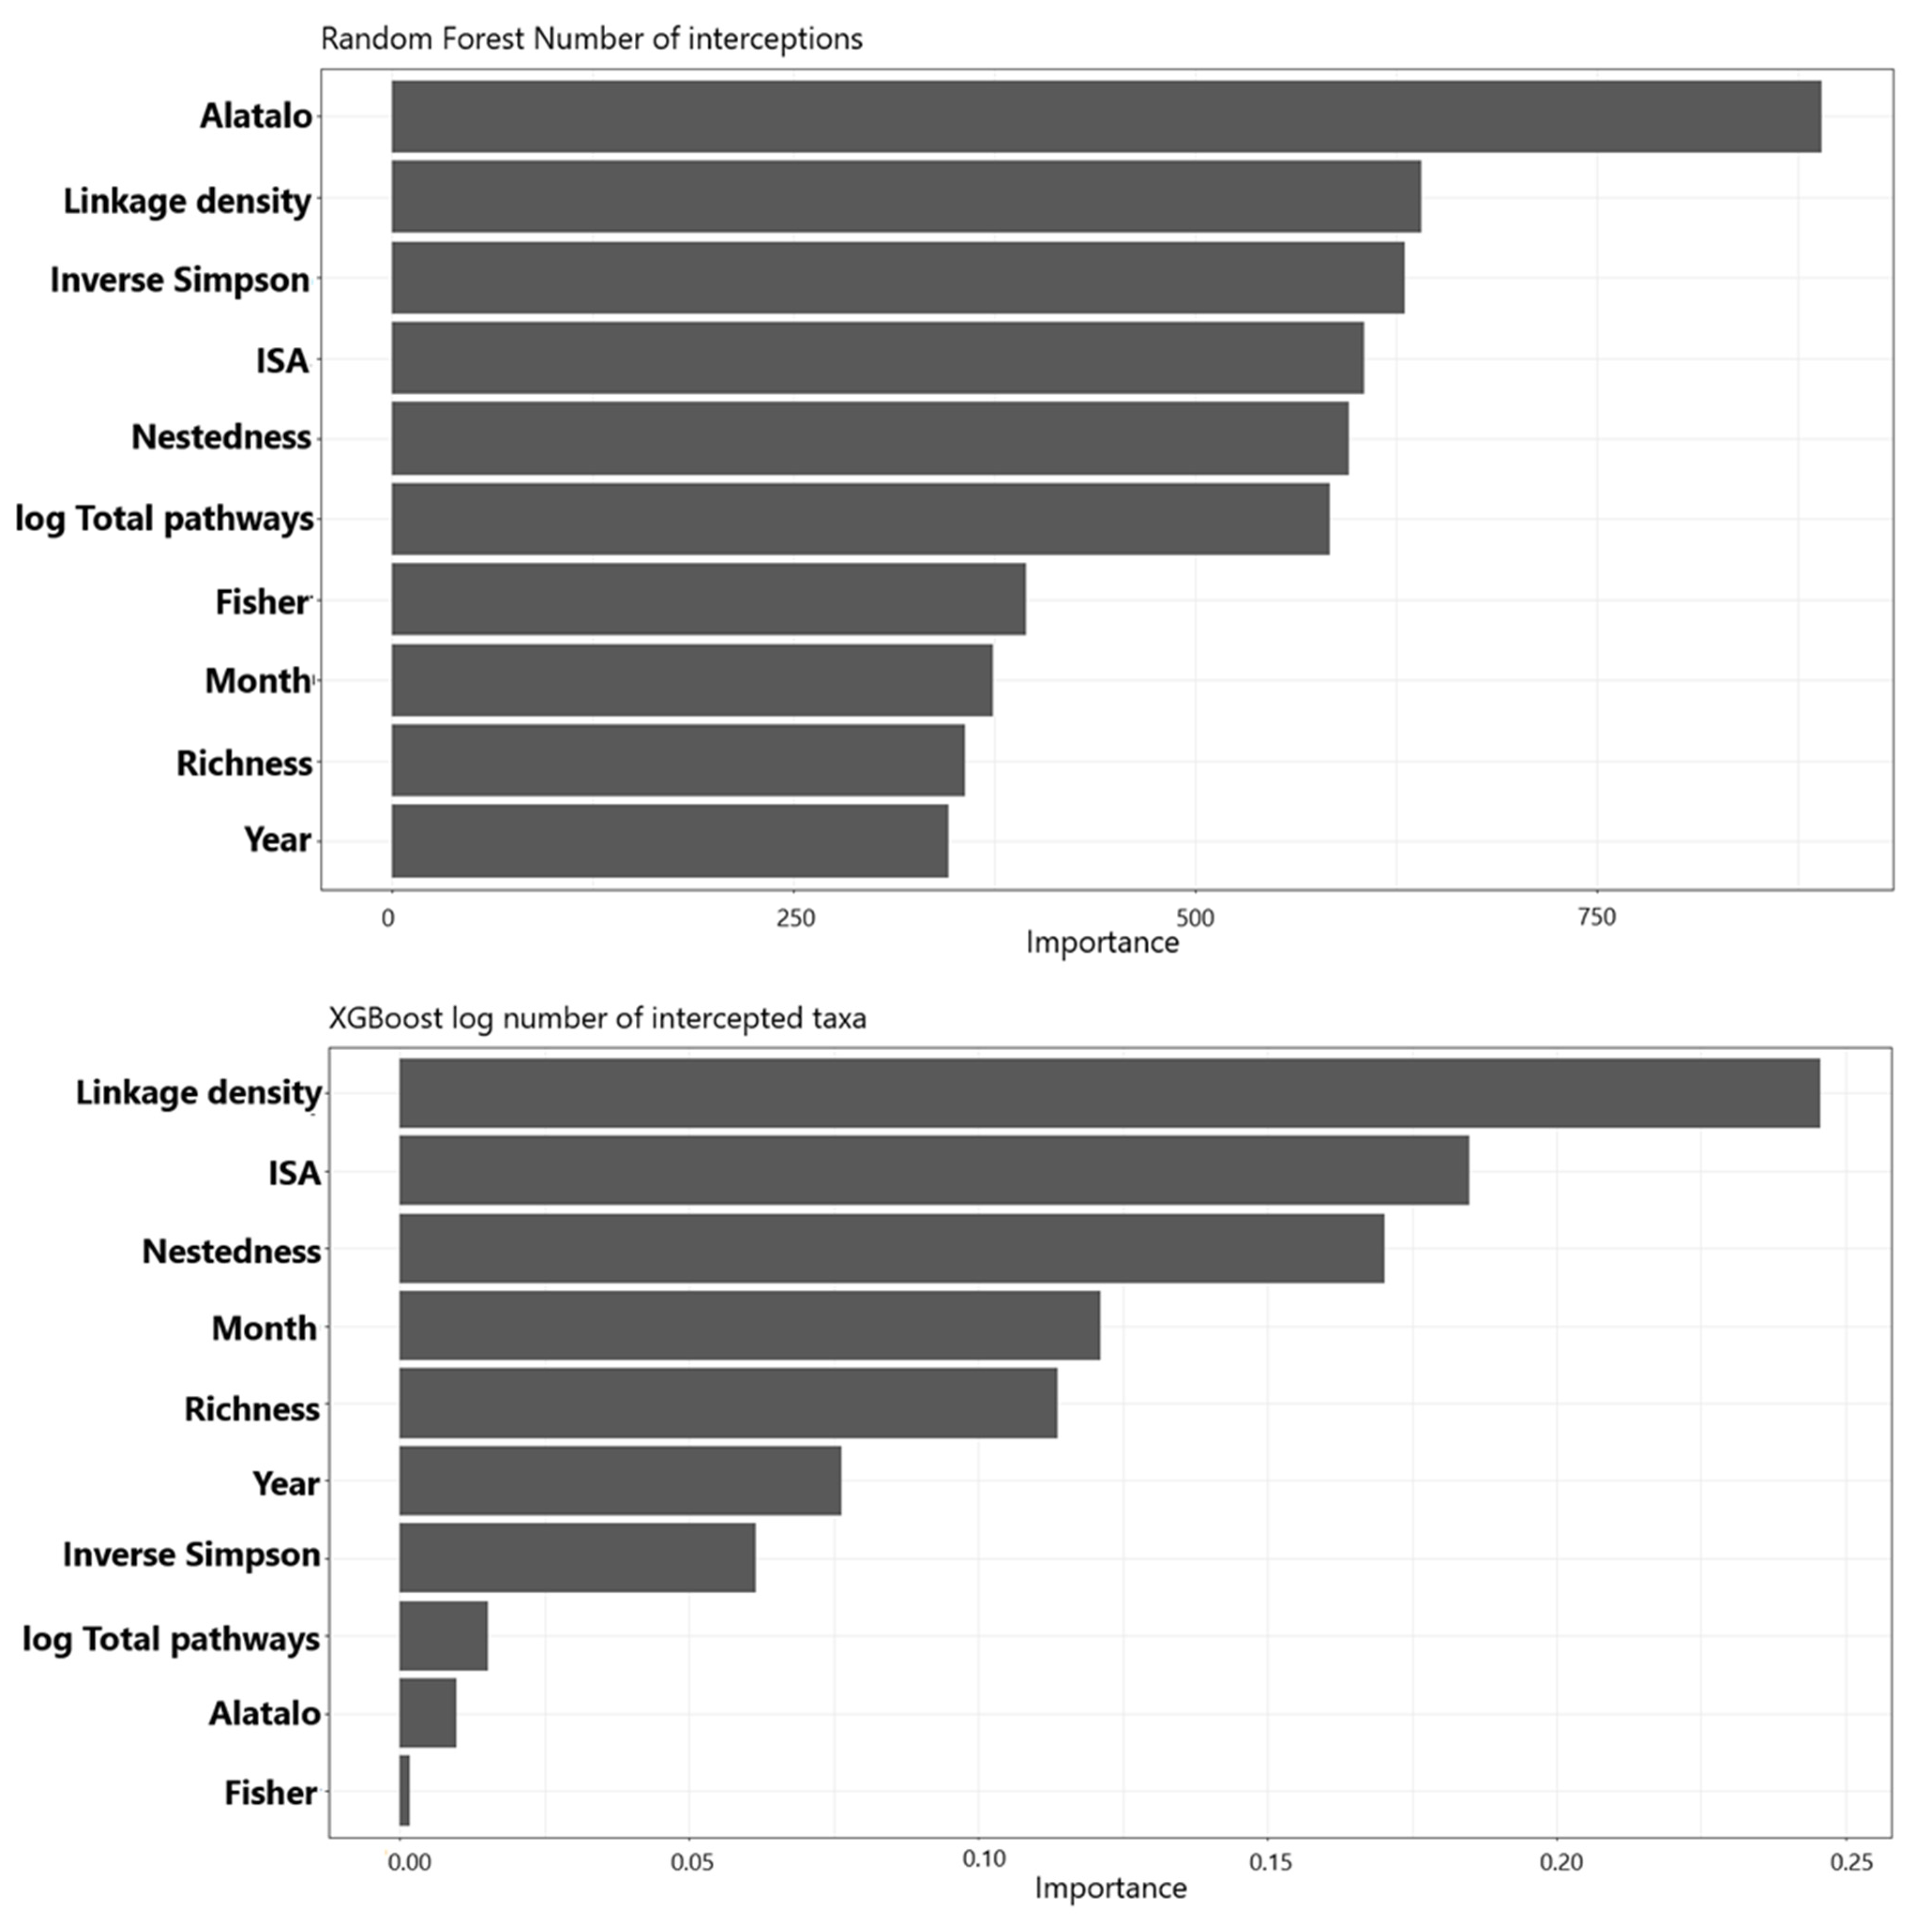
A common way to deal with the challenge of interpretability of machine learning models is to interrogate them to determine which variables were most valuable in prediction. On the criterion of R2, the variable importance scores of the optimal performing models of Supplementary Materials Table are plotted in Figure 6.
For the number of interceptions, Alatalo interaction evenness emerged as the most influential predictor, followed closely by Linkage density and Inverse Simpson Diversity. Interaction Strength Asymmetry (ISA) and Nestedness were also notable contributors to model performance (Figure 6). The remaining variables, such as the (log-transformed) total pathways, Fisher’s alpha and month had relatively lower contributions, indicating a secondary role in explaining variations in interception numbers (Figure 6).
The log number of intercepted taxa was most strongly influenced by Linkage density, with Interaction Strength Asymmetry and Nestedness also showing substantial importance (Figure 6). Temporal factors such as month and year, along with diversity metrics like richness and Inverse Simpson Diversity, were moderately influential. Variables such as Alatalo interaction evenness and Fisher’s alpha had minimal impact in this model, indicating their limited predictive power for the number of intercepted taxa (Figure 6). The network measures of Linkage density and Interaction Strength Asymmetry are high performers in both cases.
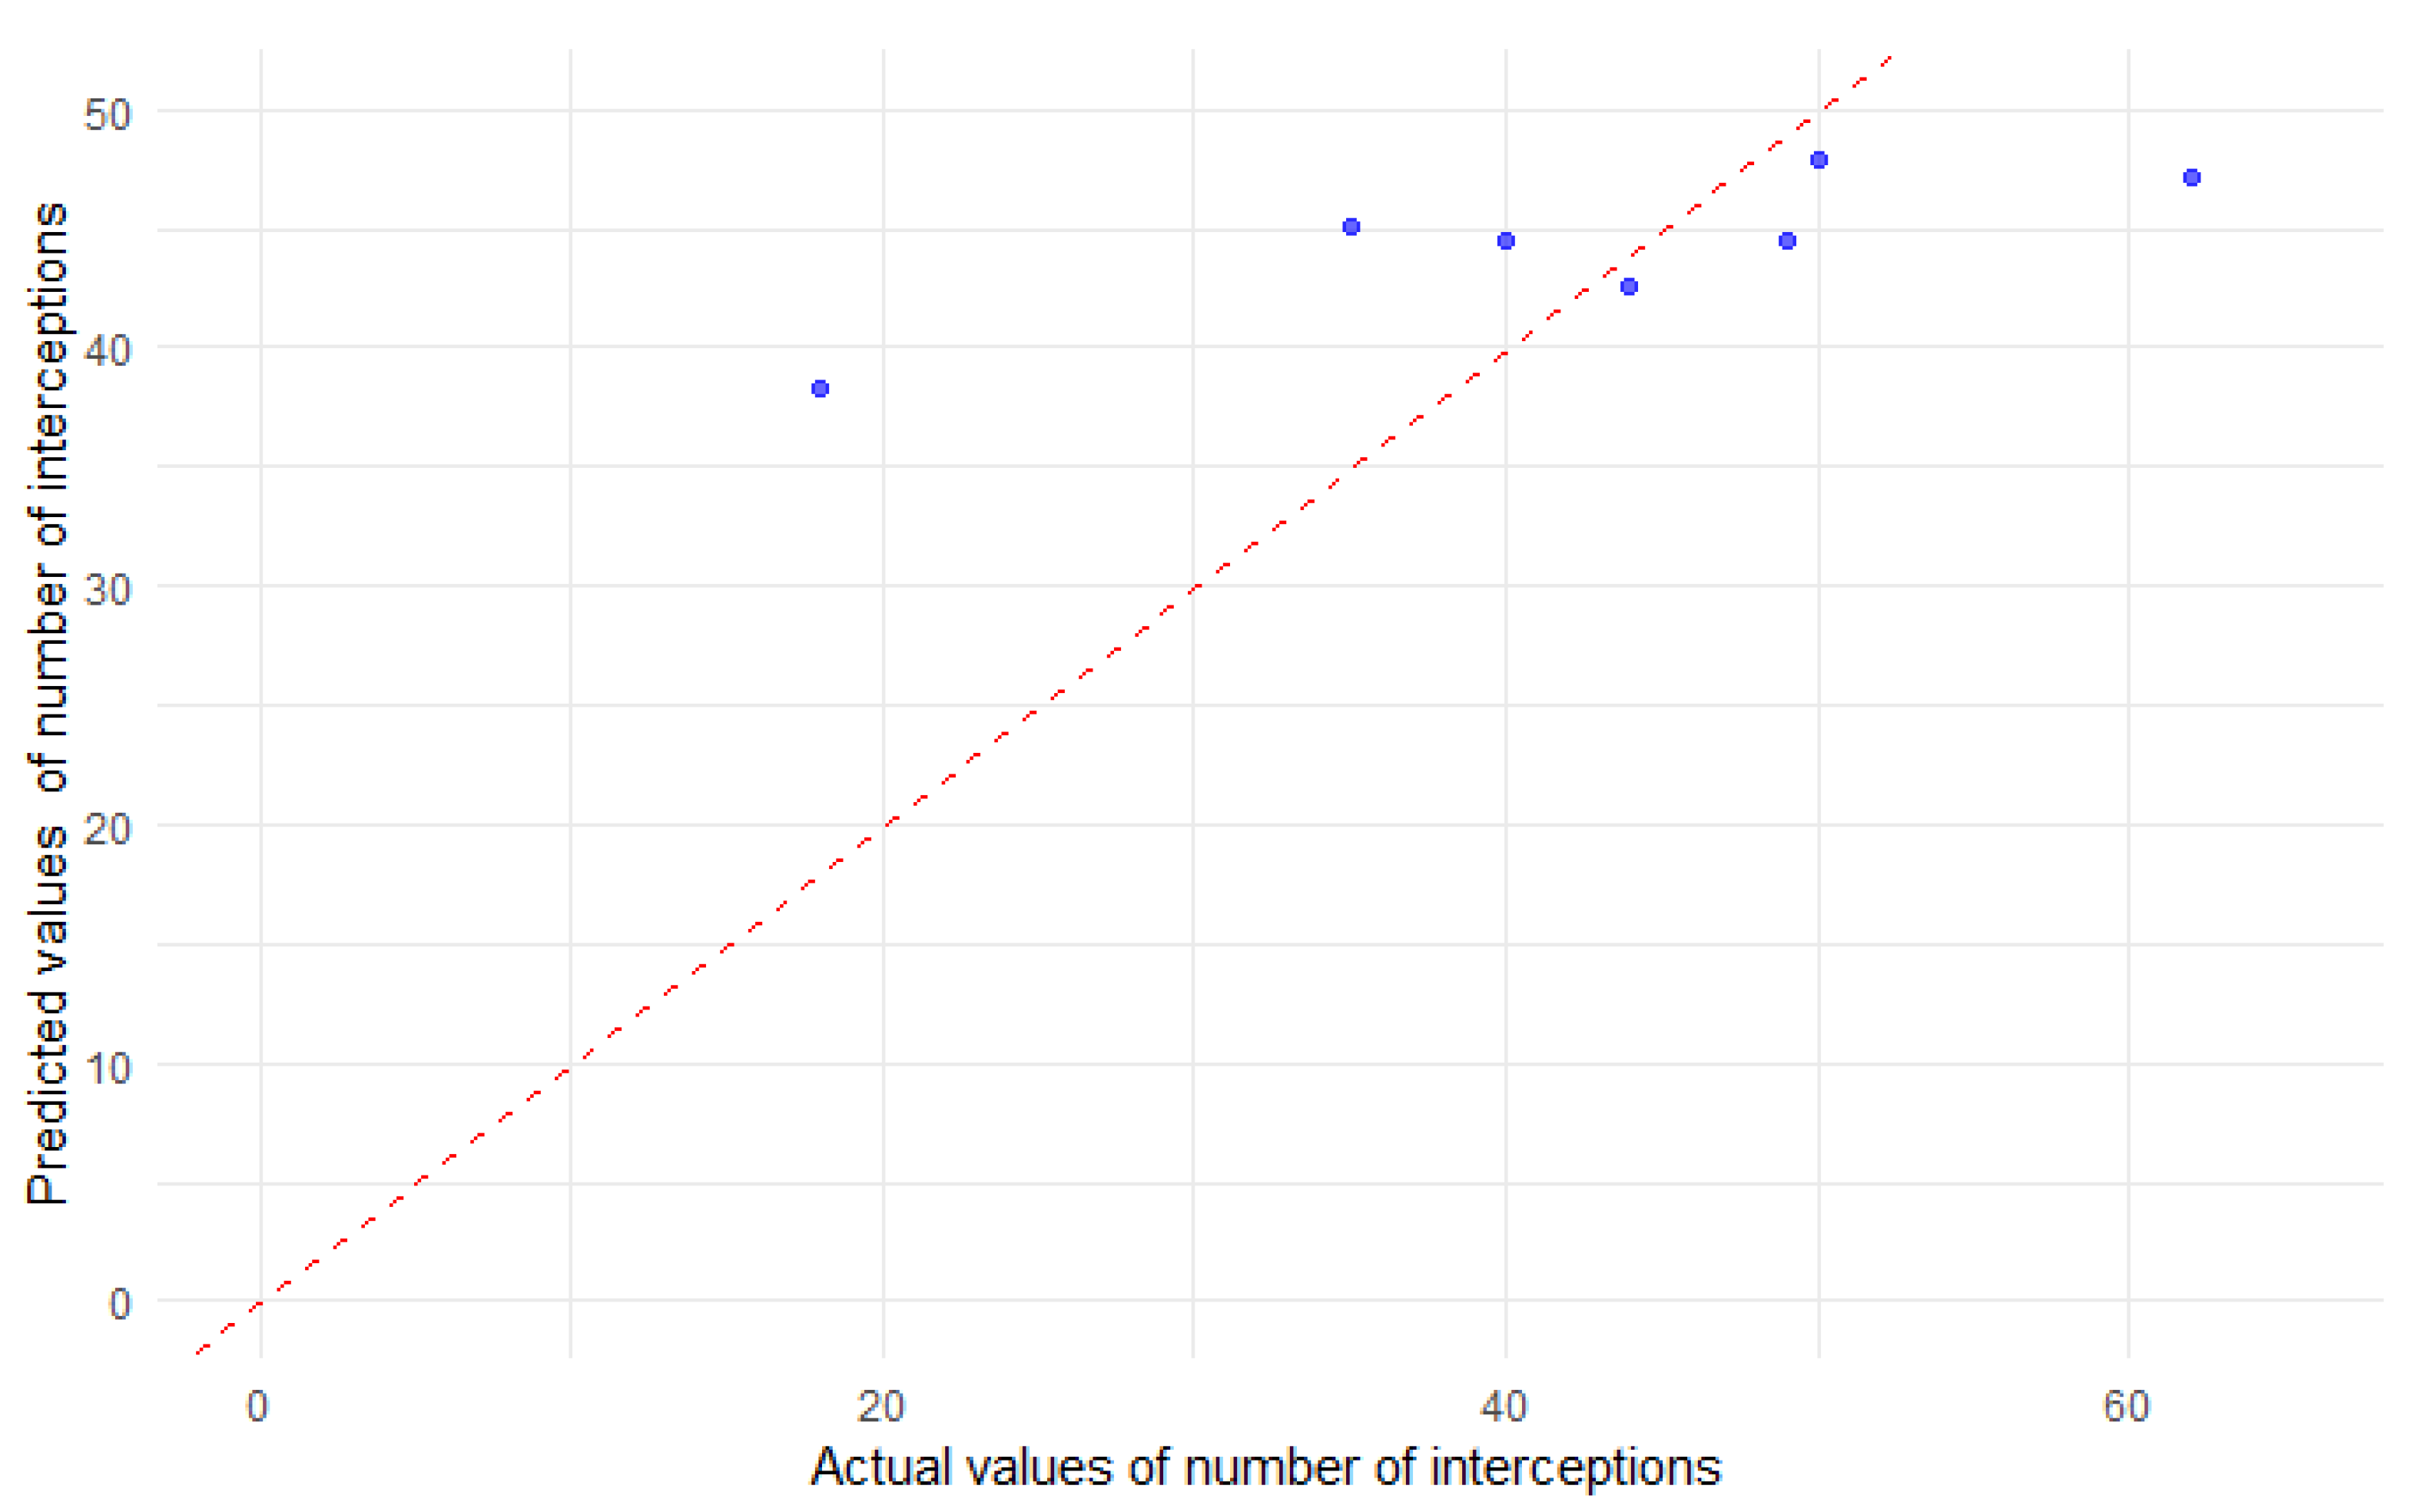
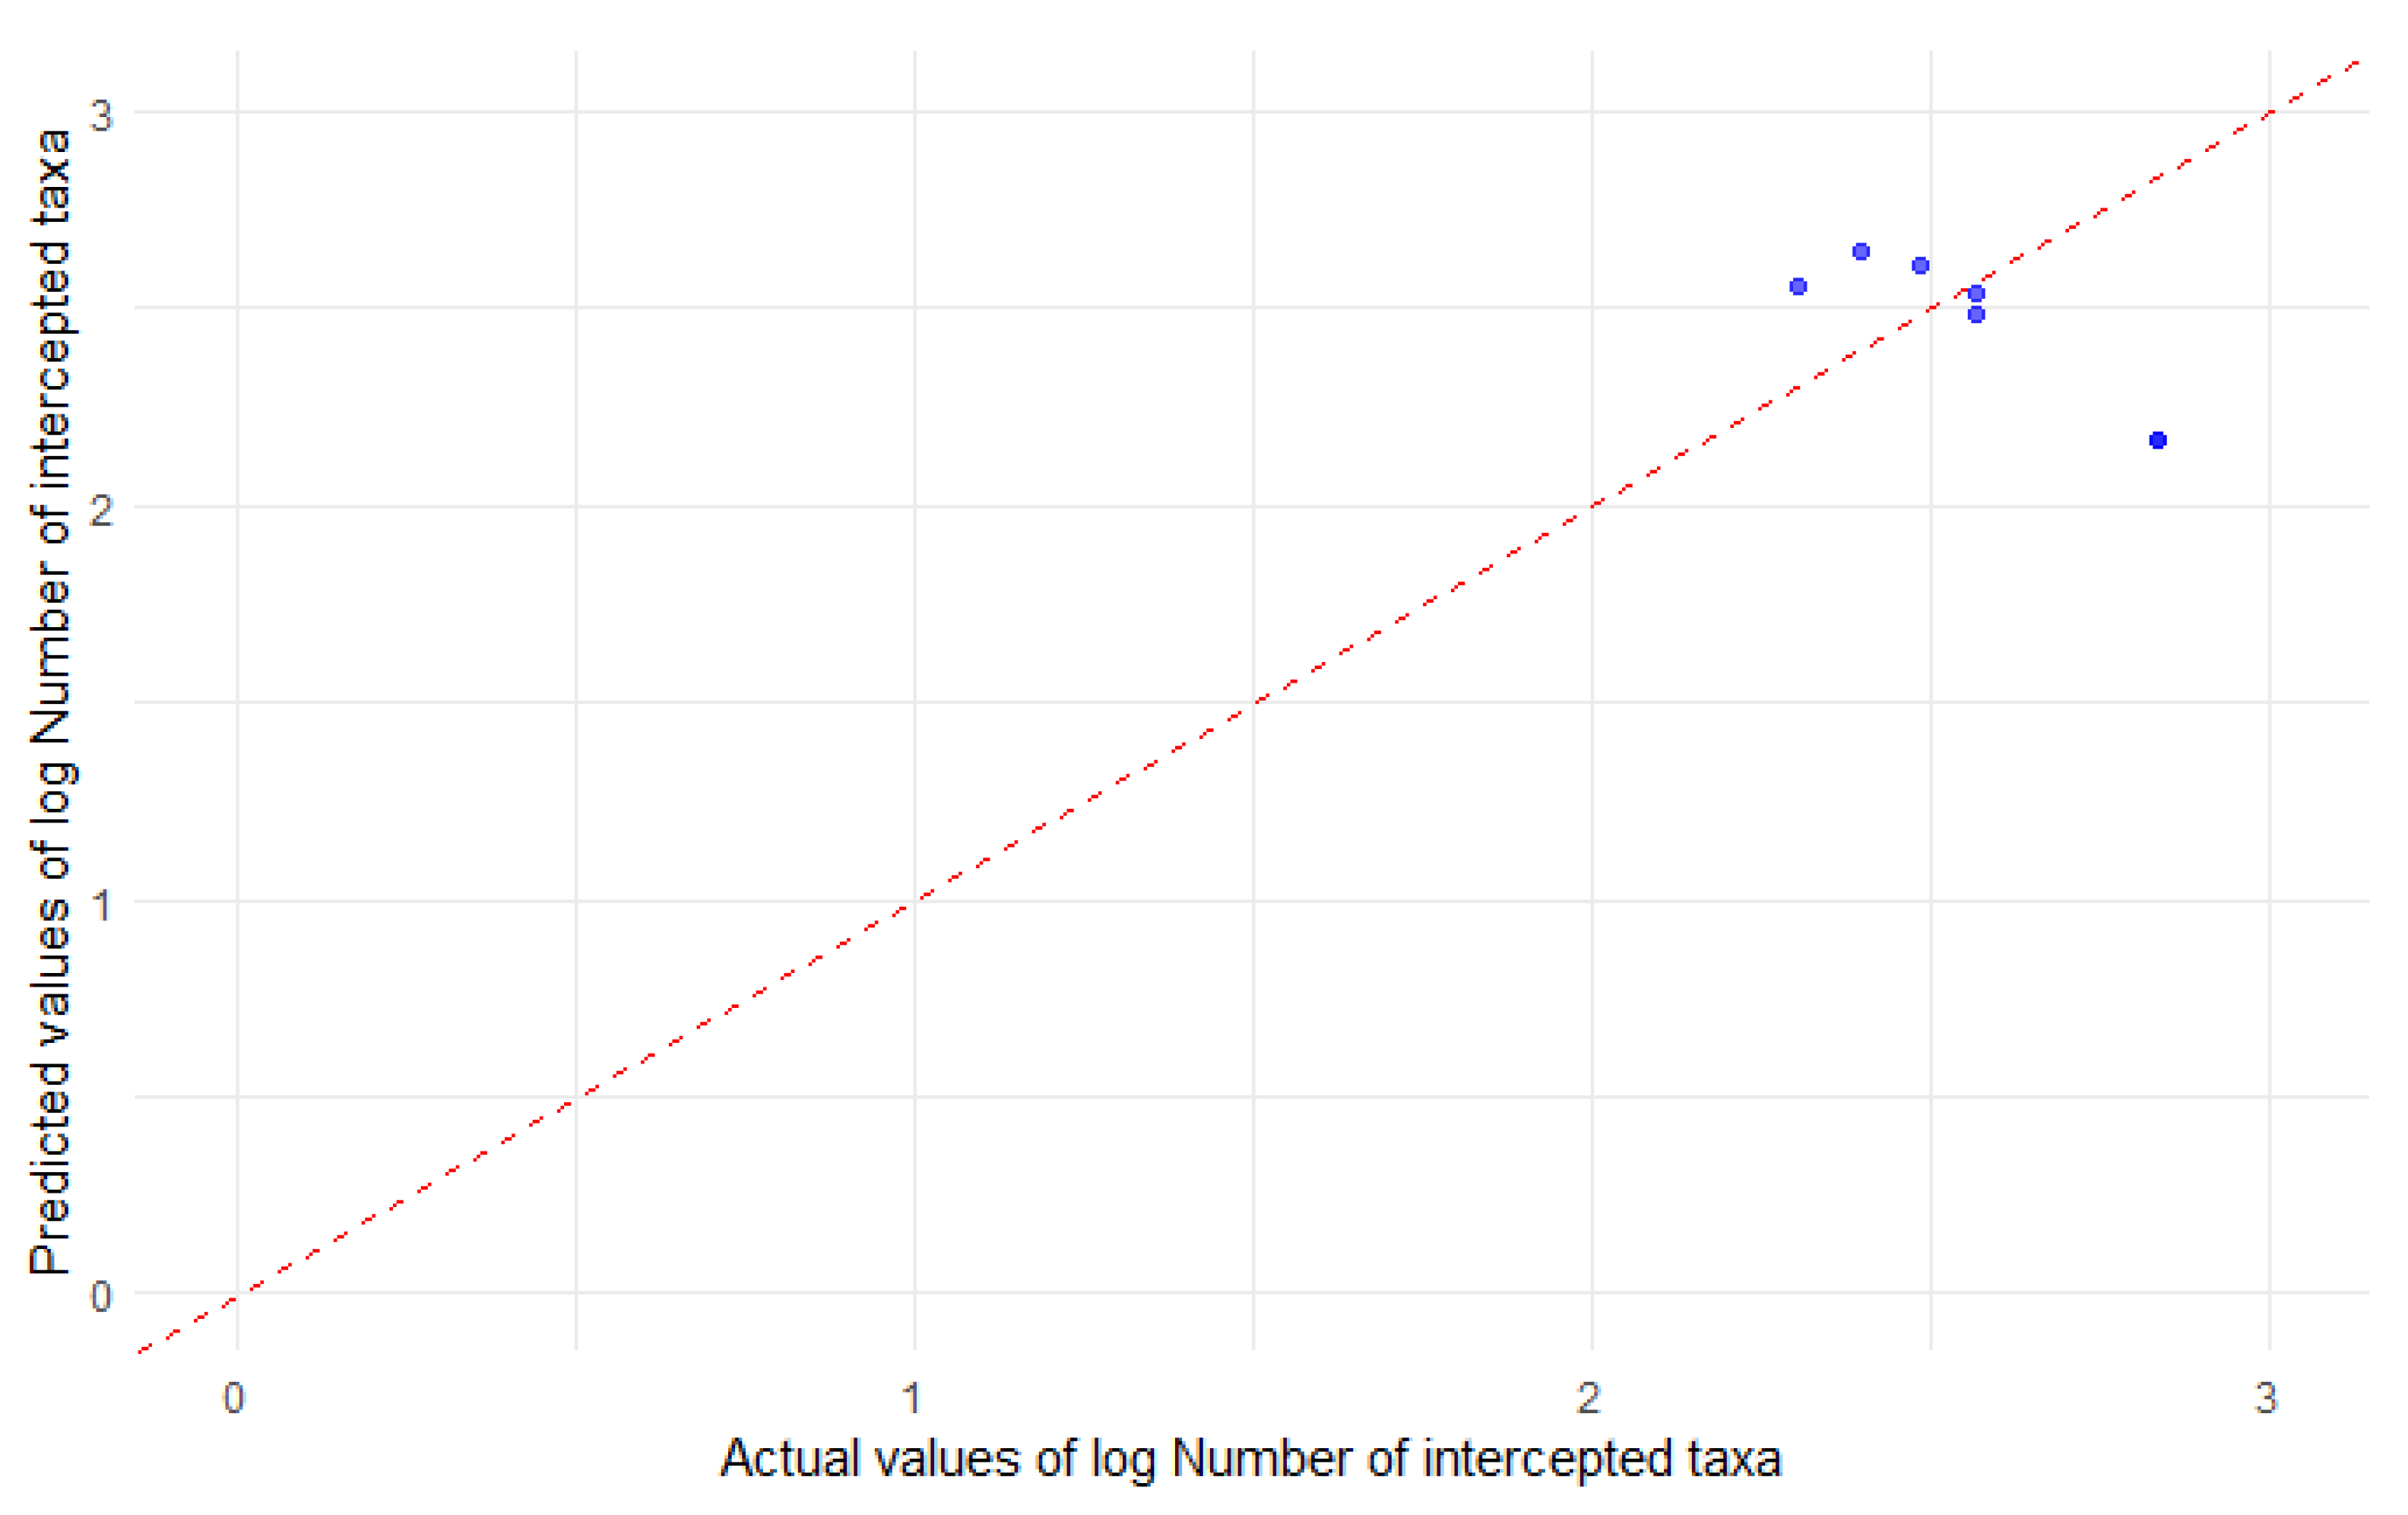
Whilst this is a relatively small dataset on which to trial models of the interceptions data, an approximate assessment of their forecasting performance may be made by plots of predictions versus the actual data for those random 20% datapoints held out by the test set (Figure 7 and Figure 8).
The plots in Figure 7 and Figure 8 assess the predictive performance of the selected machine learning models for the number of interceptions and the log number of intercepted taxa, respectively. In both cases, the predicted values align closely with the actual values, as shown by their proximity to the line of equality (x = y). For the number of interceptions (Figure 7), the majority of the held-out data points are well predicted, indicating strong model performance (Random Forest). Similarly, for the log number of intercepted taxa (Figure 8), the held-out data points show a high degree of concordance with the predictions, further demonstrating the accuracy of the machine learning model (XGBoost).

4. Discussion

Trade networks play a pivotal role in shaping biosecurity risks and parallels between biological invasions [50,51]. There are wider connections to the One Health approach, as Vilà and colleagues [52] concluded that the emergence of human diseases shares many of the same features as biological invasions. The current study explored the dynamics of import pathways, interception patterns, network structures, diversity indices, and the predictive potential of machine learning to enhance biosecurity monitoring and control. Its findings provide a foundation of quantitative methodologies to improve risk assessment and decision-making.

4.1. Import Pathways

Seasonality emerged as a key feature of the import network in our study, with volumes consistently peaking during March–April and November (Figure 1). The March–April peak likely reflects preparations for increased summer demand for festive floral occasions such as International Women’s Day and Mother’s Day (March) and the gardening season, while the November peak aligns with pre-Christmas retail activity. Similar seasonal trends have been observed in other regions. For instance, in Brazil, the demand for flowers and ornamental plants was higher on a few specific dates throughout the year: International Women’s Day (March 8), Mother’s Day (on the second Sunday of May), Christmas (December 25), and New Year’s Day (December 31) [53]. These seasonal patterns place predictable demands on sanitary and phytosanitary (SPS) infrastructure, requiring preparedness to handle higher import volumes during these critical periods.
The regularity of these patterns presents an opportunity for statistical modelling frameworks, such as time series models (e.g., Auto-Regressive Integrated Moving Average (ARIMA), hidden Markov models) to forecast import flow and flag anomalies. This predictive capability could help to optimize resource allocation and enhance biosecurity infrastructure efficiency, especially during periods of high import volume. Incorporating temporal autocorrelation in future studies may further refine our understanding of seasonal and inter-annual variations.

4.2. Interception Patterns

Although seasonal patterns were evident in the import volumes, the relationship between flow volume and interception patterns was not straightforward (Figure 2 and Figure 3). This suggests that interception dynamics are influenced by complex factors beyond import volume alone, including the biological characteristics of taxa [54,55] and the trade network’s structural properties [56]. For example, variations in network metrics like Alatalo interaction evenness may reflect shifts in biosecurity risks, such as increased vulnerability to pests (e.g., Bemisia tabaci Gennadius, 1889) or diseases (e.g., Xylella fastidiosa Wells et al., 1987). Likewise, this is the case for peaks in diversity metrics and flow of taxa which are increasing in the wild such as Acanthus mollis L. or Primula L. hybrids [57].
A study of vulnerability to pathogens in New Zealand [12] concluded that trade network modularity was a reliable predictor for potential pathogen transmission. The interpretation was that a lack of geographic grouping is a less predictable situation for surveillance professionals and indicates a potential for widespread outbreak.

4.3. Network Structure

In agreement with the above study, there appears to be useful concordance across years by the measures of network structure generated from our imports data (Supplementary File).
Notably, Alatalo interaction evenness was lower and Linkage density was higher for the first half of 2022 compared to the other years, potentially reflecting market adjustments following major global disruptions such as EU exit, the COVID-19 pandemic, and the Russia–Ukraine conflict [58]. These changes may have signified a period of trade recovery characterized by increased oligopoly and a division of labour in the market. We keenly welcome further investigation of this hypothesis.
In agreement with others (e.g., Banks et al. [59]), we suggest that a seasonal timepoint of higher Linkage density (such as spring, in this case) is one in which an invasive species could disperse more easily along multiple routes. The correlation between Linkage density and other network measures has been observed elsewhere (e.g., Dormann et al. [60]), suggesting either that this measure is a fundamental characteristic of networks, or that these network measures are tracking the same underlying topological features.

4.4. Diversity Indices

The temporal pattern of Fisher’s alpha is less coherent than that of Inverse Simpson Diversity. This echoes findings elsewhere on diversity indices, such as Beck et al. [61] who concluded that Fisher’s alpha was highly sensitive to sample completeness, and as a metric of diversity suffered from diffuseness.
It is of particular note that peaks and troughs in import flow do not directly coincide with those of import diversity. December and January, for instance, tend to be timepoints of a lower number of imports but a higher diversity of commodities. Regarding the patterns referred to above, the spring peak of import flow is one of high imports and high diversity, but the November (‘pre-Christmas’) one is not. This (perhaps counterintuitive) decoupling of volume and diversity, together with its implications for biosecurity monitoring, presents as a key finding.

4.5. Associations

Intuitively, both network Linkage density and Inverse Simpson Diversity of imports should correlate with the number of intercepted taxa, and the figures support this. A simple but important expectation may be that the taxonomic range of interceptions is likely to increase as the complexity of the trade network (proxied here by average links per node) is increased, and/or the diversity of commodities traded is increased.
Conversely, none of the monitoring measures trialled in this study demonstrated a significant association with the total number of interceptions. This finding aligns with Saccaggi et al. [56], who reported that while the inspected volume of imported plant products correlated with arthropod pest detections, no single factor consistently predicted contaminant presence across their dataset. These results highlight the complex interplay of factors influencing interception counts, suggesting that simplistic models may fail to capture the underlying dynamics. Tracking abundance is inherently more challenging than tracking type diversity [62], further emphasizing the need for advanced statistical methods. Hierarchical approaches, such as Mixed Effects Generalized Linear Models (GLMM) or Bayesian hierarchical modelling, could better account for the structured nature of count data and improve our ability to identify robust predictors in such complex systems.
Internal corroboration is evident in the associations between these network and diversity indicators and the proportion of imports transported by different modes. Notably, Alatalo interaction evenness demonstrates comparable explanatory power to other network measures but exhibits an opposite directional relationship. This suggests that a decrease in Alatalo interaction evenness, rather than an increase, may serve as an indicator of a less biosecure state, highlighting its potential as a complementary metric for assessing biosecurity risks.

4.6. Machine Learning

Saccaggi and colleagues [56] demonstrated that inspected plant volumes were reliably correlated with the detection of arthropod pests, using datasets collected from 2005 to 2019 and analysed with boosted regression trees (BRTs). Despite the relatively small dataset, the machine learning models in this study exhibited remarkable predictive power. Random Forest and XGBoost explained 64% and 84% of the variance, respectively, in the number of interceptions and the log-transformed number of intercepted taxa. These findings underscore the potential of machine learning to uncover patterns and relationships in complex systems, providing a valuable tool for biosecurity monitoring. Integrating such methods into standard protocols could enhance predictive accuracy and optimize resource allocation for inspections.

4.7. Applications

This novel set of indicators may be monitored for stasis or fluctuation as the years roll forward. We suggest that differing, expert-chosen subsets of commodity codes be trialled as proxies for a range of pests, pathogens, and vectors. Indeed, the exemplary way that HMRC provide trade data, including an API for automated downloading, allows analysts to rapidly and reproducibly subset to any given commodity types and time periods. It is hard to overstate the efficiency of this mode of data provision.
Given the finite resources for surveillance as well as the ongoing discovery of novel pests and pathogens, a timepoint of more diverse—or untypical—import flow may be expected to be, on average, a timepoint of changed biosecurity risk. Future analyses will test if these indicators’ absolute values (allowing comparison of magnitudes of change from month to month and year to year), gradients or relative patterns (allowing the comparison of trends) are the more informative. For the subject of import pathways and interception patterns (Figure 1, Figure 2 and Figure 3), it would be fruitful to compare to transport loads and product handling volumes to identify any differences observed and infer the patterns of such finer resolution data. For this, a multivariate approach is recommended on transport economics and biosecurity (i.e., by transshipment volume, by country, origin of goods and raw materials) using the methodology of Hicks [63].
There is obvious scope to correlate these patterns of trade flow to molecular research across international borders, complementing those of Clarke et al. [64] in the Antarctic, Abeynayake et al. [65] in Australia, and Madden et al. [66] in the US.

4.8. Limitations

As noted by Eschen et al. [4], border inspections data may not be the best to use as they are not collected for surveillance purposes, but rather for compliance with prescribed SPS measures.
This study opportunistically used import and interception data which were open access. It is hoped that the same analytical protocol followed here can be productive for a range of other data on trade networks, intercepted taxa, and detections in the wild.
While this study focussed on plant data, it is conjectured that the same methodology will work for products of animal origin, and for such an enquiry, data sources and comparative analyses would be eagerly welcomed.
With more data, for the machine learning models, a chronological split [54] could also be applied to the training dataset, thereby to evaluate the models’ forecasting ability.

5. Conclusions and Further Directions

Kenis et al. [67] determined that only 10% of invasive species with confirmed populations in non-native ranges are detected at ports-of-entry prior to their establishment, demonstrating the potential to be gained through additional biosecurity and surveillance measures. We believe that some progress has been made towards that tracking challenge through this study. Summarising by way of its research questions, we determined the following:
(i)
For the three-year period studied, the network structure and diversity of import pathways demonstrated variation across time, with consistent peaks and troughs for several measures.
(ii)
The number of interceptions, and number of intercepted taxa, also varied over this period.
(iii)
Network Linkage density and Inverse Simpson Diversity of imports correlated to number of intercepted taxa. No bivariate correlation was found to number of interceptions.
(iv)
The machine learning frameworks of Random Forest and XGBoost showed the potential to predict number of interceptions, and number of intercepted taxa, within a useful range.
For a systems approach to trade data, we propose that the network properties of Linkage density and Interaction Strength Asymmetry, and the diversity index of Inverse Simpson, best capture seasonal patterns of numbers of intercepted taxa. It is intriguing to consider that Linkage density, Interaction Strength Asymmetry and Inverse Simpson Diversity may track latent variables in the network. A potentially fruitful extension to our bivariate plots would be formal mechanistic modelling, such as Bayesian multilevel regression.
With more months and years of data as time rolls forward, the tentative seasonal decomposition and overall trends of this paper can be formally analysed using a time series model. Our aspiration is that future research will use this methodology together with other surveillance data of pests and diseases to examine for associations between them. The critical invasion pathways of alien organisms, as well as their timing (seasonality and annual trends) and entry, are pivotal in the development of regulatory measures. This will provide an evidence base to evaluate and forecast the impacts of different scenarios of biosecurity control.

Supplementary Materials

The following supporting information can be downloaded at: https://www.mdpi.com/article/10.3390/d17030213/s1, Figure S1: Monthly plots across 2022–2024: (a) Alatalo interaction evenness, (b) Linkage density, (c) Interaction Strength Asymmetry, (d) Nestedness, (e) Inverse Simpson Index of Diversity, (f) Fisher’s alpha, (g) proportion of imports by road transport, and (h) proportion of imports from EU countries. Figure S2: Sample plots of the bipartite networks generated from the import data. By way of example, the networks for the months of January and February are illustrated for each year. Note that UK ports of entry are represented by the higher-level nodes; countries of dispatch are represented by the lower-level nodes. Table S1: Performance characteristics of the machine learning models on the given dataset of explanatory variables (see Section 2.5.1): The mean absolute error (MAE) is the average magnitude of difference between the prediction of observations and their true value. The coefficient of determination (R2) is the proportion of the variance in the predicted variable that is explained by the explanatory variables.

Author Contributions

K.-W.S. and D.H. conceptualized, designed, performed data analysis, and contributed to drafting the manuscript. R.P. contributed to writing—review and editing. All authors have read and agreed to the published version of the manuscript.

Funding

This research received no external funding.

Institutional Review Board Statement

Not applicable.

Data Availability Statement

The data file ‘Totals1.csv’ and R script ‘system_diversity_and_network_monitoring.R’ are archived as Supplementary Files.

Acknowledgments

KWS is a research fellow of the 2024 DEFRA R&D Fellowship Scheme, supported by the Department for Environment, Food & Rural Affairs. The authors extend their gratitude to Emily Cattell, Ruth Little, Joe Mathews, Justine Bejta, Amanna Giles, and all those who make the R&D Fellowship Scheme happen.

Conflicts of Interest

The authors declare no conflicts of interest.

References

  1. Hulme, P.E. Trade, transport and trouble: Managing invasive species pathways in an era of globalization. J. Appl. Ecol. 2009, 46, 10–18. [Google Scholar] [CrossRef]
  2. Seebens, H.; Essl, F.; Dawson, W.; Fuentes, N.; Moser, D.; Pergl, J.; Pyšek, P.; van Kleunen, M.; Weber, E.; Winter, M.; et al. Global trade will accelerate plant invasions in emerging economies under climate change. Glob. Chang. Biol. 2015, 21, 4128–4140. [Google Scholar] [CrossRef] [PubMed]
  3. Turner, R.M.; Brockerhoff, E.G.; Bertelsmeier, C.; Blake, R.E.; Caton, B.; James, A.; MacLeod, A.; Nahrung, H.F.; Pawson, S.M.; Plank, M.J.; et al. Worldwide border interceptions provide a window into human-mediated global insect movement. Ecol. Appl. 2021, 31, e02412. [Google Scholar] [CrossRef]
  4. Eschen, R.; Britton, K.; Brockerhoff, E.G.; Burgess, T.I.; Dalley, V.; Epanchin-Niell, R.S.; Gupta, K.; Hardy, G.E.S.J.; Huang, Y.; Kenis, M.; et al. International variation in phytosanitary legislation and regulations governing importation of plants for planting. Environ. Sci. Policy 2015, 51, 228–237. [Google Scholar] [CrossRef]
  5. Allen, E.; Noseworthy, M.; Ormsby, M. Phytosanitary measures to reduce the movement of forest pests with the international trade of wood products. Biol. Invasions 2017, 19, 3365–3376. [Google Scholar] [CrossRef]
  6. Epanchin-Niell, R.S.; McAusland, C.; Liebhold, A.M.; Mwebaze, P.; Springborn, M.R. Biological invasions and international trade: Managing a moving target. Rev. Environ. Econ. Policy 2021, 15, 180–190. [Google Scholar] [CrossRef]
  7. GovUK The Border Target Operating Model: August 2023. Available online: https://www.gov.uk/government/publications/the-border-target-operating-model-august-2023/the-border-target-operating-model-august-2023 (accessed on 1 December 2024).
  8. Defra. Plant Health—International Trade and Controlled Consignments, 2017–2021—Experimental Statistics Publication. Available online: https://www.gov.uk/government/statistics/plant-health-international-trade-and-controlled-consignments-2017-2021-experimental-statistics-publication (accessed on 1 December 2024).
  9. GovUK Plant Biosecurity Strategy for Great Britain (2023 to 2028). Available online: https://www.gov.uk/government/publications/plant-biosecurity-strategy-for-great-britain-2023-to-2028 (accessed on 1 December 2024).
  10. Buddenhagen, C.E.; Rubenstein, J.M.; Hampton, J.G.; Rolston, M.P. The phytosanitary risks posed by seeds for sowing trade networks. PLoS ONE 2021, 16, e0259912. [Google Scholar] [CrossRef]
  11. Colunga-Garcia, M.; Haack, R.A.; Magarey, R.D.; Borchert, D.M. Understanding trade pathways to target biosecurity surveillance. NeoBiota 2013, 18, 103–118. [Google Scholar] [CrossRef]
  12. Marshall, M. Implementing Biosecurity in Live Plant Trade Networks. Ph.D. Thesis, Lincoln University, Lincoln, New Zealand, 2022. Available online: https://researcharchive.lincoln.ac.nz/server/api/core/bitstreams/22c46551-024e-41c3-873a-774a40db805a/content (accessed on 1 December 2024).
  13. Hinsley, A.; Hughes, A.C.; van Valkenburg, J.; Stark, T.; van Delft, J.; Sutherland, W.; Petrovan, S.O. Understanding the environmental and social risks from the international trade in ornamental plants. BioScience 2025, 124. [Google Scholar] [CrossRef]
  14. Chen, J. Ornamental plant research inaugural editorial. Ornam. Plant Res. 2021, 1, 1–2. [Google Scholar] [CrossRef]
  15. Smith, R.M.; Baker, R.H.A.; Malumphy, C.P.; Hockland, S.; Hammon, R.P.; Ostojá-Starzewski, J.C.; Collins, D.W. Recent non-native invertebrate plant pest establishments in Great Britain: Origins, pathways, and trends. Agric. For. Entomol. 2007, 9, 307–326. [Google Scholar] [CrossRef]
  16. Brasier, C.M. The biosecurity threat to the UK and global environment from international trade in plants. Plant Pathol. 2008, 57, 792–808. [Google Scholar] [CrossRef]
  17. Straw, N.; Fielding, N.J.; Tilbury, C.A.; Williams, C.D.; Cull, T. History and development of an isolated outbreak of Asian longhorn beetle Anoplophora glabripennis (Coleoptera: Cerambycidae) in southern England. Agric For Entomol. 2016, 18, 280–293. [Google Scholar] [CrossRef]
  18. Eyre, D.; Barbrook, J. The eradication of Asian longhorned beetle at Paddock Wood, UK. CABI Agric. Biosci. 2021, 2, 12. [Google Scholar] [CrossRef]
  19. Renault, D.; Angulo, E.; Cuthbert, R.N.; Haubrock, P.J.; Capinha, C.; Bang, A.; Kramer, A.M.; Courchamp, F. The magnitude, diversity, and distribution of the economic costs of invasive terrestrial invertebrates worldwide. Sci. Total Environ. 2022, 835, 155391. [Google Scholar] [CrossRef]
  20. Haubrock, P.J.; Turbelin, A.J.; Cuthbert, R.N.; Novoa, A.; Taylor, N.G.; Angulo, E.; Ballesteros-Mejia, L.; Bodey, T.W.; Capinha, C.; Diagne, C.; et al. Economic costs of invasive alien species across Europe. In Zenni, R.D., McDermott, S., García-Berthou, E., Essl, F., Eds.: The economic costs of biological invasions around the world. NeoBiota 2021, 67, 153–190. [Google Scholar] [CrossRef]
  21. Turner, R.M.; Liebhold, A.M.; Nahrung, H.F.; Caton, B.; Seebens, H.; Yamanaka, T.; Liebhold, A.M. The known unknowns in international border interceptions of non-native insects. Biol. Invasions 2025, 27, 50. [Google Scholar] [CrossRef]
  22. Brockerhoff, E.G.; Kimberley, M.; Liebhold, A.M.; Haack, R.A.; Cavey, J.F. Predicting how altering propagule pressure changes establishment rates of biological invaders across species pools. J. Ecol. 2014, 95, 594–601. [Google Scholar] [CrossRef]
  23. McCullough, D.G.; Work, T.T.; Cavey, J.F.; Liebhold, A.M.; Marshall, D. Interceptions of Nonindigenous Plant Pests at US Ports of Entry and Border Crossings Over a 17-year Period. Biol. Invasions 2006, 8, 611–630. [Google Scholar] [CrossRef]
  24. Saracco, F.; Di Clemente, R.; Gabrielli, A.; Squartini, T. Detecting early signs of the 2007–2008 crisis in the world trade. Sci. Rep. 2016, 6, 30286. [Google Scholar] [CrossRef]
  25. Braun, E.; Sebestyén, T.; Kiss, T. The strength of domestic production networks: An economic application of the Finn cycling index. Appl. Netw. Sci. 2021, 6, 69. [Google Scholar] [CrossRef] [PubMed]
  26. Moslonka-Lefebvre, M.; Finley, A.; Dorigatti, I.; Dehnen-Schmutz, K.; Harwood, T.; Jeger, M.J.; Xu, X.; Holdenrieder, O.; Pautasso, M. Networks in plant epidemiology: From genes to landscapes, countries, and continents. Phytopathology 2011, 101, 392–403. [Google Scholar] [CrossRef] [PubMed]
  27. HM Revenue & Customs. Bulk Import Datasets Published Under the Open Government Licence. Available online: https://www.uktradeinfo.com/trade-data/latest-bulk-datasets/bulk-datasets-archive/#imports-(bds-imp-yymm) (accessed on 1 December 2024).
  28. Phytosanitary Conditions Regulation (EU 2019/2072). Available online: https://www.legislation.gov.uk/uksi/2023/1131/made (accessed on 24 December 2024).
  29. UK Plant Health Information Portal. Available online: https://planthealthportal.defra.gov.uk/trade/imports/alert-list/ (accessed on 1 December 2024).
  30. Oksanen, J.; Blanchet, F.G.; Kindt, R.; Legendre, P.; Minchin, P.R.; O’Hara, R.B.; Simpson, G.L.; Solymos, P.; Henry, M.; Stevens, H.; et al. R Package, version 2.4-3; Vegan: Community Ecology Package; R Foundation for Statistical Computing: Vienna, Austria, 2017. Available online: https://CRAN.R-project.org/package=vegan (accessed on 1 December 2024).
  31. Dormann, C.F.; Gruber, B.; Fruend, J. Introducing the bipartite package: Analysing ecological networks. R News 2008, 8, 8–11. [Google Scholar]
  32. Wickham, H. ggplot2: Elegant Graphics for Data Analysis; Springer: New York, NY, USA, 2016. [Google Scholar]
  33. Liaw, A.; Wiener, M. Classification and regression by randomForest. R News 2002, 2, 18–22. [Google Scholar]
  34. Chen, T.; He, T.; Benesty, M.; Khotilovich, V.; Tang, Y.; Cho, H.; Chen, K.; Mitchell, R.; Cano, I.; Zhou, T.; et al. R Package, version 1.7.8.1; xgboost: Extreme Gradient Boosting; R Foundation for Statistical Computing: Vienna, Austria, 2024. Available online: https://CRAN.R-project.org/package=xgboost (accessed on 1 December 2024).
  35. Greenwell, B.M.; Boehmke, B.C. Variable importance plots—An introduction to the vip package. R J. 2020, 12, 343–366. [Google Scholar] [CrossRef]
  36. R Core Team. R: A Language and Environment for Statistical Computing; R Foundation for Statistical Computing: Vienna, Austria, 2022; Available online: https://www.R-project.org/ (accessed on 1 December 2024).
  37. Patefield, W.M. Algorithm AS 159: An efficient method of generating r x c tables with given row and column totals. Appl. Stat. 1981, 30, 91–97. [Google Scholar] [CrossRef]
  38. Hill, M.O. Diversity and evenness: A unifying notation and its consequences. Ecology 1973, 54, 427–432. [Google Scholar] [CrossRef]
  39. Alatalo, R.V. Problems in the measurement of evenness in ecology. Oikos 1981, 37, 199–204. [Google Scholar] [CrossRef]
  40. Bersier, L.F.; Banašek-Richter, C.; Cattin, M.F. Quantitative descriptors of food-web matrices. Ecology 2002, 83, 2394–2407. [Google Scholar] [CrossRef]
  41. Heleno, R.; Devoto, M.; Pocock, M. Connectance of species interaction networks and conservation value: Is it any good to be well connected? Ecol. Indic. 2012, 14, 7–10. [Google Scholar] [CrossRef]
  42. Blüthgen, N.; Menzel, F.; Blüthgen, N. Measuring specialization in species interaction networks. BMC Ecol. 2006, 6, 9. [Google Scholar] [CrossRef] [PubMed]
  43. Rodríguez-Gironés, M.A.; Santamaría, L. A new algorithm to calculate the nestedness temperature of presence–absence matrices. J. Biogeogr. 2006, 33, 924–935. [Google Scholar] [CrossRef]
  44. Burgos, E.; Ceva, H.; Perazzo, R.P.J.; Devoto, M.; Medan, D.; Zimmermann, M.; Delbue, A.M. Why nestedness in mutualistic networks? J. Theor. Biol. 2007, 249, 307–313. [Google Scholar] [CrossRef]
  45. Sajedianfard, N.; Hadian, E.; Samadi, A.H.; Shabani, Z.D.; Sarkar, S.; Robinson, P.A. Quantitative analysis of trade networks: Data and robustness. Appl. Netw. Sci. 2021, 6, 46. [Google Scholar] [CrossRef]
  46. Simpson, E.H. Measurement of diversity. Nature 1949, 163, 688. [Google Scholar] [CrossRef]
  47. Fisher, R.A.; Corbet, A.S.; Williams, C.B. The relation between the number of species and the number of individuals in a random sample of an animal population. J. Anim. Ecol. 1943, 12, 42–58. [Google Scholar] [CrossRef]
  48. Breiman, L. Random forests. Mach. Learn. 2001, 45, 5–32. [Google Scholar] [CrossRef]
  49. Chen, T.; Guestrin, C. XGBoost: A Scalable Tree Boosting System. 2016. Available online: https://arxiv.org/abs/1603.02754 (accessed on 1 December 2024).
  50. Eschen, R.; Grégoire, J.C.; Hengeveld, G.M.; de Hoop, M.B.; Rigaux, L.; Potting, R.P.J. Trade patterns of the tree nursery industry in Europe and changes following findings of citrus longhorn beetle, Anoplophora chinensis Forster. NeoBiota 2015, 26, 1–20. [Google Scholar] [CrossRef]
  51. Lichtenberg, E.; Olson, L.J. The fruit and vegetable import pathway for potential invasive pest arrivals. PLoS ONE 2018, 13, e0192280. [Google Scholar] [CrossRef]
  52. Vilà, M.; Dunn, A.M.; Essl, F.; Gómez-Díaz, E.; Hulme, P.E.; Jeschke, J.M.; Nuñez, M.A.; Ostfeld, R.S.; Pauchard, A.; Ricciardi, A.; et al. Viewing emerging human infectious epidemics through the lens of invasion biology. BioScience 2021, 71, 722–740. [Google Scholar] [CrossRef]
  53. Junqueira, A.H.; Peetz, M. Brazilian consumption of flowers and ornamental plants: Habits, practices and contemporary trends. Ornam. Hortic. 2017, 23, 178–184. [Google Scholar] [CrossRef]
  54. Hayes, K.R.; Barry, S.C. Are there any consistent predictors of invasion success? Biol. Invasions 2008, 10, 483–506. [Google Scholar] [CrossRef]
  55. Duncan, R.P.; Blackburn, T.M.; Rossinelli, S.; Bacher, S. Quantifying invasion risk: The relationship between establishment probability and founding population size. Methods Ecol. Evol. 2014, 5, 1255–1263. [Google Scholar] [CrossRef]
  56. Saccaggi, D.L.; Wilson, J.R.U.; Robinson, A.P.; Terblanche, J.S. Arthropods on imported plant products: Volumes predict general trends while contextual details enhance predictive power. Ecol. Appl. 2022, 32, e2554. [Google Scholar] [CrossRef]
  57. Plant Atlas 2020. 2020. Available online: https://plantatlas2020.org/index.php/ (accessed on 10 January 2024).
  58. Hellegers, P. Food security vulnerability due to trade dependencies on Russia and Ukraine. Food Sec. 2022, 14, 1503–1510. [Google Scholar] [CrossRef]
  59. Banks, N.C.; Paini, D.R.; Bayliss, K.L.; Hodda, M. The role of global trade and transport network topology in the human-mediated dispersal of alien species. Ecol. Lett. 2015, 18, 188–199. [Google Scholar] [CrossRef]
  60. Dormann, C.F.; Fründ, J.; Blüthgen, N.; Gruber, B. Indices, graphs and null models: Analysing bipartite ecological networks. Open Ecol. J. 2009, 2, 7–24. [Google Scholar] [CrossRef]
  61. Beck, J.; Schwanghart, W. Comparing measures of species diversity from incomplete inventories: An update. Methods Ecol. Evol. 2010, 1, 38–44. [Google Scholar] [CrossRef]
  62. Booth, B.D.; Murphy, S.D.; Swanton, C.J. Weed Ecology in Natural and Agricultural Systems; CABI Publishing: Wallingford, CT, USA, 2003. [Google Scholar]
  63. Hicks, D. Quantitative Methods for the Monitoring and Evaluation of Vegetation Survey Data. In Vegetation Dynamics—Ecosystem Management, Conservation, and Protection; IntechOpen: London, UK, 2024. [Google Scholar] [CrossRef]
  64. Clarke, L.J.; Shaw, J.D.; Suter, L.; Atalah, J.; Bergstrom, D.M.; Biersma, E.; Convey, P.; Greve, M.; Holland, O.; Houghton, M.J.; et al. An expert-driven framework for applying eDNA tools to improve biosecurity in the Antarctic. Manag. Biol. Invasions 2023, 14, 379–402. [Google Scholar] [CrossRef]
  65. Abeynayake, S.W.; Fiorito, S.; Dinsdale, A.; Whattam, M.; Crowe, B.; Sparks, K.; Campbell, P.R.; Gambley, C. A rapid and cost-effective identification of invertebrate pests at the borders using MinION sequencing of DNA barcodes. Genes 2021, 12, 1138. [Google Scholar] [CrossRef]
  66. Madden, M.J.L.; Young, R.G.; Brown, J.W.; Miller, S.E.; Frewin, A.J.; Hanner, R.H. Using DNA barcoding to improve invasive pest identification at U.S. ports-of-entry. PLoS ONE 2019, 14, e0222291. [Google Scholar] [CrossRef] [PubMed]
  67. Kenis, M.; Rabitsch, W.; Auger-Rozenberg, M.; Roques, A. How can alien species inventories and interception data help us prevent insect invasions? Bull. Entomol. Res. 2007, 97, 489–502. [Google Scholar] [CrossRef] [PubMed]
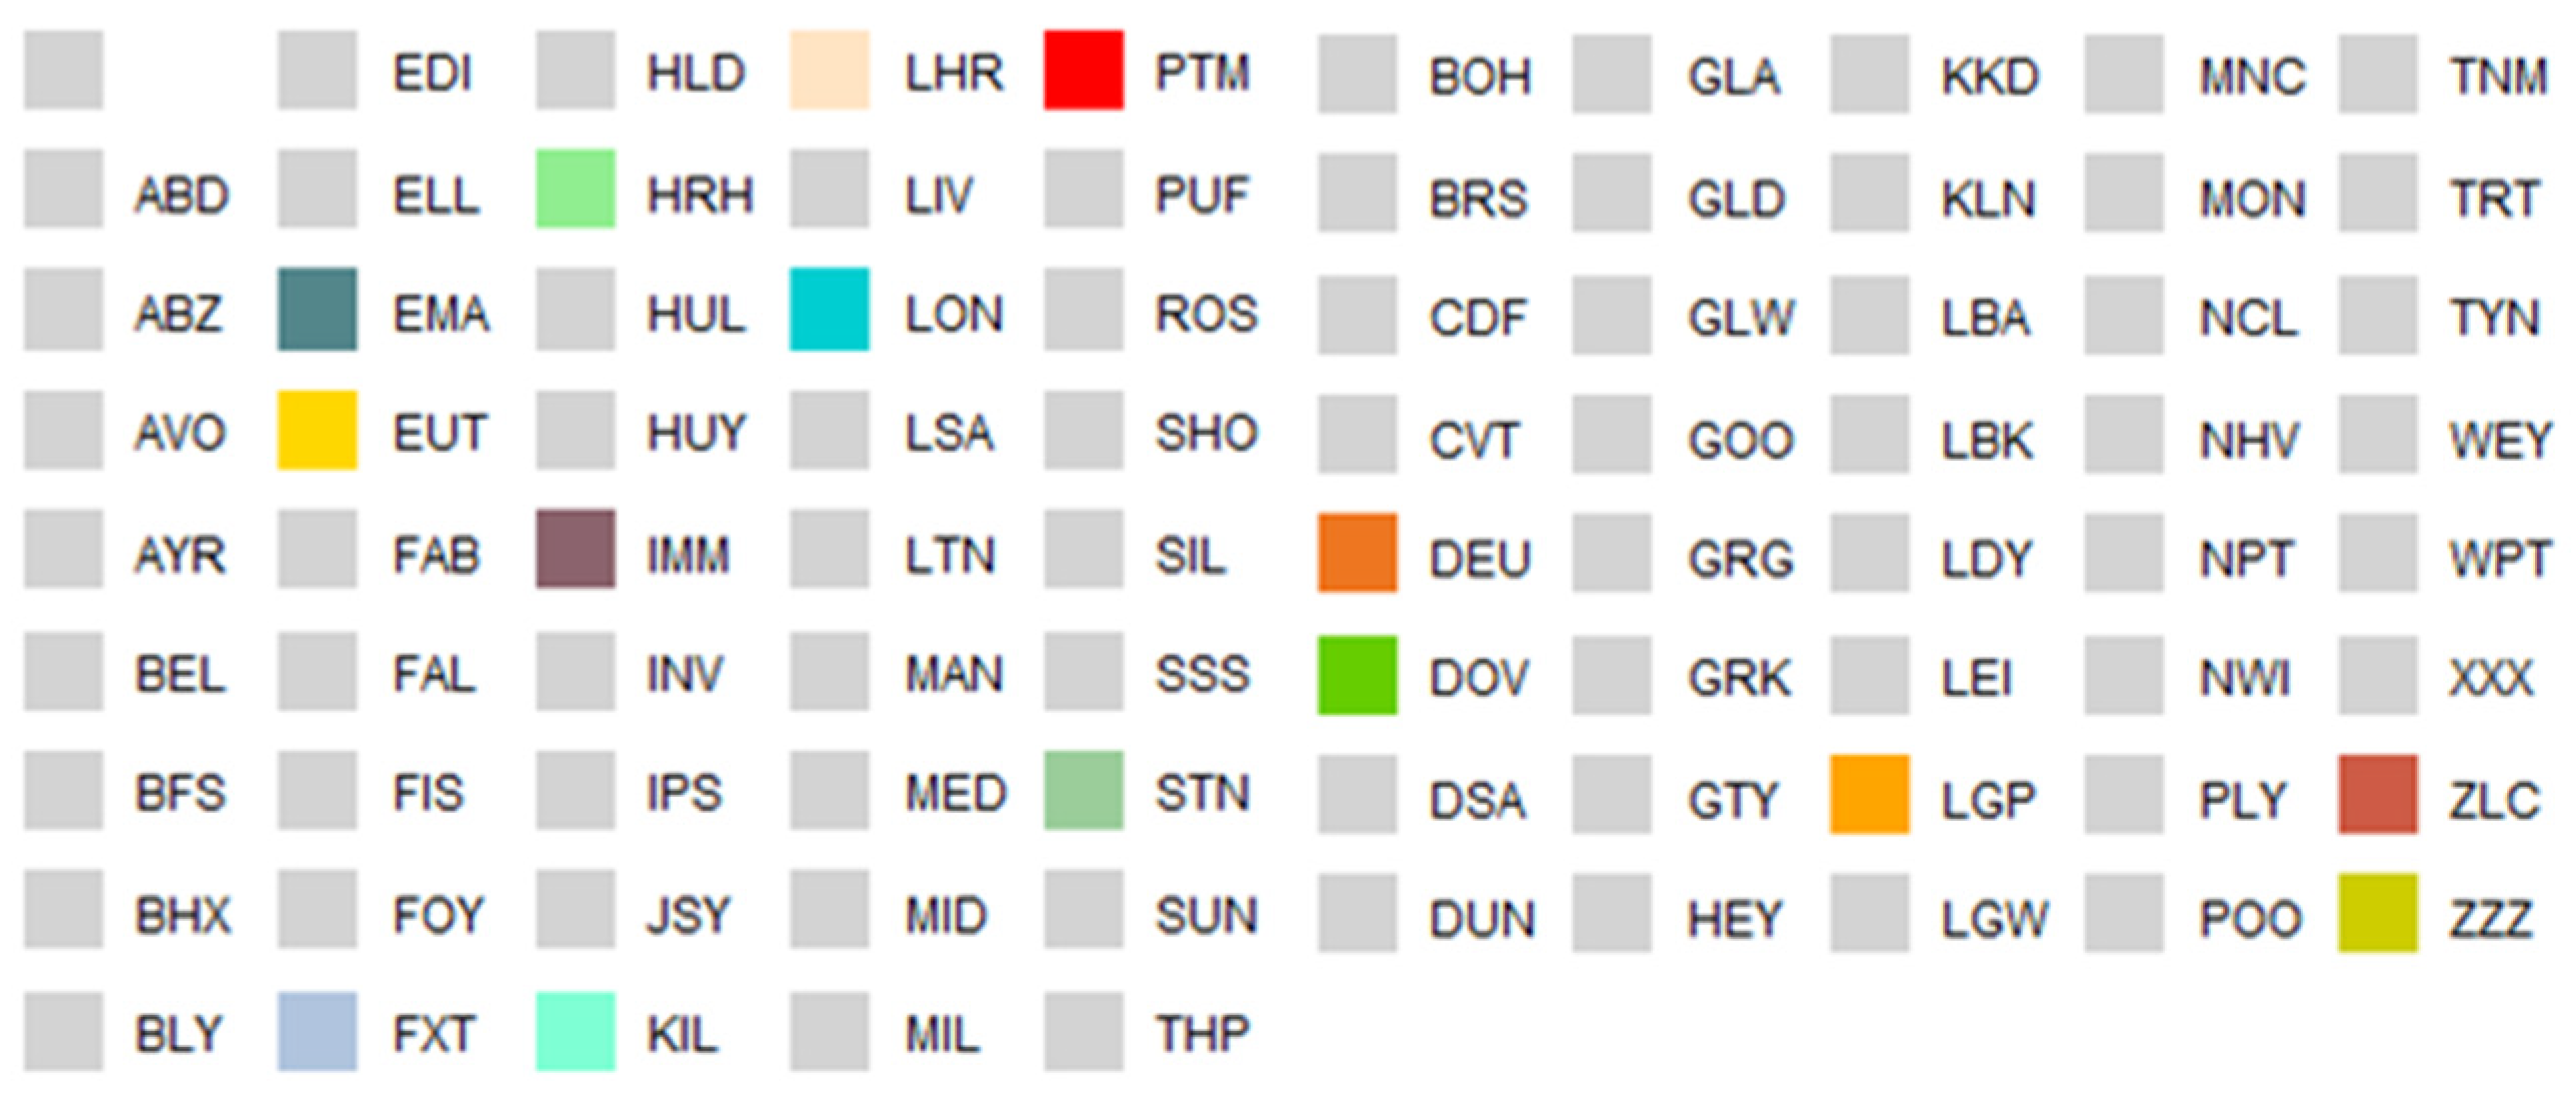
Figure 1. Number of declared plant imports per month for the years 2022 (n = 101,078), 2023 (n = 95,282), and 2024 (n = 74,501) recorded in the HMRC online archive. The bars are coloured by the 15 highest-volume ports of entry: DEU (Dover/Eurotunnel), DOV (Dover), EMA (East Midlands Airport), EUT (Eurotunnel), FXT (Felixstowe), HRH (Harwich), IMM (Immingham), KIL (Killingholme), LGP (London Gateway), LHR (London Heathrow), LON (Tilbury), PTM (Portsmouth), STN (Southampton), ZLC (Inland Clearance), and ZZZ (NA).
Diversity 17 00213 g001aDiversity 17 00213 g001b
Figure 2. Number of interceptions per month for the years 2022 (n = 547), 2023 (n = 602), and 2024 (n = 317) recorded in the UK Plant Health Information portal.
Diversity 17 00213 g002
Figure 3. Number of intercepted taxa per month for the years 2022 (n = 144), 2023 (n = 154), and 2024 (n = 105) recorded in the UK Plant Health Information portal.
Diversity 17 00213 g003
Figure 4. Linear model (dark blue) with standard error band (light blue) of number of intercepted taxa versus Inverse Simpson Index of diversity of regulated plant imports between 2022 and 2024. y = 0.37x − 36.35; adjusted R2 = 0.17, p = 0.010.
Diversity 17 00213 g004
Figure 5. Linear model (dark blue) with standard error band (light blue) of proportion of regulated plant imports by road versus network Linkage density of regulated plant imports between 2022 and 2024. y = 1.53x − 15.26; adjusted R2 = 0.49, p < 0.001.
Diversity 17 00213 g005
Figure 6. Variable importance scores for the optimal predictive models: number of interceptions (top panel) and log number of intercepted taxa (lower panel). The predictor variables are ranked in order of their effect on model improvement, from top to bottom.
Diversity 17 00213 g006
Figure 7. Plot of actual values versus predicted values of the selected machine learning model of number of interceptions. The randomly held out, model-unseen datapoints are shown in blue, with the line of equality (i.e., x = y) dashed red.
Diversity 17 00213 g007
Figure 8. Assessment of the optimal machine learning model of the selected machine learning model of (log) number of intercepted taxa. The randomly held out, model-unseen datapoints are shown in blue, with the line of equality (i.e., x = y) dashed red.
Diversity 17 00213 g008
Table 1. Ordinary least squares (OLS) linear regression outputs from comparisons between the candidate monitoring variables (columns: network structure and diversity indices) and the import variables (rows: interceptions and transport mode). The strongest relationship in each case, determined by significance and adjusted R2, is highlighted in grey.
NetworkDiversity
Alatalo
Interaction Evenness
Linkage DensityInteraction Strength AsymmetryNestednessInverse SimpsonFisher’s Alpha
Number of
interceptions
p < 0.05------
sign------
adjusted R2------
Number of
intercepted taxa
p < 0.05-0.036--0.011-
sign----
adjusted R2-0.106--0.166-
Proportion of imports by roadp < 0.050.0020.0000.0330.0000.010-
sign-
adjusted R20.2550.4870.1100.3210.170-
Disclaimer/Publisher’s Note: The statements, opinions and data contained in all publications are solely those of the individual author(s) and contributor(s) and not of MDPI and/or the editor(s). MDPI and/or the editor(s) disclaim responsibility for any injury to people or property resulting from any ideas, methods, instructions or products referred to in the content.