Article

Evaluation of Soil Fertility in Alpine Shrub Communities of the Qilian Mountains, Northwest China

1
Northwest Institute of Eco-Environment and Resources, Chinese Academy of Sciences, Lanzhou 730000, China
2
Zhangye Forestry Research Institute, Zhangye 734000, China
3
Hexi University, Zhangye 734000, China
*
Author to whom correspondence should be addressed.
Diversity 2025, 17(3), 175; https://doi.org/10.3390/d17030175
Submission received: 24 January 2025 / Revised: 25 February 2025 / Accepted: 26 February 2025 / Published: 28 February 2025

Abstract

:
Understanding soil fertility is significant for the restoration and scientific management of shrub vegetation in the Qilian Mountains. This study focused on the soils associated with five common alpine shrub species—Salix gilashanica, Potentilla fruticosa, Caragana jubata, Caragana tangutica, and Berberis diaphana. We examined soil fertility characteristics, analyzed the relationships among soil fertility indicators, and evaluated the comprehensive fertility status of soil within shrub communities using principal component analysis. The results indicated that (1) the mean values of soil organic matter, total nitrogen, and total phosphorus were 77.94, 3.85, and 0.74 g kg−1, respectively; (2) the soil organic matter and total nitrogen content were significantly higher than the national averages, while the total phosphorus content was slightly lower; and (3) the soil pH and total potassium showed weak variability, the total phosphorus content exhibited moderate variability, and other nutrient indicators (including soil organic matter, total nitrogen, alkali-hydrolyzable nitrogen, available phosphorus, available potassium, soil bulk density, and soil water content) exhibited strong variability. Soil organic matter exhibited a significant positive correlation with total nitrogen, alkali-hydrolyzable nitrogen, and soil water content but negatively correlated with soil pH and bulk density. Total nitrogen was positively correlated with alkali-hydrolyzable nitrogen, available phosphorus, and soil water content but negatively correlated with soil pH and soil bulk density. Total phosphorus demonstrated a positive correlation with total potassium and soil bulk density, whereas total potassium was negatively correlated with available phosphorus. The order of soil fertility of the five communities was Salix gilashanica > Potentilla fruticosa > Berberis diaphana > Caragana jubata > Caragana tangutica. The soil fertility index, based on PCA, indicated that Salix gilashanica exhibited the highest fertility status. The findings of this study provide a theoretical reference for the restoration and reconstruction of shrub vegetation, the enhancement of soil fertility, and the improvement of fragile ecosystems in the Qilian Mountains. It also provides essential insights for soil restoration and sustainable ecosystem management in alpine environments.

1. Introduction

Soil nutrients provide essential support for vegetation growth, while the decomposition of vegetation residues replenishes these nutrients, with microorganisms playing a key role in the process [1]. A comprehensive evaluation of soil nutrient status is critical for the sustainable management of shrub ecosystems. Soil fertility, a fundamental attribute and essential feature of soil, is mainly reflected in soil organic matter, nitrogen, phosphorus, potassium, and other nutrient indicators [2]. It significantly affects vegetation growth, distribution, community composition, and productivity. Conversely, the growth and distribution of vegetation affect the cycling and availability of soil nutrients [3,4,5]. Therefore, understanding soil properties and fertility status is essential for optimizing soil resource use, and it has become a key focus of research both domestically and internationally [6,7].
Soil fertility quality refers to the soil’s capacity to sustain plant productivity and preserve or enhance water and air quality, which is assessed through indicators like nutrient content and fertility indices [8]. Soil fertility indices mainly include nitrogen, phosphorus, potassium, and other nutrient contents in soil. During soil development, soil nutrient content varies according to soil type and region, mainly determined by the type of soil parent material, soil erosion, and human factors [9]. Moreover, due to terrain attributes [10] and climate factors [11], there are notable differences in the spatial distribution of soil nutrients at local and regional scales. In alpine mountainous areas, the terrain of shrub forests is complex. Topography influences soil fertility not only at a regional scale but also within different soil depths, affecting nutrient availability. Therefore, this study aimed to explore the soil fertility status of different shrub forests, providing technical support for ensuring the sustainable and healthy development of the soil ecology in shrub forests.
The Qilian Mountains, situated on the northeastern edge of the Qinghai–Tibetan Plateau, play a significant role in the conservation of water resources, regulation of climate, and protection of biodiversity [12]. In these high-elevation regions, evergreen and alpine deciduous shrubs dominate the landscape and are the primary vegetation type [13]. These ecosystems are essential for sustaining the ecological integrity of the Hexi Corridor and preserving biodiversity in China. However, since the 1950s, a combination of environmental factors and anthropogenic activities has substantially reduced the shrubland areas [14]. In response, the Chinese government implemented the Natural Forest Resource Protection Project to protect forest resources and improve ecosystem services [15]. Over the past 20 years, shrub cover has increased and dominated certain meadows in the Qilian Mountains [16]. Recent studies on the shrubs of the Qilian Mountains highlighted that (1) the shrubs resist harsh conditions by increasing leaf carbon content, although their growth is often restricted by nitrogen [17]; (2) the soil nutrient content in shrub patches varies with depth and location, and the content is higher at the center, in the Eastern Qilian Mountains [18]; (3) shrublands with higher biomass have improved soil moisture, carbon, and nitrogen content [19]; and (4) soil available nitrogen is significantly positively correlated with other available nutrients in the subalpine shrub zone throughout the growing season [20]. However, there is still a lack of research on soil fertility quality evaluation of shrub communities in the Qilian Mountains.
To address this concern, the specific objectives of this study were to (1) determine the fertility characteristics of shrub communities in the Qilian Mountains; (2) reveal the relationship between the fertility factors of shrub communities; and (3) evaluate the soil fertility status of different shrub types. This research also aimed to provide theoretical references for vegetation restoration and soil fertility improvement.

2. Materials and Methods

2.1. Experimental Site

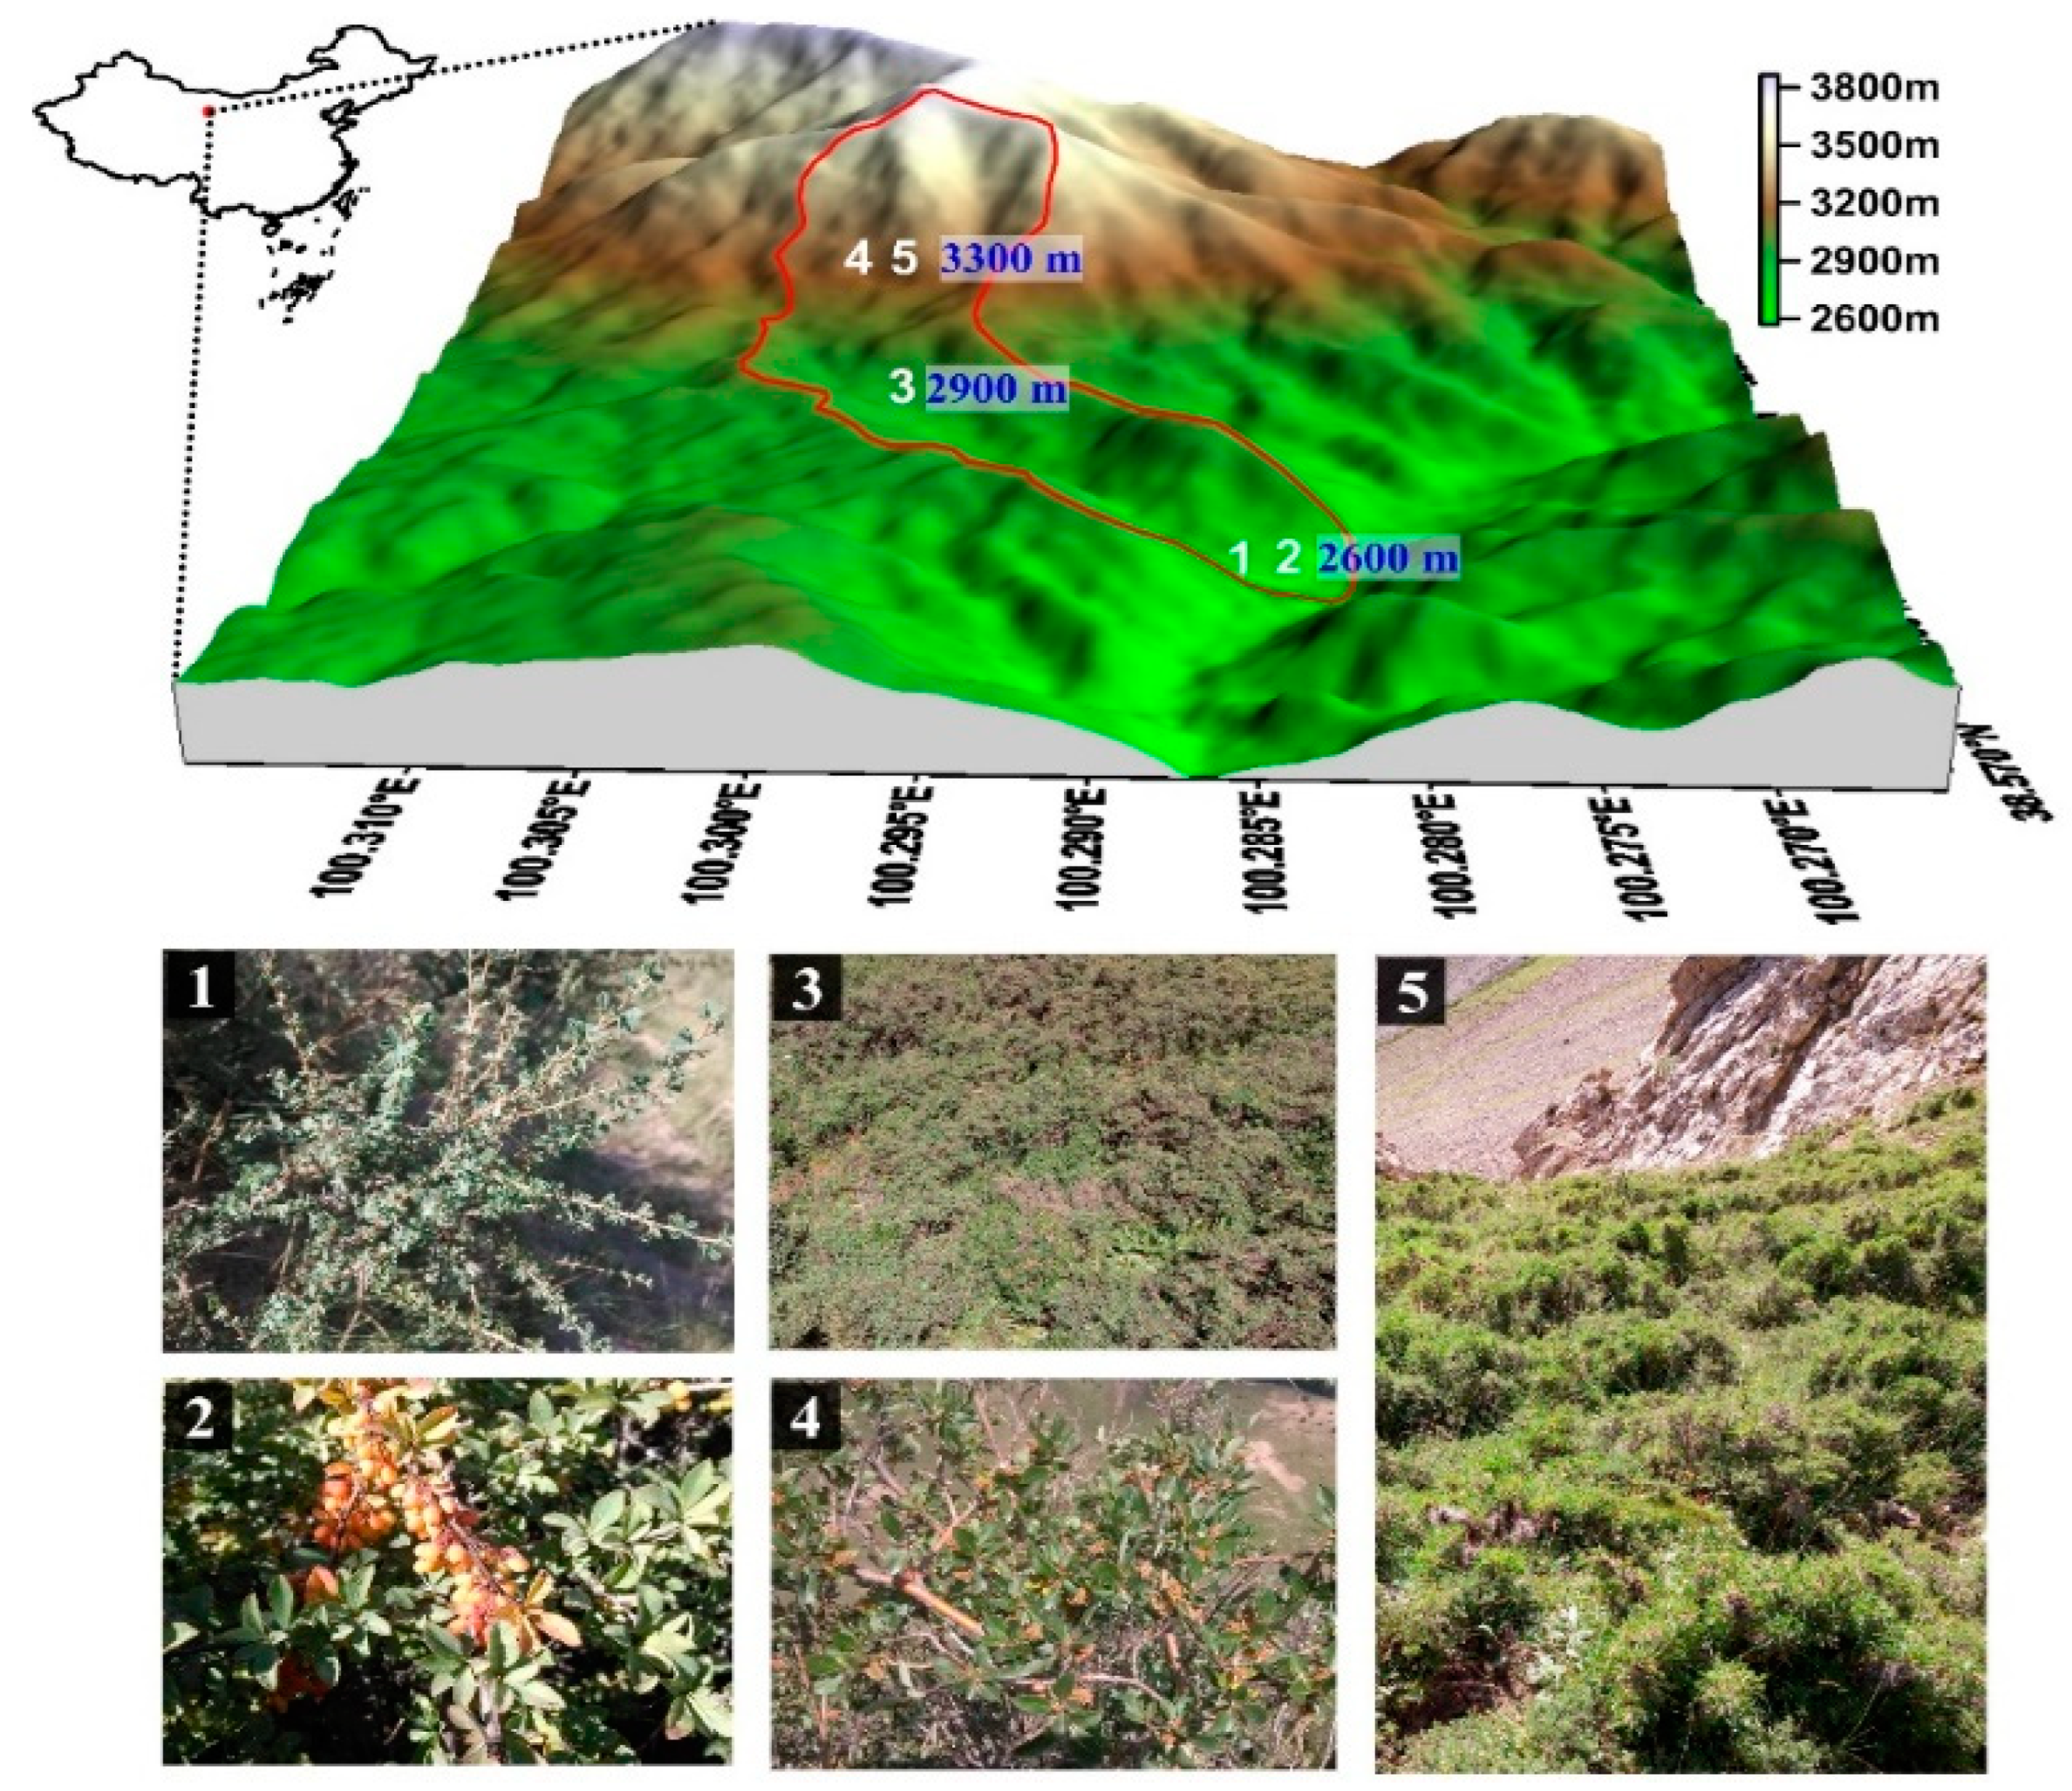
Our study area is in the Dayekou watershed of the Qilian Mountains, Gansu province, Northwest China. The central location is 100°15′ E, 38°31′ N, and the total area is 73.32 km2, with an elevation range of 2590 to 4645 m (Figure 1). This region experiences a temperate continental climate, with cold, dry winters largely influenced by the Mongolian anticyclone, resulting in minimal precipitation. The annual average temperatures range between −0.6 °C and 2.0 °C, with a mean annual precipitation of 434 mm, an average annual evaporation of 1081.7 mm, and an average annual relative humidity of 60%. Soils are classified according to the FAO classification system as Haplic Kastanozems and Haplic Phaeozems [21]. The dominant vegetation includes tree species such as Juniperus przewalskii kom and Picea crassifolia kom, along with alpine shrubs, specifically Berberis diaphana Maxin, Caragana tangutica Maxim. ex Kom, Caragana jubata (Pall.) Poir, Salix gilashanica C. Wang & P. Y. Fu, and Potentilla fruticosa (L.) Rydb [17].

2.2. Experimental Design

To ensure typicality and representativeness, we selected five typical shrub communities, Berberis diaphana, Caragana tangutica, Caragana jubata, Salix gilashanica, and Potentilla fruticosa, as the research subjects. For each community, three survey plots measuring 20 × 20 m were established, resulting in a total of fifteen plots (Figure 2). Then, each sample plot was divided into 5 m × 5 m grids by the grid method, resulting in a total of 240 grids. For each grid, we recorded detailed information on geographical location, elevation, slope gradient, slope aspect, and other relevant data. Additionally, we documented shrub-specific characteristics, including species composition, plant height, crown width, basal diameter, and coverage (Table 1).

2.3. Soil Sample Collection and Analysis

In August 2022, soil samples were collected from five shrub communities located at elevations ranging from 2600 m to 3300 m, each exhibiting distinct biological characteristics and growth environments (Table 1). For each shrub species, three replicate plots were established. Within each plot, five sampling points were selected using a diagonal sampling method. At each point, a soil profile was excavated, and after removing the litter layer and biological crusts, soil texture and color were recorded. Soil samples were collected at five depth intervals (0–60 cm) based on regional soil classification guidelines and root distribution patterns. For bulk density (BD) and soil water content (SWC) analysis, three replicates from each depth interval were collected using a 200 cm3 ring knife and transported to the laboratory. Additionally, composite soil samples were collected from the same five depth intervals (0–60 cm). Composite soil samples were also taken from the same depth intervals. These samples were air-dried, ground, sieved, and analyzed for soil organic matter (SOM), total nitrogen (TN), total phosphorus (TP), total potassium (TK), alkali-hydrolyzable nitrogen (AN), available phosphorus (AP), available potassium (AK), and pH. Three replicates from each depth were thoroughly mixed before analysis.
Soil BD and SWC were measured using the oven-drying method. Soil pH was measured at a soil–water ratio of 1:2.5 (weight–weight). SOM was measured using the dichromate oxidation method. Soil TN was measured using the semi-micro Kjeldahl method, whereas soil AN was measured using the alkaline dispersion method. Soil TP and soil available phosphorus (AP) were measured by the phosphorus vanadium molybdate yellow colorimetric method. Furthermore, soil TK and AK were measured using the molybdenum antimony anti-colorimetric and flame photometry methods [22,23].

2.4. Statistical Analyses

We used one-way ANOVA to test the significance of soil fertility indicators among different shrub patches, with multiple comparisons performed using the Duncan method at a significance level of 0.05. The comprehensive soil fertility index was calculated based on principal component analysis (PCA). In this study, SOM, TN, TP, TK, AN, AP, AK, pH, BD, and SWC were used as indicators for the calculation of a comprehensive soil fertility index. Through PCA, we obtained the common factor variances, loading matrix, and contribution rates of the principal components. The principal component eigenvector was calculated by dividing the loading matrix values by the square root of the eigenvalue of the corresponding component. The principal component factor score for each shrub community was derived by multiplying the principal component eigenvector with the standardized data. The comprehensive soil fertility index was then calculated using a weighted method, expressed as follows:
IFI = W i × F i
where Wi represents the contribution rate of each principal component, and Fi denotes the principal component factor score of each shrub community.
Figures were prepared using R (version 4.0.1), and statistical analyses were conducted using R (version 4.0.1) and SPSS Statistics (version 25.0).

3. Results

3.1. Statistical Analysis of Soil Physicochemical Properties

The soil physicochemical properties of the 0–60 cm layer for five typical shrub patches are presented in Table 2. The SWC ranged from 16.79% to 116.49%, with an average of 55.09% and a coefficient of variation (CV) of 75%, indicating strong variability. Notably, the SWC for the Potentilla fruticosa, Caragana jubata, and Salix gilashanica patches exceeded 50%, while the SWC for the Caragana tangutica and Berberis diaphana patches had lower values of 16.79% and 23.27%, respectively. Notably, the Salix gilashanica patches demonstrated a significantly higher SWC compared to the other shrub patches (p < 0.05). The BD ranged from 0.39 to 0.90 g cm−3, with an average of 0.58 g cm−3 and a CV of 39%, indicating strong variability. The soil in the Caragana tangutica patches exhibited a significantly higher BD than the other shrub patches (p < 0.05), while the Caragana jubata and Salix gilashanica patches had lower BD values, with no significant difference between them (p > 0.05). The soil pH values ranged from 6.64 to 8.54, with an average of 7.95 and a CV of 9%, indicating weak variability. Except for Salix gilashanica, the soils associated with the other four shrubs were alkaline. The SOM content ranged from 23.69 to 129.18 g kg−1, with an average of 77.94 g kg−1 and a CV of 51%, indicating strong spatial heterogeneity. The Salix gilashanica patches had a significantly higher SOM content than the other shrub patches (p < 0.05). The TN ranged from 1.88 to 6.10 g kg−1, with an average of 3.85 g kg−1 and a CV of 44%, indicating strong variability. The Salix gilashanica patches also showed a significantly higher TN than the other shrub patches (p < 0.05). The TP content ranged from 0.48 to 0.91 g kg−1, with an average of 0.70 g kg−1 and a CV of 22%, demonstrating moderate variability, with considerable differences among the shrub patches. The TK content ranged from 11.40 to 14.78 g kg−1, with an average of 13.67 g kg−1 and a CV of 10%, indicating weak variability, with minimal differences between the shrub patches. The AN content ranged from 135.00 to 602.60 mg kg−1, with an average of 359.84 mg kg−1 and a CV of 52%, showing strong variability. Notably, there was no significant difference between the soils associated with Salix gilashanica and Potentilla fruticosa (p > 0.05), but significant differences were observed with the other shrub patches (p < 0.05). The AP content ranged from 3.22 to 8.13 mg kg−1, with an average of 5.93 mg kg−1 and a CV of 45%, implying strong variability. In a similar manner to AN, no significant difference was found between the soils associated with Salix gilashanica and Potentilla fruticosa (p > 0.05), but significant differences were observed with the other shrub patches (p < 0.05). No significant differences were found among the Caragana jubata, Potentilla fruticosa, and Berberis diaphana patches (p > 0.05). Finally, the AK content ranged from 52.74 to 192.96 mg kg−1, with an average of 115.84 mg kg−1 and a CV of 57%, indicating strong variability. The Potentilla fruticosa patch exhibited a significantly higher AK than the other shrub patches.

3.2. Spatial Variability in Soil Physicochemical Properties

3.2.1. Spatial Variability in BD and SWC

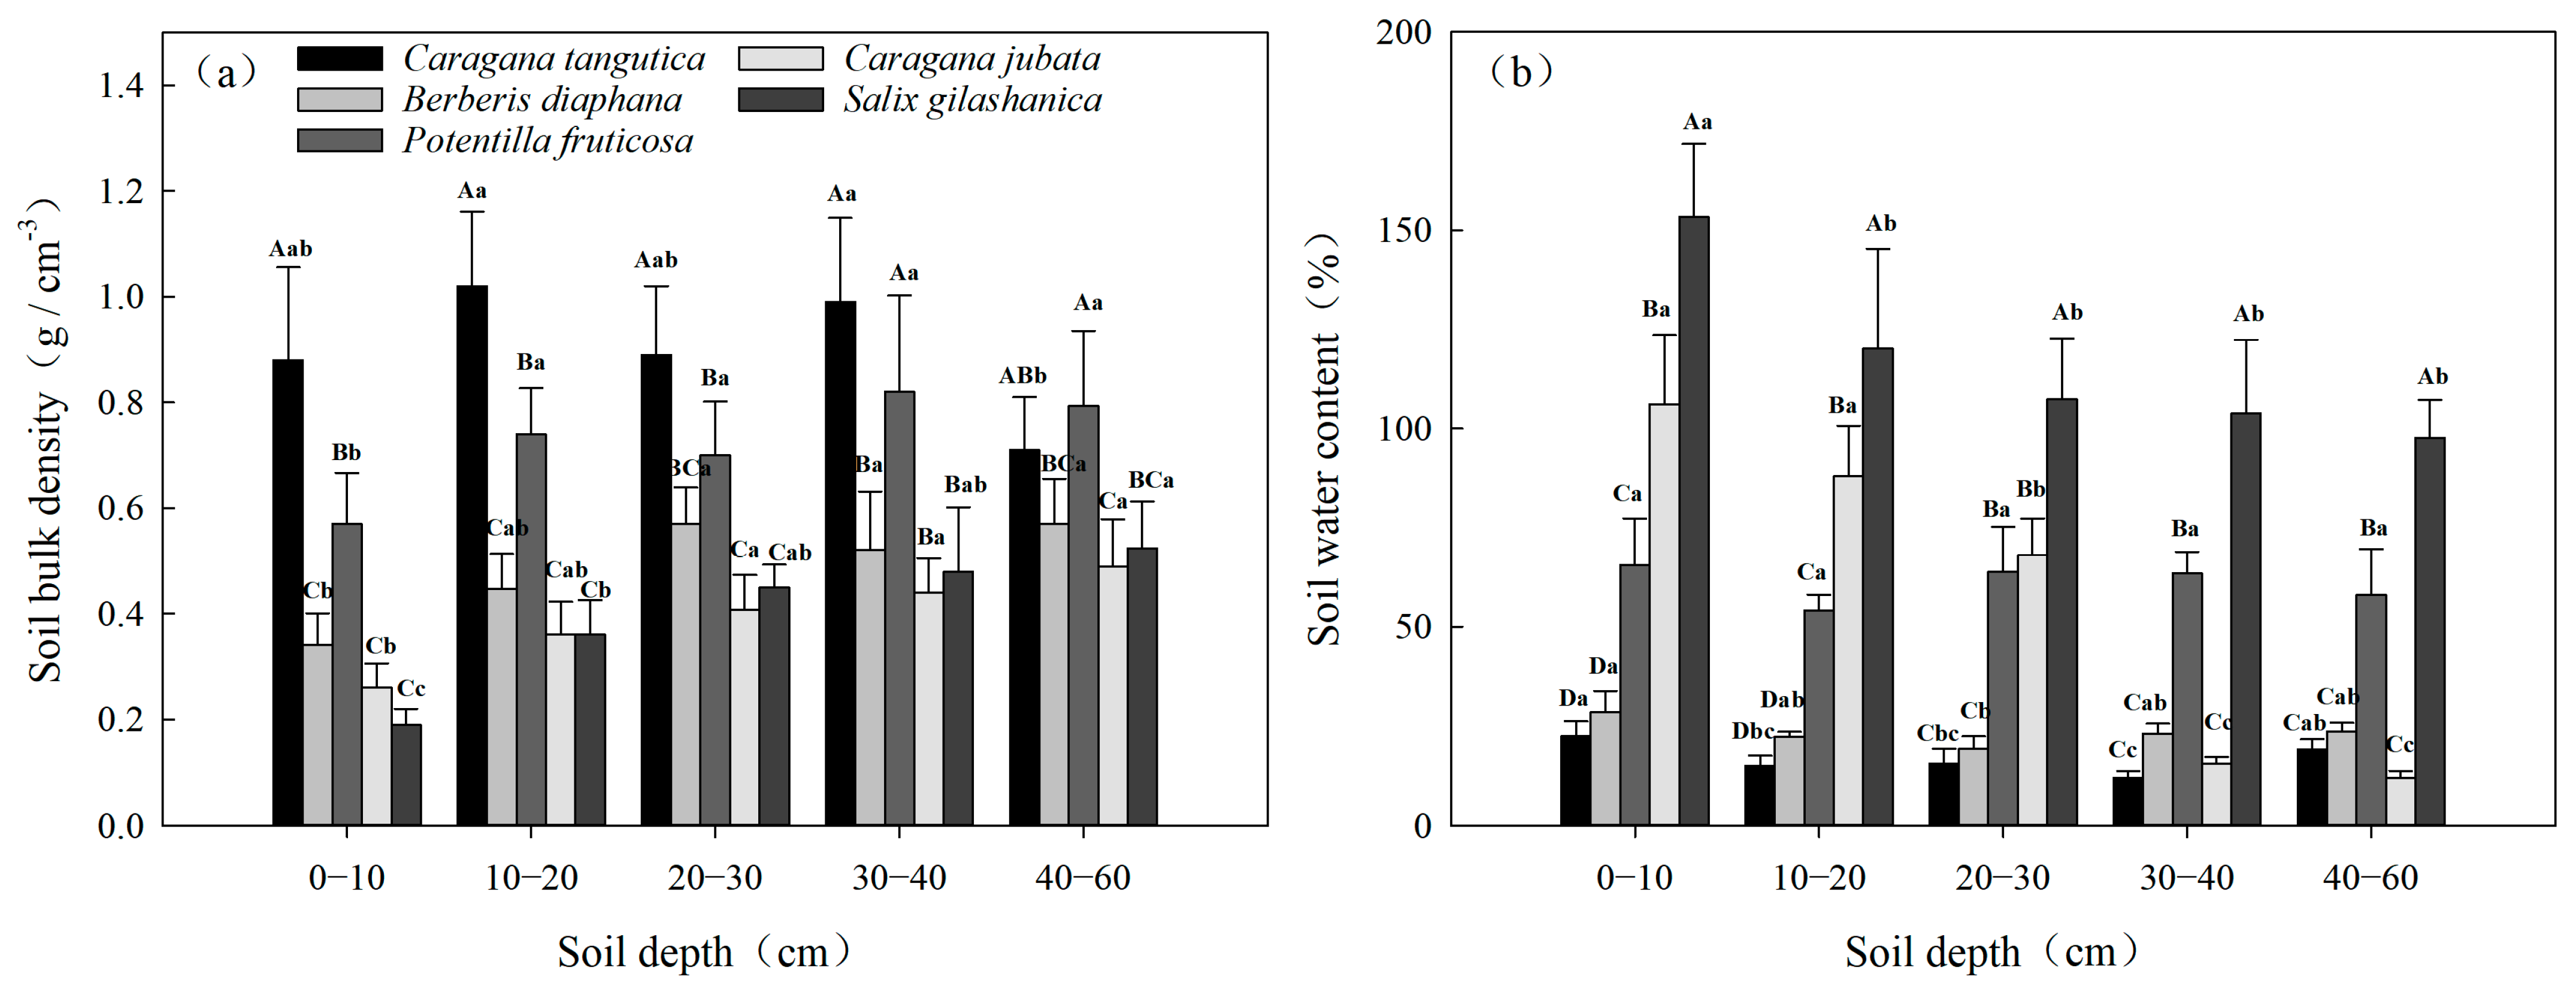
As the soil depth increased, the BD of Caragana tangutica increased first and then decreased, with the maximum value measured in the 10–20 cm soil layer (1.02 ± 0.14 g·cm−3) and the minimum in the 40–60 cm soil layer (0.71 ± 0.10 g·cm−3). The BD of Berberis diaphana, Potentilla fruticosa, Caragana jubata, and Salix gilashanica showed an increasing trend, with the minimum value recorded in the 0–10 cm soil layer (Figure 3a). As the soil depth increased, the SWC of Caragana tangutica decreased first and then increased, with the highest value in the 0–10 cm soil layer and the lowest in the 30–40 cm soil layer. The SWC of Berberis diaphana showed a fluctuating trend, with the maximum value in the 0–10 cm soil layer and the minimum in the 20–30 cm soil layer. The change in SWC in each soil layer of Caragana jubata was small (53.98–65.55%). The SWC of Caragana jubata and Salix gilashanica showed a decreasing trend (Figure 3b).

3.2.2. Spatial Variability in SOM and pH

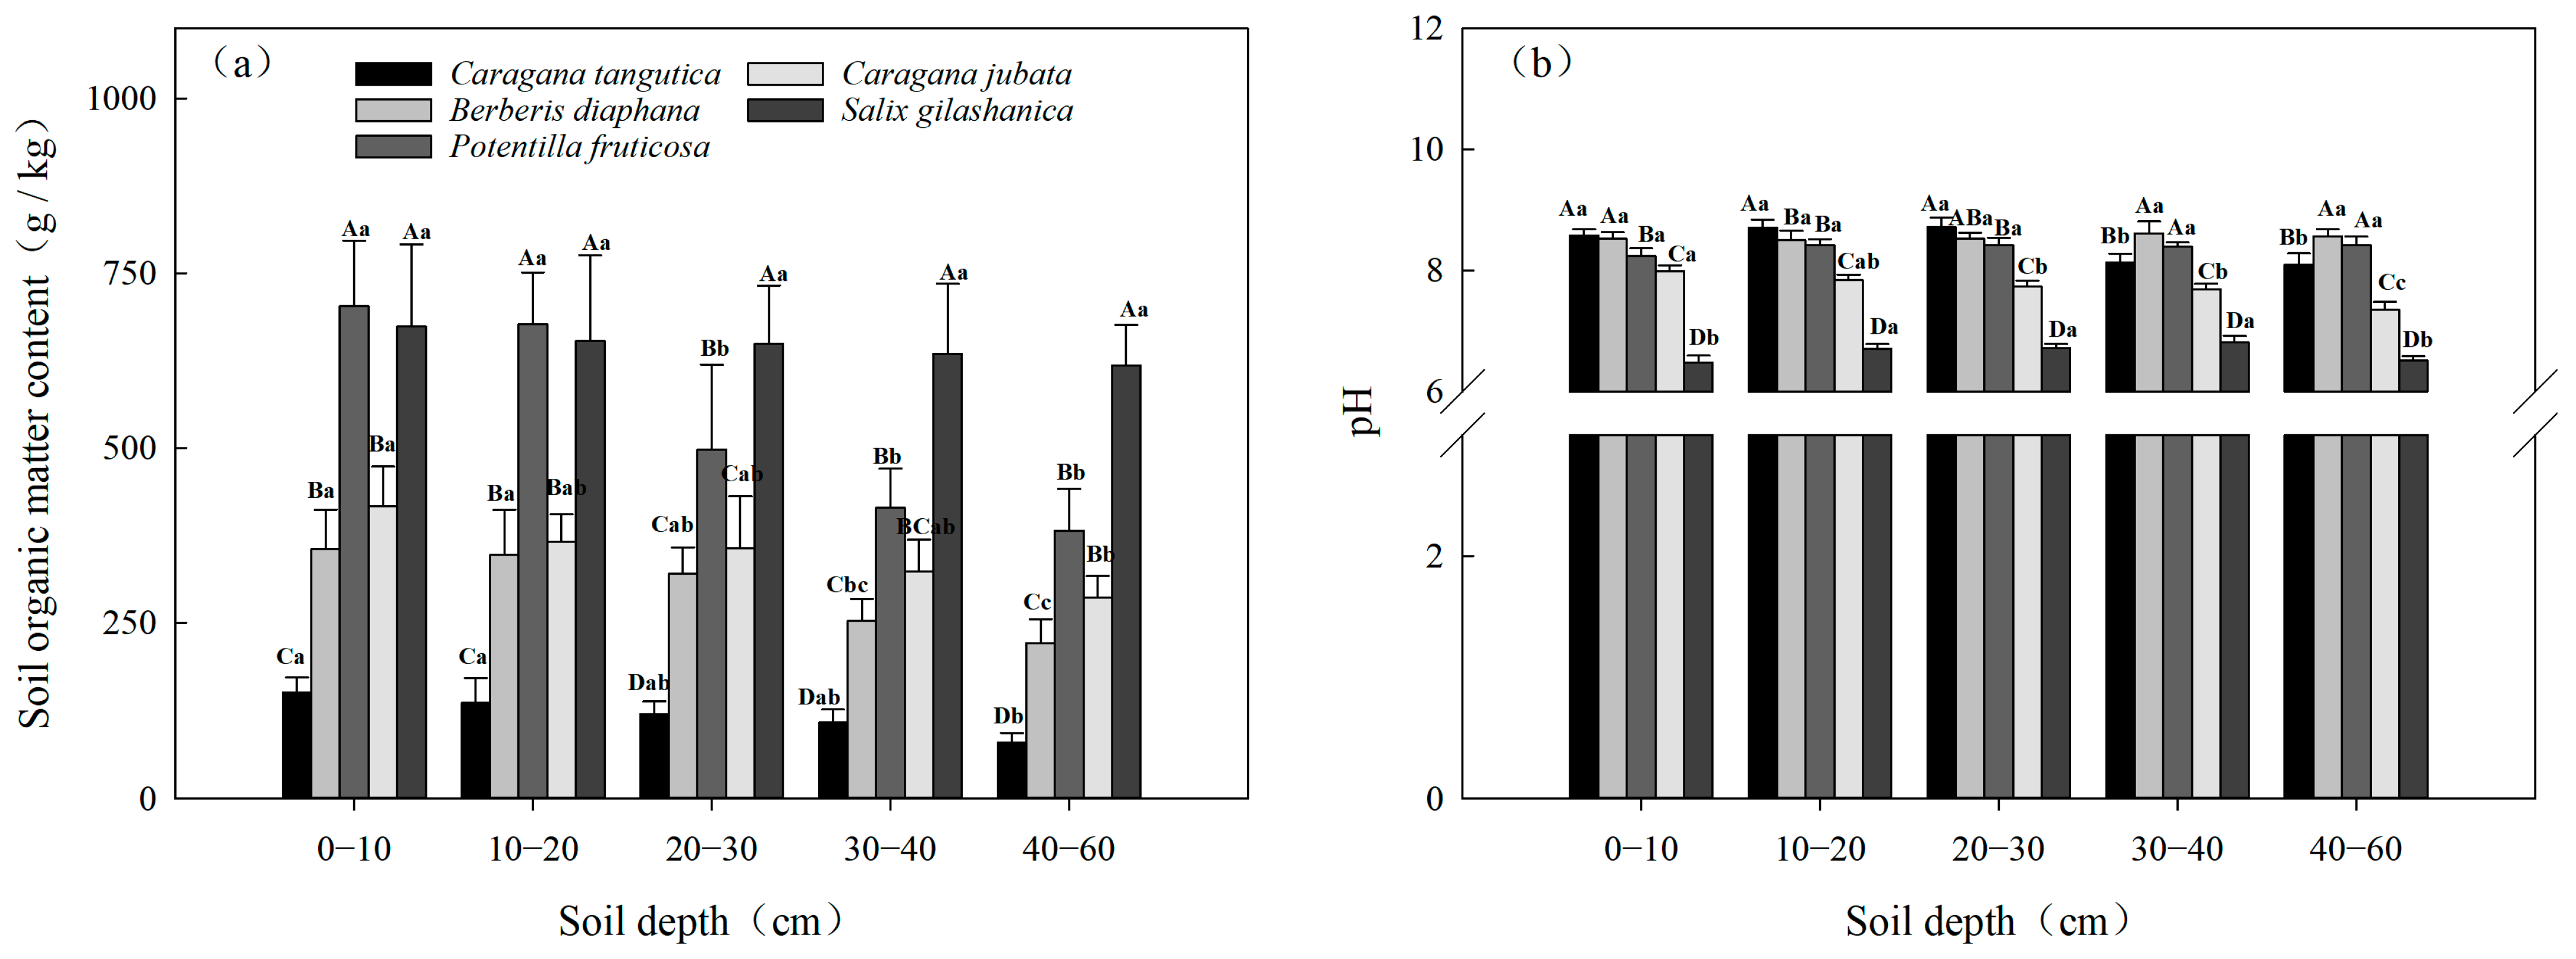
As the soil depth increased, the SOM of the five shrubs showed a decreasing trend, demonstrating a distinct “surface accumulation phenomenon” (Figure 4a). The soil pH value of the five shrubs showed little change, being alkaline with the exception of Salix gilashanica (Figure 4b).

3.2.3. Spatial Variability in TN and AN

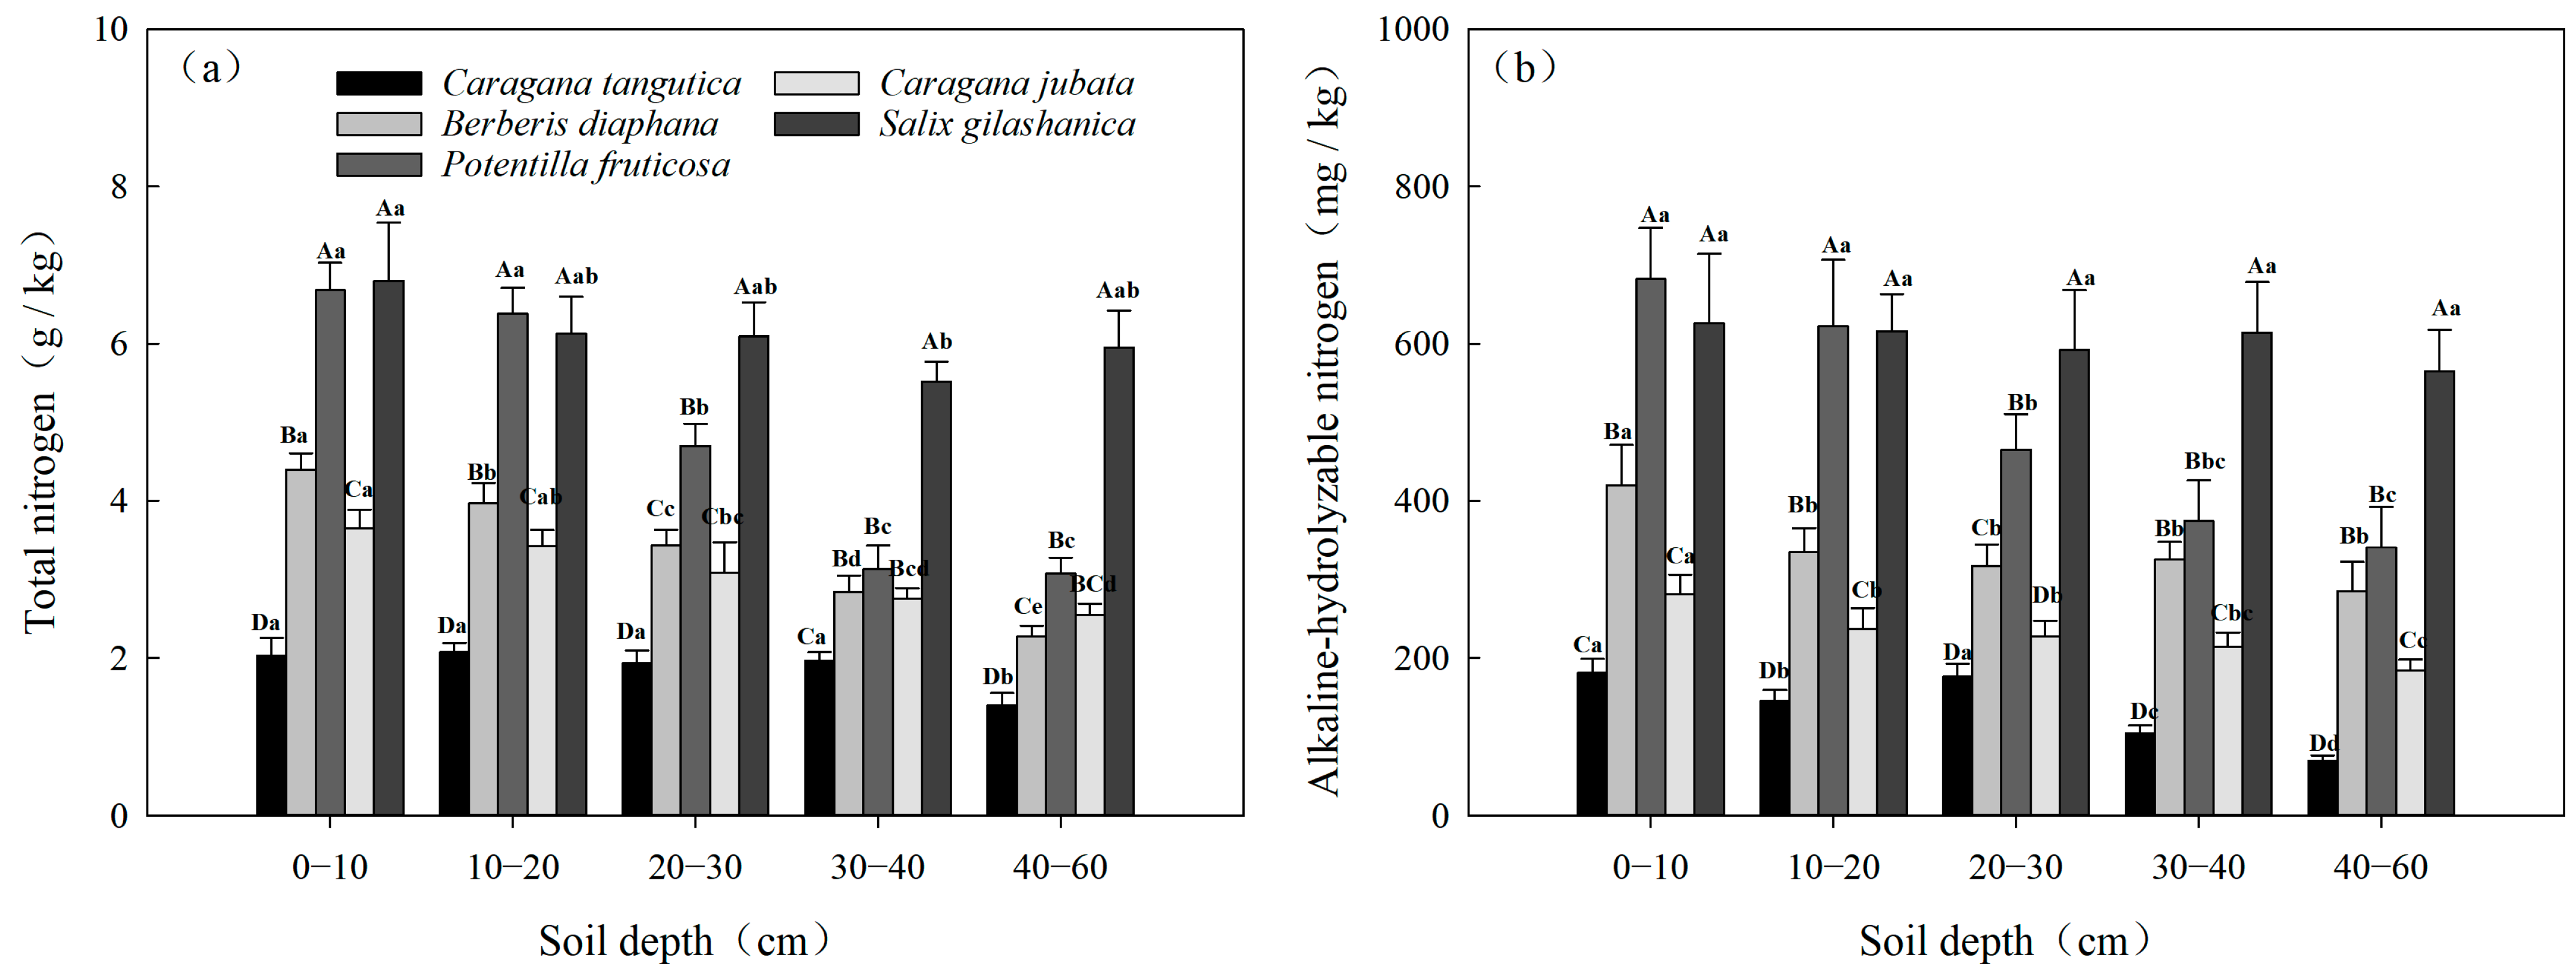
As the soil depth increased, the total nitrogen (TN) content in Caragana tangutica exhibited minor variation. In contrast, the TN content of Berberis diaphana, Potentilla fruticosa, and Caragana jubata showed a decreasing trend. For Salix gilashanica, the TN content decreased first and then increased, with the highest value recorded in the 0–10 cm soil layer and the lowest in the 30–40 cm soil layer (Figure 5a). As the soil depth increased, the AN content of Caragana tangutica in the 0–10 cm soil layer was significantly higher than that recorded in the 30–60 cm soil layer. The AN content of Berberis diaphana and Caragana jubata in the 0–10 cm soil layer was significantly higher than that in the other soil layers. For Potentilla fruticosa, the AN content in the 0–10 cm soil layer was significantly higher than the 20–60 cm soil layers. However, there was no significant difference in the AN content of Salix gilashanica among different soil layers (Figure 5b).

3.2.4. Spatial Variability in TP and AP

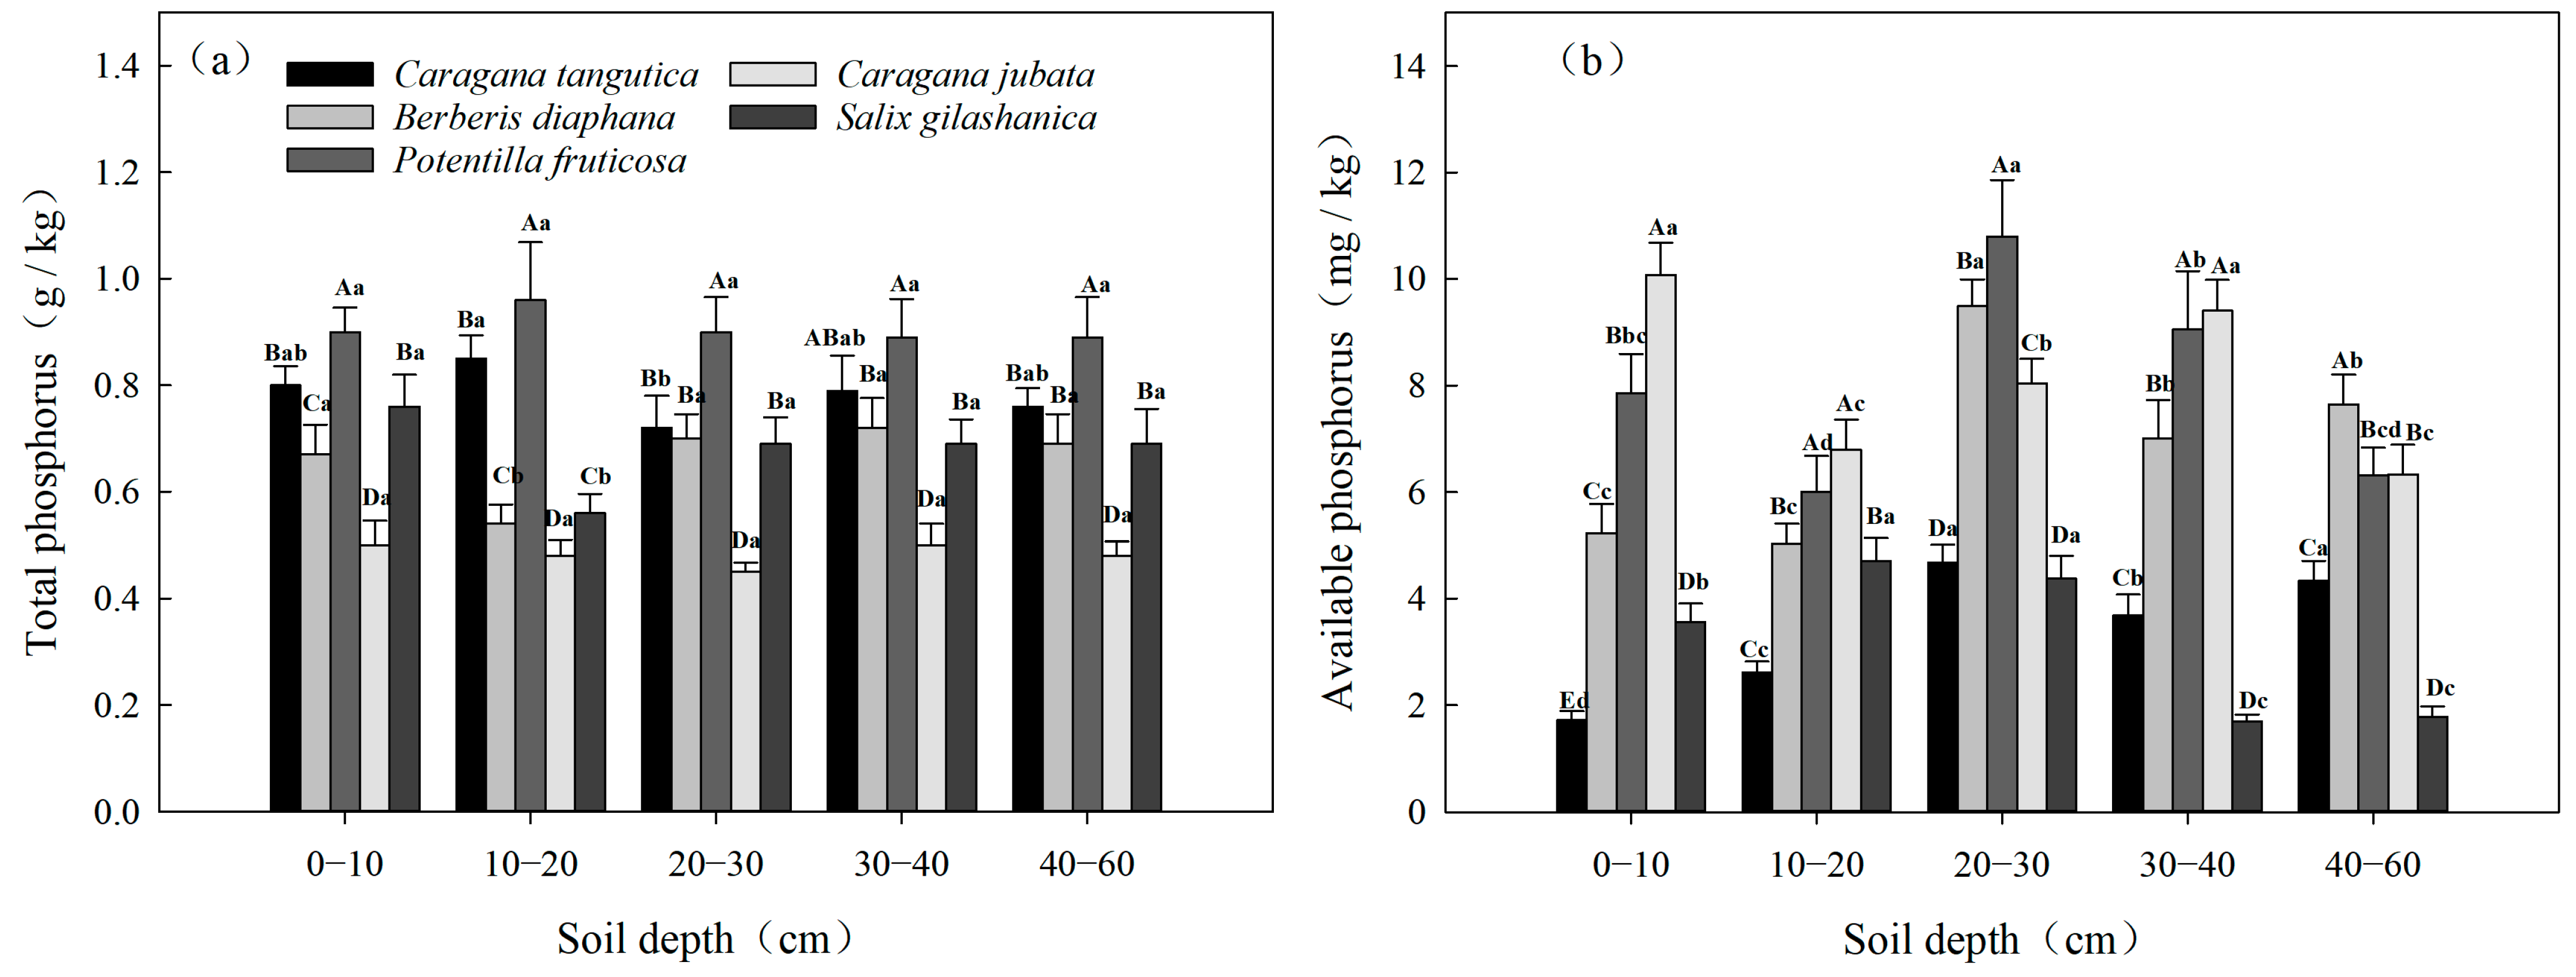
As the soil depth increased, the TP content in Caragana tangutica, Potentilla fruticosa, Caragana jubata, and Salix gilashanica exhibited relatively minor variations. In contrast, the TP content of Berberis diaphana decreased first, then increased, and then decreased, with the highest value recorded in the 30–40 cm soil layer and the lowest in the 10–20 cm soil layer (Figure 6a). As the soil depth increased, the AP content of Caragana tangutica increased first and then decreased; the AP content in the 0–10 cm soil layer was significantly lower than in the other soil layers. The AP content of Berberis diaphana showed a fluctuating upward trend, while it increased first and then decreased in Caragana jubata, showing a decreasing trend. The AP content in Salix gilashanica increased first and then decreased, with the highest value recorded in the 10–20 cm soil layer and the lowest in the 30–40 cm soil layer (Figure 6b).

3.2.5. Spatial Variability in TK and AK

As the soil depth increased, the TK content in Caragana tangutica, Potentilla fruticosa, Caragana jubata, and Salix gilashanica showed a fluctuating trend. In contrast, the TK content of Berberis diaphana decreased gradually. Notably, the TK content in the 0–10 cm soil layer was significantly higher than that in other soil layers (p < 0.05) (Figure 7a). As the soil depth increased, the AK content in Caragana tangutica, Berberis diaphana, and Caragana jubata decreased gradually, and the AK content in the 0–10 cm soil layer was significantly higher than that in other soil layers (p < 0.05). For Potentilla fruticosa and Salix gilashanica, the AK content decreased first and then increased, and the value recorded in the 0–10 cm soil layer was significantly higher than in other soil layers (p < 0.05) (Figure 7b).

3.3. Correlation Analysis of Soil Physicochemical Properties

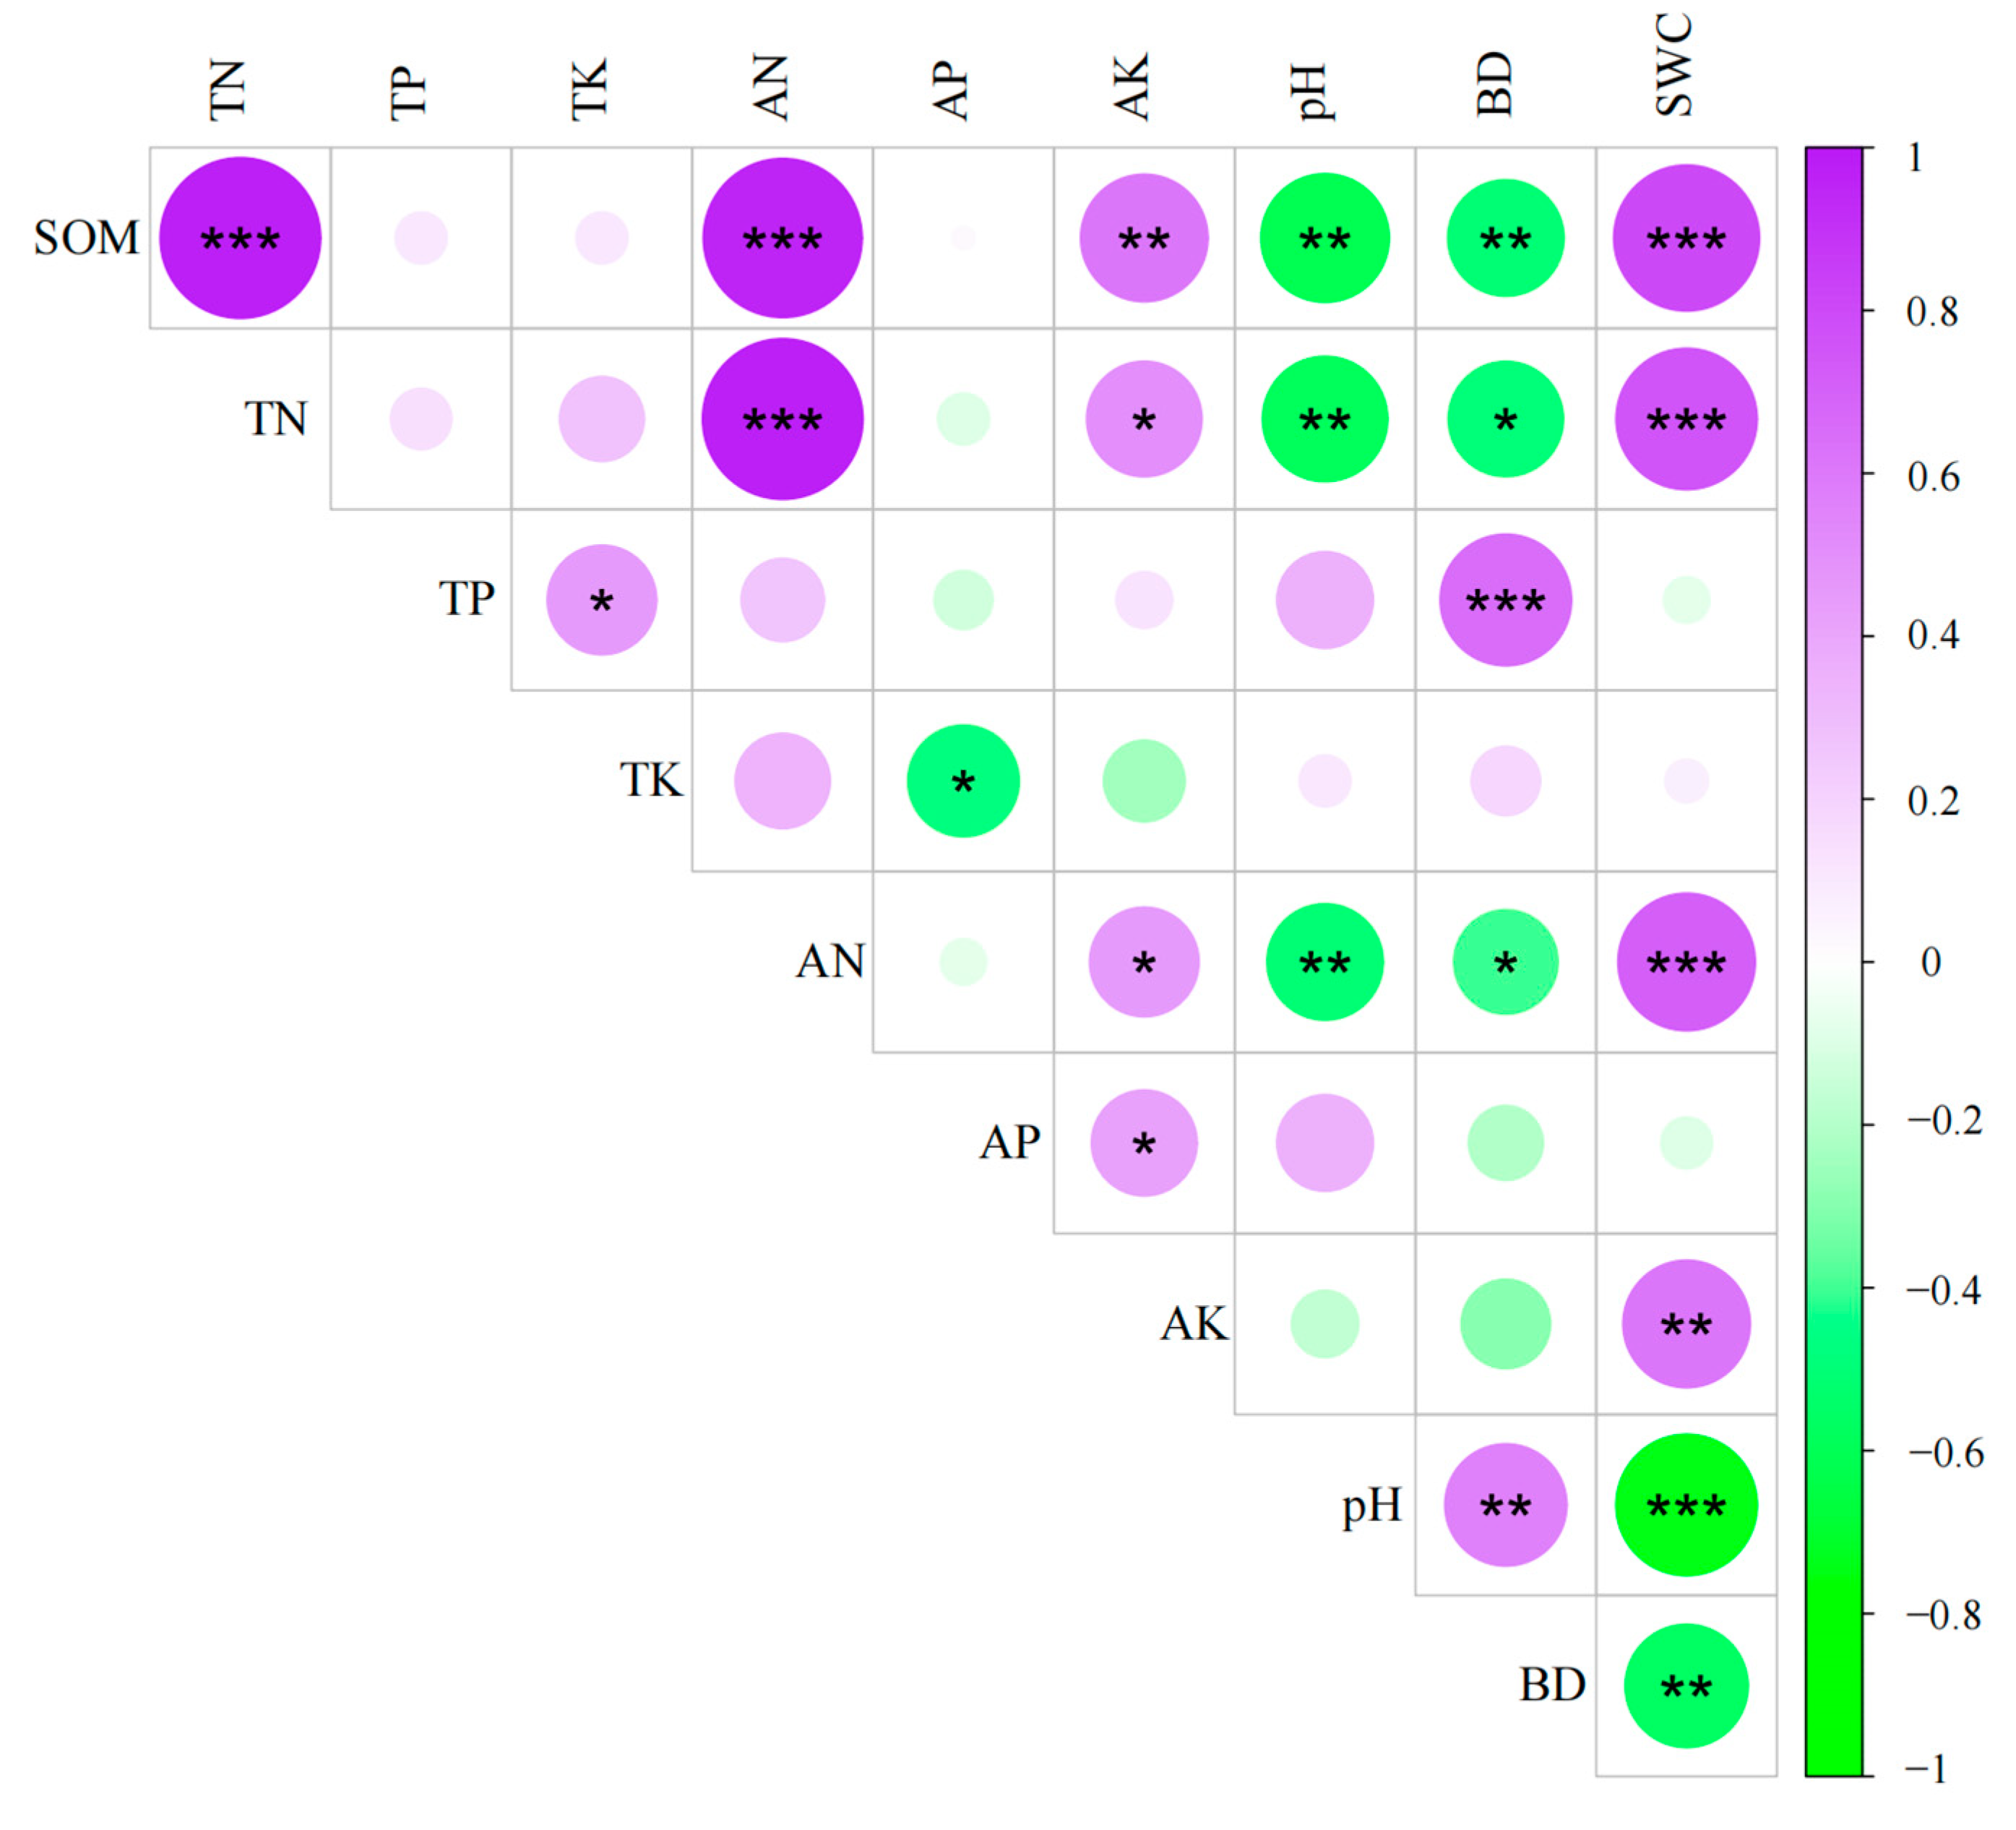
Pearson’s correlation analysis indicated that SOM exhibited a significant positive correlation with TN, AN, and SWC, while it was negatively correlated with pH and BD. TN was positively correlated with AN and AP, as well as with SWC, but negatively correlated with pH and BD. TP exhibited a positive correlation with TK and BD, whereas, TK was only negatively correlated with AP. AN was positively correlated with AK and SWC, but negatively correlated with pH and BD. Additionally, AP was positively correlated with AK, and AK was positively correlated with SWC. Conversely, SWC was negatively correlated with both BD and pH, and pH was negatively correlated with BD as well (Figure 8).

3.4. Principal Component Analysis of Soil Fertility Indicators

Principal component analysis (PCA) was employed to assess the soil fertility indices of shrub ecosystems. According to the criteria of an eigenvalue greater than 1 and a cumulative variance contribution rate exceeding 85%, it was determined that the eigenvalues of the first three principal components were 2.190, 1.480, and 1.260, respectively, with a cumulative contribution rate of 86.00% (Table 3). This result indicates that these three principal components collectively explained 86.00% of the total variability in the original dataset, effectively capturing the variation in soil fertility. Consequently, the first three components were selected for further analysis.
Let Fi represent the i-th evaluation index of soil fertility, while X1, X2, X3, X4, X5, X6, X7, X8, X9, and X10 denote SOM, TN, TP, TK, AN, AP, AK, pH, BD, and SWC, respectively. The expressions for the three principal components are as follows:
F1 = 0.441X1 + 0.431X2 − 0.019X3 + 0.045X4 + 0.412X5 − 0.017X6 + 0.277X7 − 0.334X8 − 0.296X9 + 0.413X10
F2 = 0.064X1 + 0.153X2 + 0.547X3 + 0.551X4 + 0.218X5 − 0.378X6 − 0.14X7 + 0.114X8 + 0.383X9 − 0.034X10
F3 = 0.113X1 + 0.04X2 + 0.397X3 − 0.156X4 + 0.088X5 + 0.573X6 + 0.504X7 + 0.417X8 + 0.192X9 − 0.054X10
The first principal component (F1) captured 48% of the total variance, mainly influenced by soil organic matter (0.441) and nitrogen content (0.431). This finding indicates that these two factors exert a significant impact on soil fertility levels, with higher values generally corresponding to better fertility. For the second principal component (F2), TP and TK exhibited large positive loadings. This suggests that elevated concentrations of these nutrients contribute to an improvement in soil fertility. Similarly, the third principal component (F3) was characterized by substantial positive loadings for AK and AP, indicating their critical role in improving soil fertility (Table 4).
Based on the principal component expressions, we calculated the comprehensive soil fertility index scores for various shrub patches. The order of soil fertility among the shrub patches was Salix gilashanica > Potentilla fruticosa > Berberis diaphana > Caragana jubata > Caragana tangutica (Table 5).

4. Discussion

The content and distribution of soil nutrients reflect the potential of soil to provide nutrients for vegetation and affect the growth and development of vegetation [24,25]. In this study, the mean values of SOM and TN in shrub soils were 77.94 g kg−1 and 3.85 g kg−1, respectively. Compared with the national averages for SOM (33.32 g kg−1) and TN (1.61 g kg−1) [26], the shrub soils in the study area exhibited significantly higher levels. This implies that the water and temperature conditions in the Dayekou Basin of the Qilian Mountains are favorable, thereby resulting in relatively abundant SOM and TN contents. Simultaneously, the low temperature and humid environment lead to low microbial activity in the organic layer. As a result, litter decomposition proceeds slowly, and organic matter accumulates continuously. However, it cannot be excluded that livestock excrement, which contains a large amount of nitrogen, contributes to the increase in soil nitrogen content. The mean TP content in shrub soils was 0.74 g kg−1, which is significantly lower than the global average of 2.8 g kg−1. This is consistent with previous research indicating that soil phosphorus levels in China are generally lower than the global average [27]. This can be ascribed to the fact that the total phosphorus density decreases significantly with the increase in annual average precipitation and annual average temperature. Over the past 25 years, the average temperature in China has shown a significant upward trend, and the change in precipitation also exhibits distinct regional characteristics [28].
In this study, the SOM and TN contents in the five shrub communities exhibited an “inverted pyramid” distribution pattern as the soil layer deepened. This can be attributed to the fact that SOM and N primarily originate from the return of litter. Upon decomposition, litter initially accumulates on the soil surface and subsequently diffuses downward through water or other media. Coupled with the influence of soil microorganisms, animals, and the absorption of plant roots, the SOM and TN contents exhibited a vertical distribution pattern, from high to low, with the deepening of the soil layer. The TP content of the five shrub communities demonstrated minimal variation across different soil layers. This is because soil P is a sedimentary substance, mainly derived from rock differentiation, and is not conducive to migration [27]. Additionally, the shrub soil types in the study area are chestnut soil and alpine meadow soil, and their aluminum and iron oxide contents are relatively high, a condition which has a fixed effect on P, reducing its effectiveness and affecting its cycle. Consequently, the difference in the TP content in each soil layer was relatively small. This also indicated that vegetation type was the primary factor contributing to the variation in total P content in the surface soil [29].
The CV reflects the degree of variability in soil physiochemical properties. According to the classification of Wilding (1985) [30], the degree of variation is divided into weak variation (Cv < 15%), moderate variation (16% < Cv < 35%), and strong variation (Cv > 36%). In this study, the CV of the soil pH value in shrub soils was 9%, indicating weak variability; this finding aligns with previous studies of planted forests in Guangxi [31]. This is because the soil pH value is influenced by the soil biochemical activity and parent material in the study area. The results also showed that soil TK exhibited weak variability, mainly because of the limited mobility of potassium due to dependence on soil characteristics, degree of weathering, and leaching processes [32]. In contrast, SOM and soil nitrogen showed high variability, likely due to their dependence on the decomposition and transformation of litter and plant roots. The large CV for soil phosphorus may be related to the unique environmental conditions of the Qilian Mountains and the growth characteristics of alpine shrub plants, which influence soil nutrient distribution. In contrast, the CV of SOM, TN, and AN were 51%, 44%, and 52%, respectively, indicating strong variability. This was related to the decomposition of litter, the influence of soil microorganisms and animals, and absorption by plant roots.
The relationships between the soil nutrient indicators of the shrubbery were close. This study found that the correlation coefficient between SOM and TN in the shrub community reached 0.87, indicating that the carbon and nitrogen contents in the soil respond in unison to vegetation types and external factors. Then, the significant correlation between total nitrogen and soil organic matter suggests strong microbial-mediated nutrient cycling. The soil fertility index and soil nutrient content in the shrub communities were closely related. Specifically, higher soil nutrient levels were associated with a larger soil fertility index, while lower soil nutrient levels corresponded to a smaller fertility index. Variations in the accumulation of SOM and available nutrients among different communities resulted in different soil fertility [33]. In our study, the soil fertility index of the Salix gilashanica patch was the largest. This can be attributed to the fact that Salix gilashanica grew at an elevation of 3300 m, where hydrothermal conditions were optimal. Here, the vegetation was lush, with abundant litter and high biomass. These factors contributed to increased nutrient return to the soil. Additionally, the relatively undisturbed nature of this area, with minimal human interference, further aided the maintenance of high-quality soil conditions. As a result, the soil within this community demonstrated elevated levels of SOM, TN, and AN. Moreover, the low temperatures at high elevations reduced soil microbial diversity and richness, which inhibited the mineralization and decomposition of organic matter [34]. Although Caragana jubata shrubs also grew at an elevation of 3300 m, the soil layer was thin, with sandstone mainly distributed underneath, making the soil infertile. Moreover, the productivity of the Caragana jubata community was relatively low, resulting in a low nutrient content.
Potentilla fruticosa that grew at an elevation of 2900 m was observed to have a notably higher aboveground biomass compared to other elevations. The higher aboveground biomass in Potentilla fruticosa contributed to greater litter input and soil nutrient enrichment. As the elevation rises, precipitation increases while temperature decreases, creating an ideal hydrothermal environment for soil microbial activity. The higher microbial biomass and activity at the mid-elevation enhanced the decomposition of vegetation litter [35], which contributed to elevated levels of organic matter and nitrogen in the soil [36]. As a result, the soil fertility index was comparatively higher at these elevations.
Our study also revealed that the soil fertility index of the Caragana tangutica patch was the lowest. This is because the Caragana tangutica patch was located at a low altitude, with a large slope, low soil moisture content, low vegetation density, and a small amount of litter, as this could not easily accumulate on the woodland ground due to atmospheric precipitation, grazing, and trampling, and the nutrient accumulation was small. Furthermore, the low vegetation density restricted the quantity of organic matter returned to the soil, leading to meager levels of SOM, TN, and AN. The higher temperatures at this elevation further enhanced soil microbial activity, which consumed significant amounts of nutrients, further depleting soil fertility [37]. Meanwhile, there were also human activities such as grazing in this elevation. Past land use changes, particularly grazing intensity, may have influenced soil nutrient levels and heterogeneity.

5. Conclusions

The soil fertility indicators of different shrub communities in the Dayekou watershed of the Qilian Mountains varied significantly, with differing degrees of variability for each indicator. Among these, the soil pH and TK content exhibited weak variability, the TP content exhibited moderate variability, and other soil fertility indicators showed strong variability. The ranking of soil fertility among the five shrub communities was determined as follows: Salix gilashanica > Potentilla fruticosa > Berberis diaphana > Caragana jubata > Caragana tangutica.
In this study, we investigated the fertility status of five shrub species and analyzed the inter-relationships among soil fertility factors. Nevertheless, future studies should incorporate plant nutrient analysis and long-term monitoring of soil changes, systematically studying the coupling characteristics of plant–soil nutrients in shrub communities and their responses to changes in environmental factors. It is also essential to protect understory shrubs and herbaceous vegetation, minimize human-induced disturbances to low-altitude shrub communities, and promote the progressive succession of vegetation.

Author Contributions

J.M.: writing—original draft, and writing—review and editing. Q.F.: conceptualization and supervision. G.L.: supervision. W.L.: supervision. P.C.: methodology and investigation. N.L.: data curation and software. W.Q.: investigation and data curation. Y.T.: investigation. X.L.: investigation. J.L.: data curation. All authors have read and agreed to the published version of the manuscript.

Funding

This study was jointly funded by the National Natural Science Foundation of China (grants no. 52179026; No. 42201133; no. 42271172; no. 42107494; and no. 32060337) the Longyuan Youth Talent Project of the Gansu Province and the Collaborative Innovation Base Project of Zhangye Academy of Forestry Sciences.

Institutional Review Board Statement

Not applicable.

Data Availability Statement

The original contributions presented in this study are included in the article. Further inquiries can be directed to the corresponding authors.

Conflicts of Interest

The authors declare that the research was conducted in the absence of any commercial or financial relationships that could be construed as potential conflicts of interest.

References

  1. Su, Y.G.; Chen, Y.W.; Padilla, F.M.; Zhang, Y.M.; Huang, G. The influence of biocrusts on the spatial pattern of soil bacterial communities: A case study at landscape and slope scales. Soil Biol. Biochem. 2020, 142, 107721. [Google Scholar] [CrossRef]
  2. Bastida, F.; Zsolnay, A.; Hernández, T.; García, C. Past, present and future of soil quality indices: A biological perspective. Geoderma 2008, 147, 159–171. [Google Scholar] [CrossRef]
  3. Nagati, M.; Roy, M.; Manzi, S.; Richard, F.; Desrochers, A.; Gardes, M.; Bergeron, Y. Impact of local forest composition on soil fungal communities in a mixed boreal forest. Plant Soil 2018, 432, 345–357. [Google Scholar] [CrossRef]
  4. Crawford, K.M.; Bauer, J.T.; Comita, L.S.; Eppinga, M.B.; Johnson, D.J.; Mangan, S.A.; Queenborough, S.A.; Strand, A.E.; Suding, K.N.; Umbanhowar, J.; et al. When and where plant-soil feedback may promote plant coexistence: A meta-analysis. Ecol. Lett. 2019, 22, 1274–1284. [Google Scholar] [CrossRef]
  5. Qiao, L.L.; Li, Y.Z.; Song, Y.H.; Zhai, J.Y.; Wu, Y.; Chen, W.J.; Liu, G.B.; Xue, S. Effects of vegetation restoration on the distribution of nutrients, glomalin-related soil protein, and enzyme activity in soil aggregates on the Loess Plateau, China. Forests 2019, 10, 796. [Google Scholar] [CrossRef]
  6. Wellbrock, N.; Cools, N.; De Vos, B.; Jandl, R.; Lehtonen, A.; Leitgeb, E.; Mäkipää, R.; Pavlenda, P.; Schwärtzel, K.; Šrámek, V. There is a need to better take into account forest soils in the planned soil monitoring law of the european union. Ann. For. Sci. 2024, 81, 22. [Google Scholar] [CrossRef]
  7. Zhang, L.; Tan, C.; Li, W.; Lin, L.; Liao, T.L.; Fan, X.P.; Peng, H.Y.; An, Q.; Liang, Y.C. Phosphorus-, potassium-, and silicon-solubilizing bacteria from forest soils can mobilize soil minerals to promote the growth of rice (Oryza sativa L.). Chem. Biol. Technol. Agric. 2024, 11, 103. [Google Scholar] [CrossRef]
  8. Yu, S.Y.; Liao, Z.H.; Yang, M.W.; Hu, R.H.; Shi, Y.Y.; Zhao, Y.Y. Evaluation of soil fertility quality and environmental driving factors in different soil types of artificial forests. Meteorol. Environ. Res. 2024, 15, 64–70. [Google Scholar]
  9. Nabiollahi, K.; Golmohamadi, F.; Taghizadeh-mehrjardi, R.; Kerry, R.; Davari, M. Assessing the effects of slope gradient and land use change on soil quality degradation through digital mapping of soil quality indices and soil loss rate. Geoderma 2018, 318, 16–28. [Google Scholar] [CrossRef]
  10. Zhu, M.; Feng, Q.; Zhang, M.; Liu, W.; Qin, Y.; Deo, R.C.; Zhang, C. Effects of topography on soil organic carbon stocks in grasslands of a semiarid alpine region, northwestern China. J. Soils Sediments 2019, 19, 640–1650. [Google Scholar] [CrossRef]
  11. Guo, Y.; Abdalla, M.; Espenberg, M.; Hastings, A.; Hallett, P.; Smith, P. A systematic analysis and review of the impacts of afforestation on soil quality indicators as modified by climate zone, forest type and age. Sci. Total Environ. 2020, 757, 143824. [Google Scholar] [CrossRef]
  12. Qian, D.W.; Cao, G.M.; Du, Y.G.; Li, Q.; Guo, X.W. Impacts of climate change and human factors on land cover change in inland mountain protected areas: A case study of the Qilian Mountain National Nature Reserve in China. Environ. Monit. Assess. 2019, 191, 486. [Google Scholar] [CrossRef] [PubMed]
  13. Qi, Y.; Li, S.W.; Ran, Y.H.; Wang, H.W.; Wu, J.C.; Lian, X.H.; Luo, D.L. Mapping frozen ground in the Qilian Mountains in 2004–2019 using Google earth engine cloud computing. Remote. Sens. 2021, 13, 149. [Google Scholar] [CrossRef]
  14. Sun, F.X.; Lyu, Y.H.; Fu, B.J.; Hu, J. Hydrological services by mountain ecosystems in Qilian Mountain of China: A review. Chin. Geogr. Sci. 2016, 26, 174–187. [Google Scholar] [CrossRef]
  15. Wang, Y.; Zhou, L.H.; Yang, G.J.; Guo, R.; Xia, C.Z.; Liu, Y. Performance and obstacle tracking to Natural Forest Resource Protection Project: A rangers’ case of Qilian Mountain, China. Int. J. Environ. Res. Public Health 2020, 17, 5672. [Google Scholar] [CrossRef] [PubMed]
  16. Du, J.; He, Z.B.; Chen, L.F.; Lin, P.F.; Zhu, X.; Tian, Q.Y. Impact of climate change on alpine plant community in Qilian Mountains of China. Int. J. Biometeorol. 2021, 65, 1849–1858. [Google Scholar] [CrossRef]
  17. He, X.L.; Ma, J.; Jin, M.; Li, Z. Characteristics and controls of ecological stoichiometry of shrub leaf in the alpine region of northwest China. Catena 2023, 224, 107005. [Google Scholar] [CrossRef]
  18. Zhao, J.; Adu, B.; Wang, J.; Fan, Y. Assessing Shrub Patch Characteristics and Soil Nutrient Distribution Patterns of Four Typical Alpine Shrub Plants in the Eastern Qilian Mountains. Sustainability 2024, 16, 1547. [Google Scholar] [CrossRef]
  19. Fan, Q.; Yang, Y.; Geng, Y.; Wu, Y.; Niu, Z. Biochemical composition and function of subalpine shrubland and meadow soil microbiomes in the Qilian Mountains, Qinghai–Tibetan plateau, China. PeerJ 2022, 10, e13188. [Google Scholar] [CrossRef] [PubMed]
  20. Zhang, Y.; Jia, W.; Yang, L.; Zhu, G.; Lan, X.; Luo, H.; Yu, Z. Change Characteristics of Soil Organic Carbon and Soil Available Nutrients and Their Relationship in the Subalpine Shrub Zone of Qilian Mountains in China. Sustainability 2023, 15, 13028. [Google Scholar] [CrossRef]
  21. IUSS Working Group. World Reference Base for Soil Resources 2014 International Soil Classification System for Naming Soils and Creating Legends for Soil Maps; FAO: Rome, Italy, 2014. [Google Scholar]
  22. Lu, R.K. Soil Agrochemical Analysis; China Agricultural Science and Technology Press: Beijing, China, 2000. [Google Scholar]
  23. Soil Society of China. Soil Argrochemistry Analysis Protocoes; China Agriculture Science Press: Beijing, China, 1999. (In Chinese) [Google Scholar]
  24. Xu, H.; Qu, Q.; Li, P.; Guo, Z.Q.; Wulan, E.; Xue, S. Stocks and stoichiometry of soil organic carbon, total nitrogen, and total phosphorus after vegetation restoration in the Loess Hilly Region, China. Forests 2019, 10, 27. [Google Scholar] [CrossRef]
  25. Zhang, W.; Liu, W.; Xu, M.; Deng, J.; Han, X.H.; Yang, G.H.; Feng, Y.Z.; Ren, G.G. Response of forest growth to C: N: P stoichiometry in plants and soils during Robinia pseudoacacia afforestation on the Loess Plateau, China. Geoderma 2019, 337, 280–289. [Google Scholar] [CrossRef]
  26. Tian, H.; Chen, G.; Zhang, C.; Melillo, J.M.; Hall, C.A.S. Pattern and variation of C: N: P ratios in China’s soils: A synthesis of observational data. Biogeochemistry 2010, 98, 139–151. [Google Scholar] [CrossRef]
  27. Cheng, M.; An, S.S. Responses of soil nitrogen, phosphorous and organic matter to vegetation succession on the Loess Plateau of China. J. Arid. Land 2015, 7, 216–223. [Google Scholar] [CrossRef]
  28. Tao, W.; Yuanhe, Y.; Wenhong, M. Storage, Patterns and Environmental Controls of Soil Phosphorus in China. Acta Sci. Nat. Univ. Pekin. 2008, 44, 945–952. (In Chinese) [Google Scholar]
  29. Bui, E.-N.; Henderson, B.L. C:N:P stoichiometry in Australian soils with respect to vegetation and environmental factors. Plant Soil 2013, 373, 553–568. [Google Scholar] [CrossRef]
  30. Wilding, L.P. Spatial variability: Its documentation, accomodation and implication to soil surveys. Spatial Variations, 1985.
  31. Herbert, S.J. Spatial variability of nutrient properties in black soil of northeast China. Pedosphere 2007, 17, 19–29. [Google Scholar]
  32. Chapin, F.S.; Matson, P.A.; Mooney, H.A.; Viyousek, P.M. Principles of Terrestrial Ecosystem Ecology; Springer: New York, NY, USA, 2002; pp. 1–447. [Google Scholar]
  33. Gaston, L.; Locke, M.; Zablotowicz, R.; Reddy, K. Spatial variability of soil properties and weed populations in the Mississippi Delta. Soil Sci. Soc. Am. J. 2001, 65, 449–459. [Google Scholar] [CrossRef]
  34. Zhang, Y.; Li, C.; Wang, M. Linkages of C: N: P stoichiometry between soil and leaf and their response to climatic factors along altitudinal gradients. J. Soils Sediments 2019, 19, 1820–1829. [Google Scholar] [CrossRef]
  35. Ren, C.J.; Zhang, W.; Zhong, Z.K.; Han, X.H.; Yang, G.H.; Feng, Y.Z.; Ren, G.X. Differential responses of soil microbial biomass, diversity, and compositions to altitudinal gradients depend on plant and soil characteristics. Sci. Total Environ. 2018, 610–611, 750–758. [Google Scholar] [CrossRef]
  36. He, M.; Zhang, K.; Tan, H.; Hu, R.; Su, J.Q.; Wang, J.; Huang, L.; Zhang, Y.F.; Li, X.R. Nutrient levels within leaves, stems, and roots of the xeric species Reaumuria soongorica in relation to geographical, climatic, and soil conditions. Ecol. Evol. 2015, 5, 1494–1503. [Google Scholar] [CrossRef]
  37. Su, Y.Q.; Wu, Z.L.; Xie, P.Y.; Zhang, L.; Chen, H. Warming effects on topsoil organic carbon and C:N:P stoichiometry in a subtropical forested landscape. Forests 2020, 11, 66. [Google Scholar] [CrossRef]
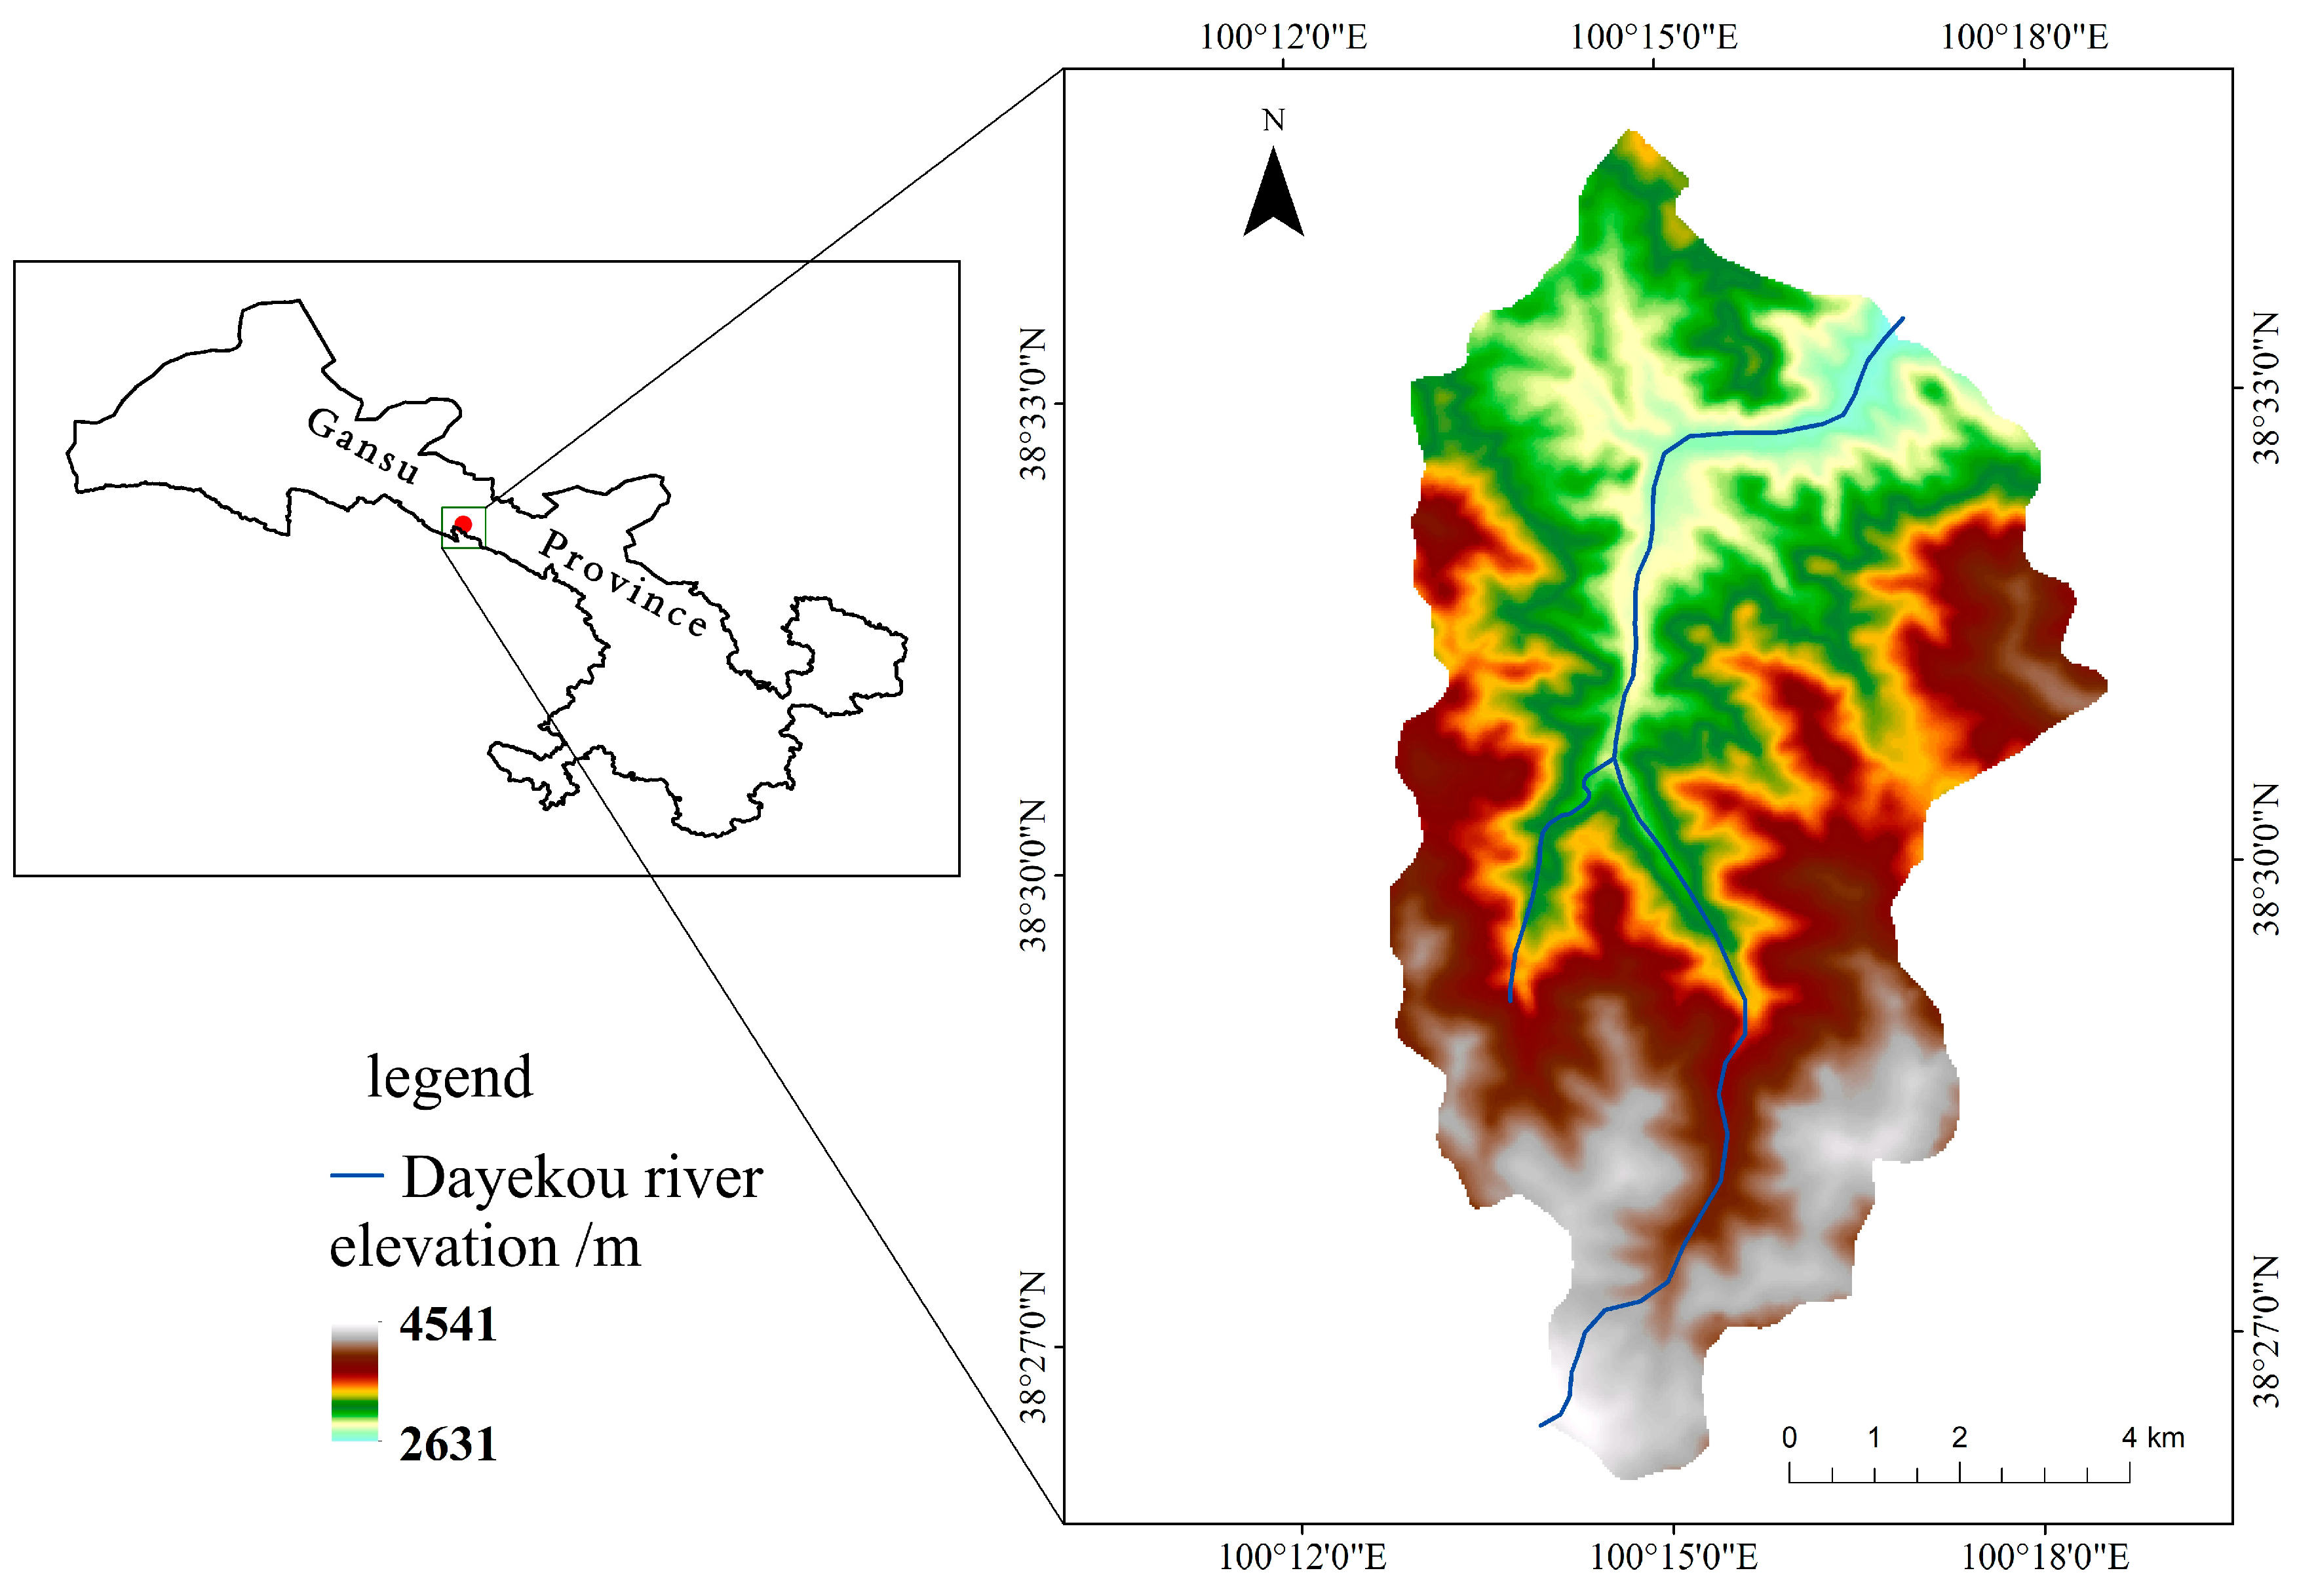
Figure 1. Geographic location of the Dayekou watershed.
Diversity 17 00175 g001
Figure 2. Location of study area and sample plots. Note: No. 1 represents Caragana tangutica, no. 2 represents Berberis diaphana, no. 3 represents Potentilla fruticosa, no. 4 represents Salix gilashanica, and no. 5 represents Caragana jubata.
Diversity 17 00175 g002
Figure 3. Vertical distribution of soil bulk density (a) and soil water content (b) of different shrub types. Different lowercase letters indicate significant difference among different soil layers of the same shrub, while different uppercase letters indicate significant difference among different shrubs of the same soil layer (p < 0.05).
Diversity 17 00175 g003
Figure 4. Vertical distribution of soil organic matter (a) and pH (b) of different shrub types. Different lowercase letters indicate significant difference among different soil layers of the same shrub, while different uppercase letters indicate significant difference among different shrubs of the same soil layer (p < 0.05).
Diversity 17 00175 g004
Figure 5. Vertical distribution of soil total nitrogen (a) and alkaline-hydrolyzable nitrogen (b) of different shrub types.Different lowercase letters indicate significant difference among different soil layers of the same shrub, while different uppercase letters indicate significant difference among different shrubs of the same soil layer (p < 0.05).
Diversity 17 00175 g005
Figure 6. Vertical distribution of soil total phosphorus (a) and available phosphorus (b) of different shrub types. Different lowercase letters indicate significant difference among different soil layers of the same shrub, while different uppercase letters indicate significant difference among different shrubs of the same soil layer (p < 0.05).
Diversity 17 00175 g006
Figure 7. Vertical distribution of soil total potassium (a) and available potassium (b) of different shrub types. Different lowercase letters indicate significant difference among different soil layers of the same shrub, while different uppercase letters indicate significant difference among different shrubs of the same soil layer (p < 0.05).
Diversity 17 00175 g007
Figure 8. Pearson’s correlation heatmap of soil properties. The color intensity represents the strength and direction of the relationships between variables (purple and green colors indicate positive and negative correlations, respectively, whereas light and white colors represent weak and no correlations, respectively). Asterisks indicate statistical significance (* p < 0.05; ** p < 0.01; and *** p < 0.001).
Diversity 17 00175 g008
Table 1. Basic information on sampling plots.
Vegetation TypeSoil Depth
(cm)
Soil TypeElevation
(m)
Slope Gradient
(°)
Slope Aspect
(°)
Growth StatusBasal Diameter
(mm)
Coverage
(%)
Average Height
(m)
Caragana jubata60Alpine meadow soil330040NEAverage growth20600.60
Salix gilashanica60Alpine meadow soil330032NEGood growth26551.40
Potentilla fruticosa60Alpine meadow soil290033EOptimal growth16900.90
Berberis diaphana60Chestnut soil260030WAverage growth20701.80
Caragana tangutica60Chestnut soil260022SWAverage growth25501.40
Table 2. Characteristics of soil physiochemical properties in shrub patches (0–60 cm). Different lowercase letters indicate significant differences between soils associated with different vegetation types (p < 0.05).
Vegetation TypeSWC (%)BD
(g·cm−3)
pHSOM
(g·kg−1)
TN
(g·kg−1)
TP
(g·kg−1)
TK
(g·kg−1)
AN
(mg·kg−1)
AP
(mg·kg−1)
AK
(mg·kg−1)
Caragana tangutica16.79 c0.90 a8.45 a23.69 c1.88 d0.78 b14.15 ab135.00 c3.41 b52.74 c
Berberis diaphana23.27 c0.49 c8.54 a59.85 b3.38 bc0.66 c14.78 a336.40 b6.88 a59.72 c
Potentilla fruticosa61.00 b0.72 b8.38 a106.97 a4.79 ab0.91 a13.56 b496.60 a8.01 a192.96 a
Caragana jubata57.92 b0.39 c7.72 b70.01 b3.09 cd0.48 d11.40 c228.60 bc8.13 a151.60 ab
Salix gilashanica116.49 a0.40 c6.64 c129.18 a6.10 a0.68 c14.48 ab602.60 a3.22 b122.20 b
Mean value55.090.587.9577.943.850.7013.67359.845.93115.84
Standard deviation41.270.230.7540.131.710.151.42187.892.6865.48
Variable coefficient %0.750.390.090.510.440.220.100.520.450.57
Note: The different lowercase letters in the table indicate that there are significant differences in the soil physiochemical index among different shrubs (p < 0.05).
Table 3. Total variance analysis table of principal component analysis.
Principal ComponentsInitial EigenvalueSum of Square Loadings
EigenvalueContribution Rate %Cumulative Contribution Rate %EigenvalueContribution Rate %Cumulative Contribution Rate %
12.19048.00048.0002.19048.00048.000
21.48022.00070.0001.48022.00070.000
31.26016.00086.0001.26016.00086.000
40.8276.80092.600
50.6243.90096.500
60.4231.80098.300
70.3070.94099.200
80.2370.56099.760
90.1420.20099.960
100.0600.035100.000
Table 4. Score coefficient matrix of the first three principal components.
IndicatorsPrincipal Component
F1F2F3
SOM (X1)0.4410.0640.113
TN (X2)0.4310.1530.040
TP (X3)−0.0190.5470.397
TK (X4)0.0450.551−0.156
AN (X5)0.4120.2180.088
AP (X6)−0.017−0.3780.573
AK (X7)0.277−0.1400.504
pH (X8)−0.3340.1140.417
BD (X9)−0.2960.3830.192
SWC (X10)0.413−0.034−0.054
Table 5. Comprehensive scores of soil fertility in different shrub communities.
Shrub CommunityF1F2F3Comprehensive ScoresAverage ScoresRank
Salix gilashanica4.4800.819−1.0962.5051.7091
3.3760.096−1.4011.647
2.8500.232−1.1021.444
2.5750.863−1.7731.328
2.8991.042−1.4241.620
Potentilla fruticosa2.5141.1132.1902.0941.0822
1.7331.6362.1001.776
0.6510.3572.6300.943
−0.2800.3872.2310.357
−0.4410.7311.6150.241
Berberis diaphana−0.0190.628−0.4400.069−0.5973
−0.729−0.024−1.033−0.604
−1.236−0.0100.460−0.606
−1.4670.183−0.074−0.785
−1.839−0.062−0.087−1.057
Caragana jubata1.372−3.1161.4440.232−0.7474
0.468−2.190−0.196−0.338
−0.094−2.834−0.195−0.817
−1.018−2.9320.074−1.307
−1.221−2.473−1.006−1.503
Caragana tangutica−2.6071.630−0.774−1.178−1.4485
−3.0582.199−0.402−1.214
−2.9350.855−0.339−1.480
−0.0351.302−0.700−1.488
−2.938−0.432−0.703−1.880
Disclaimer/Publisher’s Note: The statements, opinions and data contained in all publications are solely those of the individual author(s) and contributor(s) and not of MDPI and/or the editor(s). MDPI and/or the editor(s) disclaim responsibility for any injury to people or property resulting from any ideas, methods, instructions or products referred to in the content.