Article

Lepidopteran Biodiversity in Madagascar’s Eastern Forests: Assessing Species Distribution Across Protected and Anthropized Landscapes

by
Robin Hannoteau
1,
Finaritra Antra Tia Ravalison
2,
Brayan Fenontsoa Randrianarivelo
2,
Andrianjaka Ravelomanana
2,
Naya Trolin
1,
Rudy Caparros Megido
1,
Arnaud Segers
1,
Frédéric Francis
1 and
Grégoire Noël
1,*
1
Laboratory of Functional and Evolutionary Entomology, University of Liège, Gembloux Agro-Bio Tech, 5030 Gembloux, Belgium
2
Department of Entomology Mention E-CES, Faculty of Science, University of Antananarivo, Antananarivo 101, Madagascar
*
Author to whom correspondence should be addressed.
Diversity 2025, 17(2), 95; https://doi.org/10.3390/d17020095
Submission received: 21 December 2024 / Revised: 18 January 2025 / Accepted: 21 January 2025 / Published: 28 January 2025
(This article belongs to the Special Issue Biogeography and Diversity of Butterflies and Moths)

Abstract

:
Madagascar, renowned for its unique biodiversity, faces significant environmental threats. Despite their vital ecosystem services, invertebrates, such as Lepidoptera, remain understudied, especially within the Malagasy Island. Indeed, butterflies and moths often serve as biodiversity indicators. This study investigates lepidopteran community structure across different habitat types: protected areas and anthropized areas, represented by forest edges and agroforestry through four expeditions to Madagascar’s moist eastern forests. Both sampling methods were employed including butterfly nets and fermented fruit-baited traps. While nets accounted for 90% of captures, highlighting operator bias, bait traps captured unique species, emphasizing the complementarity of these methods. With over 891 captured specimens, 418 macrolepidopterans were identified at the species level for a total of 50 species. Protected forests hosted 80% of endemic Lepidoptera reliant on specialized ecological niches, while anthropized zones were dominated by common generalist species which are resilient to habitat changes. While the species richness and composition of sampled microlepidoptera are similar, habitat fragmentation created diverse environmental conditions, hosting specific populations. Conservation challenges persist, particularly for endemic species vulnerable to poaching. It is crucial to continue sampling Madagascar’s lepidofauna, as this offers considerable potential for the sustainable maintenance of ecosystems and the long-term preservation of biodiversity of the Malagasy Island.

1. Introduction

Madagascar is recognized as a biodiversity hotspot with exceptional species endemism due to its long geological isolation [1,2]. Covering over 587,000 square kilometers, the island harbors various ecosystems, ranging from humid tropical forests in the East, to dry deciduous forests and thorny bushland in the West and South [3,4]. These ecosystems host many endemic species, particularly within the order Lepidoptera [5].
The importance of Malagasy’s butterfly and moth diversity is underscored by their role in maintaining the ecological balance [6]. The most recent estimate of Malagasy-described butterfly species was around 340 [7]. However, limited information regarding their biology is available due to a lack of specialists. Indeed, more studies are required for understanding Malagasy macrolepidoptera diversity, as this taxonomic group not only contributes to the pollination of plants but also serves as a food source for other animals [8]. Their sensitivity to habitat changes makes them ideal subjects for studies aiming to understand the impact of human activities on the environment [9,10,11]. While butterflies and moths are often seen as an aesthetic representation of nature, their presence and diversity can provide critical insights into ecosystem health and the effects of anthropogenic disturbances [12,13].
Despite its rich natural heritage, Madagascar faces severe environmental threats, including deforestation, habitat fragmentation, and land-use changes driven by agricultural expansion [14,15,16]. These pressures are particularly evident in Madagascar’s eastern rainforests, which have experienced a significant decline in forest cover over the past few decades [17,18]. The fragmentation of forested areas is altering the habitat of many lepidopteran species, which potentially affect their population dynamics and distribution patterns [9,10].
Furthermore, the world trade of macrolepidoptera poses an additional and significant threat, with an underestimated market value of USD$100 million annually [19,20]. This trade is fueled by collectors and the high demand for rare species, often sold at elevated prices due to their conservation status [21]. Butterflies and moths designated as “threatened” or “endangered” by the IUCN are primarily targeted [22], and this demand exacerbates the pressure on their populations. Among the Malagasy species affected by illegal trade are: Charaxes spp., Chrysiridia spp., Hypolimnas spp. and Argema spp. (Andrianjaka Ravelomanana, personal communication). These species have become increasingly difficult to observe in their natural habitats, making them rare in the wild [23]. The primary cause of this rarity is the ongoing destruction of their natural habitats. Additionally, the lack of specialists and limited interest in these taxa have resulted in a scarcity of published data. However, common species, such as pioneer taxa like Papilio sp. or Heteropsis sp., have been relatively well studied and are often used for ecological monitoring [24]. The number of species considered at risk may increase as studies reflect more accurately on the current state of habitat fragmentation and its impact on biodiversity [20,25].
This study aims to assess macrolepidoptera diversity in Madagascar across protected areas and anthropized landscapes, including forest edges and agroforestry zones. Previous research has demonstrated that lepidopteran communities are susceptible to the structure of their habitats [10,26]. In protected areas, lepidopteran assemblages are often dominated by endemic species adapted to specialized ecological niches, whereas anthropized zones tend to support more generalist and resilient species capable of thriving in disturbed environments [5,27]. Fragmented landscapes may even provide new niches for certain species, allowing some butterflies or moths to exploit different ecological conditions created by human activities [28]. To better understand these dynamics, we conducted a series of field sampling in Madagascar’s eastern forests (Figure 1). The sampling of lepidopteran community was performed in a gradient of anthropized ecosystems, ranging from untouched forests to areas heavily influenced by human activity [29,30,31]. In addition to documenting species richness, we analyzed the frequency of endemic versus non-endemic species across different landscape types. Previous studies have shown that protected forests tend to harbor more endemic species. In contrast, disturbed habitats, such as agroforestry areas, are more likely inhabited by widespread, generalist species [5,10,25]. By comparing these findings across the landscape modalities, we aim to quantify the impact of land-use changes on macrolepidoptera biodiversity [32,33].

2. Materials and Methods
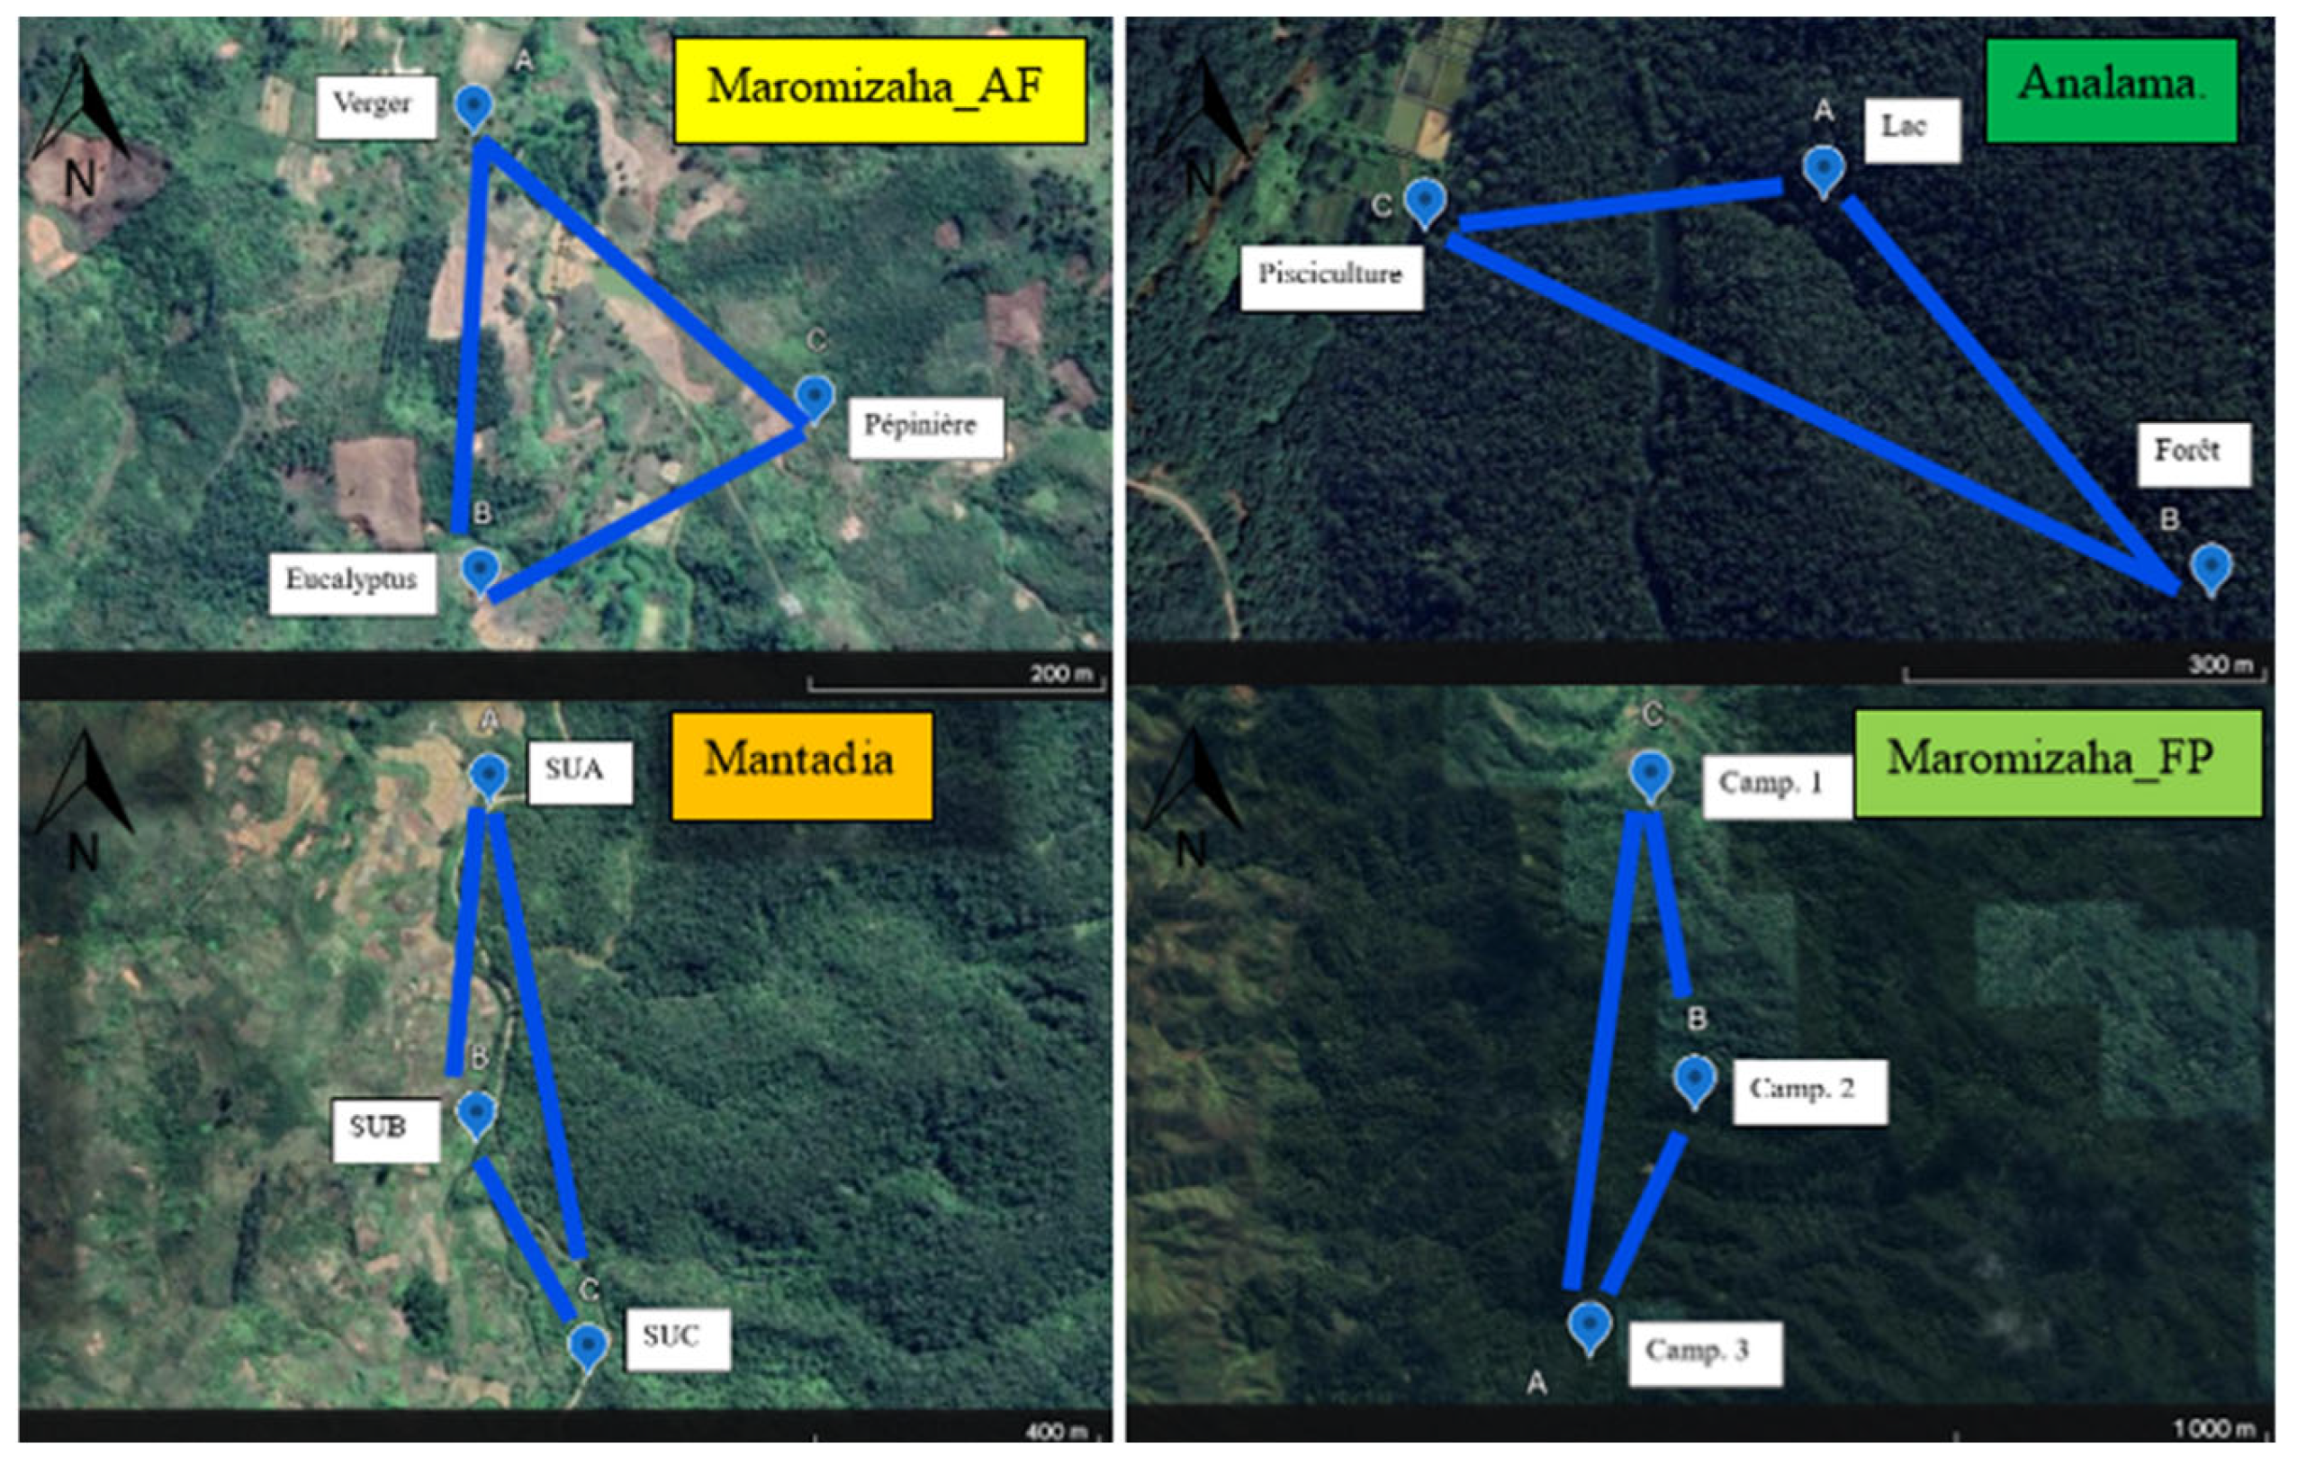
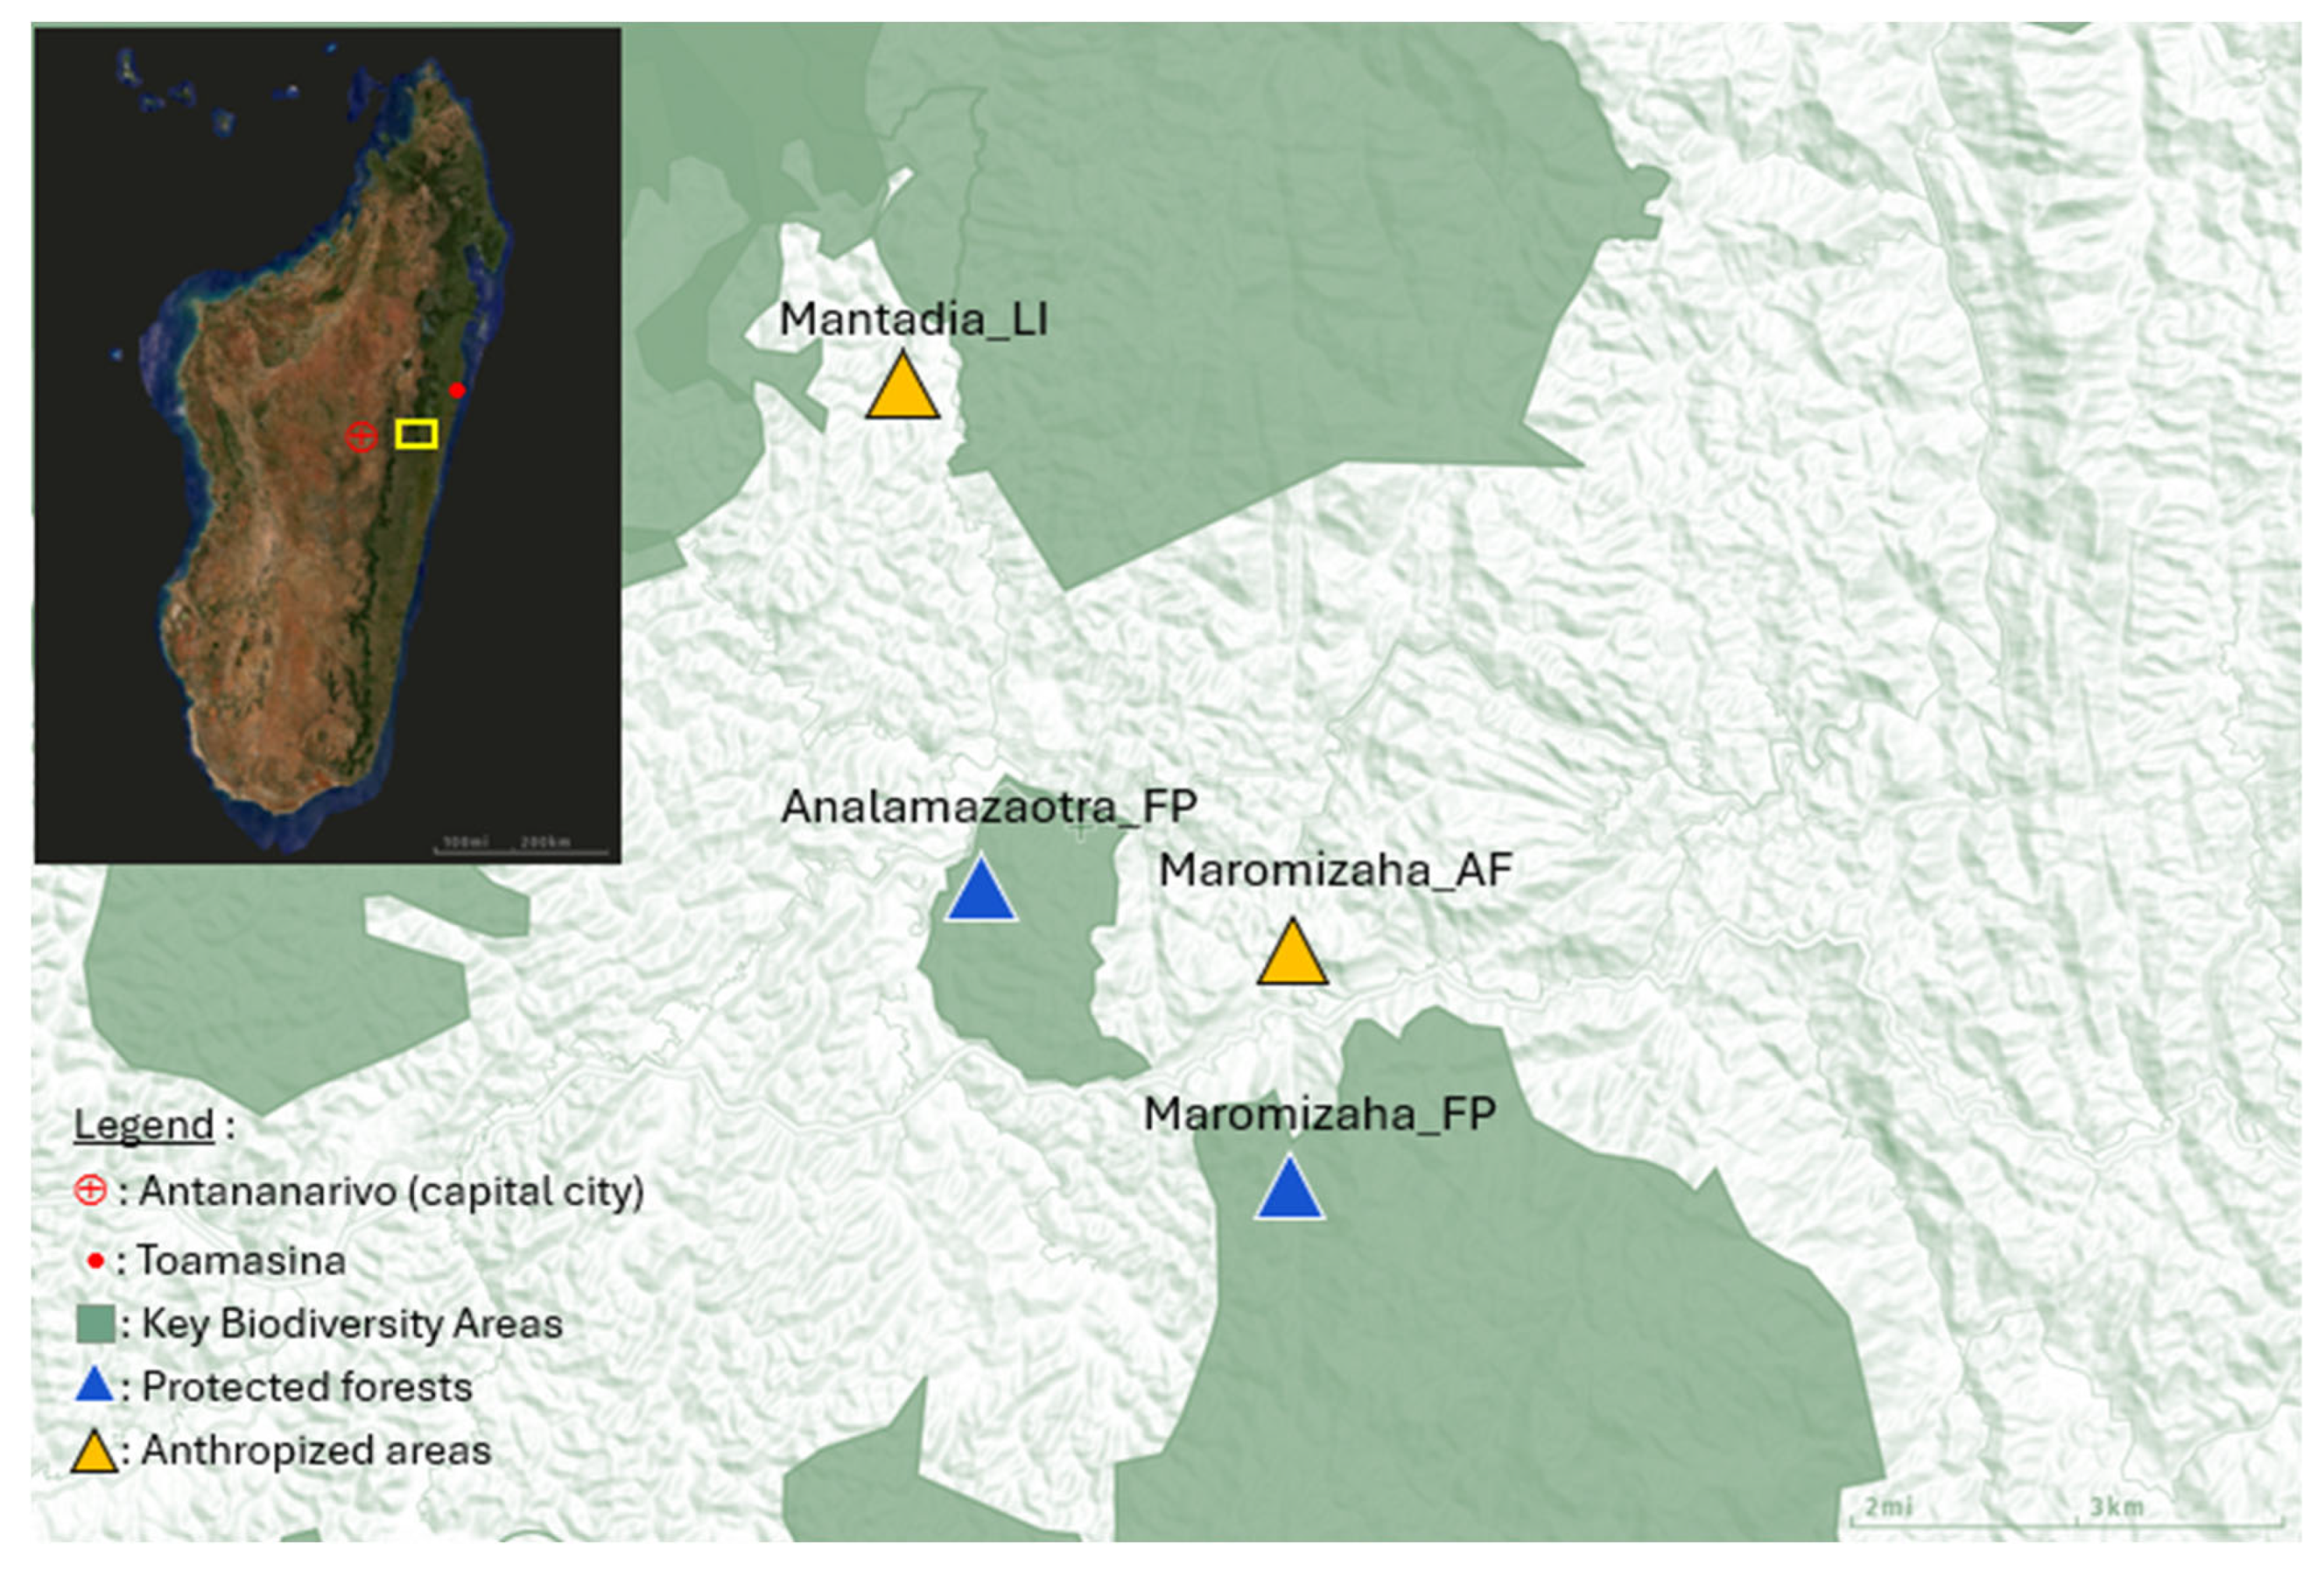
2.1. Study Area

The Andasibe region, located 150 km from the capital Antananarivo and 200 km from Toamasina, is part of the Alaotra-Mangoro region in the Toamasina province (Figure 1). It comprises fragments of mid-altitude, dense, humid evergreen forests (800 to 1200 m) [18] and is renowned for its high biodiversity and endemic species [28]. Established in 1989, Mantadia National Park spans 15,480 ha, with 80% of primary forests. The forest edge of Mantadia, influenced by agricultural expansion, was classified as an anthropized site in this study, i.e., Mantadia_LI (Figure 1). The adjacent Special Reserve of Analamazaotra (Analamazaotra_FP; Figure 1), covering 810 ha, is a protected forest site. The Maromizaha Reserve, managed by the Group for Study and Research on Primates of Madagascar, encompasses 1880 ha and includes a protected forest area and an agroforestry zone. Sampling was conducted in both zones, with the agroforestry zone categorized as an anthropized site (Maromizaha_AF; Figure 1) and the protected forest as a protected forest site (Maromizaha_FP; Figure 1), enabling comparison of lepidopteran distribution between anthropized and protected areas.

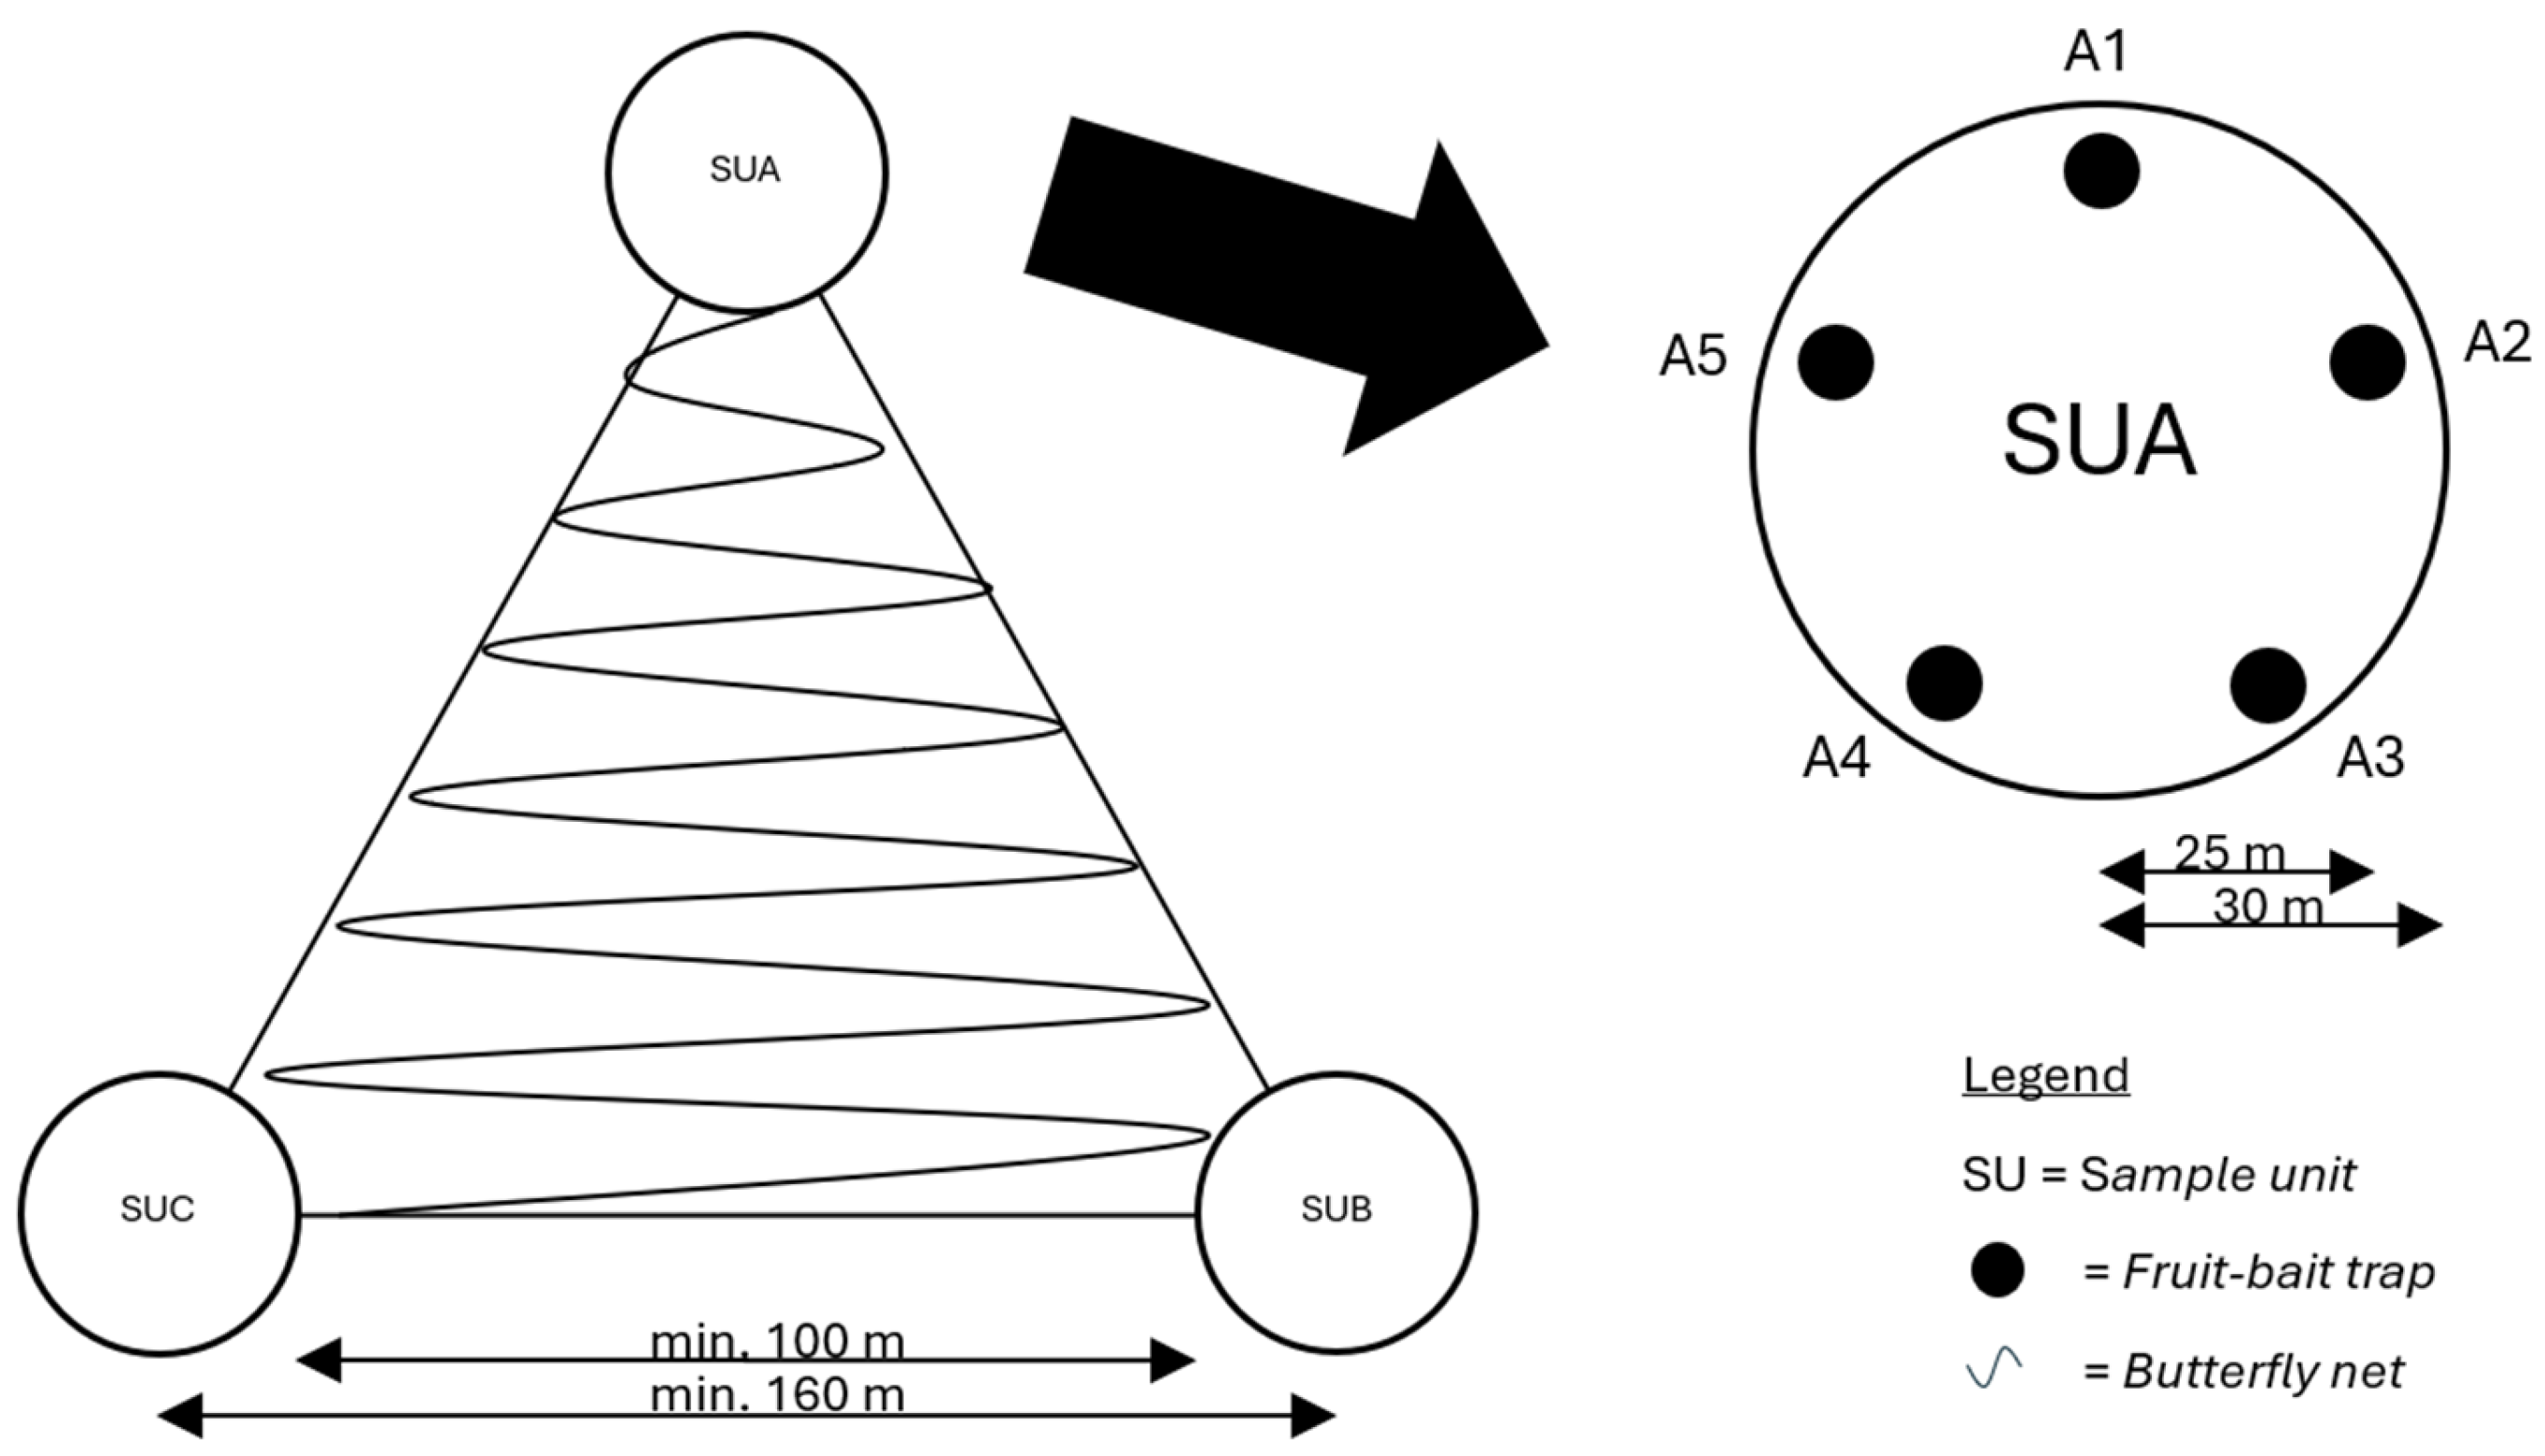
2.2. Sampling Design

Sampling took place over three days at each site, in March and April 2024: from 6th to 9th March for Maromizaha_AF, from 11st to 14th March for Analamazaotra_FP, from 18th to 21st April for Mantadia_LI, and from 22nd April to 25th April for Maromizaha_FP. A triangular sampling framework was designed to sample lepidopteran communities in the field in each of the four sampling sites according to the land conditions (Figure 2; Figure A1). Each vertex of the triangle corresponds to a sampling unit (SU) with a radius of 30 m called “SUA”, “SUB”, and “SUC” (Figure 2). The three sample units were selected based on the characteristics of the sites and localities known by local forest agents. Each zone reflected distinct features (Figure A1): Maromizaha_AF included an orchard, forest edge, and bamboo nursery; Analamazaotra_FP covered a lake border, dense forests, and a near fish farm; Mantadia_LI is located along the road near the protected park boundary; and Maromizaha_FP corresponded to campsites established within the forest. All micro-habitat specificities were not considered, and the triangular sampling framework is treated as homogeneous. According to Freitas and colleagues (2021) [12], a minimum distance of 100 m is maintained between each sampling unit to ensure the independence of the sampling zones (Figure 2). Butterfly netting is conducted within the bounds of this triangular configuration (Figure 2). In addition, each sampling zone is equipped with five fruit-baited traps, strategically placed approximately 25 m from the unit’s center (Figure 2).

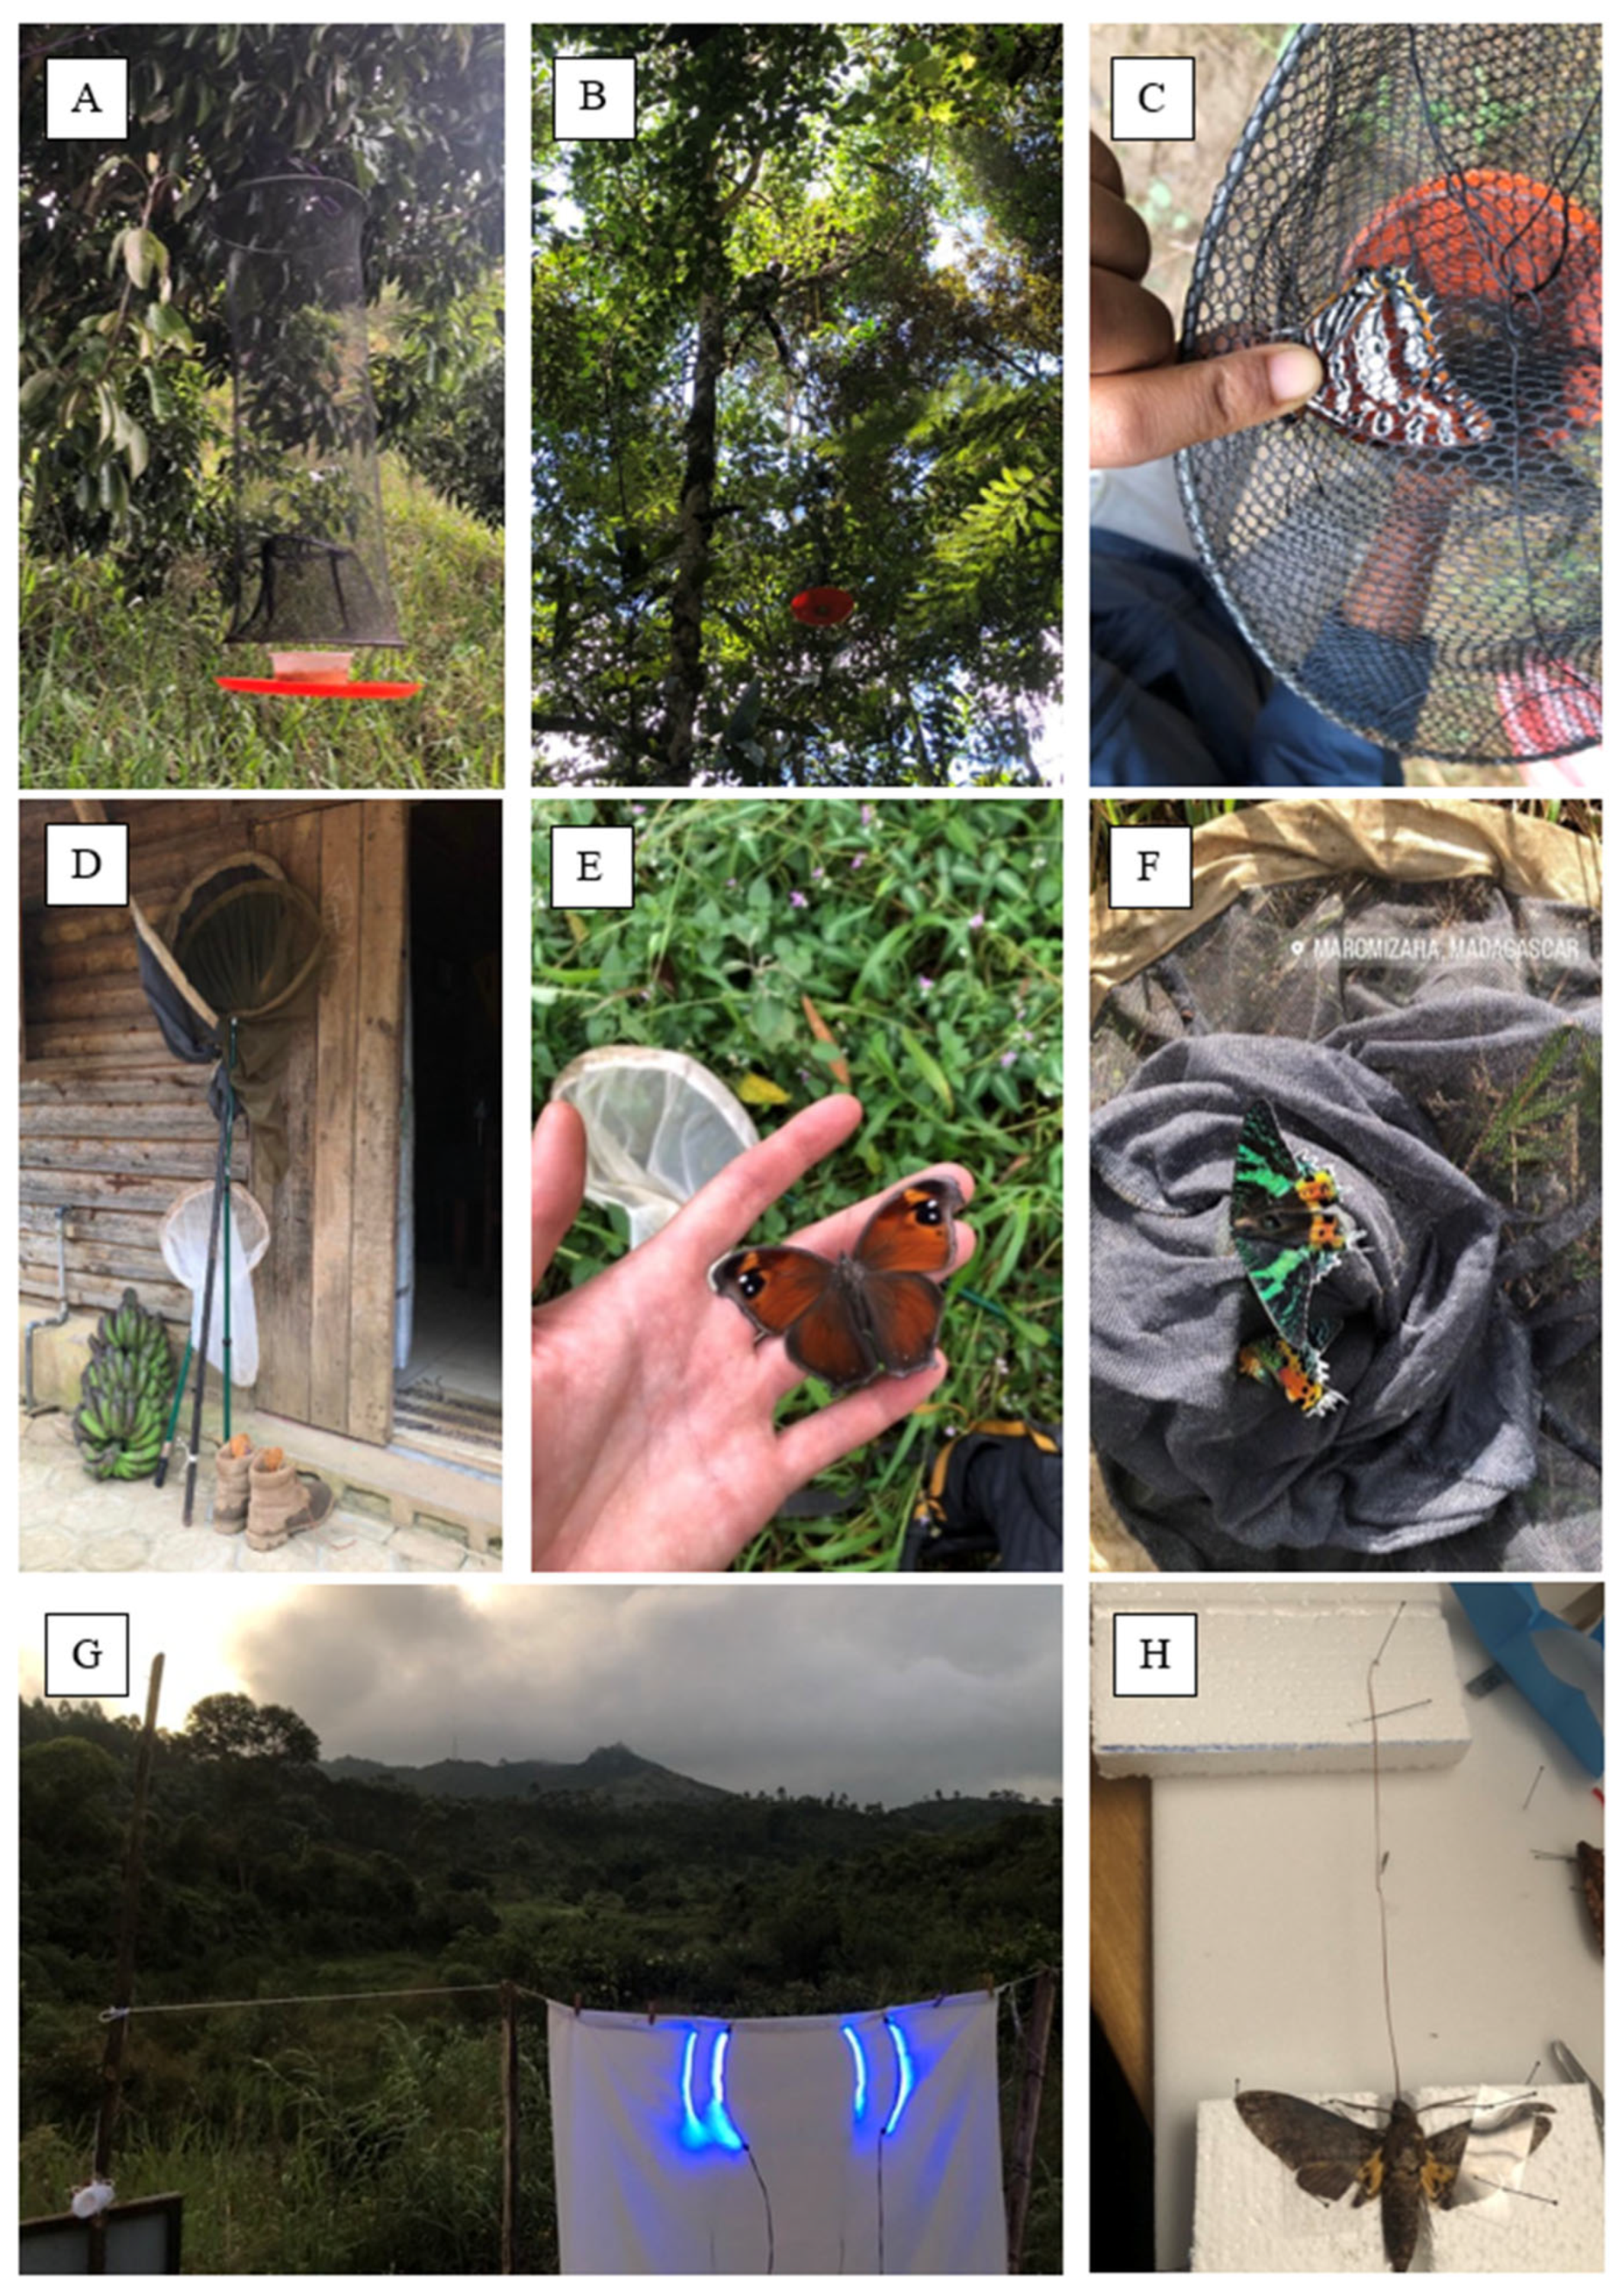
2.2.1. Fruit-Baited Traps

Fifteen traps were constructed based on the Van Someren-Rydon model as described by Devries and colleagues (2016) [29]. Each trap consists of a cylindrical netting structure, 80 cm high and 30 cm in diameter, with an inverted funnel opening of 25 cm at the bottom to allow large butterflies or moths to enter. A plastic plate (40 cm in diameter) is suspended 5 cm below the trap to facilitate lepidopteran landing. A container with fermented bait, consisting of two bananas mixed with beer and left to ferment for 48 h, was secured inside each trap. Traps were lifted to a minimum height of 3 m to capture both canopy and understory species and were checked twice daily, in the morning and afternoon (Figure 3A–C).

2.2.2. Butterfly Netting

Standardized net captures were conducted every morning and afternoon under ideal conditions (no rain and low wind) by walking a fixed path for three hours at a constant pace, capturing butterflies within a 5 × 5 × 5 m3 area (Figure 3D–F).

2.2.3. Light Sheet

Targeting silk-producing moths and Sphingidae, an adapted UV-light trap device from Segers (2018) [34] consisting of a 2 m2 white sheet and is suspended with four UV LED lights (395–405 nm) powered by 12 V batteries (Figure 3G,H). The light trap was set from 6 to 9 PM each sampling day, with moths recorded every half hour.

2.3. Specimen Preparation and Identification

Each specimen was killed using ethyl acetate (C4H8O2) with cotton after collection netting on the field. The captured specimens were then preserved in paper envelopes for butterfly and stored in an airtight box with silica gel to prevent tropical mold before laboratory insect preparation. After the collection sampling, specimens were rehydrated for 24 h in an airtight box, over water vapour and denatured ethanol (EtOH at 90°) to prevent mold. Lepidoptera specimens were pinned and vouchered in collection boxes at the entomology collection of the University of Antananarivo and Zà Bibikely Insectarium in Madagascar.
Firstly, pinned specimens were morphologically identified using the species description of Collins and Congdon (2017) [35]. Then, a taxonomic revision was conducted using the illustrated key of Beccaloni and colleagues (2024) [36]. Despite their significance and richness for studies on adaptability and endemism, the Hesperiidae and Lycaenidae families were not further identified to the species levels given the lack of our taxonomic expertise, no precise identification keys or reference collection. Therefore, they were excluded of the dataset. Endemism and habitat guild of our identified lepidopteran species were determined using Lees & Minet (2003) [25]:
  • Forest species: Species depending on the woodlands (all-natural types, primary or slightly degraded), secondary formations, and forest edges (including Savona, tavy, and other types of cleared forests, typically for hillside rice).
  • Generalist species: Species found in all the above habitats, marshes, grasslands, anthropogenic zones (villages, roadsides), rocky areas (rocky outcrops, ridges with rupicolous vegetation), farmlands, and beaches.
According to Mendenhall et al., (2016), we used 50% threshold to determine the species dependence for a habitat type [37].

2.4. Statistical Community Analysis

Analyses were conducted in RStudio with R version 4.4.0 [38]. The following statistical analysis focused exclusively on lepidopteran identified to the most specific taxonomic rank, at the species level. Community structure was assessed at three levels: (i) regional capture (γ-diversity); (ii) community diversity according to the different landscape (α-diversity); and (iii) the dissimilarity of the community composition (β-diversity) [39].
Community analysis quantified species richness and diversity metrics. Metrics included species abundance, richness, and non-parametric Chao’s bias-corrected index (i.e., Chao1). Chao’s bias-corrected [40] was estimated using “estimateR” function in the vegan package [41] to predict the “true” number of species in a community based on our community matrix. The structure of the same sampled communities was evaluated by considering the abundance of individuals and a sequence of Hill numbers [42] to compare alpha diversity estimations according to our habitat type using iNEXT R package [43]. Studies proposed a unified framework regarding Hill numbers extended from works based on rarefaction and extrapolation (R/E) sampling curve for species richness and sample completeness [44]. Each Hill number corresponds to a diversity order q, which defines species diversity measures as a particular feature: observed species richness (q = 0), the exponential of the Shannon entropy (q = 1) and the inverse Simpson concentration index (q = 2) [44]. R/E curves were built specifying 100 bootstrap replications on individual-based abundance data of our lepidopteran datasets.
In our β analysis, the permutational analysis of variance (PERMANOVA) test assesses whether lepidopteran communities from habitat type and sampling method are (dis-) similar. To display of the lepidopteran community composition, Bray-Curtis dissimilarity matrix was computed and Principal Coordinates Analysis (PCoA) was used to visualize habitat type proximity in terms of species assemblages [41].
To determine if the proportion of the different species traits varied according to the habitat type, a G-test of independence for the contingency table was performed using the RVAideMemoire package in R (Herve 2020) [45].

3. Results

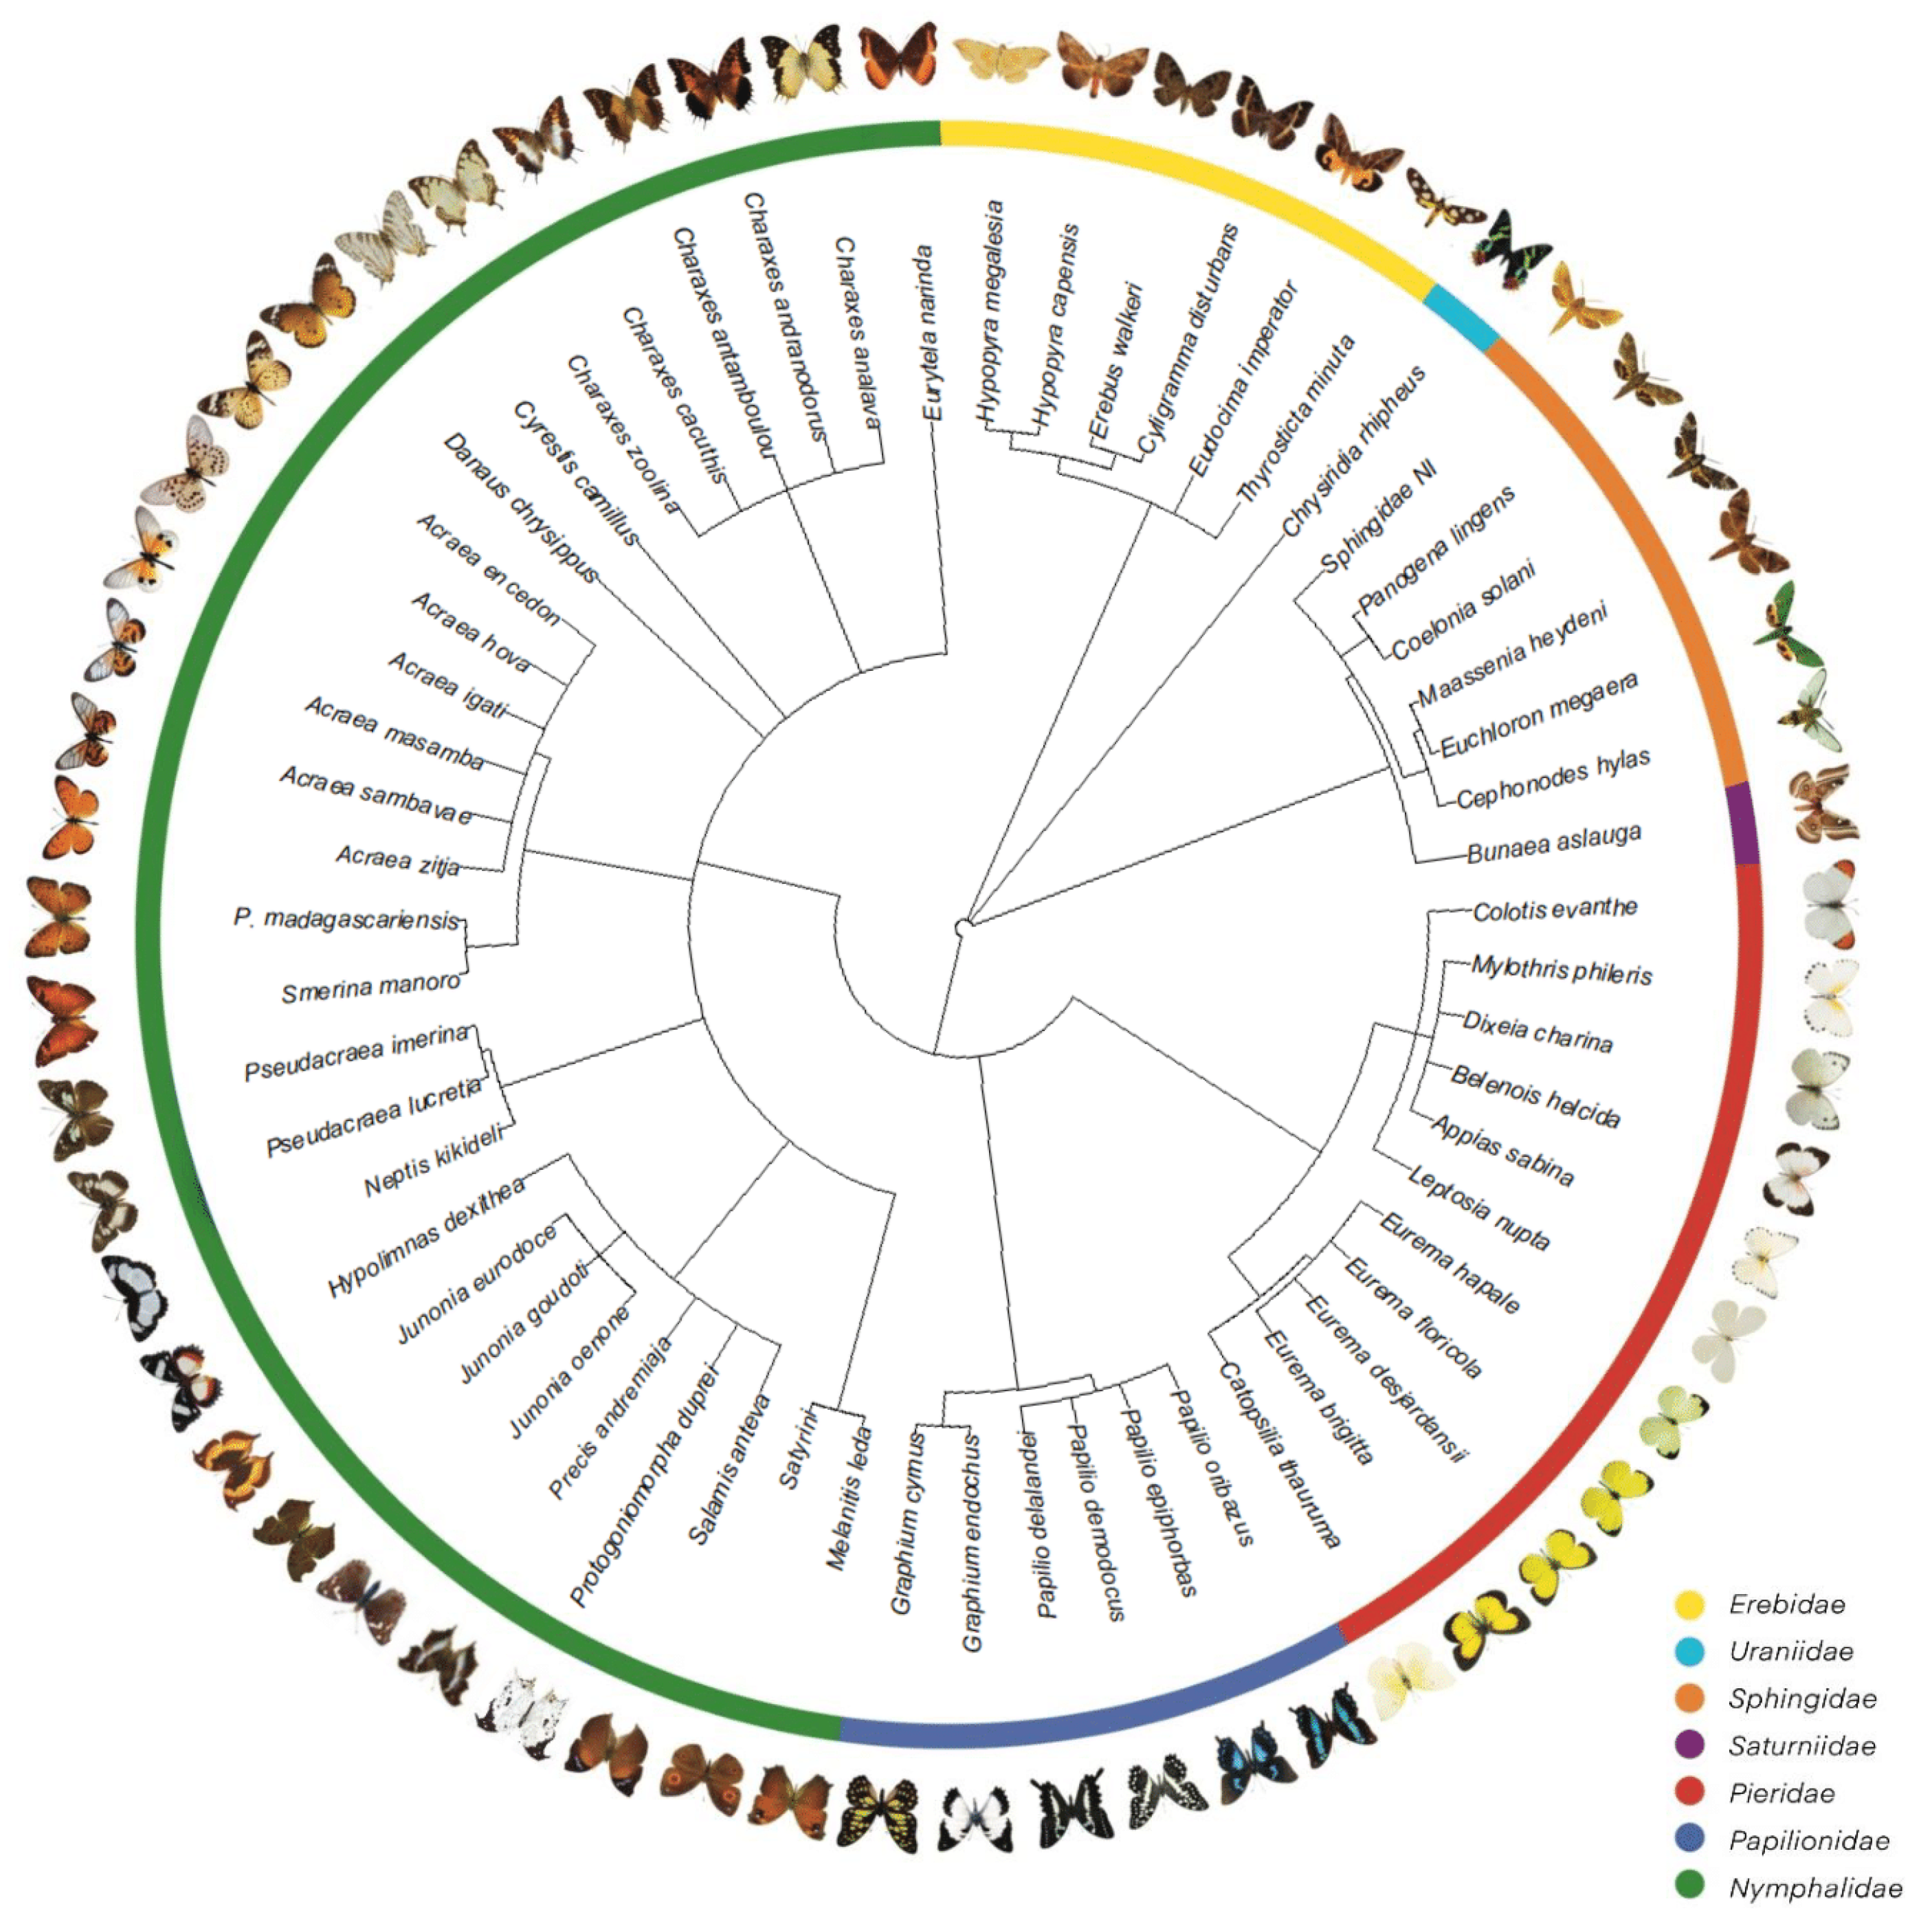
3.1. Butterfly Fauna of the Region

The sampling using baited traps and butterfly nets captured 891 specimens. This included 53 taxonomic units: fifty identified to the species level (418 specimens; Table A1), one morpho-species (Tribe Satyrini) and two family-level groups (Hesperiidae and Lycaenidae; Figure 4). The specimens identified at the species level mostly belonged to the families Nymphalidae (57.1%), Pieridae (23%), and Papilionidae (8%). The most abundant genera are Eurema (Pieridae), Acraea (Nymphalidae), and Papilio (Papilionidae). Some moths (Sphingidae, Uraniidae, and Erebidae) with diurnal or potentially cathemeral behavior were also recorded.
More species were exclusively found in protected areas (Figure 5): twenty-four species, compared to sixteen in anthropized zones. Of the 50 species captured, 37 were exclusively caught with the butterfly net, eight with the fruit-baited trap, and five were found using both methods. The fruit-baited traps captured Nymphalidae from the genera Charaxes (five species, 20 individuals), Eurytela (one species, one individual), Melanitis (one species, four individuals), Neptis (one species, two individuals), and Pseudacraea (two species, four individuals). A Pieridae from the genus Dixeia and two species of Erebidae (from the genera Erebus and Hypopyra) were also trapped. Charaxes antamboulou Lucas, 1872, Melanitis leda Linnaeus, 1758, Pseudacraea imerina (Hewitson, 1865), Pseudacraea lucretia (Cramer, 1775) (Nymphalidae), and Dixeia charina (Boisduval, 1836) (Pieridae) were captured using both the butterfly net and fruit-baited traps.
The light sheet method captured Erebidae, specifically two species and six specimens from the genus Hypopyra, which were also caught with the baited trap. Four species totaled eight specimens for Sphingidae, while Saturniidae included one species and one specimen, Bunaea aslauga Kirby, 1877. However, due to unforeseen disturbances, the community analysis did not include specimens captured using the light sheet method.

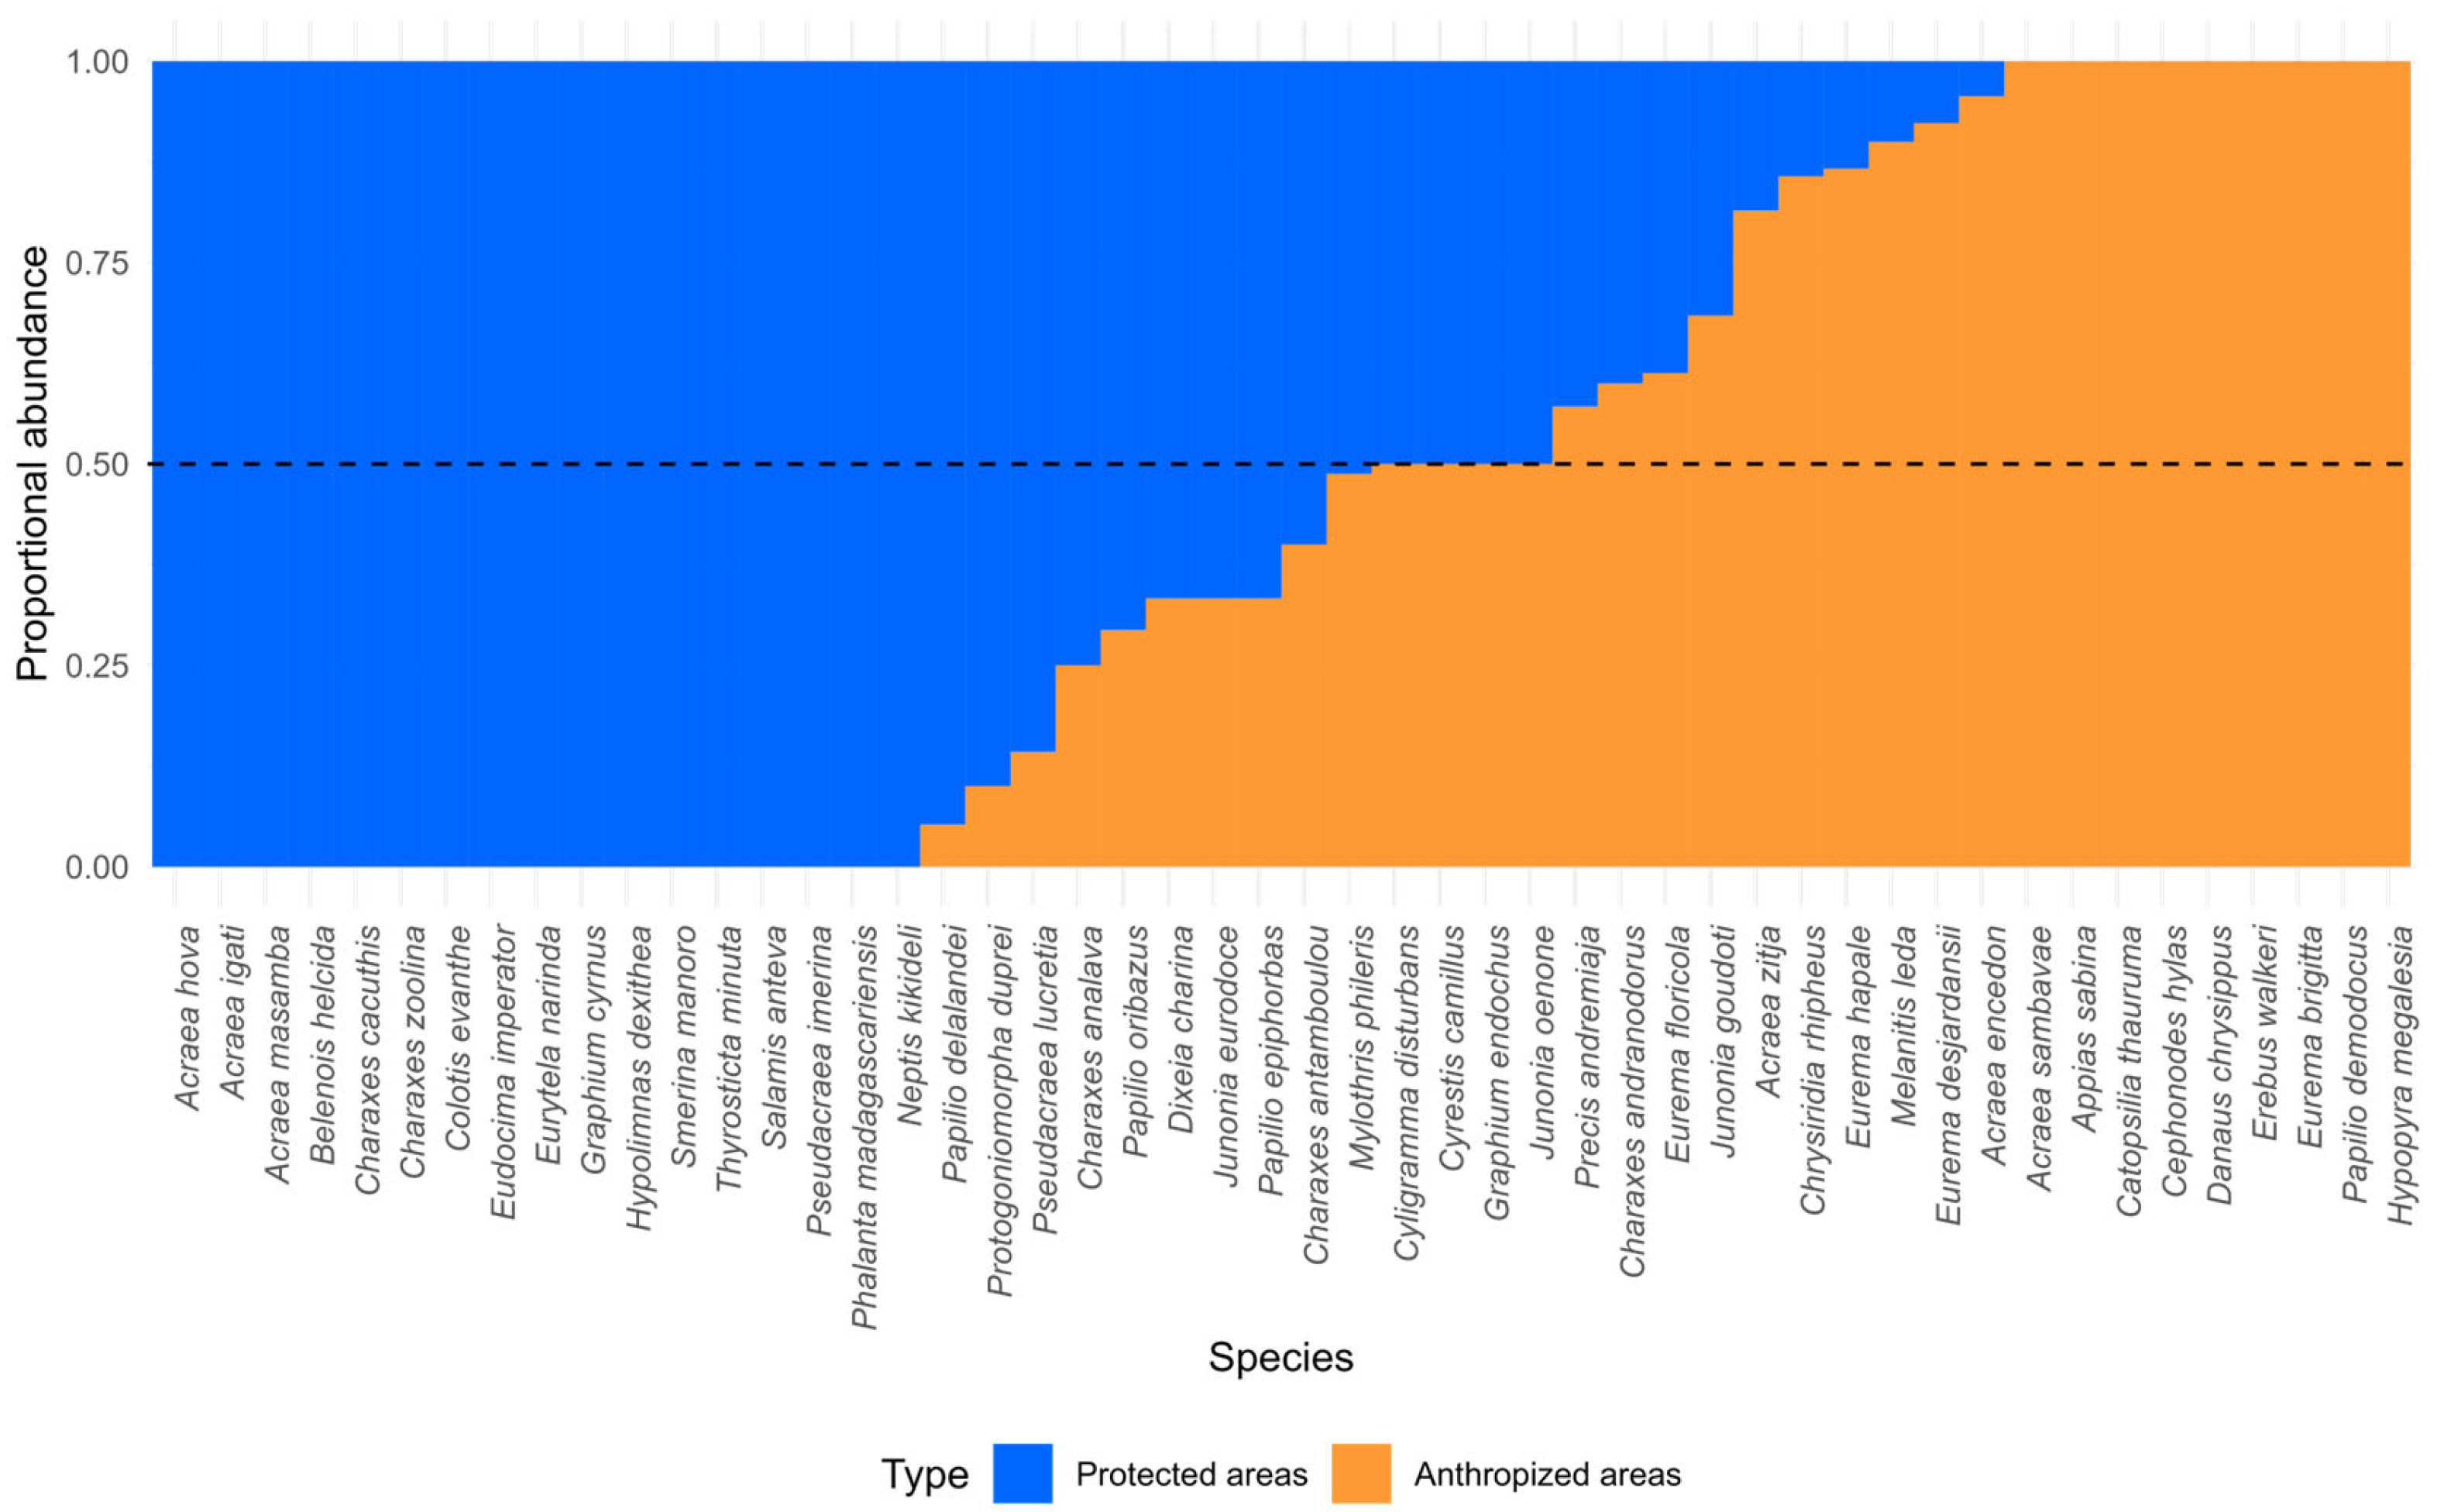
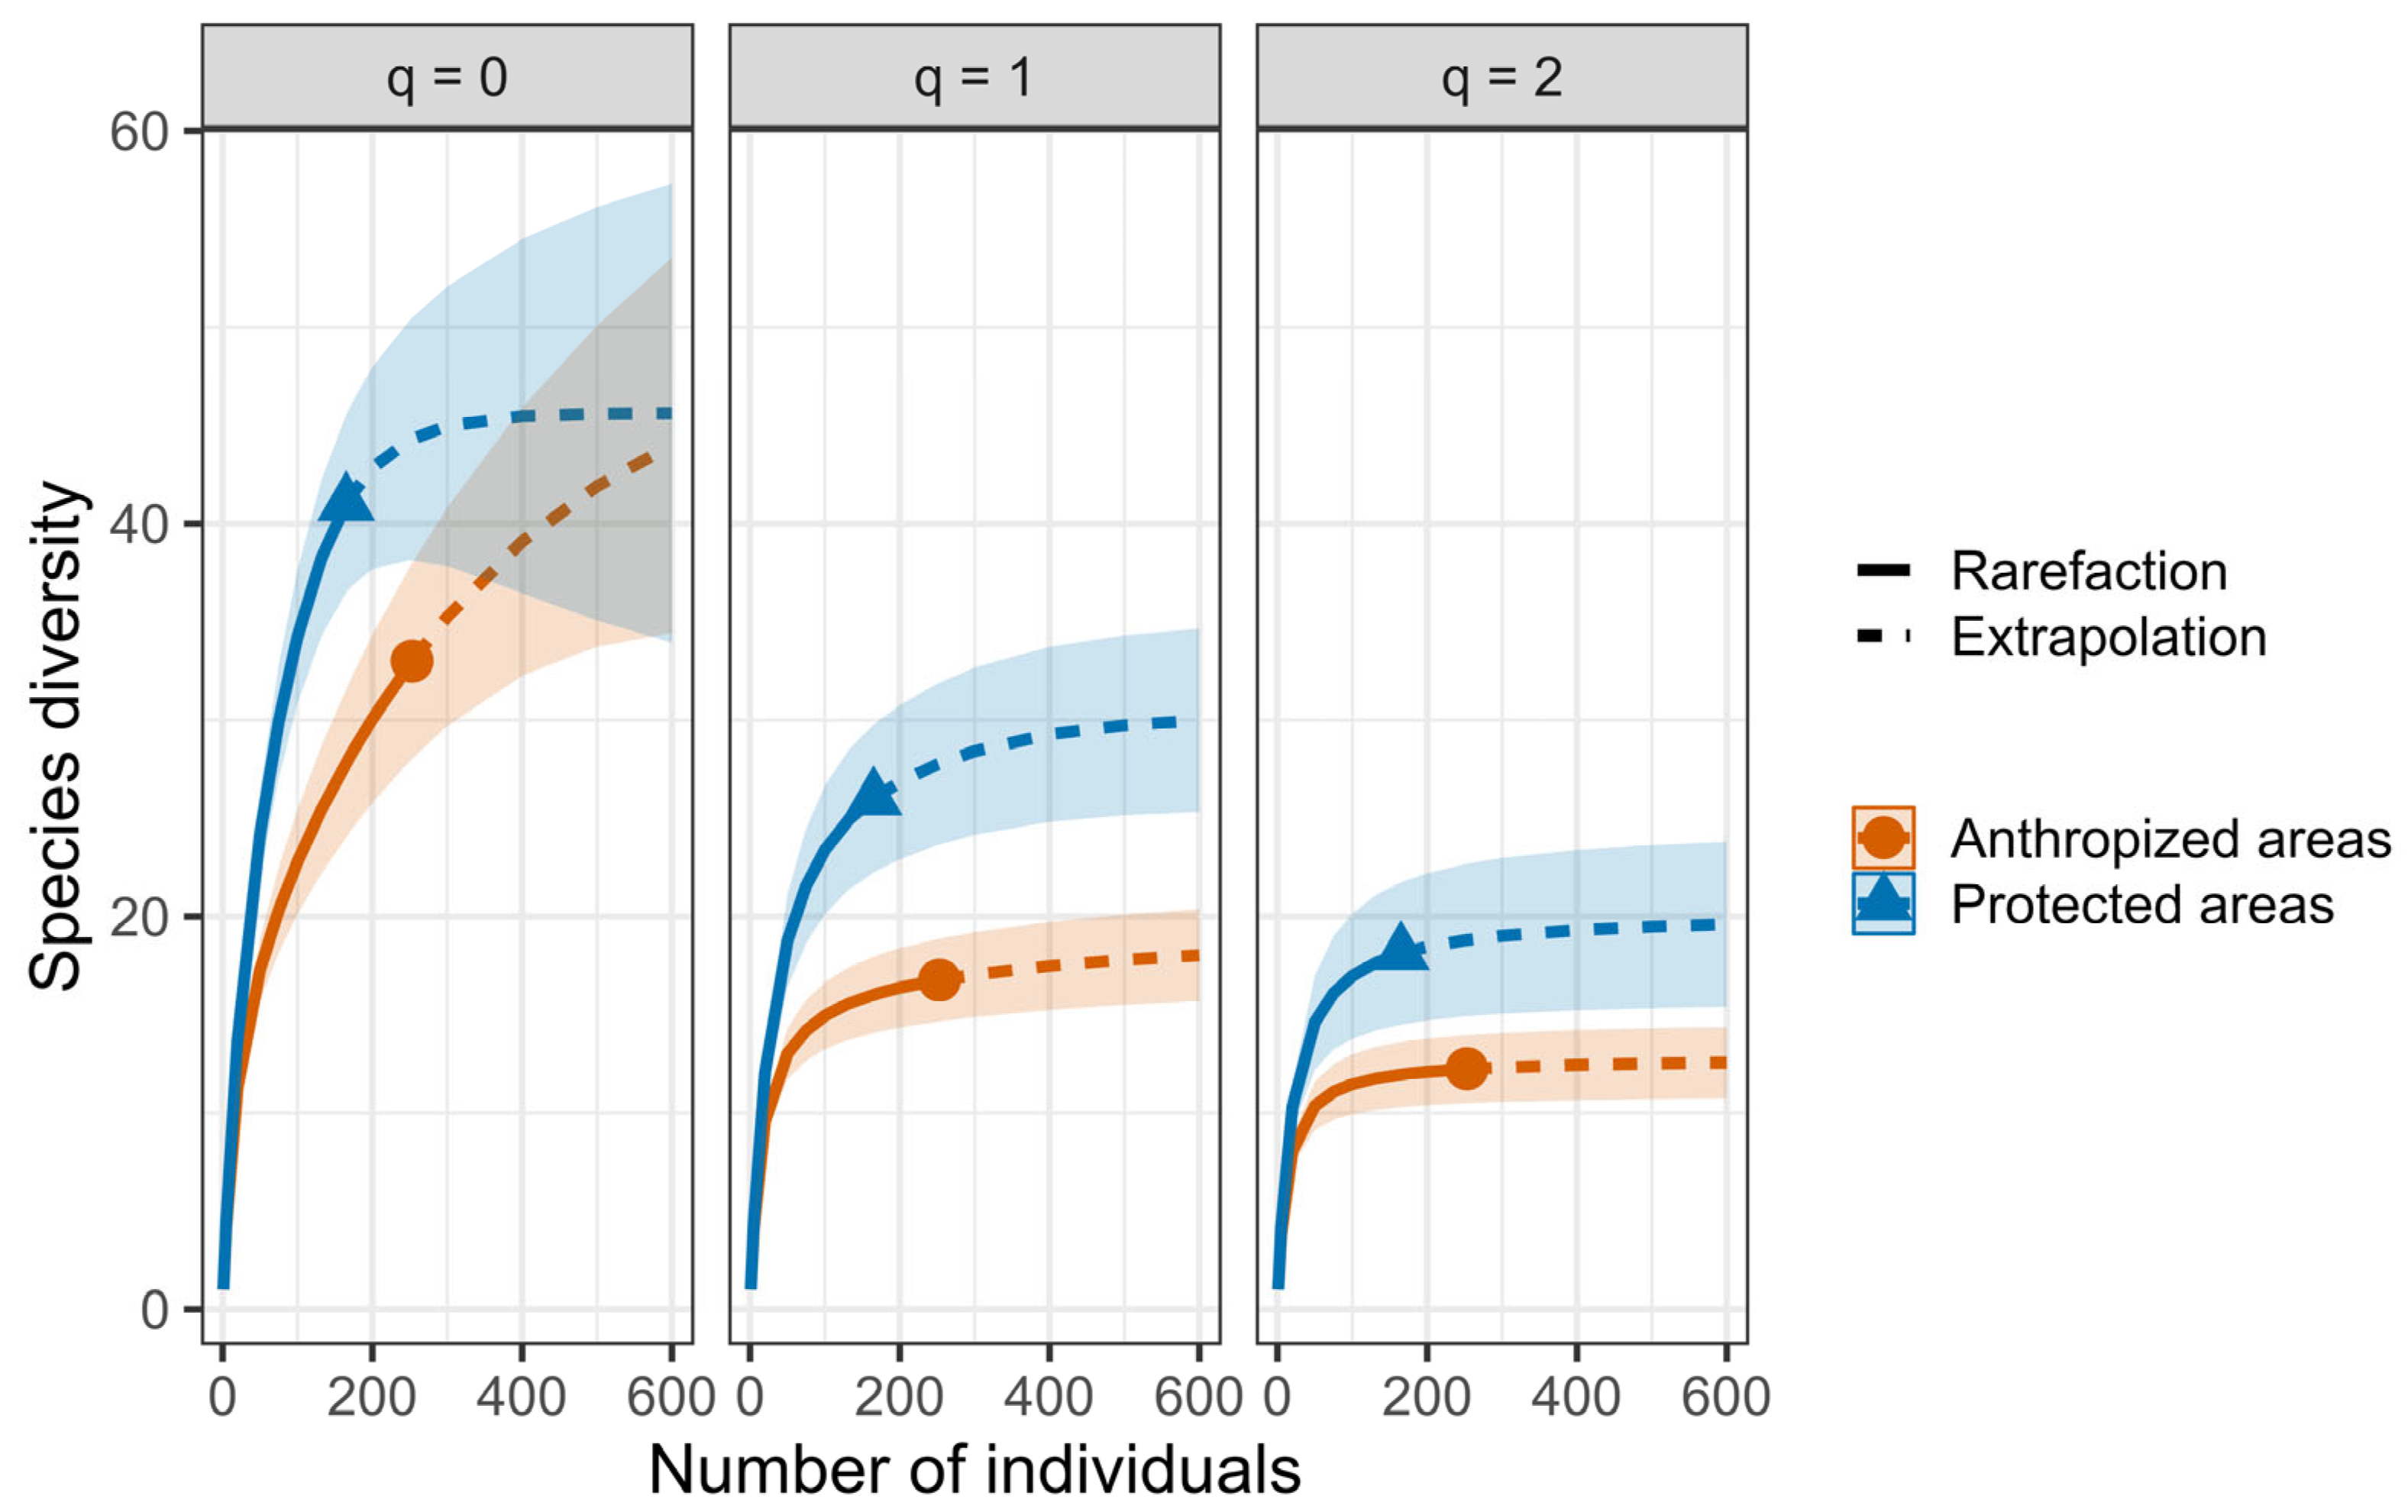
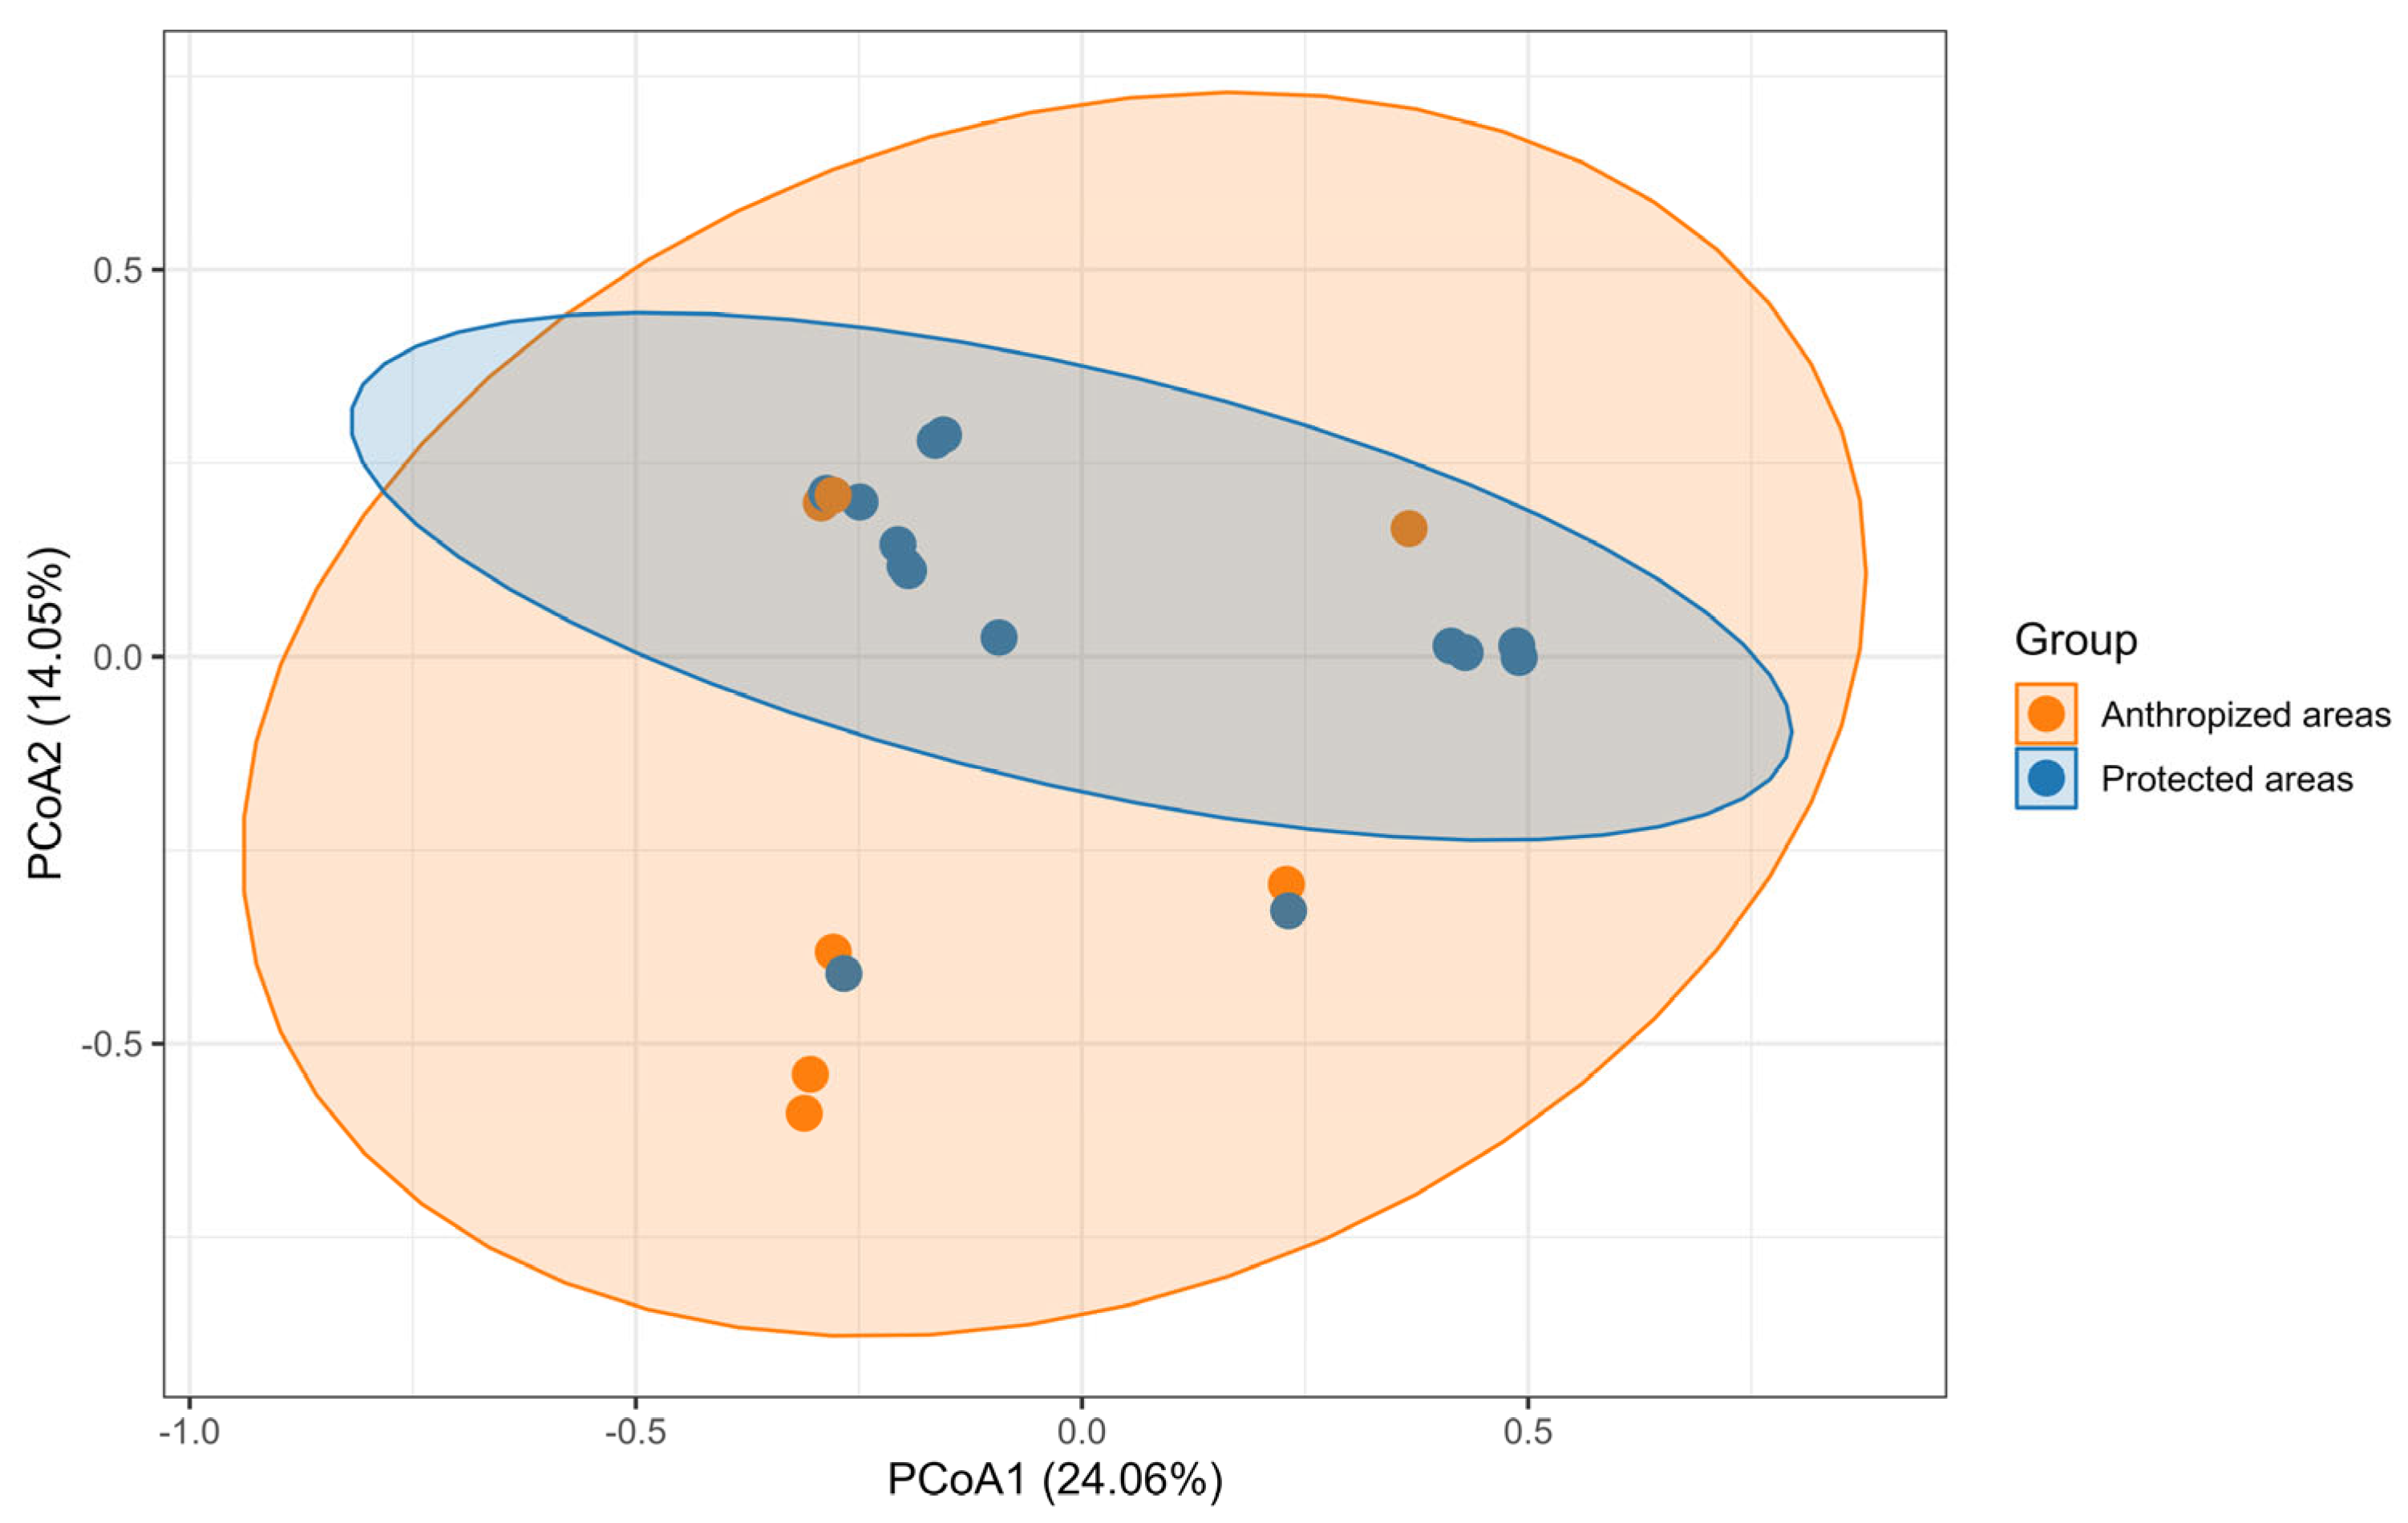
3.2. Community Structure Analysis

There was greater abundance in anthropized areas but more observed species in protected areas (Table 1). The predicted species richness was quite similar with a higher number of species in anthropized areas (Table 1). Protected areas had higher Hill-Shannon and Hill-Simpson index than anthropized areas (Figure 6). Lepidopteran community composition did not differ according to the habitat type (df = 1; F-stat = 1.07; p-value = 0.38; Figure 7) but was mainly driven by the trapping method (df = 1; F-stat = 3.42; p-value < 0.01). Endemism (df = 1; G-test stat = 67.84; p-value < 0.01) and landscape distribution rates (df = 1; G-test stat = 58.08; p-value < 0.01) significantly differed between the habitat types (Figure 8).

4. Discussion

This study examined lepidopteran communities in four sites in the moist forest of eastern Madagascar that were exposed to different landscape disturbances. As limited reference inventory was available for the surrounding sites [24], this study marked a strong starting point to represent macrolepidoptera biodiversity in this region during the last decade. A single expedition to each destination was feasible within the framework of the experiment similar to other studies on macrolepidoptera in Madagascar which encounter the same difficulties of access to the sampling sites [5,47].
Capture with a light sheet allowed for observation of some remarkable species that differed from the anticipated families. Sampling using two trapping methods—butterfly nets and fruit-baited traps—captured 891 lepidopteran specimens, 418 of which were identified to the most precise taxonomic level, representing 50 species. Despite the trends observed in the description of the captures, we observed a homogeneity of the lepidopteran community structure characterized by similar lepidopteran richness and community composition between both habitat types. However, observation of the butterflies and moths in their habitat and their distinct correlation with their life history (endemism and distribution) allows us to formulate some hypotheses about their resilience to environmental change.
Forest lepidopterans are more abundant in protected areas, with an interesting specific composition. They specialize in the narrow ecological niches of old-growth forests, strongly dependent on specific host plants [5,26]. Larger forest cover and a denser canopy favor the presence of endemic plants and trees [26]. The correlation between endemism and distribution aligns with the literature, which states that 90% of endemic species are forest-dependent [2]. The sensitivity of endemic species to disturbance is explained by their geographically restricted ranges and greater specialization than Malagasy common species [27]. Within the protected areas, butterflies and moths were mainly found where the canopy was open. This is particularly the case at Analamazaotra, on the edge of the lake and along the fish farm; and in the protected forest of Maromizaha, where the sampling areas correspond to the three camps (Figure A1). No macrolepidopterans were observed in the closed canopy forest probably too specific the vertical stratification of insects [48]. This observation is confirmed by Rajaonarimalala et al., (2024) [49] which stipulates that the leaf area index (m2 leaf area/m2 soil) correlates with high species richness.
Macrolepidoptera has specific needs and use gaps and closed canopies for different activities. The light in the gaps provides the right conditions for collecting nectar and sunbathing (thermoregulation) [31]. Butterflies were also abundantly observed along roadsides and on building sites, particularly at Camp 1 in Maromizaha (Figure A1). Indeed, butterflies supplement their diet with water rich in mineral salts, increasing egg production and sometimes offspring survival. Some species also show interspecific attraction [50]. Also, the abundance of captured specimens is greater in anthropized areas. In nectar-poor habitats such as Mantadia, butterflies fly erratically for extended periods [30], making them more difficult to capture. In the Maromizaha agroforestry, butterflies were most abundant in the orchard, around the fruit trees and near the nursery, where there are endemic shrubs.
Agroforestry provides a variety of microhabitats that support a wide diversity of butterflies and moths [5] while also offering promising opportunities for ecosystem restoration, particularly in degraded lands with reduced biodiversity and ecosystem services [33]. Mixed agroforestry systems, often based on crops such as cloves, vanilla, coffee or cocoa, combined with fruit trees, show great potential for restoring biodiversity to degraded and fallow land [51]. Across the sites, nectarivorous butterflies were very frequently found near natural flowering, including small cleared plots and roadsides, notably colonized by Fabaceae. These included Crotalaria sp. and Desmodium uncimatum, a neotropical plant introduced for fodder and now invasive. Lantana camara was probably the most frequently flowering plant. Its attraction to butterflies was remarkable. It is one of the 100 worst invasive species according to the IUCN. Although invasive plants are not immediately harmful to butterflies, they could become so in the long term depending on the ecological context of the interaction [52].

5. Conclusions

The results of this research will contribute to ongoing efforts to protect Madagascar’s unique lepidopteran fauna and promote sustainable land-use practices that reconcile biodiversity conservation with human development [32]. This study also highlights the need for continuous monitoring of diverse lepidopteran communities in Madagascar, especially given the increasing pressures from climate change and deforestation. Understanding the distribution patterns of macrolepidoptera across protected and anthropized landscapes will be essential for developing effective conservation strategies and ensuring the long-term survival of these valuable species [5,25].

Author Contributions

Conceptualization, R.H., A.R., F.F. and G.N.; methodology, R.H., A.S., A.R., F.F. and G.N.; software, R.H. and G.N.; validation, R.H.; formal analysis, R.H. and G.N.; investigation, R.H., F.A.T.R., B.F.R., A.R. and N.T.; resources, A.R. and F.F.; data curation, R.H. and G.N.; writing—original draft preparation, R.H. and G.N.; writing—review and editing, F.A.T.R., B.F.R., A.R., N.T., R.C.M., A.S. and F.F.; visualization R.H. and G.N.; supervision, A.R., F.F. and G.N.; project administration, A.R. and F.F.; funding acquisition, A.R. and F.F. All authors have read and agreed to the published version of the manuscript.

Funding

This research was funded by ARES Belgium (Académie de Recherche et d’Enseignement supérieur—Coopération au Développement) under a project entitled “Développement d’un Insectarium Zà bibikely à Madagascar».

Data Availability Statement

All data generated during this study are included in the published article.

Conflicts of Interest

The authors declare no conflicts of interest.

Appendix A

Illustration sources of Figure 5.
26 Precis Illustrations Image: PICRYL—Public Domain Media Search Engine Public Domain Search}. (s.d.). Accessed on 16th August 2024 https://renopenrose.getarchive.net/amp/topics/precis+illustrations.
124942_Charaxes_analava_d_IN.jpg (1500 × 1001). (s.d.). Accessed on 16th August 2024 https://fm-digital-assets.fieldmuseum.org/806/389/124942_Charaxes_analava_d_IN.jpg.
Acraea encedon. (s.d.). Accessed on 16th August 2024 https://insecta.pro/taxonomy/56346.
BOLD Systems: Taxonomy Browser—Smerina manoro {species}. (s.d.). Accessed on 16th August 2024 https://v3.boldsystems.org/index.php/Taxbrowser_Taxonpage?taxid=210391.
Charaxes cacuthis. (s.d.). BioQuipBugs. Accessed on 16th August 2024 https://bioquipbugs.com/product/charaxes-cacuthis/.
Eurytela narinda Ward, 1872. (s.d.). African Butterfly Database. https://abdb-africa.org/species/eurytela_narinda.
Foto 6340084, (c) Smithsonian Institution, National Museum of Natural History, Department of Entomology, alguns direitos reservados (CC BY-NC-SA) · BioDiversity4All. (s.d.). BioDiversity4All. Accessed on 16th August 2024 https://www.biodiversity4all.org/photos/6340084.
Institution, S. (s.d.). Accessed on 16th August 2024 Charaxes andranadorus. Smithsonian Institution. https://www.si.edu/object/charaxes-andranadorus%3Anmnhentomology_11014147.
Junonia goudoti Madagascar. (s.d.). World of Butterflies and Moths. Accessed on 16th August 2024 https://wobam.co.uk/product/junonia-goudoti-madagascar/.
Le Site des Acraea de Dominique Bernaud. (s.d.). Accessed on 16th August 2024 https://www.acraea.com/php/photo.php?type=specimen&index=sganzini&numero=0003
Lycaenidae de Madagascar 1. (s.d.). guyane-insecte.forumactif.com. Accessed on 16th August 2024 https://guyane-insecte.forumactif.com/t1021-lycaenidae-de-madagascar-1.
Oberthür, C. (1904). Etudes de lépidoptérologie comparée. Impr. Oberthür. Accessed on 16th August 2024 https://doi.org/10.5962/bhl.title.8792.
ondrej.zicha(at)gmail.com, O. Z. (s.d.). BioLib: Biological library. Accessed on 16th August 2024, à l’adresse https://www.biolib.cz/en/taxon/id325212/.
Photo 50675175, (c) shirdipam, some rights reserved (CC BY-NC), uploaded by shirdipam · iNaturalist United Kingdom. (s.d.). iNaturalist United Kingdom. Accessed on 16th August 2024, https://uk.inaturalist.org/photos/50675175.
Salamis duprei/Mâle Photos. (s.d.). Adobe Stock. Accessed on 16th August 2024 https://stock.adobe.com/fr/images/salamis-duprei-male/136637415.
Sharp Photography. (s.d.). Sharpphotography. Accessed on 16th August 2024 https://www.sharpphotography.co.uk.
Sphingidae Taxonomic Inventory|Creating a taxonomic e-science. (s.d.). Accessed on 16th August 2024 https://sphingidae.myspecies.info/.
Williams, M. (s.d.-a). 142 Genus Dixeia Talbot.
Williams, M. (s.d.-b). 209 Genus Phalanta Horsfield.
Williams, M. (s.d.-c). 246 Genus Eurema Hubner.
Williams, M. (s.d.-d). 378 Genus Pelopidas Walker.

Appendix B

Figure A1. Representation of the triangular sampling framework at the four sampling sites.
Diversity 17 00095 g0a1
Table A1. Identified butterfly and moth dataset. The symbol “(*)” corresponds to endemic species. Bold values correspond to some subtotals per family and habitat type or sampling site.
Protected AreasSub-TotalAntrhopozed AreasSub-TotalTotal
Butterfly Species Per FamilyAnalamazaotra_FPMaromizaha_FP Mantadia_LIMaromizaha_AF
Erebidae415 449
    Cyligramma2 2 224
        Cyligramma disturbans (*) (Walker, 1858)2 2 224
    Erebus 111
        Erebus walkeri Butler, 1875 111
    Eudocima 11 1
        Eudocima imperator (Boisduval, 1833) 11 1
    Hypopyra 111
        Hypopyra megalesia (*) Mabille, 1879 111
    Thyrosticta2 2 2
        Thyrosticta minuta (*) Boisduval, 18332 2 2
Nymphalidae4340839624120203
    Acraea1211235996891
        Acraea encedon Linnaeus, 17581123774446
        Acraea hova (*) Boisduval, 1833 33 3
        Acraea igati Boisduval, 1833 33 3
        Acraea masamba (*) Ward, 18729110 10
        Acraea sambavae (*) Ward, 1873 2 22
        Acraea zitja (*) Boisduval, 18332352022227
    Charaxes21416821026
        Charaxes analava (*) Ward, 1872 331 14
        Charaxes andranodorus (*) Mabille, 1884 223 35
        Charaxes antamboulou (*) Lucas, 187218942615
        Charaxes cacuthis (*) Hewitson, 1863 11 1
        Charaxes zoolina (*) Lucas, 18721 1 1
    Cyrestis1 1 112
        Cyrestis camillus (*) Fabricius, 17811 1 112
    Danaus 2 22
        Danaus chrysippus (Linnaeus, 1758) 2 22
    Eurytela1 1 1
        Eurytela narinda (*) Ward, 18721 1 1
    Hypolimnas112 2
        Hypolimnas dexithea (*) Hewitson, 1863112 2
    Junonia729781524
        Junonia eurodoce (*) (Westwood, 1850)112 113
        Junonia goudoti (Boisduval, 1833)516761319
        Junonia oenone (Linnaeus, 1764)1 1 112
    Melanitis1121621820
        Melanitis leda Linnaeus, 17581121621820
    Neptis2 2 2
        Neptis kikideli (*) Boisduval, 18332 2 2
    Phalanta 22 2
        Phalanta madagascariensis (*) (Mabille, 1887) 22 2
    Precis2133147
        Precis andremiaja (*) Boisduval, 18332133147
    Pseudacraea6391 110
        Pseudacraea imerina (*) Westwood, 18503 3 3
        Pseudacraea lucretia (*) Cramer, 17793361 17
    Protogoniomorpha5491 10
        Protogoniomorpha duprei (*) (Vinson, 1863)549 1110
    Salamis1 1 1
        Salamis anteva (*) Ward, 18701 1 1
    Smerina213 3
        Smerina manoro (*) (Ward, 1870)213 3
Papilionidae249332161851
    Graphium2 21 13
        Graphium cyrnus (*) (Boisduval, 1836)1 1 1
        Graphium endochus (*) (Boisduval, 1836)1 11 12
    Papilio229311161748
        Papilio delalandei (*) Godart, 182417 1711219
        Papilio demodocus Esper, 1798 999
        Papilio epiphorbas (*) Boisduval, 18332 2 113
        Papilio oribazus (*) Boisduval, 18363912 5517
Pieridae358438420104147
    Appias 2 22
        Appias sabina (*) (C. & R. Felder, 1865) 2 22
    Belenois3 3 3
        Belenois helcida (*) (Boisduval, 1833)3 3 3
    Catopsilia 111
        Catopsilia thauruma (Reakirt, 1866) 111
    Colotis1 1 1
        Colotis evanthe (Boisduval, 1836)1 1 1
    Dixeia2 21 13
        Dixeia charina (*) (Boisduval, 1836)2 21 13
    Eurema1421663178096
        Eurema brigitta (Stoll, 1780) 1952424
        Eurema desjardansii (*) (Boisduval, 1833)2 21772426
        Eurema floricola (Boisduval, 1833)12 1219 1931
        Eurema hapale (Mabille, 1882) 22851315
    Mylothris156211822041
        Mylothris phileris (*) (Boisduval, 1833)156211822041
Sphingidae 111
    Cephonodes 111
        Cephonodes hylas Linnaeus, 1771 111
Uraniidae1 1 667
    Chrysiridia1 1 667
        Chrysiridia rhipheus (*) Drury, 17731 1 667
Total1075816518271253418

References

  1. Goodman, S.M. Updated Estimates of Biotic Diversity and Endemism for Madagascar—Revisited after 20 Years. Oryx 2023, 57, 561–565. [Google Scholar] [CrossRef]
  2. Cota, G.; Sagan, V.; Maimaitijiang, M.; Freeman, K. Forest Conservation with Deep Learning: A Deeper Understanding of Human Geography around the Betampona Nature Reserve, Madagascar. Remote Sens. 2021, 13, 3495. [Google Scholar] [CrossRef]
  3. Vences, M.; Wollenberg, K.C.; Vieites, D.R.; Lees, D.C. Madagascar as a Model Region of Species Diversification. Trends Ecol. Evol. 2009, 24, 456–465. [Google Scholar] [CrossRef]
  4. Jeanne, I.; Randremanana, R.; Robert, V.; Ariey, F.; Tombo, M.L.; Wilmé, L.; Ranivoarisoa, S.; Duchemin, J.B. Biogéographie de Madagascar. In Atlas Évolutif du Paludisme à Madagascar; Institut Pasteur de Madagascar: Antananarivo, Madagascar, 2002; pp. 1–10. [Google Scholar]
  5. Wurz, A.; Grass, I.; Lees, D.C.; Rakotomalala, A.A.N.A.; Sáfián, S.; Martin, D.A.; Osen, K.; Loos, J.; Benasoavina, E.; Alexis, T.; et al. Land-Use Change Differentially Affects Endemic, Forest and Open-Land Butterflies in Madagascar. Insect Conserv. Divers. 2022, 15, 606–620. [Google Scholar] [CrossRef]
  6. Tracewski, Ł.; Butchart, S.H.M.; Di Marco, M.; Ficetola, G.F.; Rondinini, C.; Symes, A.; Wheatley, H.; Beresford, A.E.; Buchanan, G.M. Toward Quantification of the Impact of 21st-Century Deforestation on the Extinction Risk of Terrestrial Vertebrates. Conserv. Biol. 2016, 30, 1070–1079. [Google Scholar] [CrossRef]
  7. Lees, D.C.; Minet, J. Lepidoptera, Butterflies and Moths: Systematics and Diversity. In The New Natural History of Madagascar; Goodman, S.M., Andrianarimisa, A., Armstrong, A.H., Cooke, A., De Wit, M., Ganzhorn, J.U., Gautier, L., Goodman, S.M., Jones, J.P.G., Jungers, W.L., et al., Eds.; Princeton University Press: Princeton, NJ, USA, 2022; pp. 1141–1172. ISBN 9780691222622. [Google Scholar]
  8. Merckx, T.; Huertas, B.; Basset, Y.; Thomas, J.A. A Global Perspective on Conserving Butterflies and Moths and Their Habitats. In Key Topics in Conservation Biology 2; John Wiley & Sons, Ltd.: Hoboken, NJ, USA, 2013. [Google Scholar]
  9. Bonebrake, T.C.; Ponisio, L.C.; Boggs, C.L.; Ehrlich, P.R. More than Just Indicators: A Review of Tropical Butterfly Ecology and Conservation. Biol. Conserv. 2010, 143, 1831–1841. [Google Scholar] [CrossRef]
  10. Checa, M.F.; Donoso, D.A.; Rodriguez, J.; Levy, E.; Warren, A.; Willmott, K. Combining Sampling Techniques Aids Monitoring of Tropical Butterflies. Insect Conserv. Divers. 2019, 12, 362–372. [Google Scholar] [CrossRef]
  11. Munyuli, T. Assessment of Indicator Species of Butterfly Assemblages in Coffee–Banana Farming System in Central Uganda. Afr. J. Ecol. 2012, 50, 77–89. [Google Scholar] [CrossRef]
  12. Freitas, A.V.L.; Santos, J.P.; Rosa, A.H.B.; Iserhard, C.A.; Richter, A.; Siewert, R.R.; Gueratto, P.E.; Carreira, J.Y.O.; Lourenço, G.M. Sampling Methods for Butterflies (Lepidoptera). In Measuring Arthropod Biodiversity: A Handbook of Sampling Methods; Carlos, S.J., Fernandes, G.W., Eds.; Springer International Publishing: Cham, Switzerland, 2021; pp. 101–123. ISBN 978-3-030-53226-0. [Google Scholar]
  13. Thomas, J.A. Monitoring Change in the Abundance and Distribution of Insects Using Butterflies and Other Indicator Groups. Philos. Trans. R. Soc. B Biol. Sci. 2005, 360, 339–357. [Google Scholar] [CrossRef]
  14. Sterling, S.M.; Ducharne, A.; Polcher, J. The Impact of Global Land-Cover Change on the Terrestrial Water Cycle. Nat. Clim. Change 2013, 3, 385–390. [Google Scholar] [CrossRef]
  15. Jones, J.; Rakotonarivo, O.; Razafimanahaka, J. Forest Conservation in Madagascar: Past, Present, and Future. In The New Natural History of Madagascar; S. M. Goodman, Princeton University Press: Princeton, NJ, USA, 2022; ISBN 9780691222622. [Google Scholar]
  16. Zaehringer, J.G.; Eckert, S.; Messerli, P. Revealing Regional Deforestation Dynamics in North-Eastern Madagascar—Insights from Multi-Temporal Land Cover Change Analysis. Land 2015, 4, 454–474. [Google Scholar] [CrossRef]
  17. Armstrong, A.; Shugart, H.; Fatoyinbo, L. Characterization of Community Composition and Forest Structure in a Madagascar Lowland Rainforest. Trop. Conserv. Sci. 2011, 4, 428–444. [Google Scholar] [CrossRef]
  18. Vieilledent, G.; Grinand, C.; Rakotomalala, F.A.; Ranaivosoa, R.; Rakotoarijaona, J.R.; Allnutt, T.F.; Achard, F. Combining Global Tree Cover Loss Data with Historical National Forest Cover Maps to Look at Six Decades of Deforestation and Forest Fragmentation in Madagascar. Biol. Conserv. 2018, 222, 189–197. [Google Scholar] [CrossRef]
  19. Speart, J. Winged Obsession: The Pursuit of the World’s Most Notorious Butterfly Smuggler, 1st ed.; Harper Collins: New York City, NY, USA, 2011. [Google Scholar]
  20. Boppré, M.; Vane-Wright, R. The Butterfly House Industry: Conservation Risks and Education Opportunities. Conserv. Soc. 2012, 10, 285–303. [Google Scholar] [CrossRef]
  21. Wang, Z.; Chan, W.-P.; Pham, N.T.; Zeng, J.; Pierce, N.E.; Lohman, D.J.; Meng, W. One in Five Butterfly Species Sold Online across Borders. Biol. Conserv. 2023, 283, 110092. [Google Scholar] [CrossRef]
  22. IUCN. Red List of Lepidoptera Species from Madagascar Assessed by IUCN. Available online: https://www.iucnredlist.org/search?dl=true&permalink=e12a298a-a840-470c-bd64-96faafd9ea4c (accessed on 14 January 2025).
  23. Razafimanantsoa, T. Étude Bioécologique Des Papillons Séricigènes Dans Les Familles Des Lasiocampidae et Des Saturniidae Au Parc National de Ranomafana et Dans La Forêt de Tapia d’Ambohimanjaka. Master’s Thesis, Université d’Antananarivo, Antananarivo, Madagascar, 2008. [Google Scholar]
  24. Ravelomanana, A.; Razakanirina, T.; Ravalison, F.; Andriamandranto, R. Recolonisation des forêts dégradées par les fourmis et les papillons diurnes suite à la restauration de la forêt de Kalanoro, Moramanga. In Proceedings of the MESupReS: Forum de la Recherche: One Health; Fianarantsoa, Madagascar, 29 June 2023. [Google Scholar]
  25. Lees, D.; Minet, J. Lepidoptera: Systematics and Diversity. In The Natural History of Madagascar; S. M. Goodman, Princeton University Press: Princeton, NJ, USA, 2003; pp. 748–761. ISBN 0226303063. [Google Scholar]
  26. Li, X.; Luo, Y.; Zhang, Y.-L.; Schweiger, O.; Settele, J.; Yang, Q. On the Conservation Biology of a Chinese Population of the Birdwing Troides Aeacus (Lepidoptera: Papilionidae). J. Insect Conserv. 2010, 14, 257–268. [Google Scholar] [CrossRef]
  27. Cleary, D.F.R.; Mooers, A.Ø. Burning and Logging Differentially Affect Endemic vs. Widely Distributed Butterfly Species in Borneo. Divers. Distrib. 2006, 12, 409–416. [Google Scholar] [CrossRef]
  28. Kremen, C. Biological Inventory Using Target Taxa: A Case Study of the Butterflies of Madagascar. Ecol. Appl. 1994, 4, 407–422. [Google Scholar] [CrossRef]
  29. Devries, P. A Standardized Butterfly Sampling Protocol: Fruit-Feeding Butterflies (Nymphalidae). In Core Standardized Methods for Rapid Biological Field Assessment; Conversation International: Crystal City, VA, USA, 2016; pp. 139–148. ISBN 978-1-934151-96-9. [Google Scholar]
  30. Evans, L.C.; Oliver, T.H.; Sims, I.; Greenwell, M.P.; Melero, Y.; Watson, A.; Townsend, F.; Walters, R.J. Behavioural Modes in Butterflies: Their Implications for Movement and Searching Behaviour. Anim. Behav. 2020, 169, 23–33. [Google Scholar] [CrossRef]
  31. Pryke, J.S.; Vrdoljak, S.M.; Grant, P.B.C.; Samways, M.J. Butterfly Behavioural Responses to Natural Bornean Tropical Rain-Forest Canopy Gaps. J. Trop. Ecol. 2012, 28, 45–54. [Google Scholar] [CrossRef]
  32. Andrianambinina, F.O.D.; Rafanoharana, S.C.; Rasamuel, H.A.T.; Waeber, P.O.; Ganzhorn, J.U.; Wilmé, L. Decrease of Deforestation in Protected Areas of Madagascar during the COVID-19 Years. Madag. Conserv. Dev. 2024, 18, 15–21. [Google Scholar] [CrossRef]
  33. Raveloaritiana, E.; Wurz, A.; Grass, I.; Osen, K.; Soazafy, M.R.; Martin, D.A.; Faliniaina, L.; Rakotomalala, N.H.; Vorontsova, M.S.; Tscharntke, T.; et al. Land-Use Intensification Increases Richness of Native and Exotic Herbaceous Plants, but Not Endemics, in Malagasy Vanilla Landscapes. Divers. Distrib. 2021, 27, 784–798. [Google Scholar] [CrossRef]
  34. Segers, A. Détermination Des Visiteurs Floraux de Trois Essences Ligneuses à Haute Valeur Commerciale: Baillonella Toxisperma Pierre, Afzelia Bipindensis Harms et Erythrophleum Suaveolens (Guill. & Perr.) Brenan. Master’s Thesis, Gembloux Agro-Bio Tech, Gembloux, Belgium, 2018. [Google Scholar]
  35. Collins, S.; Cogdon, C. Checklist of the Butterflies of Madagascar; African Butterfly Research Institute: Nairobi, Kenya, 2017. [Google Scholar]
  36. Beccaloni, G.; Scoble, M.; Kitching, I.; Simonsen, T.; Robinson, G.; Pitkin, B.; Hine, A.; Lyal, C.; Ollerenshaw, J.; Wing, P.; et al. Global Lepidoptera Index (Version 1.1.24.106). Available online: https://doi.org/10.48580/dg4lg-49xk (accessed on 19 December 2024).
  37. Mendenhall, C.D.; Shields-Estrada, A.; Krishnaswami, A.J.; Daily, G.C. Quantifying and Sustaining Biodiversity in Tropical Agricultural Landscapes. Proc. Natl. Acad. Sci. USA 2016, 113, 14544–14551. [Google Scholar] [CrossRef] [PubMed]
  38. R Core Team. R: A Language and Environment for Statistical Computing; R Foundation for Statistical Computing: Vienna, Austria, 2020. [Google Scholar]
  39. Magurran, A. Measuring Biologcial Diversity; Blackwell Publishing: Oxford, UK, 2004. [Google Scholar]
  40. Chao, A. Estimating the Population Size for Capture-Recapture Data with Unequal Catchability. Biometrics 1987, 43, 783–791. [Google Scholar] [CrossRef] [PubMed]
  41. Oksanen, J.; Blanchet Michael, F.G.F.; Kindt, R.; Legendre, P.; McGlinn, D.; Minchin, P.R.; O’Hara, R.B.; Simpson, G.L.; Solymos, P.; Stevens, M.H.H.; et al. Vegan: Community Ecology Package, Version 2.6-8; R Foundation for Statistical Computing: Vienna, Austria, 2024. [Google Scholar]
  42. Hill, M.O. Diversity and Evenness: A Unifying Notation and Its Consequences. Ecology 1973, 54, 427–432. [Google Scholar] [CrossRef]
  43. Hsieh, T.C.; Ma, K.H.; Chao, A. INEXT: An R Package for Rarefaction and Extrapolation of Species Diversity (Hill Numbers). Methods Ecol. Evol. 2016, 7, 1451–1456. [Google Scholar] [CrossRef]
  44. Chao, A.; Gotelli, N.J.; Hsieh, T.C.; Sander, E.L.; Ma, K.H.; Colwell, R.K.; Ellison, A.M. Rarefaction and Extrapolation with Hill Numbers: A Framework for Sampling and Estimation in Species Diversity Studies. Ecol. Monogr. 2014, 84, 45–67. [Google Scholar] [CrossRef]
  45. Hervé, M. RVAideMemoire: Testing and Plotting Procedures for Biostatistics, Verision 0.9-83-7; R Foundation for Statistical Computing: Vienna, Austria, 2020. [Google Scholar]
  46. Jose, G. Comecol—Community Ecology Analysis, Version 1.8.1; R Foundation for Statistical Computing: Vienna, Austria, 2020. [Google Scholar]
  47. Wiorek, M.; Malik, K.; Lees, D.; Przybyłowicz, Ł. Malagasy Polka Dot Moths (Noctuoidea: Erebidae: Arctiinae: Syntomini) of Ambohitantely—Endemism in the Most Important Relict of Central Plateau Rainforest in Madagascar. PeerJ 2021, 9, e11688. [Google Scholar] [CrossRef]
  48. de Souza Amorim, D.; Brown, B.V.; Boscolo, D.; Ale-Rocha, R.; Alvarez-Garcia, D.M.; Balbi, M.I.P.A.; de Marco Barbosa, A.; Capellari, R.S.; de Carvalho, C.J.B.; Couri, M.S.; et al. Vertical Stratification of Insect Abundance and Species Richness in an Amazonian Tropical Forest. Sci. Rep. 2022, 12, 1734. [Google Scholar] [CrossRef]
  49. Rajaonarimalala, R.; Korol, Y.; Andrianarimisa, A.; Dröge, S.; Fulgence, T.; Grass, I.; Kreft, H.; Osen, K.; Rakotomalala, A.A.N.A.; Rakouth, B.; et al. Stand Structure as the Proximate Driver of Endemic Biodiversity and Ecosystem Functions in Tropical Mosaic Landscapes. bioRxiv 2024. bioRxiv:03.20.582692. [Google Scholar] [CrossRef]
  50. Otis, G.W.; Locke, B.; McKenzie, N.G.; Cheung, D.; MacLeod, E.; Careless, P.; Kwoon, A. Local Enhancement in Mud-Puddling Swallowtail Butterflies (Battus philenor and Papilio glaucus). J. Insect Behav. 2006, 19, 685–698. [Google Scholar] [CrossRef]
  51. Andriatsitohaina, R.N.N.; Laby, P.; Llopis, J.C.; Martin, D.A. Agroforestry in Madagascar: Past, Present, and Future. Agrofor. Syst. 2024, 98, 1659–1680. [Google Scholar] [CrossRef] [PubMed]
  52. Braga, M.P. Are Exotic Host Plants a Life Raft or a Trap for Butterflies? Curr. Opin. Insect Sci. 2023, 58, 101074. [Google Scholar] [CrossRef] [PubMed]
Figure 1. Malagasy island (in upper left part), the yellow rectangle shows the study area. Position of the four sampling sites on Google Earth, 2024. Mantadia_LI and Maromizaha_AF were regrouped as anthropized sites while Analamazaotra_FP and Maromizaha_FP were regrouped as protected forest sites.
Diversity 17 00095 g001
Figure 2. Scheme of the triangular sampling framework including three sampling units (SU) with 30 m radius: “SUA”, “SUB” and “SUC”. Each SU contains five fruit-baited traps from A1 to A5 at 25 m from the SU center. The butterfly netting was performed inside the designed triangular sampling framework.
Diversity 17 00095 g002
Figure 3. (A) Fruit-baited trap based on the Van Someren-Rydon model described by Devries et al. [29]. (B) Trap placed at canopy height > 3 m. (C) Charaxes andranadorus Mabille, 1884 caught in a fruit-baited trap. (D) Butterfly nets at the refuge. (E) Melanitis leda Linnaeus, 1758 captured with a net. (F) Two Chrysiridia rhipheus Drury, 1773 captured with a net. (G) The light sheet was placed in the Maromizaha agroforestry area (Maromizaha_AF). (H) Coelonia solani Boisduval, 1833 captured with the light sheet set-up.
Diversity 17 00095 g003
Figure 4. The evolutionary wheel of Lepidoptera collection (including identified species, the Satyrini morpho-species). The graphical representation is not to morphological scale. The classification ranges from the order level to the most minor identified taxa (species, tribe, or family). Families are represented by the colors in the legend (right). The taxonomic tree was generated using the “taxtotree” function from comecol R package [46] and illustrated with the Procreate graphic application (Savage Interactive Pty Ltd., Hobart, Australia). Illustration sources are available in Appendix A.
Diversity 17 00095 g004
Figure 5. Butterfly and moth distribution given the proportional abundance per habitat type: protected areas (blue) and anthropized areas (orange).
Diversity 17 00095 g005
Figure 6. Comparison between lepidopteran α communities based on abundance data with sample-size-based rarefaction (solid curves) and extrapolation (dashed curves) across the habitat type: Anthropized areas (orange) and protected areas (blue). Each grid panel shows a different Hill’s number: observed richness (q = 0), the exponential of the Shannon entropy (q = 1) and the inverse Simpson concentration index (q = 2). The 95% confidence intervals (colored-shaded regions) were obtained by a bootstrap method based on 100 replications.
Diversity 17 00095 g006
Figure 7. Principal Coordinate Analysis (PCoA) showing lepidopteran community composition across anthropized areas (orange dots) and protected areas (blue dots). The ellipses are built with 95% confidence.
Diversity 17 00095 g007
Figure 8. Life trait distribution of macrolepidoptera per habitat type. The life traits are proportionally displayed in function of the endemism (upper part) and habitat (lower part). Letters indicate significant differences (p < 0.05) according to the G-test performance of species traits distribution according to the habitat type.
Diversity 17 00095 g008
Table 1. Observed abundance, observed specific richness, and Chao1’s estimator (±SE) across land types.
By Land Type and SiteAbundanceSpecies RichnessChao1
Protected areas1654144.92 ± 3.37
Analamazaotra_FP1073342.10 ± 6.48
Maromizaha_FP582233.25 ± 9.53
Anthropized areas2533346.00 ± 9.63
Mantadia_LI1822022.50 ± 3.15
Maromizaha_AF712433.17 ± 7.37
Total4185055.06 ± 4.13
Disclaimer/Publisher’s Note: The statements, opinions and data contained in all publications are solely those of the individual author(s) and contributor(s) and not of MDPI and/or the editor(s). MDPI and/or the editor(s) disclaim responsibility for any injury to people or property resulting from any ideas, methods, instructions or products referred to in the content.

