Article

Flash-Flood-Induced Changes in the Hydrochemistry of the Albufera of Valencia Coastal Lagoon

Cavanilles Institute of Biodiversity and Evolutionary Biology (ICBiBE), Universitat de València, Catedrátic José Beltrán Martinez, 2, 46980 Valencia, Spain
*
Author to whom correspondence should be addressed.
Diversity 2025, 17(2), 119; https://doi.org/10.3390/d17020119
Submission received: 25 December 2024 / Revised: 4 February 2025 / Accepted: 5 February 2025 / Published: 7 February 2025

Abstract

:
In the context of climate change, extreme meteorological events such as severe storms produced by an isolated high-level atmospheric depression (known in Spanish as “Depresión Aislada en Niveles Altos”—DANA) are becoming increasingly frequent in the Mediterranean region, posing significant risks to ecosystems and human infrastructure. This study evaluates the impact of a DANA event in October 2024 on the water quality of Albufera Lake (Spain), a crucial Mediterranean wetland. A comprehensive evaluation was conducted by combining field data on physicochemical and biological parameters with satellite observations (Sentinel-2 and Landsat-8) to assess alterations before and after the event. Variables such as conductivity, nitrate, and total solids exhibited significant reductions immediately following the DANA, with conductivity decreasing by 82% compared to pre-event levels. These alterations signify a substantial renewal of the lake system driven by heavy rainfall and subsequent water releases. However, the lake demonstrated signs of recovery toward pre-event conditions over the following month. These results are consistent with previous findings, underscoring the system’s resilience and the necessity of periodic water releases to maintain ecological balance. The use of remote sensing tools effectively captured these dynamics, offering valuable insights for the long-term monitoring of water quality. This study highlights the urgent need for proactive management strategies to mitigate the effects of increasingly intense meteorological disturbances.

1. Introduction

The Albufera de Valencia is a shallow, hypertrophic coastal lagoon located south of the city of Valencia (Spain), about 7.5 km from the mouth of the Turia River [1]. The lagoon was formed by sediment inputs from the rivers, which resulted in the formation of a sandy shoal, closing the original marine gulf. This process is estimated to have begun approximately 8000 years ago, with the formation of successive dunes [2]. Five ravines flow into the lake: Poyo–Torrent–Massanassa, Picassent–Beniparrell, Barranquet, Hondo–Tramusser, and Agua–Alginet [1]. It is important to note that these ravines undergo changes in their nomenclature during their course, thus the various names by which they are indicated here. Presently, these watercourses continue to carry substantial quantities of anthropogenic sediments and eroded materials of their basin, which further contribute to the sediment load [3] due to the lack of stabilization in their basins. The total closure of the lagoon to the sea occurred in the 18th century, coinciding with the commencement of artificial regulation of water outflow to the sea through the installation of floodgates [4]. Concurrently, the marshes adjacent to the lagoon underwent conversion to rice fields [1]. The lagoon of the Albufera and the surrounding marshland is part of a wetland of about 210 km2 that was protected as a Natural Park in 1986 in accordance with Spanish legislation, mostly dedicated to rice cultivation [5].
The most significant ecological alteration of the Albufera was caused by the extension of the “Acequia Real del Júcar” (from the siphon of the river Magro to Albal) to supply fresh water for irrigation of crops in the area [4]. Consequently, the salinity of the lagoon was altered due to the constant influx of freshwater from agricultural runoff, which already possessed an almost complete barrier that prevented the entry of seawater [6,7]. The second, eutrophication, occurred in the second half of the 20th century (1972–1974) when urban and industrial growth began in the towns located to the west of the Albufera, and contributions of allochthonous organic matter and inorganic nutrients (mainly nitrogen and phosphorus) began, leading to its current hypertrophic condition [8,9,10,11].
It is important to note that the residence time in the lake also has a negative effect due to its high value (average of 42.9 days) for a shallow flushing lagoon, as demonstrated by Soria et al. [10,12]. However, it has been demonstrated that heavy rainfall and flooding can cause a significant change in the surface flow regime, and when such runoff reaches a lake, water turnover can increase rapidly [13]. However, in lakes situated within areas of high urban density, such as the Albufera, this natural surface water function can be influenced by human intervention [14].
Nevertheless, there is a sporadic occurrence of events categorized as ’flash floods’, constituting a natural phenomenon of an extreme Mediterranean weather type that is an integral component of the hydrological cycle. These events are attributable to hydro-morphological conditions inherent within the basin, in conjunction with intense and extreme rainfall and anthropogenic activity within river basins [15]. In the Mediterranean region, flash floods are considered the most dangerous and destructive natural processes, occurring in small basins and ephemeral streams and resulting in the highest number of casualties [16]. Moreover, the economic losses resulting from these events have been shown to have a significant impact on regional economic activity, particularly due to the human occupation of the affected territories [17]. A further significant feature is the brevity of the events, which typically span a mere four to six hours, resulting in limited infiltration but important runoff [18]. The frequency of these events in the Spanish Mediterranean is very high, and in the last seven centuries, 2647 cases of severe floods have been reported in these basins [19]. However, between 1950 and 2019, 395 extreme events were recorded in 19 Mediterranean countries, resulting in the deaths of over 9900 people and significant harm to 12 million individuals, according to the Emergence Events Database [20]. Concerning Spain, the research conducted by López et al. [21] estimates that between 1995 and 2014, there were 311 victims due to floods and economic losses, amounting to EUR 3.4 billion.
The meteorological situation conducive to heavy and persistent rainfall, resulting in a flash flood, is known as deep low pressure. This typically coincides with a cyclonic low pressure over the western Mediterranean and an anticyclone over the British Islands. However, the characteristics of the Mediterranean region result in the cyclone’s isolation from the atmospheric circulatory flow, leading to its maintenance in a fixed position for several hours, thereby inducing a constant wind from the sea inland. This phenomenon, known as the Foehn effect, occurs when the flow of intense, humid air reaches the mountains near the coast and undergoes persistent condensation [22]. This phenomenon was previously referred to as a ’cold drop’; however, it is now designated as an isolated high-level atmospheric depression (DANA).
On 29 October 2024, the Spanish Mediterranean coast suffered the impact of a DANA, which was exacerbated by pre-existing atmospheric conditions, causing catastrophic flooding, landslides, and significant damage to infrastructure, agriculture, and urban areas (Figure 1). With 225 deaths and economic losses estimated at more than 30 billion euros, the 2024 DANA is probably one of the largest natural disasters to hit the Valencian Community and Spain in their histories.
This event highlights the region’s vulnerability to extreme events and the need to implement adaptation and mitigation measures. This cost is ten times greater than the previous record of losses in 20 years [23]. As illustrated in Figure 1, the effects of the flash food phenomenon observed in the areas south and southwest of the city of Valencia are highlighted, with particular reference to the coastal lagoon of the Albufera de Valencia.
The primary objective of this study is to analyze the variations in hydrochemical variables during the flooding period in the Albufera of Valencia coastal lagoon. This analysis will facilitate comprehension of the immediate impacts and the resilience capacity of the wetland following extreme disturbances. From a scientific standpoint, the research will address a significant knowledge gap by providing insights into the effects of extreme events on a Mediterranean wetland in near real-time. The study will also contribute to the development of enhanced predictive models and adaptive management strategies in the context of climate change, offering valuable insights to decision-makers. Moreover, the study will contribute to raising awareness of the fragility of coastal ecosystems, demonstrating the relationship between extreme events and water quality, as well as underlining the importance of adopting conservation measures.

2. Materials and Methods

2.1. Study Zone

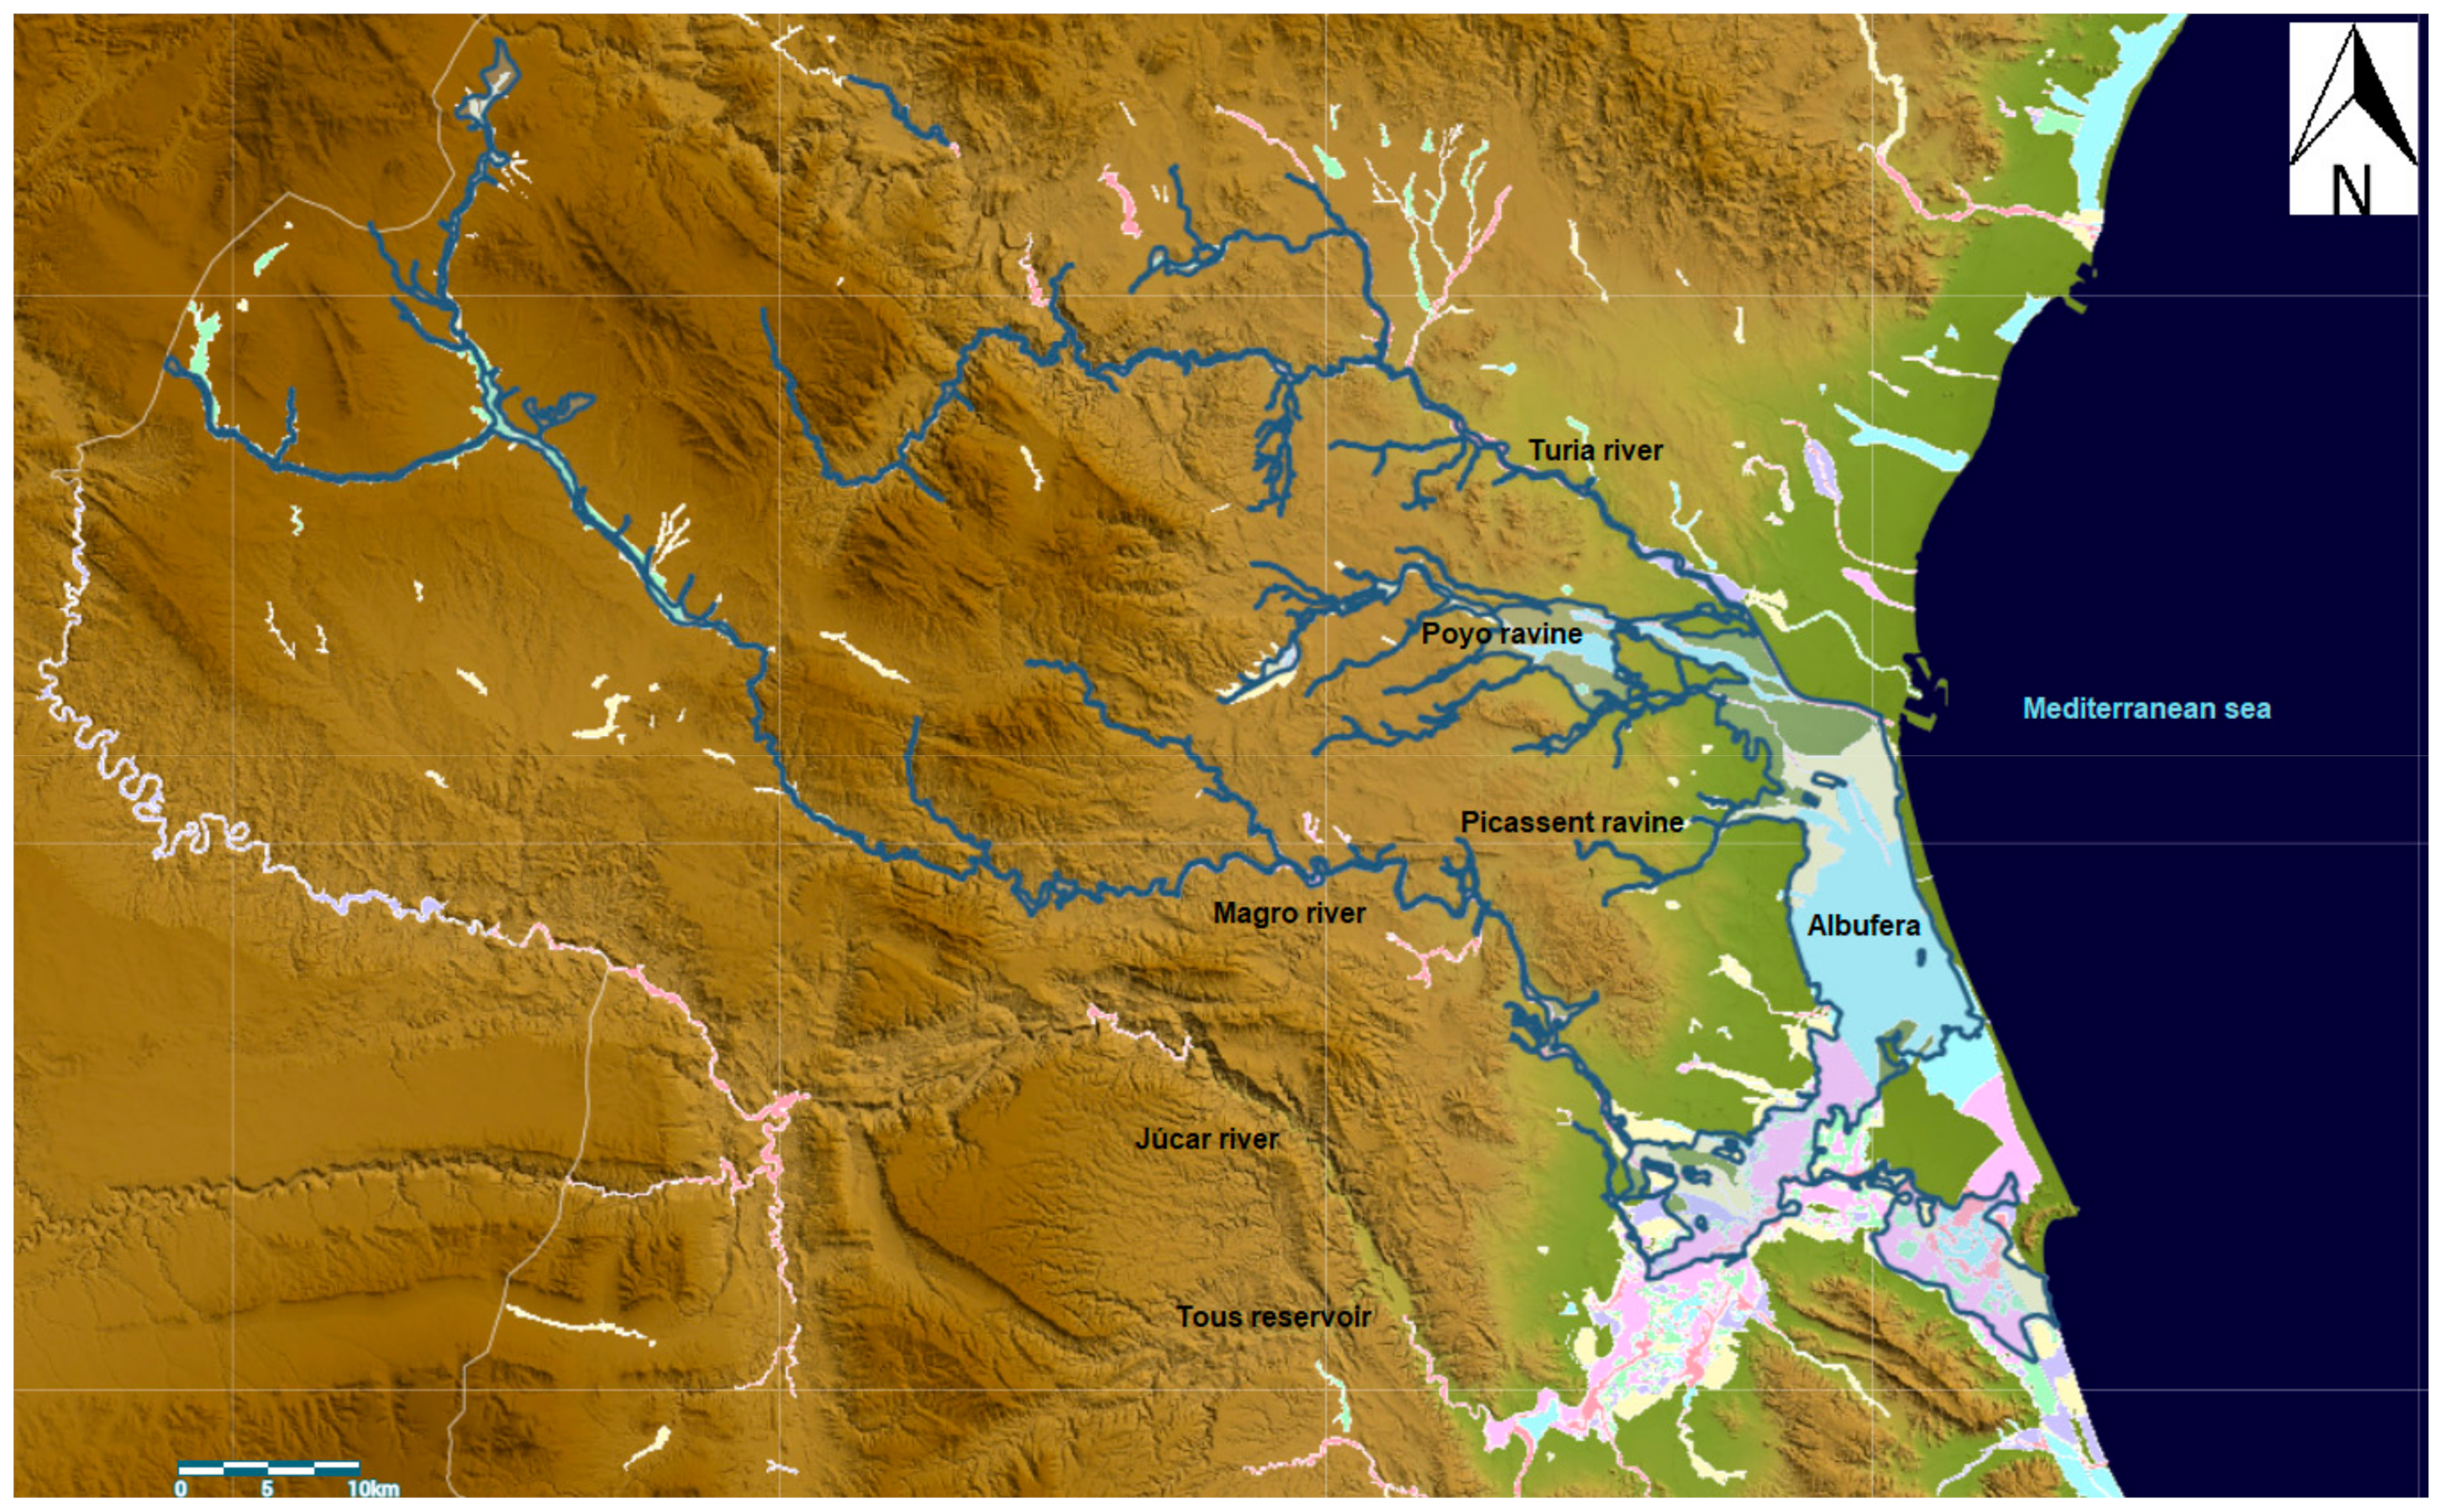
The Albufera hydrological basin (Figure 2) is located on the Iberian Peninsula, on the Mediterranean coast, in the province of Valencia. It covers an area of 917 km2 and exhibits a pronounced altitudinal range, from the sea level of the lagoon to the mountains to the west, which reach heights of approximately 1000 m above sea level over a distance of just 50 km. This creates a river basin with a substantial slope. The primary tributary is the Poyo−Torrent ravine, an artificial confluence of natural ravines that culminated in a convex alluvial cone, whose sediments, accumulated over millennia, have formed the present-day plain in conjunction with the Turia and Jucar rivers. Following two severe floods in the 18th century [24], an artificial riverbed was constructed to connect the Poyo and Gallego ravines. This new riverbed was subsequently extended to the Horteta ravine. Consequently, the watercourses that formerly flowed into the plain and subsequently into the Turia River have since circulated along a novel watercourse (the contemporary Torrent ravine) that traverses towards the Albufera and flows into the northeastern area of the lagoon.
To the west, the four so-called minor ravines of the Albufera extend 10 to 15 km through the inland areas, ultimately flowing into the plain. The waters of these ravines are channeled through wide channels that traverse the rice fields, ensuring the uniform distribution and channeling of water to inundate the fields.
It is noteworthy that although the Jucar River does not typically drain into the Albufera, there is a floodplain (see Figure 1) from the river that, during periods of overbank flooding, carries water towards the lagoon. This drainage is conducted by the channels that flow into the southeast of the rice fields and circulate towards the sea.
The Albufera basin exhibits a high level of land occupation in the immediate area, where more than 400,000 people reside and where 20% of the region’s industrial and service activities are concentrated (Figure 2). The plain, free from urban development and industrial activities, is dedicated to irrigated agriculture and orange tree crops, while the natural landscape is composed of inland and upland areas, accounting for 20% of the total territory. The area surrounding the lagoon, a former marshland, is utilized for summer rice cultivation and inundated during winter for waterfowl hunting.

2.2. Hydrological Data

The precipitation measurement was obtained from the records of the Automatic Hydrological Information System (SAIH) of the Jucar Basin Authority [25], which has a wide network of rainfall gauges spaced approximately 10 km apart, forming a mesh that covers the territory where the event occurred. The system records precipitation every five minutes; however, for the purposes of this study, hourly and daily data from 29 October 2024 were utilized. The rainfall table, which includes the location of the stations and other pertinent data on rainfall persistence, can be found in Annex 1.
The flow measurements have also been taken from the data of the Hydrological Information System of the Jucar Basin Authority on the hydrological event [25], ubicated at UTM coordinates 30S 730642 4358891 near one of the outlets to the Mediterranean Sea. However, as the watercourses of the ravines experienced overflow prior to reaching the Natural Park, not all of the measured flow through the watercourses reached the rice fields and the Albufera. Furthermore, the Jucar River overflows over the rice fields towards the Natural Park, resulting in a contribution from the south. Consequently, the volume of water in the lagoon was estimated based on its surface area (23 km2) and the level reached in the rice fields (103 km2), assuming homogeneity in both areas. The volume of water stored was estimated with the average value on 30 October, based on the surface areas and the increase in water level. The flow received was estimated from the mean volume and the number of seconds per day to obtain the value in m3/s. Finally, the peak flow value that could have arrived is calculated from the persistence of the rainfall.

2.3. Sampling Methodology

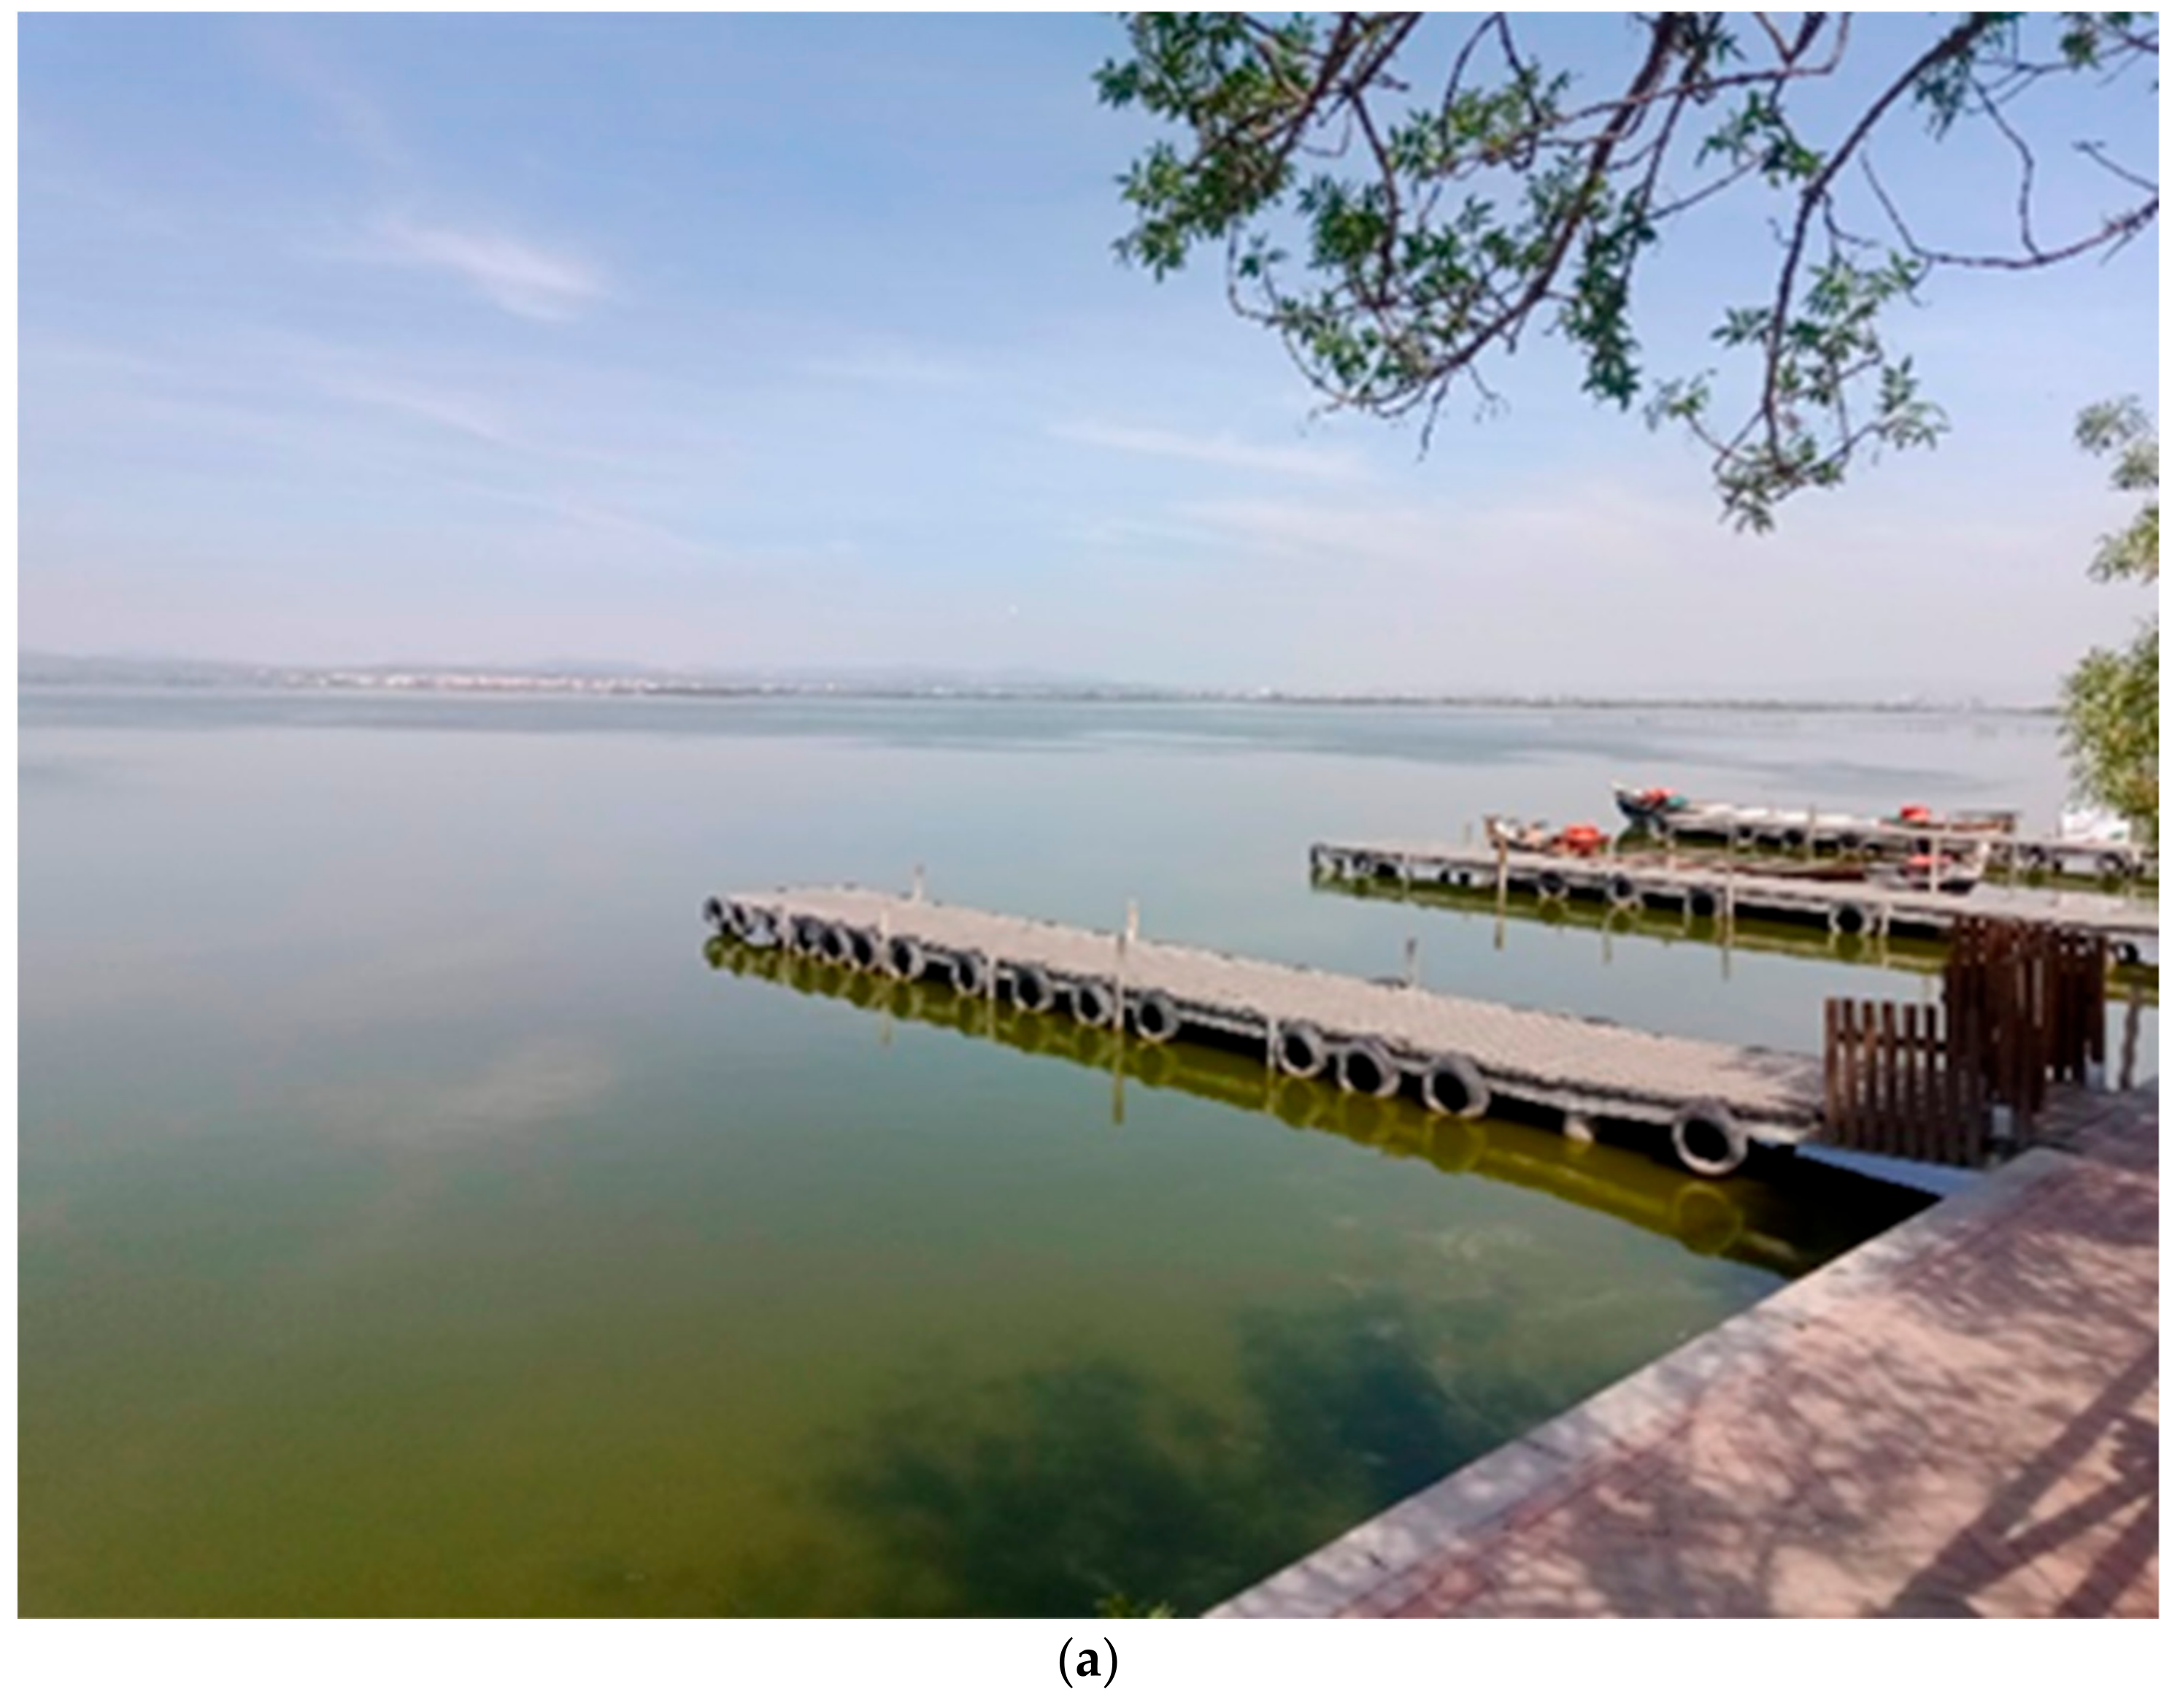
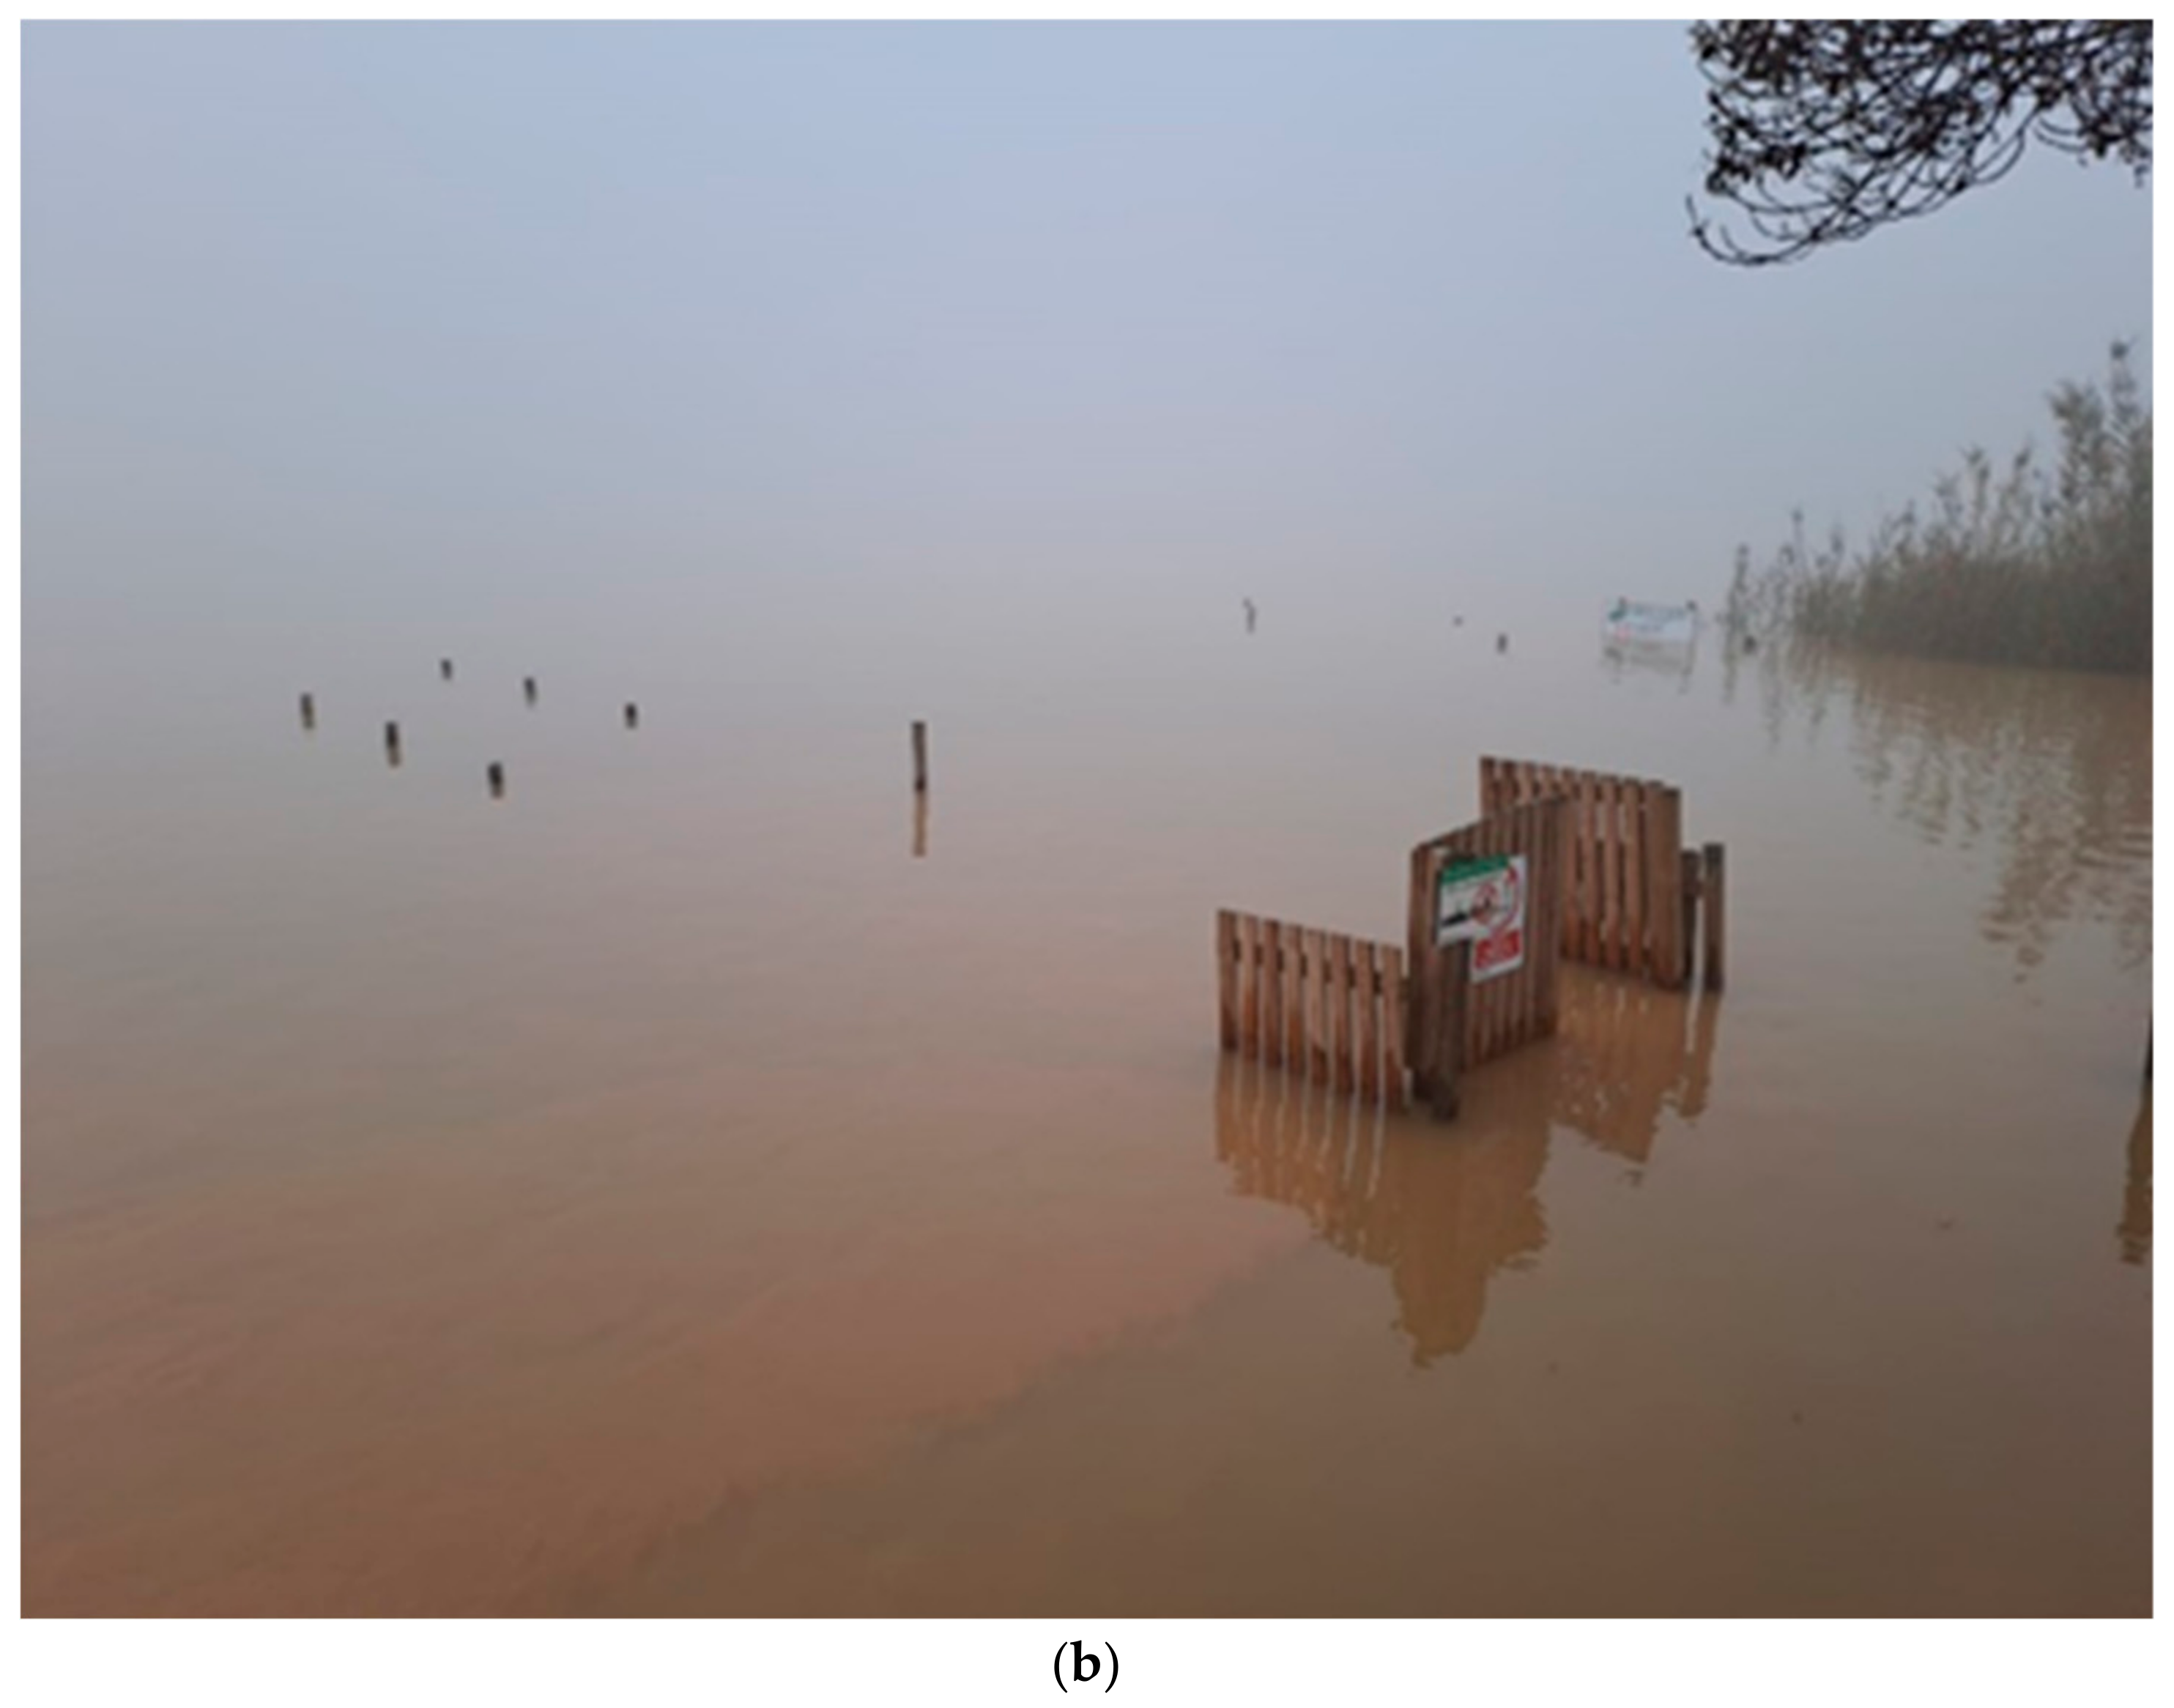
From 29th October 2024, navigation was prohibited in the lagoon to facilitate the work of the rescue teams who were seeking the bodies of those who had gone missing during the DANA. The methodology involved the collection of samples approximately on a weekly basis from a quay situated in proximity to the lagoon’s center during the month following the incident (Figure 1 and Figure A1). The UTM coordinates are 30S 730606 4358937. The point under consideration is of strategic importance due to its ease of access and its utilization as a sample site for this and other previous studies for forty years [1,8,12]. This sampling point does not offer a comprehensive representation of the spatial variability of the lake, as we can see in the thematic maps of Section 3.4, but it does provide a valuable indicator of the lagoon’s condition and its temporal heterogeneity [10] because it is located near the main outlet of the water body to the Mediterranean Sea. The environmental technical services of the Valencia City Council (owner of the lake) and the management of the Natural Park also carry out the sampling at this point, so the series of results that are preserved are very robust and homogeneous. Our research team has pre-storm data from the same point obtained during previous samplings carried out in the Albufera during 2024.
In the lagoon, a water sample was collected for physicochemical analysis in the laboratory, and temperature and conductivity were measured in situ using an EC/TDS/Temperature Tester (Hanna Instruments, Smithfield, RI, USA). Water transparency was measured using the Secchi disk depth of view.

2.4. Laboratory Analysis

The gravimetric method described in APHA [26] is used for suspended solids. A known volume of water is filtered from the samples through pre-weighed Whatman 934-AH glass fiber filters. The filters are dried again at 105 °C and reweighed. The difference in weight between the filter before and after filtration gives the concentration of suspended solids present in the water sample. Finally, they are incinerated at 460 °C in an electric furnace to remove the organic matter (loss of ignition (LOI) or particulate organic matter POM), leaving only the inorganic part.
To estimate the concentration of photosynthetic pigments in the samples, a known volume of each sample is filtered through Whatman GF/F glass fiber discs and extracted in a 1:1 solution of dimethyl sulphoxide and 90% acetone [27]. The absorbance of the samples is then measured in a spectrophotometer between 400 and 800 nm. The equations of Jeffrey and Humphrey [28] are used to calculate chlorophyll-a and the formula of Strickland and Parsons [29] for carotenes. These results are useful to indirectly know the biomass and composition of the phytoplankton community.
Total phosphorus is determined by acid digestion, according to Murphy and Riley [30]. Molybdenum blue is then formed using a mixed reagent prepared by mixing a solution of ammonium molybdate, sulphuric acid, and antimony potassium tartrate with ascorbic acid. The absorbance is measured at 882 nm [31]. For soluble phosphorus, digestion is simply omitted because filtered water is used.
To calculate the nitrate concentration, the method consists of measuring the ultraviolet (UV) absorbance of filtered water samples using a spectrophotometer and a 10 mm optical-pitch quartz cell. Nitrate is determined from the second derivative of the absorbance peak at ~224 nm [32].

2.5. Remote Sensing

The Copernicus program, which utilizes the twin Sentinel-2A and Sentinel-2B satellites, offers a unique instrument for environmental monitoring thanks to its capacity to capture multispectral images with a resolution of up to 10 m and a revisit time of approximately 5 days [33]. This high frequency and resolution facilitate comprehensive monitoring of phenomena such as DANA. Conversely, Landat-8 and Landsat-9 imagery obtained from the United States Geological Survey (USGS) has provided visual documentation of the extent of flooding on 30th October 2024 (Figure 1).
The utilization of SNAP 9.0 software (Brockmann Consult, Hamburg, Germany), employing the specific equations derived from prior studies, enables the generation of water masks and quality maps encompassing variables such as chlorophyll-a, transparency, and suspended solids. This approach facilitates the analysis of the lake’s evolution before, during, and after the event, thereby enabling the identification of patterns and trends from a more comprehensive and detailed perspective, thus complementing in situ data.
The equation for chlorophyll-a concentration, indicative of the total phytoplankton biomass, is as follows [34]:
C h l a ( m g   m 3 ) = 104.1 × T B D O 2 + 221.14 · T B D O + 2
where TBDO is
T B D O = R 740 × ( R 665 1 R 705 1 )
Total suspended solids (TSS), which refers to the total amount of solid particles suspended in water, including both organic and inorganic matter, and whose measurement is crucial for assessing water quality, can be estimated in the Albufera of Valencia using the following equation [35]:
T S S m g   L 1 = 705.98 × R 783 × R 705 × R 490 1
The Secchi disk depth (ZSD) is defined as the vertical distance at which the Secchi disk, an instrument used to measure water transparency, is no longer visible to the human eye. This measurement is an important indicator of water clarity and is related to the penetration of light into the water column. The following equation can be used to estimate the ZSD in the Albufera of Valencia [36]:
Z S D m = 0.4242 × R 560 R 705 0.0577

2.6. Data Analysis

In order to undertake a statistical analysis, the normality of the data was initially assessed using the Shapiro–Wilk test. Subsequently, a logarithmic transformation (base 10) was applied to all variables in order to ensure homogeneity in the analysis, except pH. Later, a linear regression fit was performed for each variable to explore possible temporal relationships. Furthermore, the non-parametric Mann–Kendall test was utilized to identify significant trends within the specified time range, thereby assessing alterations in water quality variables prior to, during, and following the DANA event. Additionally, a principal component analysis (PCA) was conducted on the normalized data to ascertain whether the samples exhibited clustering according to the differences between the pre- and post-DANA periods.
To ascertain whether there were significant differences between means before and after the DANA event, the samples immediately before the event and the three samples after the event were selected. These samples were then grouped into two sets: one corresponding to the pre-event values and the other to the post-event values. For variables that followed a normal distribution, the t-test was applied to compare the means between the two groups. For variables that did not follow a normal distribution, the Mann–Whitney test was used to compare the distributions of the two groups, as this test does not require the data to follow a normal distribution.
The data processing was conducted utilizing the Microsoft Excel spreadsheet program, while descriptive and multivariate statistics were performed using PAST 4.05 software.

3. Results

3.1. Hydrology, Precipitation, and Rainfall

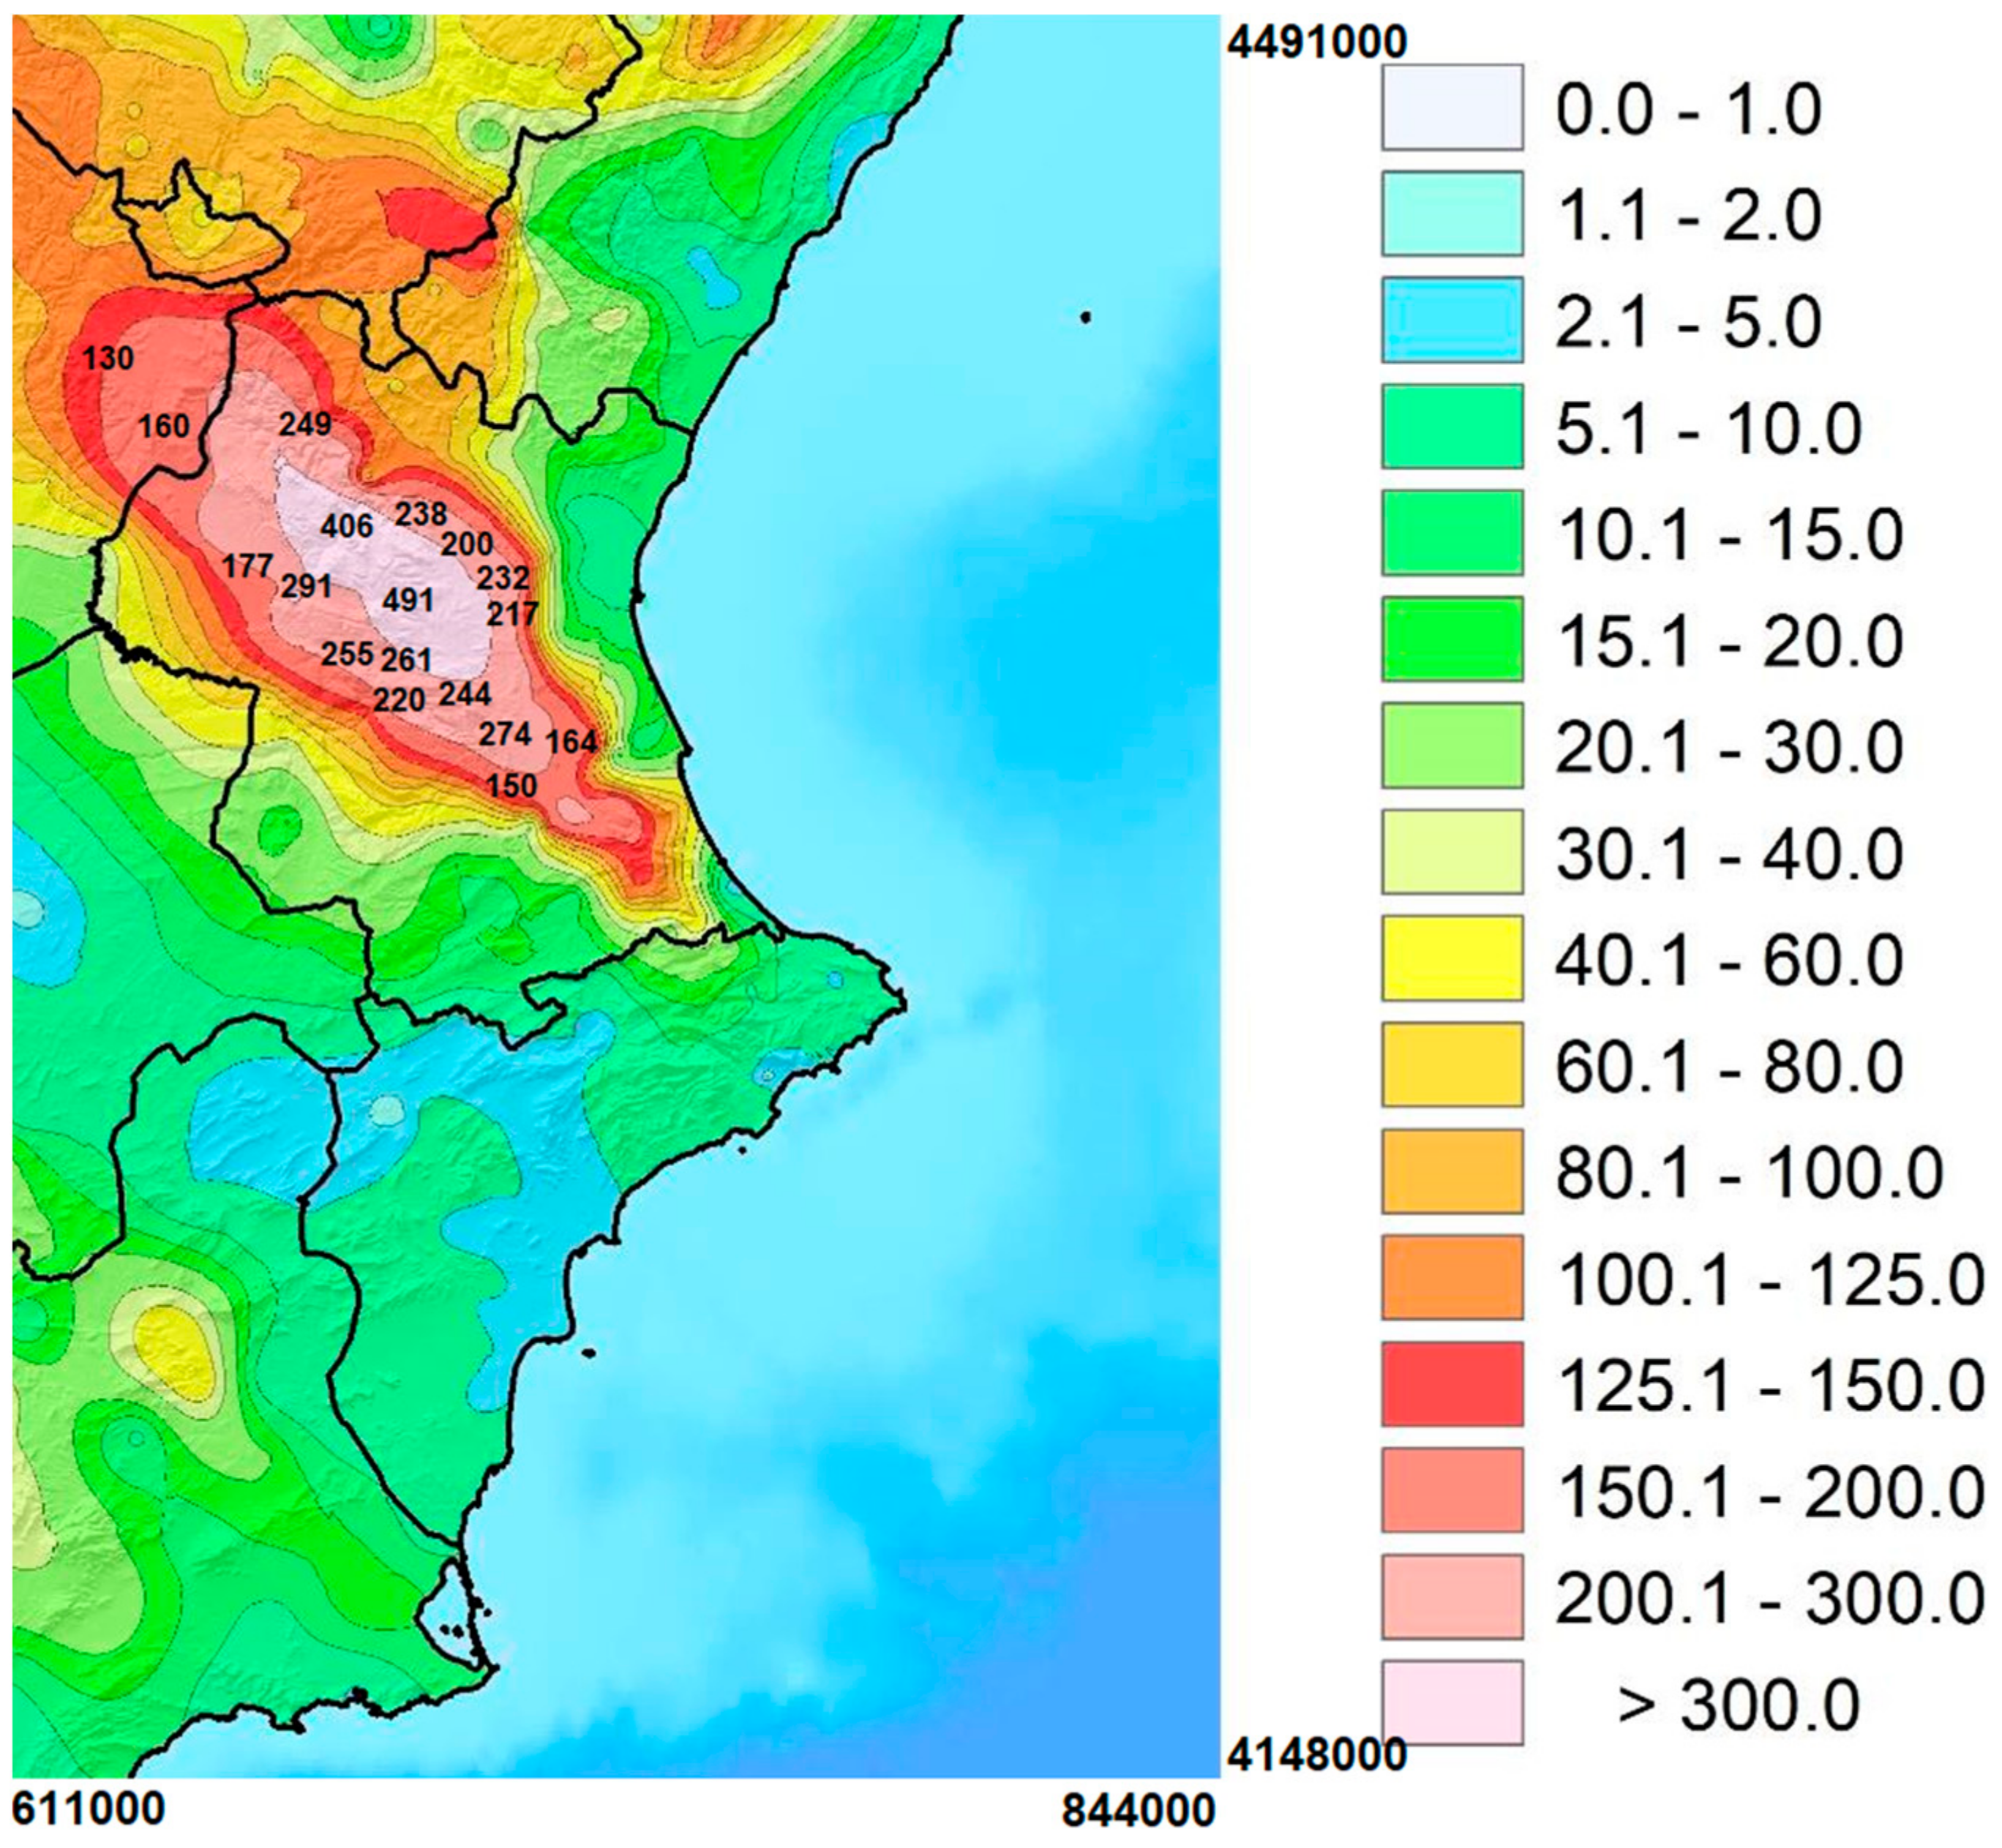
The rainfall accumulated on 29 October 2024, the comprehensive list of which is provided in Table A1, constitutes a historical record at certain measuring stations. Eleven stations recorded rainfall volumes in excess of 200 mm within a 24 h period, with two stations even surpassing 400 mm. The intensity of the precipitation is emphasized, as the observed accumulations (corresponding to the 24 h period) were produced within a limited timeframe, indicating the persistence of the rain in a maximum of twelve hours in one case, nine to ten hours in two cases, and less than nine hours in the remaining cases. This provides a quantitative indication of the intensity of the precipitation during the specified period. Figure 3 presents the cumulative rainfall map, which has been interpolated from the data collected by the State Meteorological Agency (AEMET) and included in this study, as well as from other unofficial yet contrasted rainfall gauges.
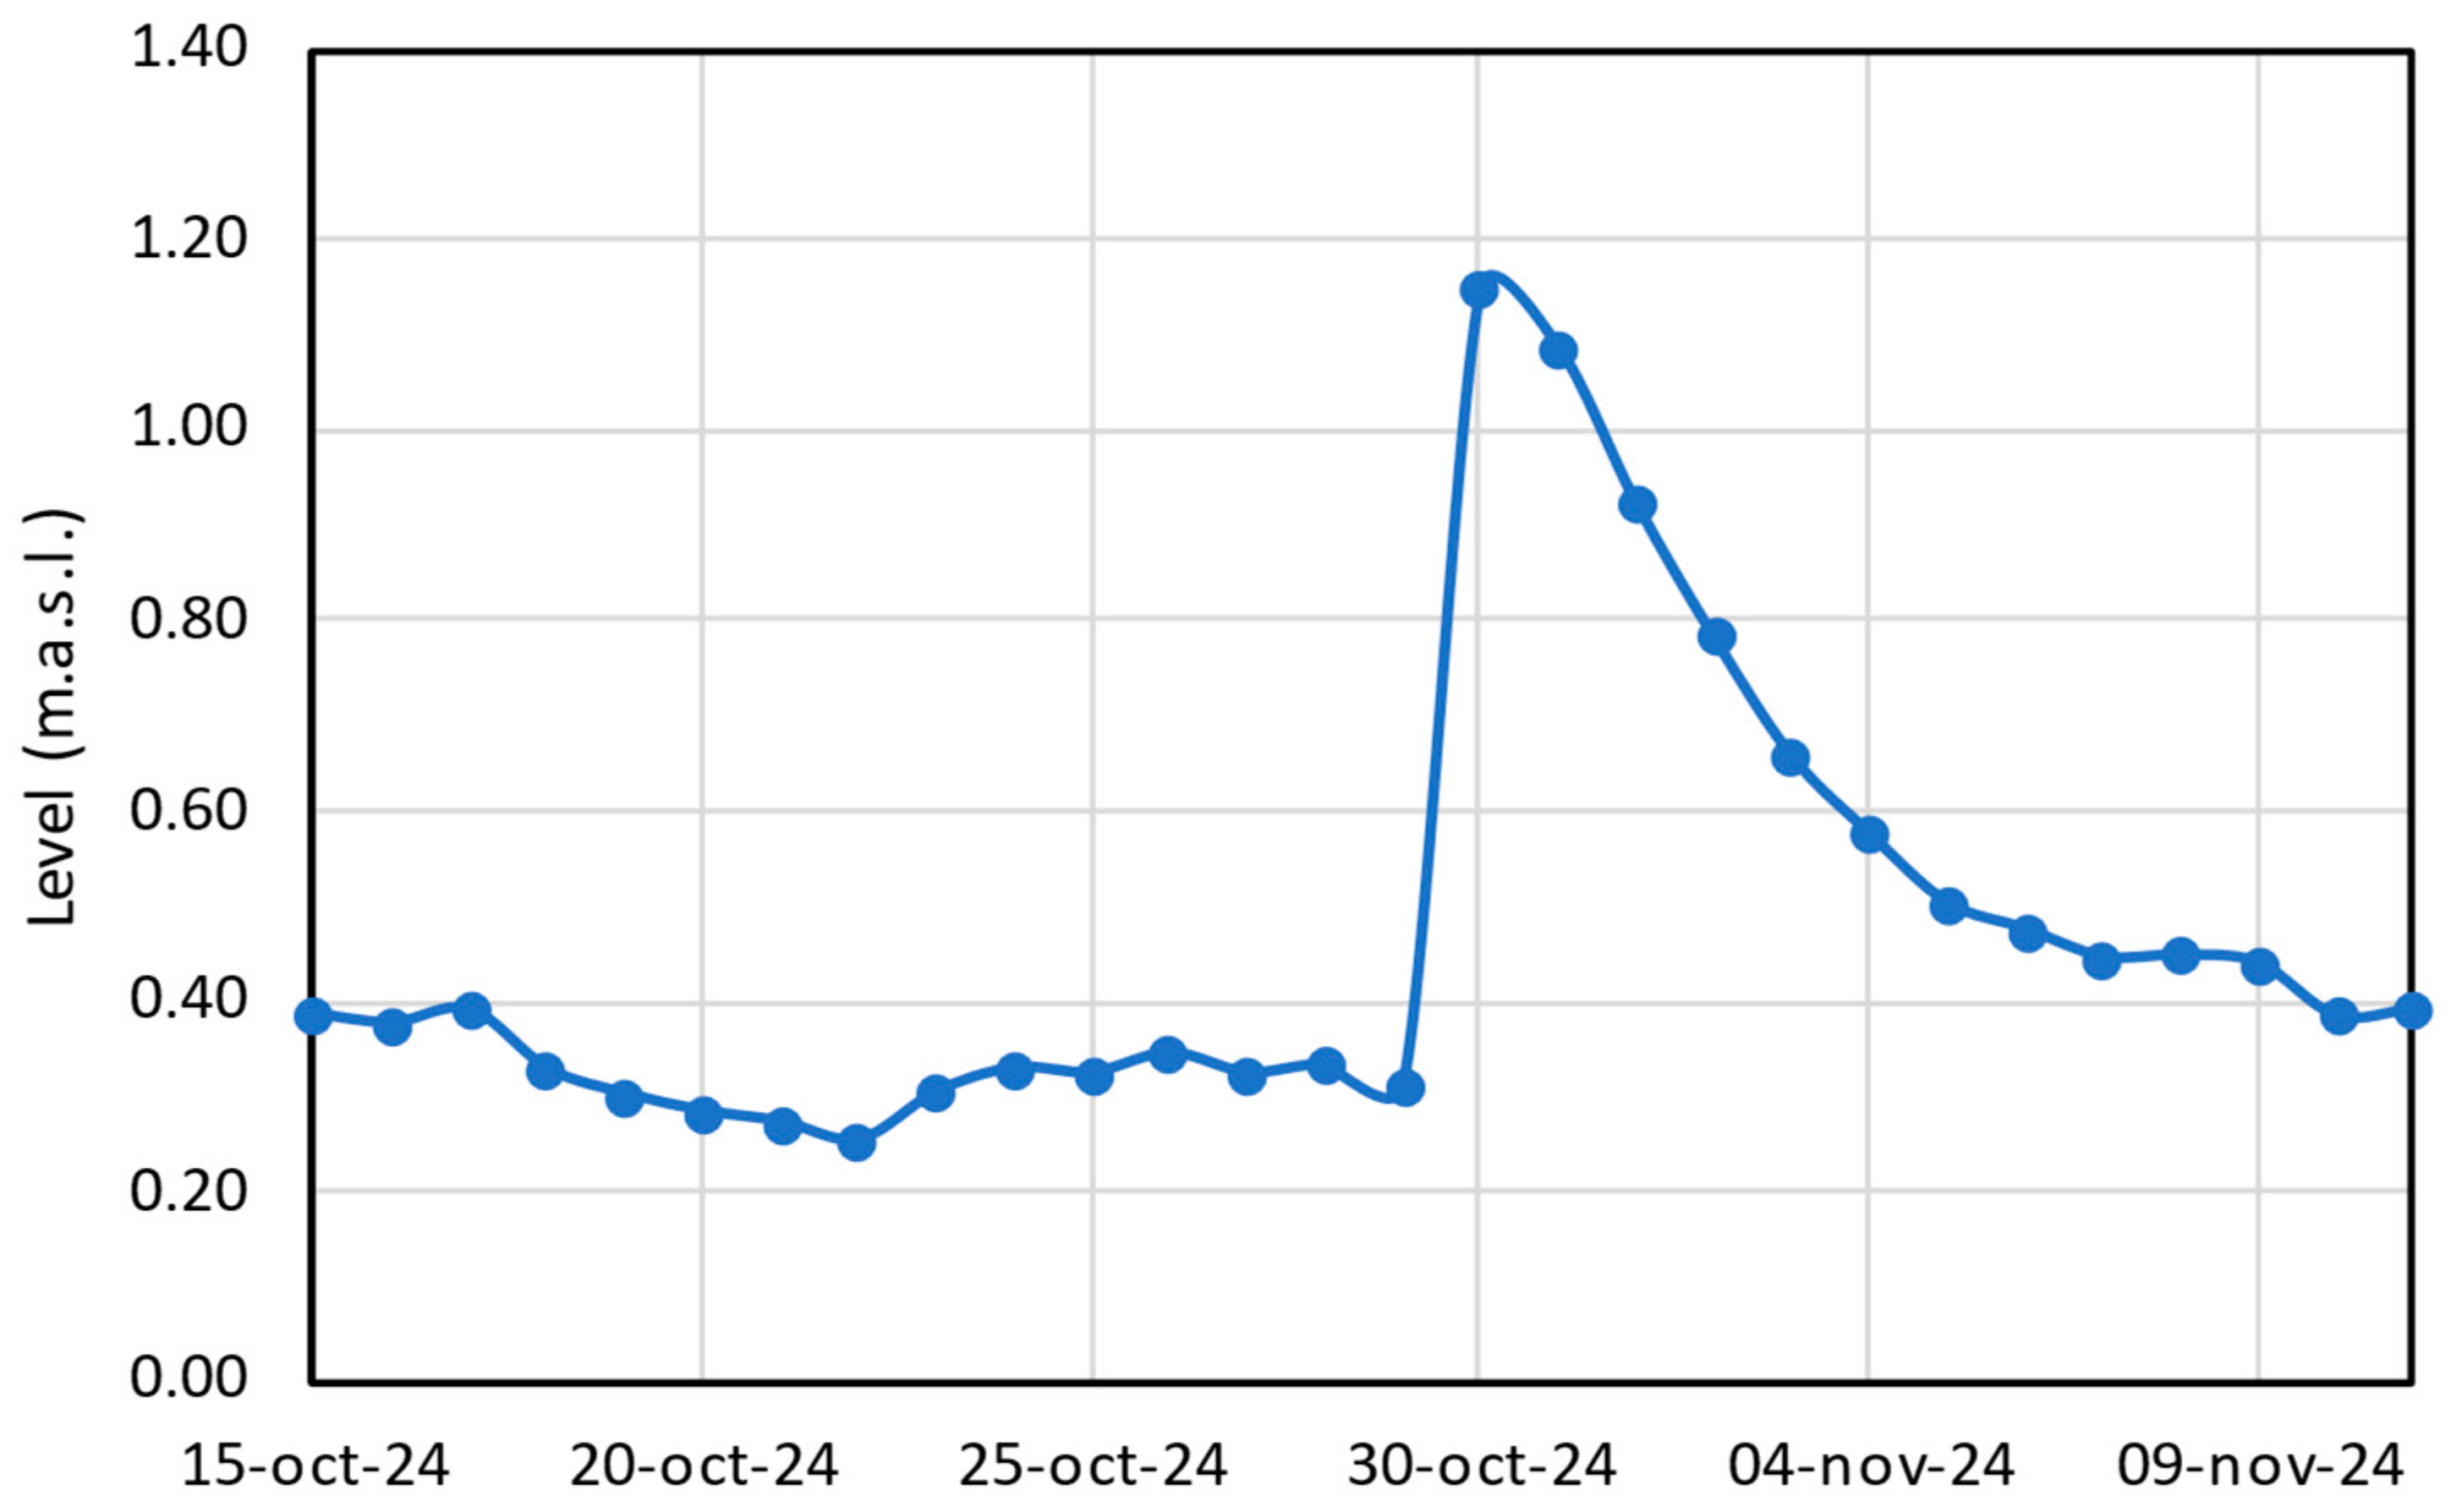
The rainfall dropped subsequently became runoff, which circulated through the various watercourses that flow into the Albufera. This resulted in a net increase in the level recorded by the Jucar Basin Authority measuring station, with an average daily rise of 84 cm being observed with respect to the previous day. The record for this rise is presented in Figure 4, with the maximum value observed on 30 October and a slight decrease on the 31st. It is noteworthy that on these two days, the lagoon’s level remained elevated and exhibited minimal fluctuations, with the outflow gates to the sea in a maximum open position. This resulted in an inflow-by-outflow phenomenon, whereby the level increased until the maximum draught was attained, and the lagoon discharged an equivalent volume of water into the sea as it received, a process that can only be gauged through the outflow through the channel to the sea at approximately 300 m3/s.
The maximum level attained by the lake between 29 and 30 October, as indicated by the marks recorded on the wall where the measuring scale is situated, was 1.20 m above sea level. The lake’s lowest point, designated as the bottom, is recorded at −0.70 m below sea level. The average increase in level from the 29th to the 30th of October was 84 cm. We estimated the area of flooded rice fields using the water mask from the Landsat-8 image of 30 October 2024 (Figure 1) as 126 km2. Utilizing the surface area of the lake and the rice fields as parameters, the ensuing results were obtained:
  • Increase in volume in the lake: 19.32 × 10⁶ m3;
  • Increase in volume in the rice paddies: 86.5 × 10⁶ m3;
  • Average inflow to the whole of the Natural Park plus the lagoon on 30 October, including the estimated inflow-by-outflow of water during the hours when there is no increase in level, was 1525 m3 s−1;
  • The maximum flow discharged to the sea on 1st November was 380 m3 s−1 without considering the possible inflows to the system by runoff from the flooded area outside the Natural Park, where the water level was not measured.

3.2. Hydrochemical Results

Table 1 displays the values obtained for the various physicochemical and biological variables on the dates sampled prior to and following the DANA event. These include water quality-related variables such as conductivity (Cond), suspended solids (TSS), organic matter (LOI), nitrate, total phosphorus (TP), carotenoids (Car), chlorophyll-a (Chl-a), and colored dissolved organic matter (CDOM).
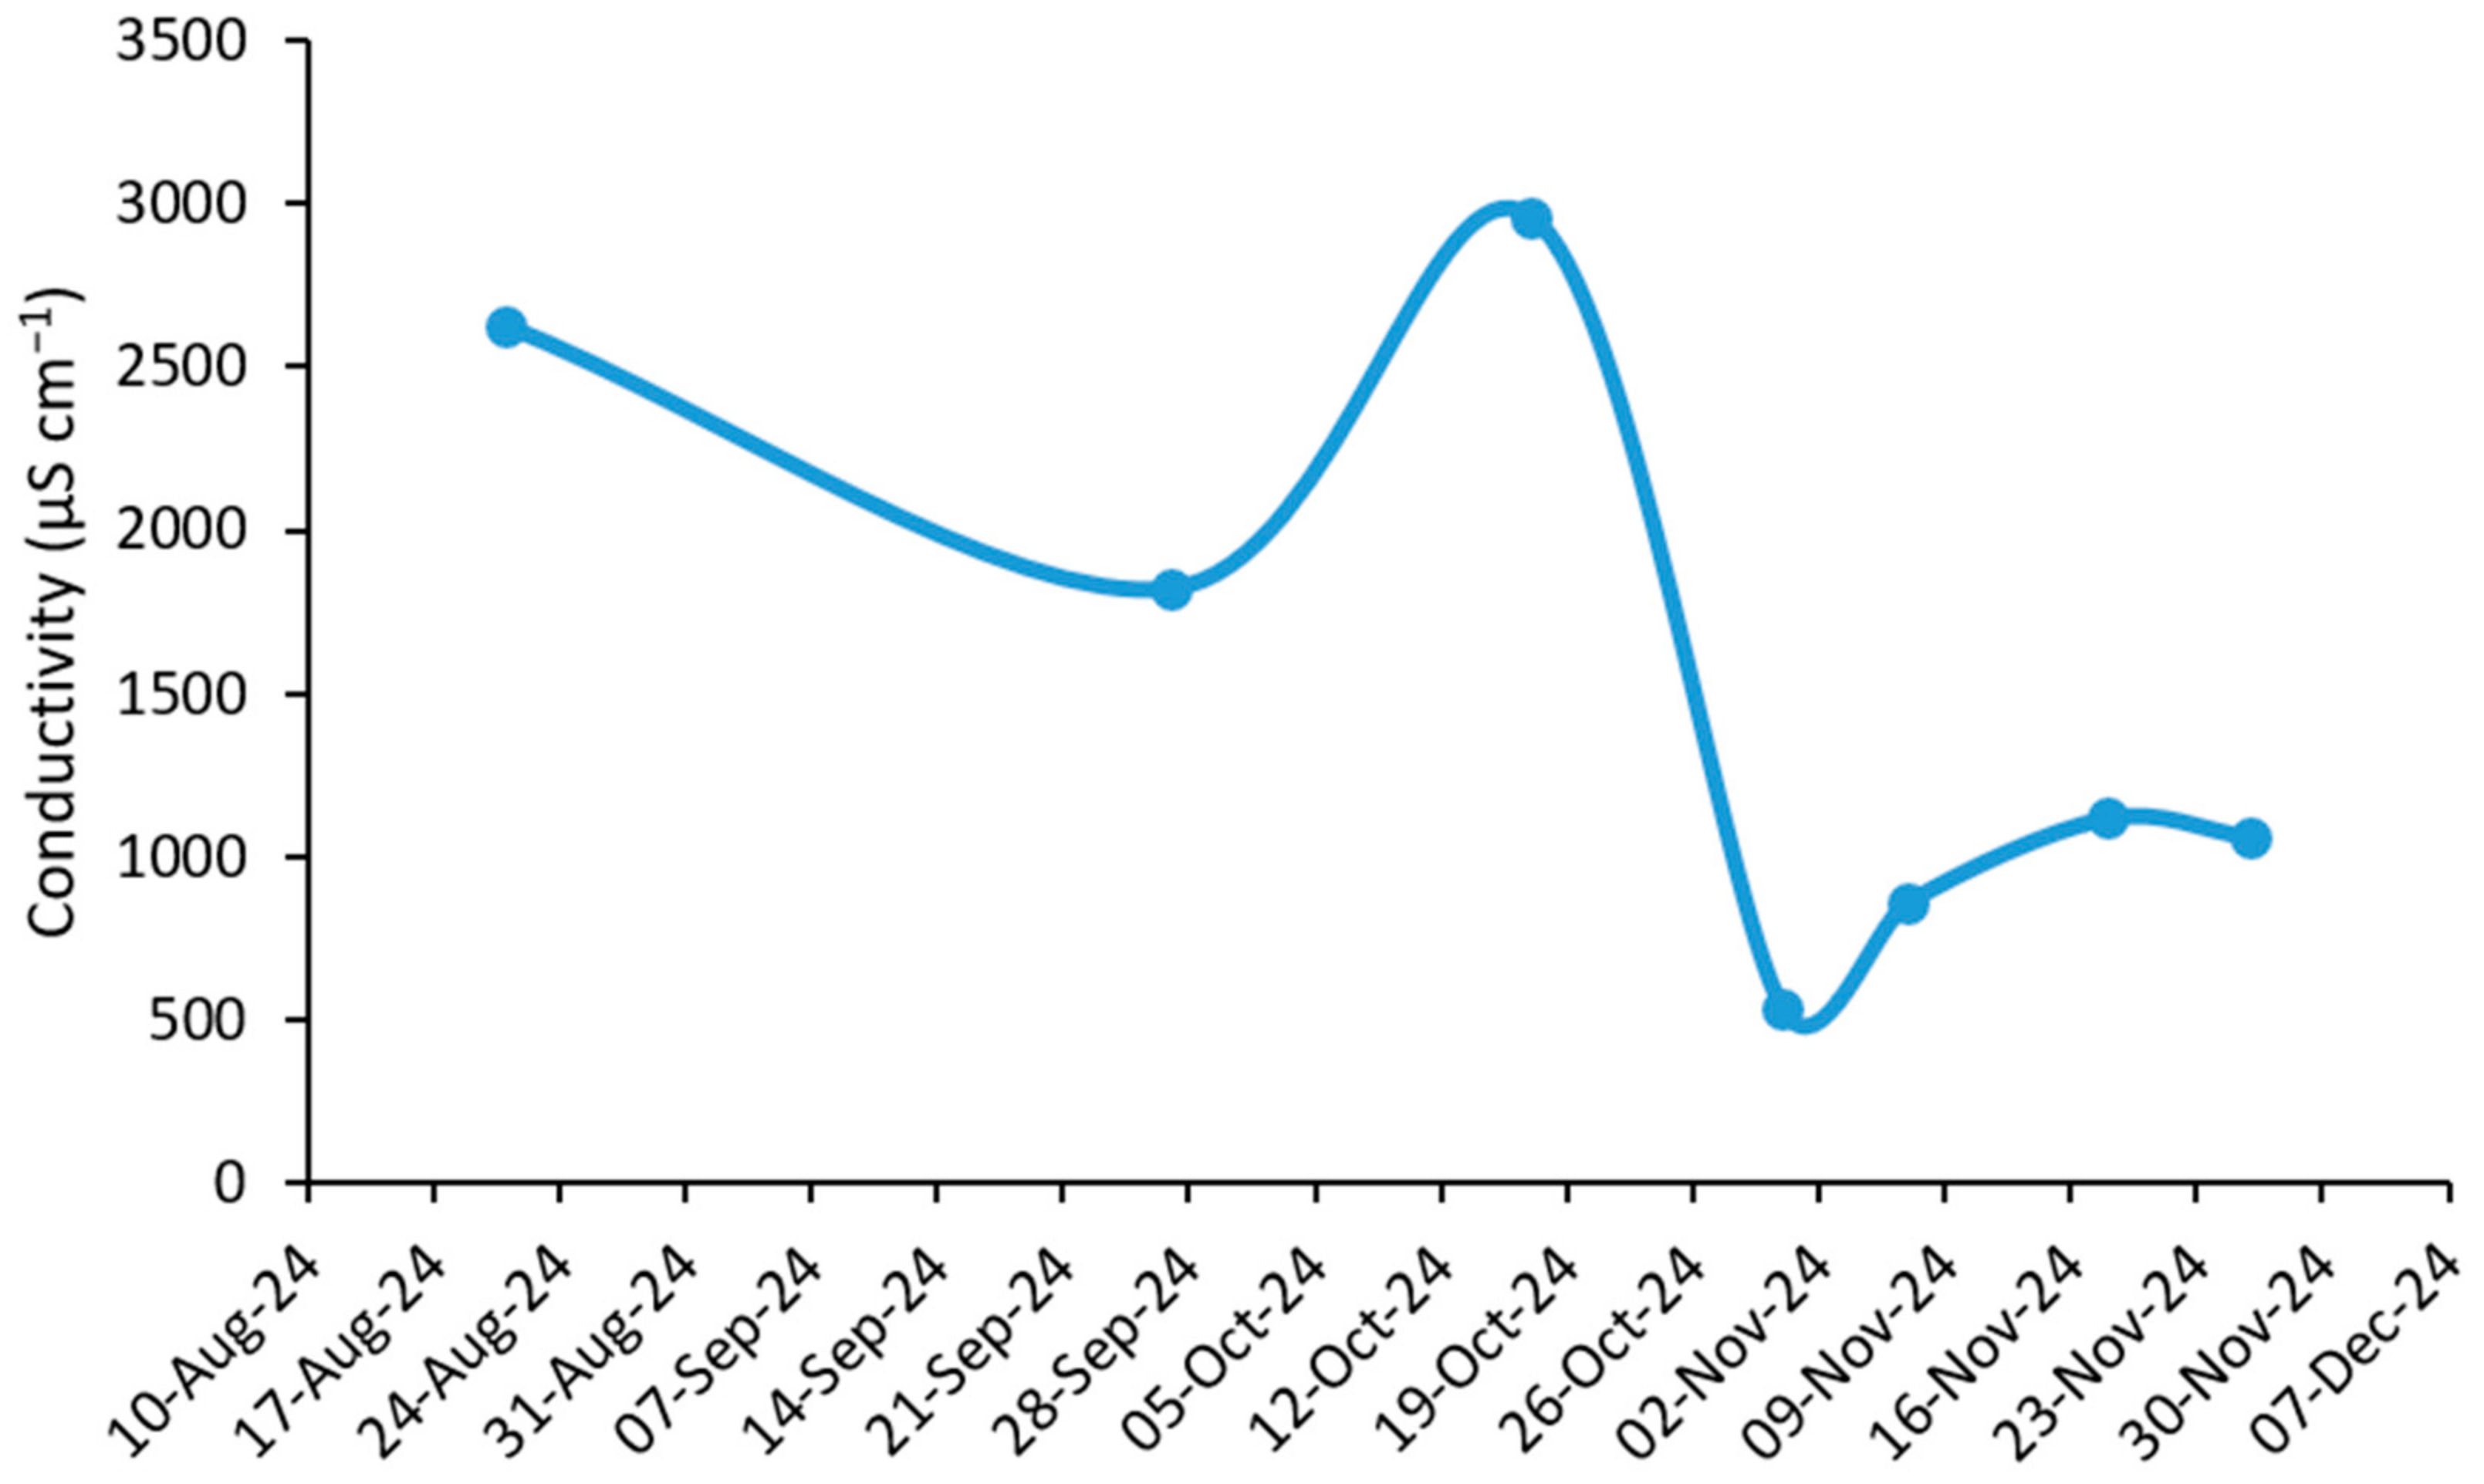
The results demonstrate a substantial decline in conductivity following the DANA event (see Figure 5), with a minimum value of 539 µS cm−1 recorded on 31 October, just two days after the event. Previously, between September 18 and 21, there had already been significant rainfall, with an accumulated 68 mm, which produced the first moderate decrease in conductivity from 2626 µS cm−1 on 21 August to 1821 µS cm−1 on 27 September. Subsequently, only 10 mm of precipitation was collected in the following month (from 22 September to 22 October), so that on October 17, the conductivity was 2961 µS cm−1. During November, the conductivity increased slowly to the usual values on some days.
Although conductivity began to increase in the following weeks, one month after the event, on 18 November, the values barely reached 1117 µS cm−1, still far from typical values. These results reflect the extraordinary impact of the event on the water renewal of the lake, whose salinity remains significantly lower even long after the event.
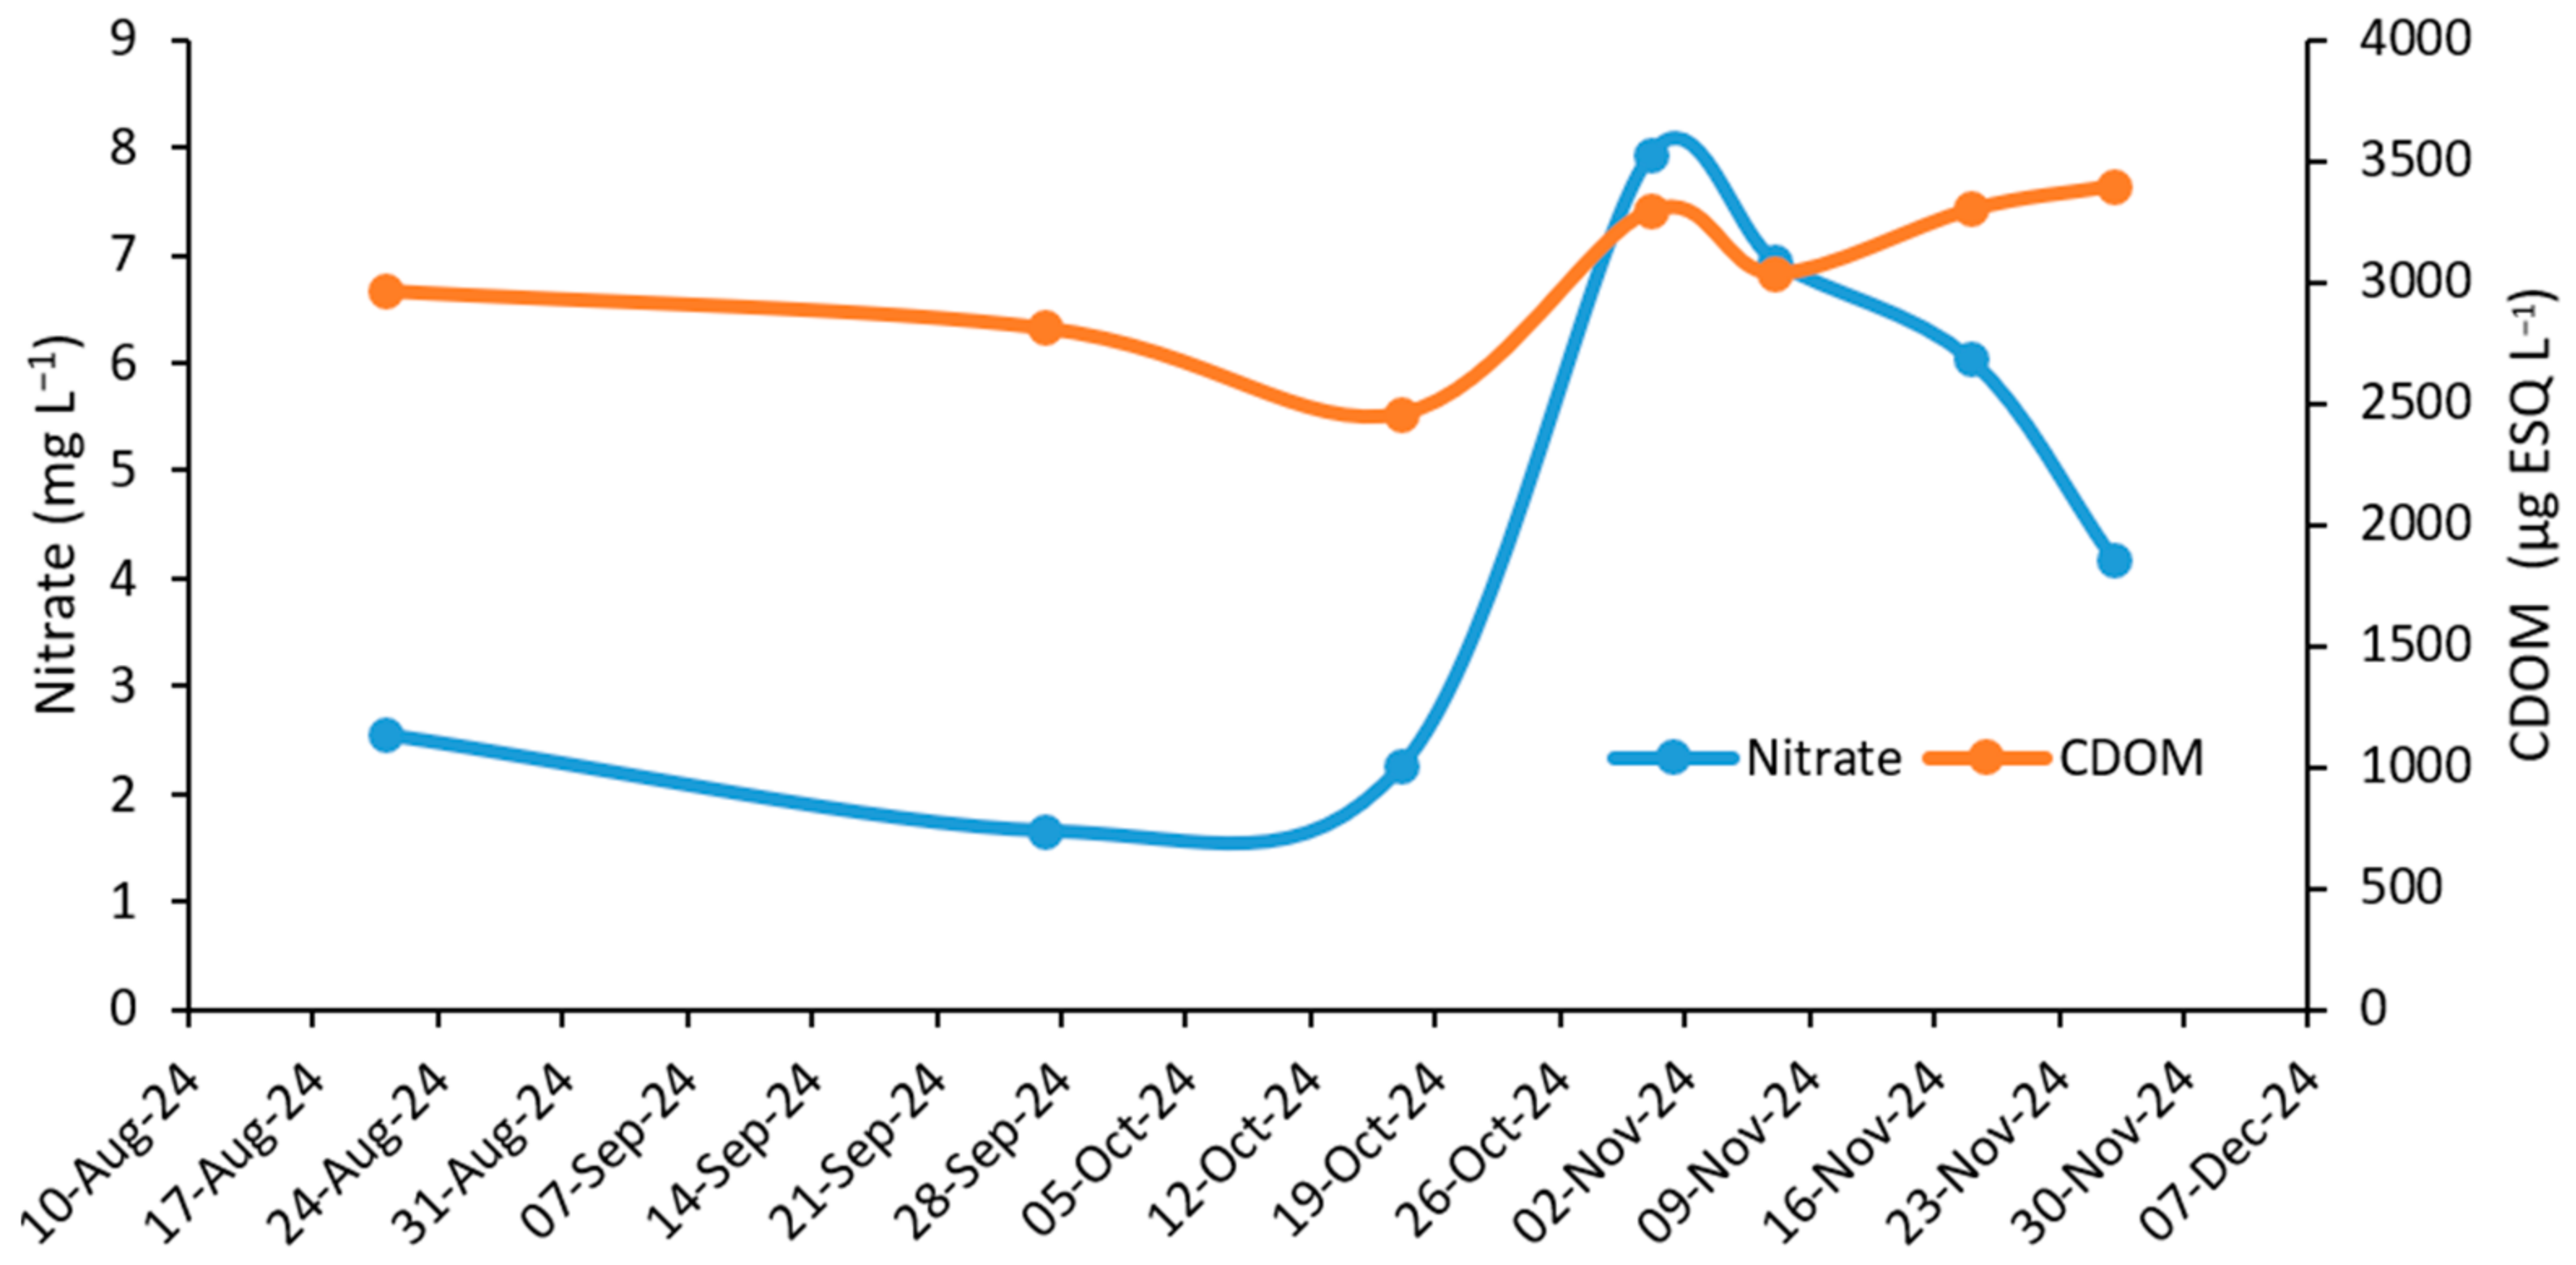
As demonstrated in Figure 6 and Figure 7, the temporal evolution of the inorganic nutrients analyzed in this study is evident. Nitrate demonstrates a substantial increase, reaching a concentration that is quadruple the initial level following the influx of water resulting from the DANA. In contrast, the colored dissolved organic matter (CDOM) exhibited a more moderate increase following the event. A few days later, its values decrease and then recover and stabilize at levels slightly higher than those usually recorded, suggesting complex dynamics associated with the mixing and renewal of water in the lake.
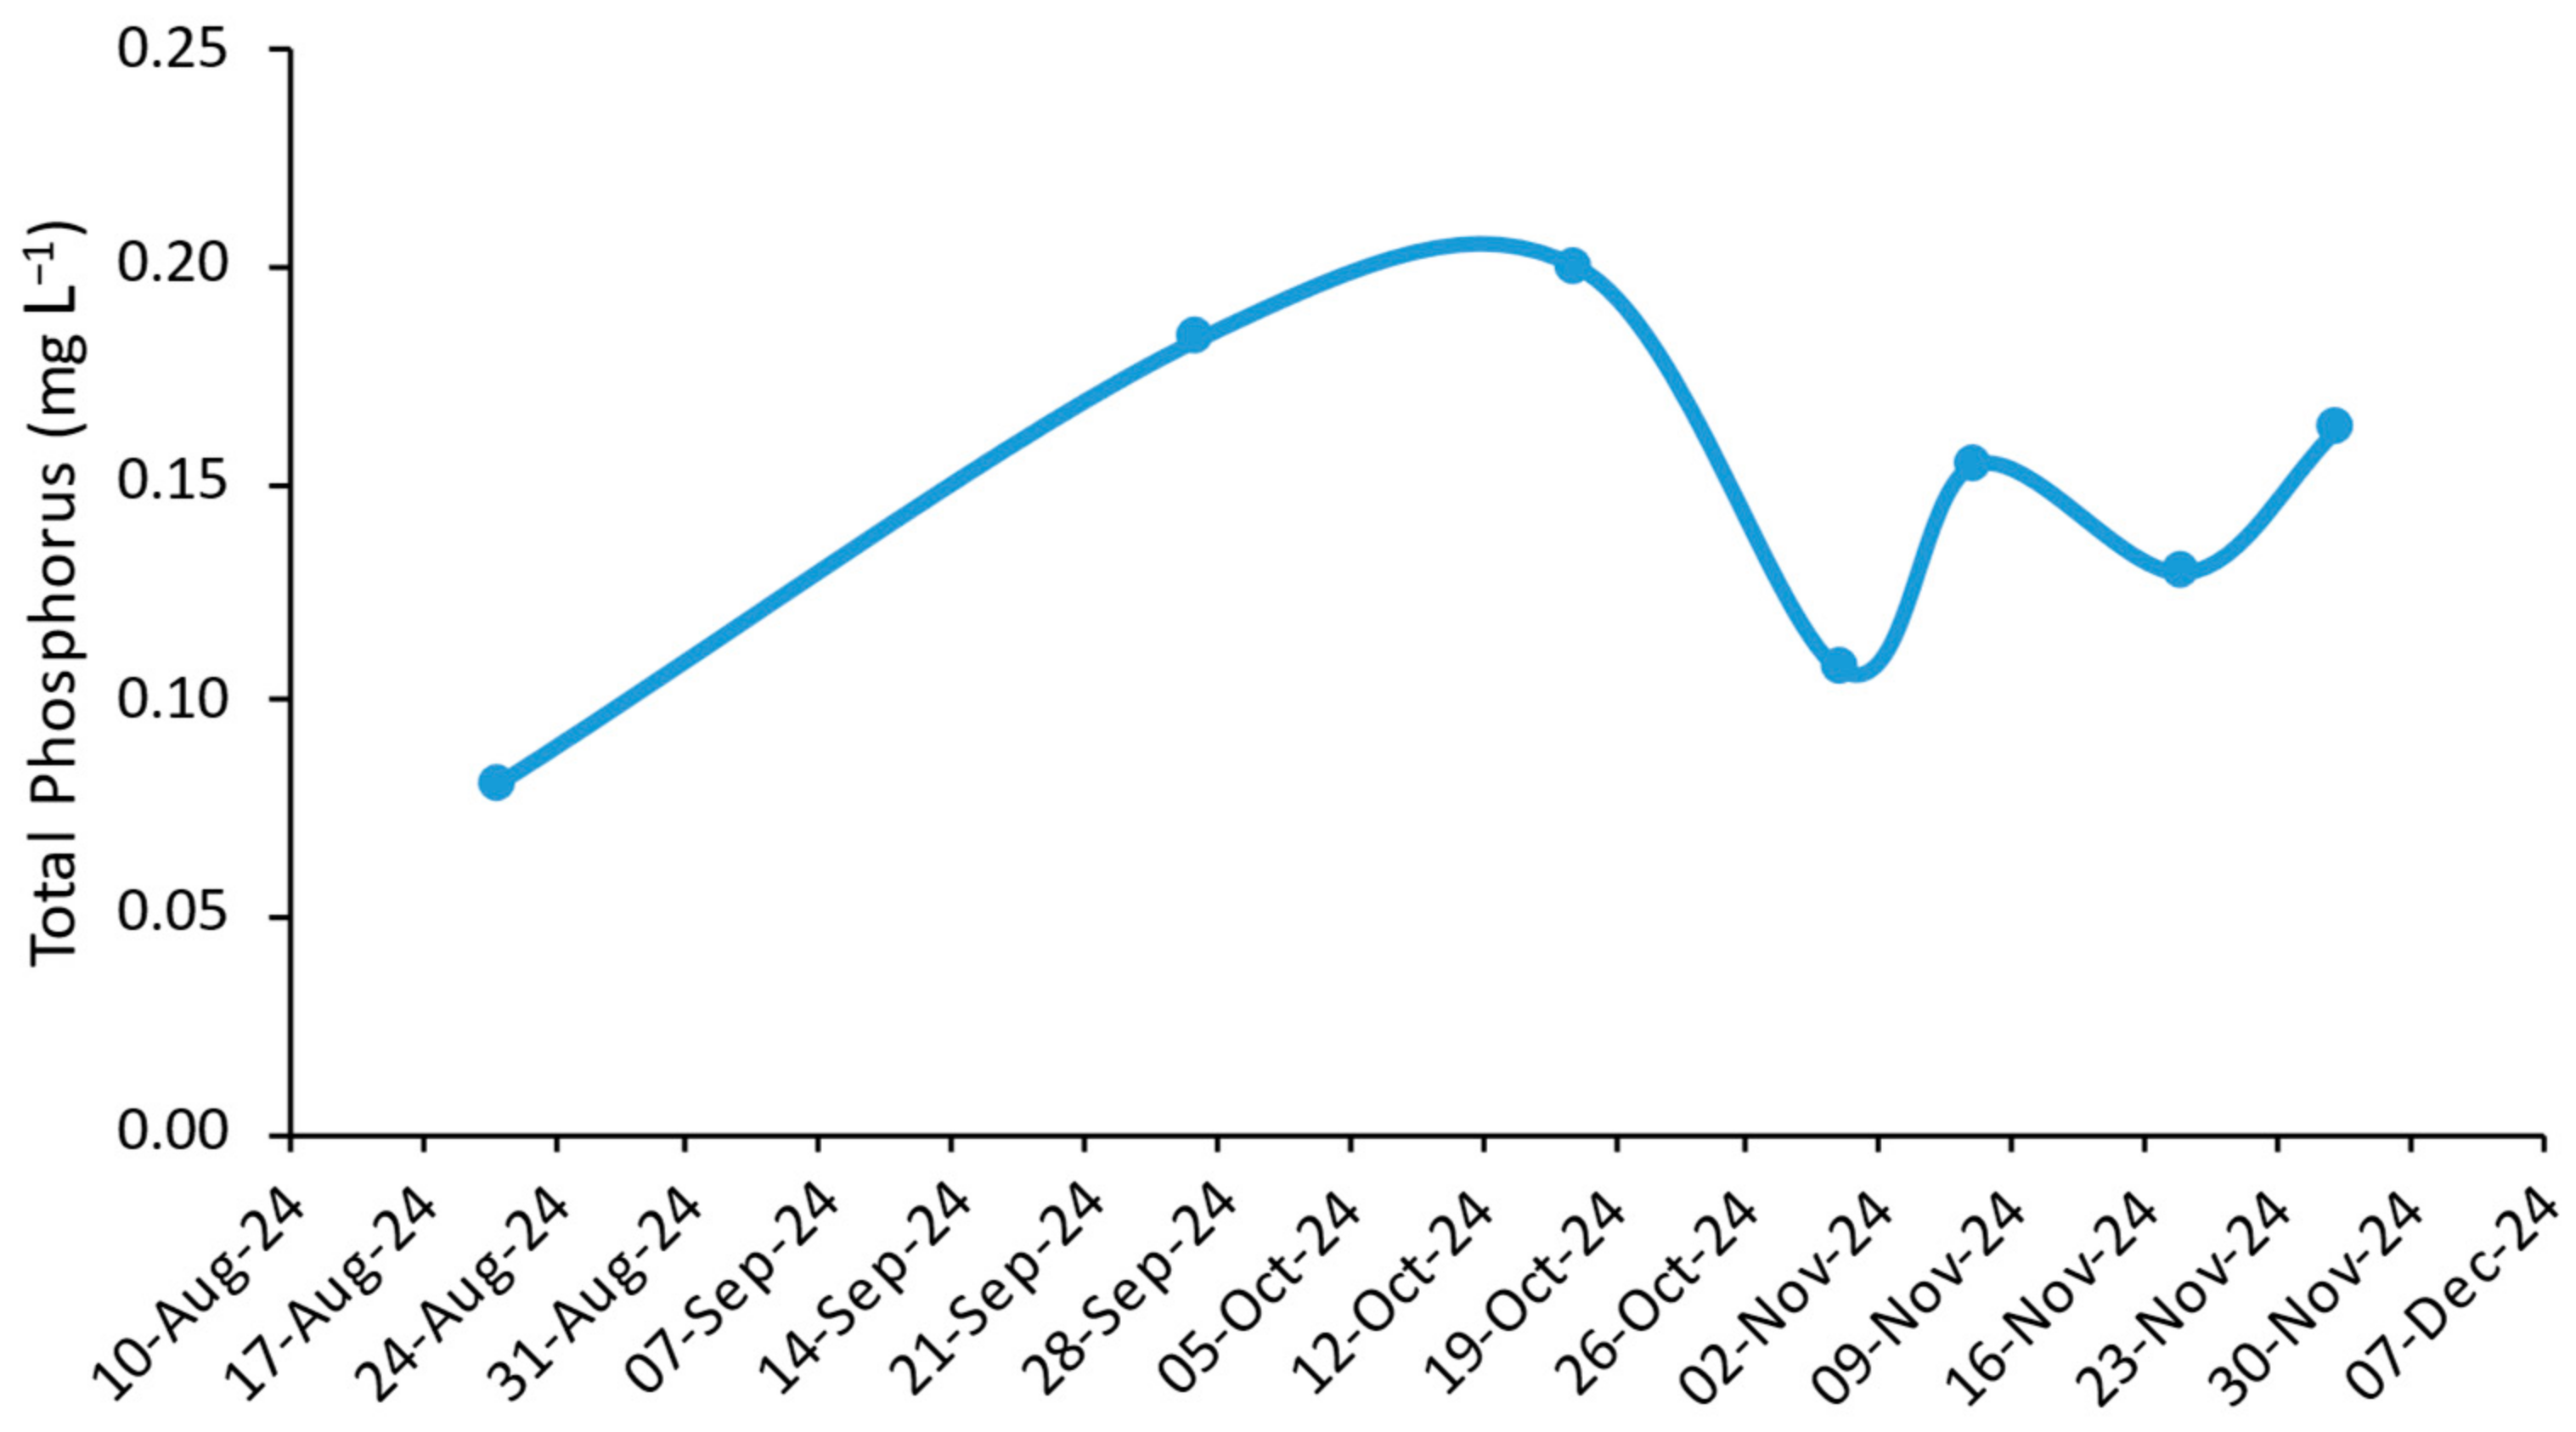
The behavior of phosphorus in the lagoon (see Figure 7) following the DANA exhibited a divergent pattern from that observed for nitrate. Prior to the DANA, phosphorus concentrations remained within the range of 0.18–0.20 mg L−1; however, a significant decline was observed, with concentrations dropping to 0.11 mg L−1, which is nearly half of the initial level two days after the event. Thereafter, a gradual increase in values was observed, reaching 0.16 mg L−1 on 26 November, suggesting a recovery process in the system. However, these values are not considered favorable from an ecological standpoint.
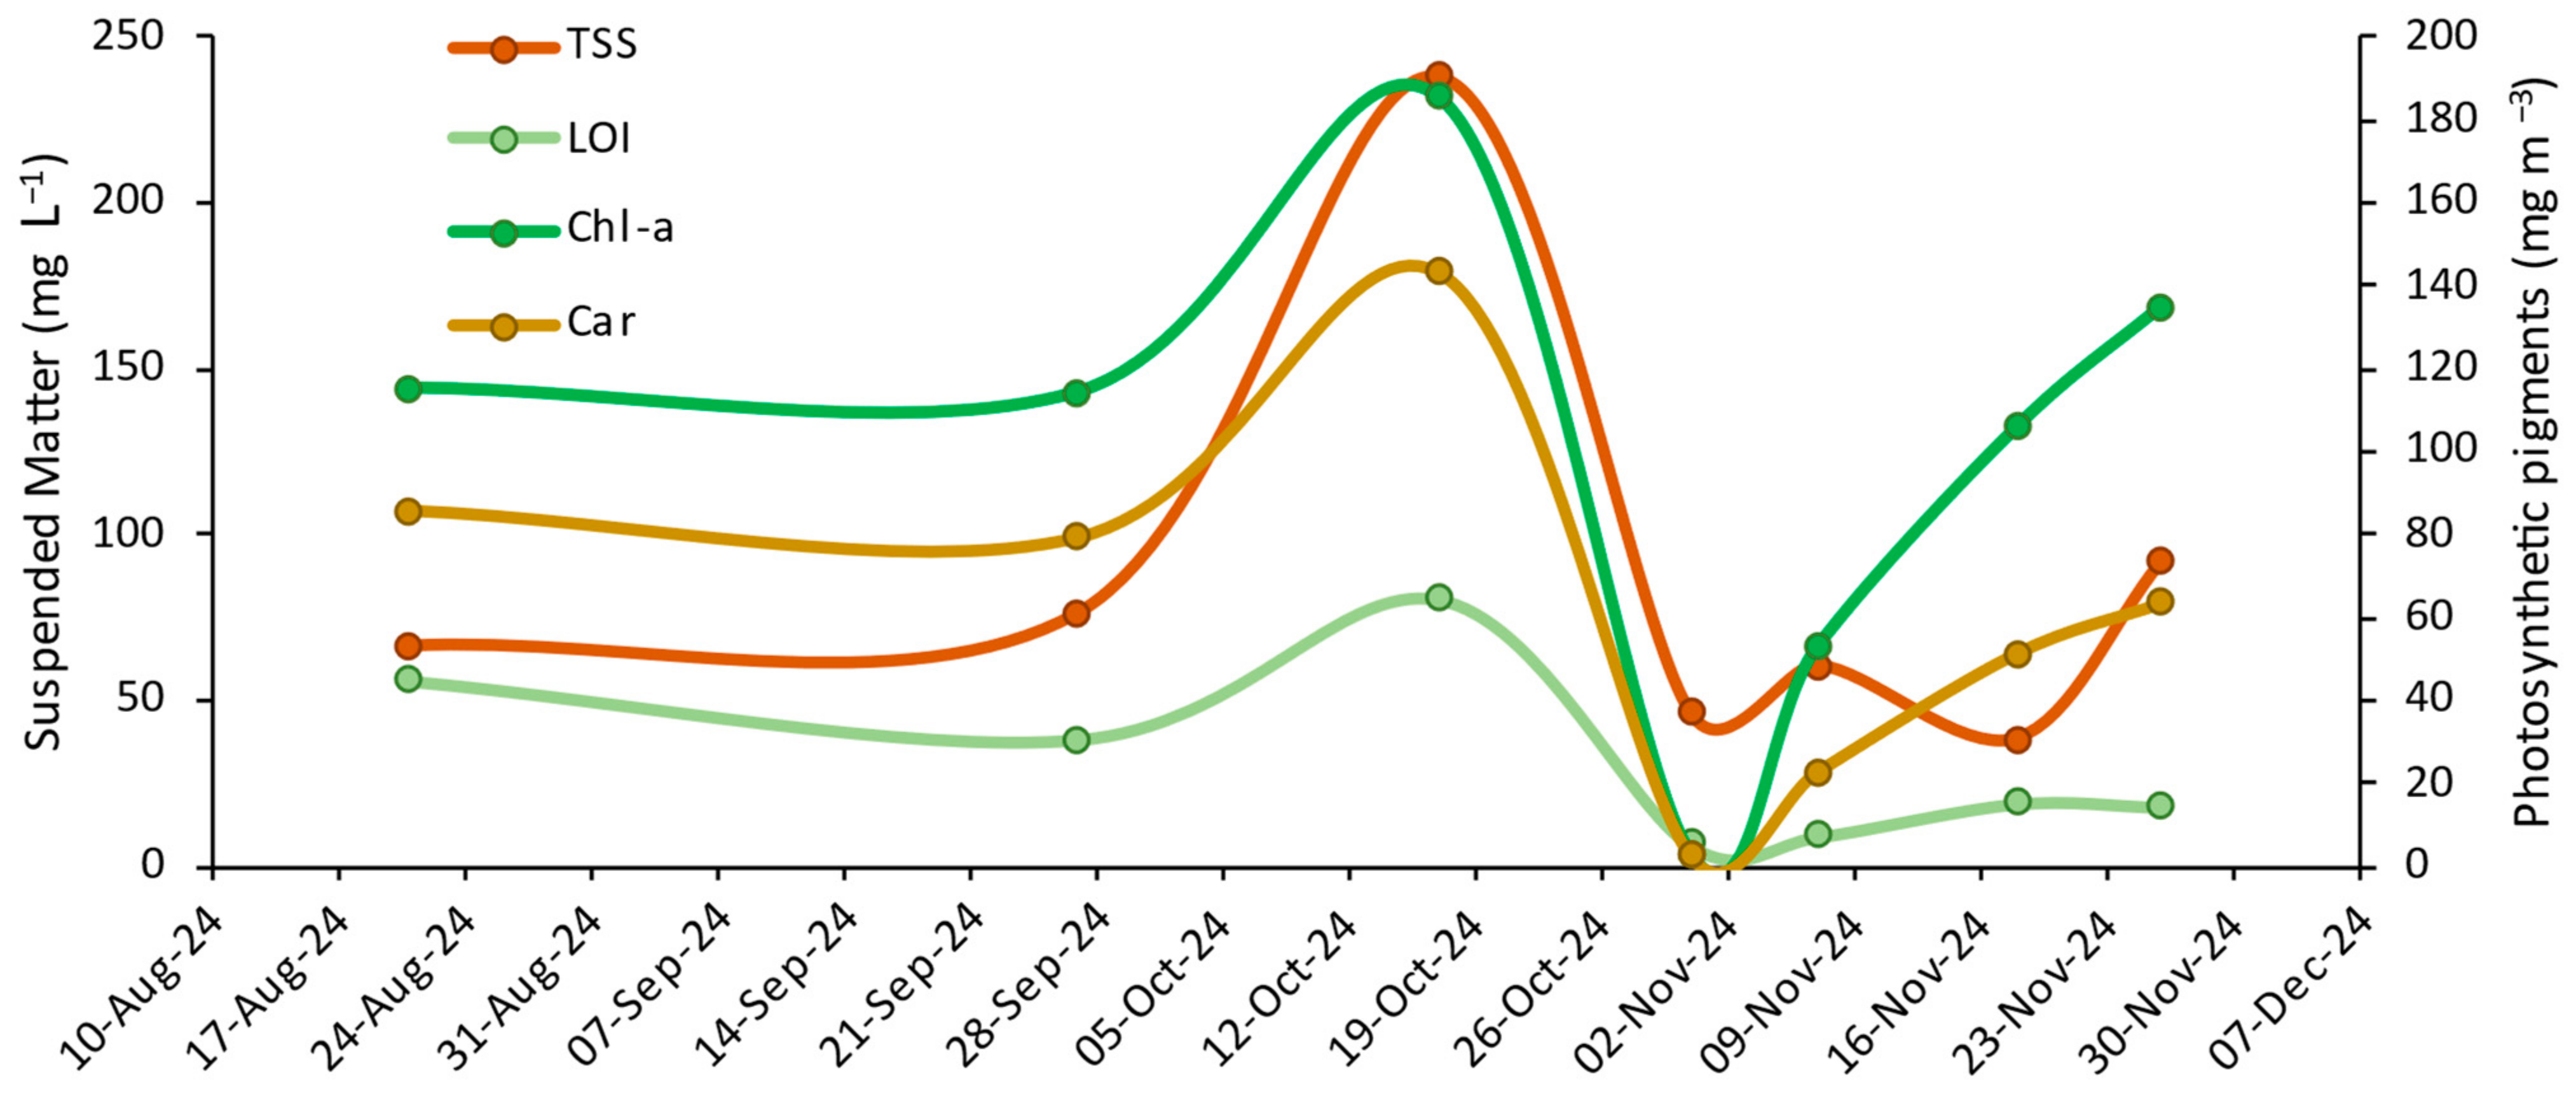
As shown in Figure 8, the temporal series of photosynthetic pigments, total and organic solids (LOI), reflects the significant impact of the DANA and the recovery dynamics of the lake. A similar pattern is exhibited by both chlorophyll-a and carotenes, with an increase just before the DANA, according to scarce rainfall during the previous month, as explained in conductivity. After the flash flood occurs, there is a drastic drop associated with the substantial water renewal and the opening of gates. Following the occurrence of the DANA, both pigments exhibited a progressive recovery, although their November values (134.6 mg m−3 for chlorophyll and 63.08 mg m−3 for carotenes) did not reach the peaks recorded prior to the DANA (185.27 mg m−3 and 143.14 mg m−3, respectively), but were close to the previous stable values (115 mg m−3 and 80 mg m−3 on 27 September).
A similar pattern is evident in the total and organic solids (LOI), which undergo a substantial decline following DANA. However, their November values (91.13 mg L−1 and 17.93 mg L−1) demonstrate a gradual convergence towards the stable levels observed in previous months (70 mg L−1 and 40–50 mg L−1). However, the recovery of organic solids is less marked compared to the rest of the variables.

3.3. Statistical Analysis Results

The analysis revealed that all the variables under analysis conformed to a normal distribution, as indicated by the Shapiro–Wilk test (p > 0.05). However, the total suspended solids variable exhibited a non-normal distribution (p < 0.05). Following the normalization of the data, a multivariate analysis was conducted, which revealed no statistically significant trends or adjustments for any of the variables within the specified time range (p > 0.05 in all cases), with the exception of CDOM, which exhibited a statistically significant increasing trend (p < 0.05).
In the principal component analysis (PCA), a clear separation between pre- and post-DANA samples is observed (see Figure 9). The pre-event samples are observed to be concentrated on the positive side of the first component, while the post-DANA samples are distributed towards the negative side. This observation indicates a substantial modification in the characteristics of the lake following the occurrence of the DANA event. In contrast, the observation that the most recent samples are positioned closer to the pre-DANA samples indicates a rapid recovery of the lake to its previous condition.
With regard to the variables, nitrate and CDOM are located on the negative side, indicating an inverse behavior that is opposing to that of the other variables. This behavior indicates that both variables experienced a noticeable increase after the DANA, in contrast to the other variables, which displayed a decrease.
The application of both the t-test and the Mann–Whitney test revealed significant differences in means (p-value < 0.05) before and after the DANA for conductivity, LOI, nitrate, total phosphorus, carotenoids, and CDOM. Nitrate was found to be particularly remarkable, with a highly significant difference (p-value < 0.01). In contrast, total suspended solids and chlorophyll-a did not show significant differences (p-value > 0.05), suggesting a faster recovery after the event.

3.4. Thematic Maps

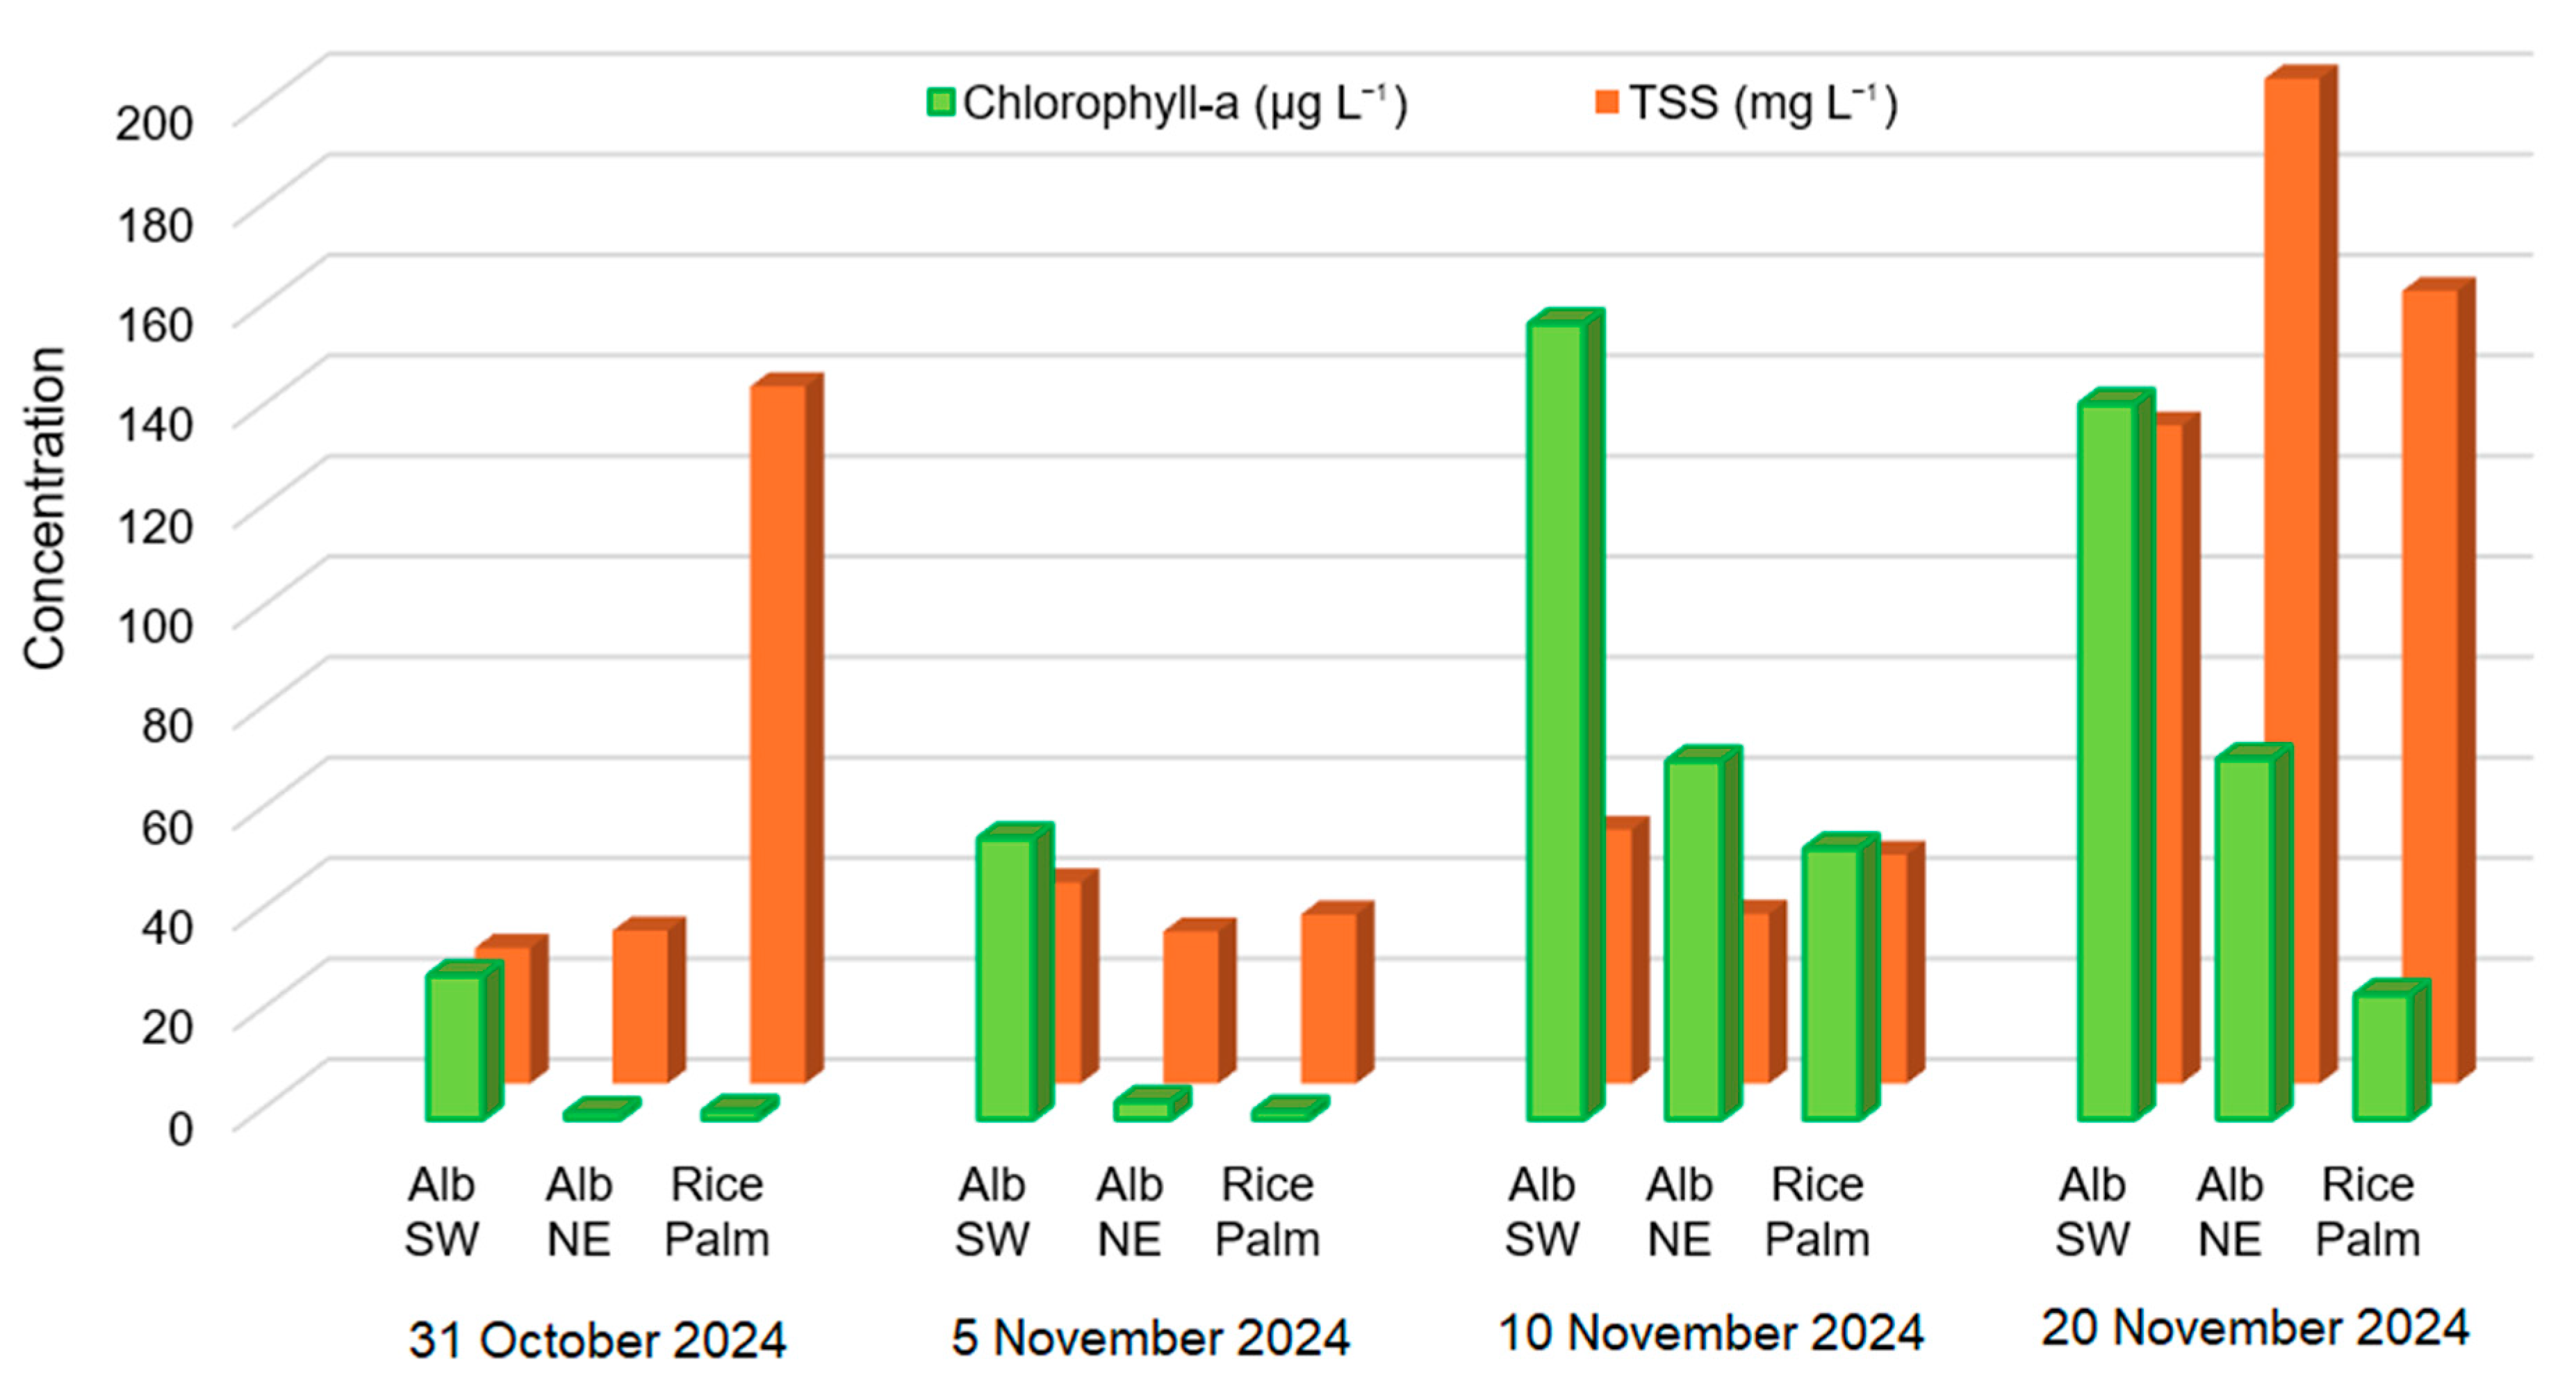
The study by remote sensing of the images prior to the storm (26 October) and after (31 October and 5, 10, and 20 November) allows us to appreciate the spatiotemporal variability of the distribution of total suspended solids (TSS) through the rice fields and the Albufera applying the Equation (3). As a numerical example, the values have been obtained in two areas of the Albufera and in several rice fields in the southern area, the results of which are represented in Figure 10. On the one hand, it is observed that the SW zone of the Albufera had less renewal than the NE zone and that, practically, by November 10 (in just 12 days), it had returned to the usual values of photosynthetic pigments. In the NE zone, near the outlet to the sea, the pigments practically disappear, and their recovery is slower than in the interior of the lagoon.
With respect to TSS, the values do not show differences in the Albufera. On the one hand, on the 31st of October, the waters did not fully reach the Albufera, and the values are within the usual range; this is not so in the rice fields of the South, where the flood has already flooded them. However, on November 20, the values are very high both in the Albufera and in the rice fields due to a few days with strong westerly wind (average 22 km h−1, peak 51 km h−1), which contributes to resuspending the sediment in all the systems.
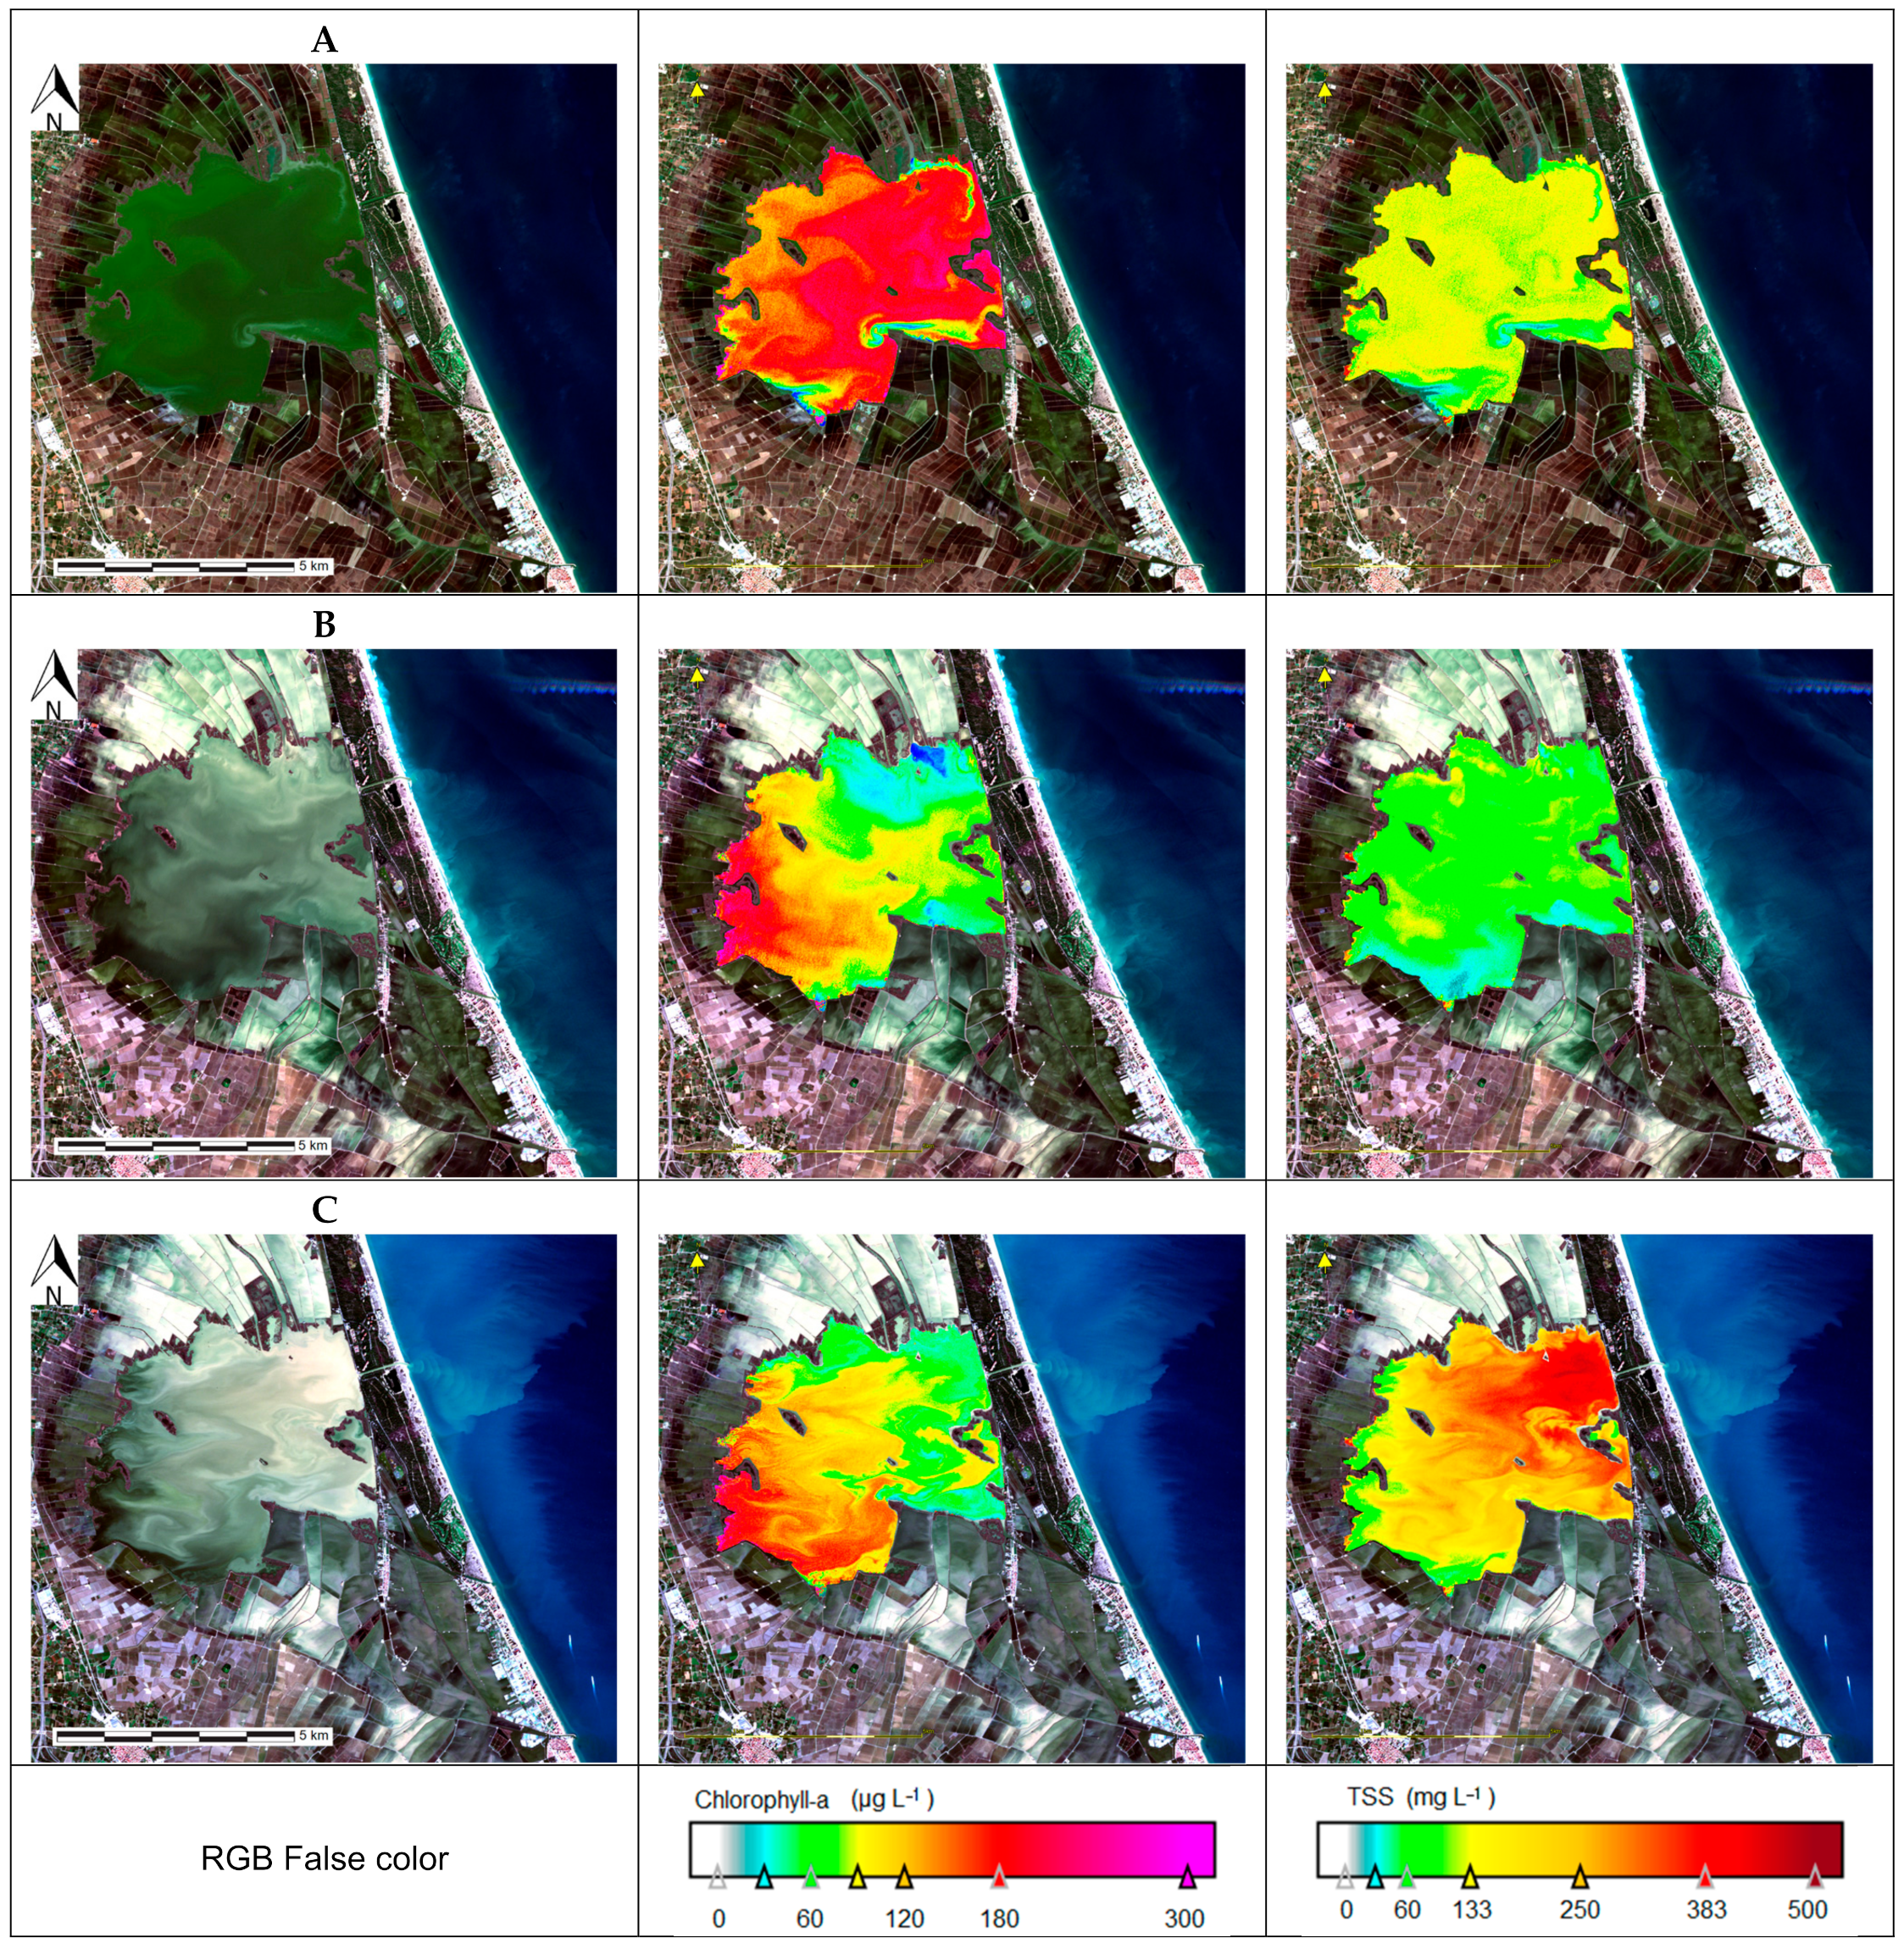
The study of the Albufera by remote sensing complements the observations made in the field, in the spot measurements made along the edge of the lagoon. The heterogeneity in the spatial distribution of chlorophyll-a and TSS, applying Equations (1) and (3), is remarkably appreciated by comparing the image prior to the storm of October 26 with those of two subsequent days, which correspond to November 10 and 20. As illustrated in Figure 11A, the distribution of pigments and total suspended solids (TSS) within the lagoon is found to be homogeneous, with the exception of the regions where water influx occurs, specifically in the north, southwest, and south zones. It is clearly observed in the thematic map that where the water inflows to the lagoon, low pigment concentration is observed.
However, as demonstrated in Figure 11B, which was obtained twelve days after the storm, the spatial heterogeneity can be discerned. This highlights how the interior area of the lagoon, close to the west, where there have been no inflows during rainfall, maintains high pigment values similar to those existing in the Albufera in a normal situation. On the other hand, the flow of water continues to enter the northern area that maintains this area with low concentrations of pigments, with a very low value at the entry point of the Poyo ravine and the inflow in the southern zone canal.
In Figure 11C, the situation of chlorophyll-a remains similar to the previous image, with maximum values in the range of 150 μg L−1. However, the influence of strong wind on the TSS measure is remarkable. Some areas exhibit values close to 500 mg L−1, as has been found in other previous studies [35]. Unlike pigments, the highest concentrations are in the East, while the lowest values are in the West and South. It is an observed fact that the suspended materials sediment in a few hours in the Albufera when the winds are light or there are only sea breezes. But moderate and strong winds cause the sediment to resuspend, and in the case of November 20, it is the fine materials provided by the storm that have not yet settled on the bottom, so they return to the water column easily. Note that at this date, the depth of the lagoon was the usual 1.15 m.

4. Discussion

Historical records indicate that Valencia has experienced numerous flood events [38]. One of the most significant recorded floods occurred in 1957 when the river Turia experienced two flood peaks of approximately 2500 and 3700 m3 s−1 as it traversed the city [39]. In the final stretch of the river, the dual overflow led to substantial inundation, encompassing over 30 km2 of the urban area and the coastal regions. This event precipitated an unanticipated collapse of the metropolitan infrastructure, resulting in a substantial number of victims (81 deaths, according to official records) and engendering considerable material destruction [40]. The impact of the flood extended to hydrogeomorphology, resulting in substantial sediment discharge [41].
The Tous dam, situated on the Jucar River, is a flood control structure that drains an area of 21,600 km2 in central-eastern Spain [42]. In 1982, a collapse of the dam resulted in a flow of 10,000 m3 s−1, causing a severe flood and the death of between 20 and 25 people in the low basin areas [43,44]. This event led to the evacuation of over 100,000 individuals. Moreover, economic losses of more than 330 million euros were also recorded at the time [45,46]. At that time, the levels attained by the lake and the rice fields were comparable to the present occasion, yet the inflows originated from the south as opposed to the north. The drainage capacity of the lake remains unaltered, as the geometry of the channels connecting it to the sea has remained constant for eight decades. Consequently, the level of the marsh rises rapidly but recedes gradually, constrained by the capacity of the outlet to the sea. The flood of 29 October 2024, which resulted in 225 fatalities [22], was significantly higher than the two historical floods in Valencia previously documented [40,43,44].
In order to mitigate the risks posed by these floods, the Department of Urban Planning of the Generalitat Valenciana initiated the preparation of the Territorial Action Plan for the Prevention of Flood Risk in the Valencian Community, known as PATRICOVA [47]. The objective of this initiative is to develop a Geographic Information System that combines areas susceptible to flooding with urban development. The plan has established six risk levels according to the three different return periods [48]. However, it is acknowledged that the PATRICOVA currently exhibits a certain degree of conservatism, as evidenced by the occurrence of flooding in areas not encompassed by its limits, notably in the October 2024 flood around Valencia City. This includes regions such as the area south of the city center (Paiporta, Benetússer, Sedaví, Albal, etc.), certain areas to the west (Quart plain), and a small area in the Magro river basin (Algemesí, Carlet) (Figure 12). Consequently, it is imperative to incorporate these regions within the designated boundaries of risk due to flood hazards.
Llasat et al. [38] conducted a comprehensive review of the mortalities and aggregate economic losses incurred as a result of the various floods within the Mediterranean basin. One of the countries most severely affected is Algeria, primarily due to the 2001 flood. This deluge was caused by a stratospheric intrusion in the troposphere, leading to a severe cyclogenesis event that resulted in 700 fatalities and economic damages amounting to millions of euros [50]. In France, a catastrophic flood occurred in 2002, precipitated by heavy rains that caused some rivers to overflow, resulting in 23 fatalities and damages estimated at 1.2 billion euros [51]. Furthermore, Italy has been identified as one of the countries with the greatest losses, with material damage estimated at 29,136 million euros for the period 1990–2006. The period was subject to approximately 40 floods. The most disastrous of these was in 1992, which resulted in four fatalities and necessitated over 12 million dollars in urgent rescue operations [38]. A comparison of the flood in Valencia on 29 October 2024, with the most prominent floods in the Mediterranean, reveals that the flood in Algeria remains the most catastrophic in terms of the number of fatalities. However, when juxtaposed with the most significant floods in France and Italy, the Valencia flood emerges as considerably more substantial in terms of both fatalities and damage in Europe.
Furthermore, the present phenomenon has also been remarkable in terms of its consequences on the water quality of the Albufera of Valencia by reducing the water residence time in the lagoon. Maps that illustrate the spatial variability of residence time, as defined by Dronkers and Zimmerman [52], provide clear indications of the relevance of transport processes in shaping the spatial patterns of nonconservative variables such as temperature, conductivity, and chlorophyll-a. However, it is imperative to emphasize that comparisons of local biogeochemical rates should be made with respect to the temporal dynamics of the corresponding local transport processes, as opposed to relying on system-level measures of transport, which may not accurately reflect local conditions [53].
In this specific case, the results obtained in the statistical analyses, both by difference of means tests (Student’s t and Mann–Whitney) and principal component analysis (PCA), clearly demonstrate that there was a significant alteration in the lake conditions before and after the DANA event. These findings serve to reinforce the hypothesis that the DANA event caused a significant alteration in water quality, the impact of which was temporary but very marked. However, the absence of significant temporal trends in the analysis of the variables may be attributable to the limited number of data points available, with a paucity of samples collected before and after the DANA event. The limited time span between samples, coupled with the high variability introduced by the event itself, poses a significant challenge in detecting clear linear patterns.
Conductivity, in particular, exhibits noteworthy behavior. According to Soria et al. [54], the mean value of conductivity was 2103 µS cm−1 between 1985 and 2018, with a standard deviation of 603 µS cm−1. This study already highlighted that the conductivity in the Albufera tends to decrease during periods of heavy rainfall and extraordinary water inputs, due to the fact that rainfall and surface runoff bring fresh water to the lagoon, reducing the concentration of salts.
For instance, the lowest conductivity values documented following heavy rainfall were observed in December 1975, with a monthly value of 880 μS cm−1 [54], and on 19 November 1988, with punctual reductions of 60% in the west (510 μS cm−1) and 63% in the south (470 μS cm−1) of the lagoon [55]. In the present study, although the minimum conductivity recorded (539 μS cm−1) did not reach these historical levels, the reduction with respect to the previous value was significantly greater, with a decrease of 82% from 2961 μS cm−1 on 17 October (11 days before the event) to 539 μS cm−1 on 31 October (two days later).
These findings serve to reinforce the hypothesis that the present phenomenon has been extraordinary, both with respect to the magnitude of water renewal and the reduction of lake salinity.
Following the DANA, nitrate and total phosphorus have exhibited differential behavior. While nitrate exhibited a fourfold increase in concentration, attributable to the entrainment of pollutants from agriculture, urban areas, and industry, total phosphorus levels underwent a substantial decline, ranging from values close to 0.18–0.20 mg L−1 to 0.11 mg L−1, subsequently exhibiting a gradual upward trend. This discrepancy can be attributed to the divergent properties of the two nutrients. Nitrate is characterized by its high solubility and mobility, which facilitates its transportation by water [56]. This attribute is in contrast to the behavior of phosphorus, which is less soluble and mobile. Conversely, phosphorus has been observed to bind to soil particles or sediments, which were likely dislodged from the system upon the opening of the gates.
In relation to photosynthetic pigments, Soria et al. [12] observed a significant decline in chlorophyll-a during a controlled lake renovation experiment, where 10 × 106 m3 of high-quality water was introduced through the western channels. The levels of chlorophyll-a remained within the range of 25–150 mg m−3 over the course of the experiment. In the present study, a substantially larger release of water (80 × 106 m3 over 2–3 days) was observed, resulting in a significant decrease in chlorophyll-a to 2.8 mg m−3, a level comparable to that attained during the rare instances of clear phase in the Albufera.
This phenomenon, in conjunction with the findings of the 2015 controlled experiment, lends support to the hypothesis that the inflow of substantial water inputs from the west, in conjunction with the opening of floodgates, results in an augmentation of the lake’s renewal rate. This is considered to be an efficacious strategy for the enhancement of water quality.
However, it should be noted that upon the conclusion of the event, the lake rapidly reverts to its typical values [55]. In this case, within a mere 20 days (by November 18), chlorophyll-a had reached 105.52 mg m−3, a level more typical of the lake and consistent with previously documented data. This rapid rise in chlorophyll-a value is similar to that observed during clear phases, indicating that internal nutrient recycling processes are maintaining the poor trophic state.
Recent studies have been conducted in other lagoons around the world that have been impacted by flash floods. Machado Toffolo et al. [57] examined the effects of flash floods in the Mediterranean coastal lagoon of Mar Menor (southeastern Spain) in 2016 and 2019. These floods resulted in an influx of water containing elevated levels of nitrates and suspended solids from the economic activities in the surrounding countryside of Cartagena, similar to the situation observed in the Albufera. However, in these cases, an increase in chlorophyll was observed, contrasting with the findings of this study. Castaño−Ortiz et al. [58], with a focus on the 2019 flash flood event in the Mar Menor, did not emphasize classical limnological variables. However, the study concluded that this event also favored an increased input of pharmaceutical residues and their bioaccumulation in the system. This issue has not yet been studied in the 2024 event in the Albufera.
Concurrently, Walukow et al. [59] in Lake Sentani (Indonesia) also concluded that flash flood events increased the loading of phosphorus, nitrate, and total dissolved solids. Conversely, the study by Ntangyong et al. [60] in the Nokoué lagoon (in Benin, located on the Gulf of Guinea) observed that flash-flood events, particularly during the rainy season, as seen in the Albufera, led to a substantial increase in the concentration of suspended particulate matter in the water. This increase was accompanied by an escalation in the load of nutrients, such as nitrates and phosphorus, which can be transported by heavy rain. The discrepancy between the findings of these studies and our own can be attributed to the distinct forms of phosphorus investigated. The studies referenced above focused on the phosphate form (the soluble and mobile form), while our study examined total phosphorus.
Furthermore, experiments and models have been conducted to investigate the potential impact of a hypothetical flood event on other lagoons worldwide. A notable example is the experiment by Courboulès et al. [61] in the Mediterranean coastal lagoon of Thau (France) in May 2021. This experiment utilized a mesocosm design to simulate an overland runoff event. The most significant results on the effects of the flash flood in the Thau lagoon also include an increase in nutrients, such as nitrates and silicates, and suspended matter. Simultaneously, a decline in salinity was observed within the lagoon, a finding that aligns with the present study’s observations. Ligorini et al. [62] conducted two experiments in microcosms designed to simulate the natural conditions of the Mediterranean coastal lagoon of Santa Giulia (Corsica, France). One of the experiments simulated a sudden dilution to simulate a freshwater input, similar to what occurs during a flash flood. The outcomes of these experiments indicated a decline in salinity and chlorophyll levels, with the analysis focusing on the subunit chlorophyll-b.
The evidence obtained underscores the necessity for the implementation of periodic inflows of clean water as a pivotal strategy for the sustainable management of the Albufera de Valencia. These flows enable a greater renewal rate of the lake, thereby reducing the accumulation of nutrients and salinity, which are factors that contribute to the deterioration of its ecological state. Although the lagoon tends to swiftly regain its normal values after the cessation of these flows, their periodic implementation could be pivotal in mitigating the deleterious effects of eutrophication and progressing towards sustainable management of the wetland whilst concomitantly exploring methods to reduce internal recycling.

5. Conclusions

The DANA that occurred in October 2024 in Valencia is one of the most significant extreme weather events recorded in the Mediterranean region in terms of human and material impacts. This phenomenon underscores the imperative to fortify monitoring and management strategies, particularly in light of its potential escalation in both frequency and intensity, as predicted by climate change models. A comprehensive analysis of the water quality of the Albufera lagoon post-event revealed substantial alterations in key variables, including conductivity, nitrate levels, and total solids, indicative of a significant water renewal following substantial rainfall and the subsequent opening of floodgates. Despite the magnitude of the initial impact, the results confirm that, within 20–30 days, the lake recovers conditions similar to those prior to the event, a behavior consistent with previous studies on its resilience. This finding underscores the significance of effective water management strategies, including periodic water releases, in ensuring the preservation of water quality. Furthermore, the study demonstrates that changes in water quality can also be monitored using remote observation tools. The employment of Sentinel-2 imagery has led to a substantial augmentation in spatiotemporal coverage, thereby complementing field data and furnishing a comprehensive perspective on the repercussions of extreme events on aquatic ecosystems.

Author Contributions

Conceptualization, J.M.S. and J.V.M.; methodology, J.M.S., R.M., N.C.-T. and J.V.M.; formal analysis, J.M.S. and J.V.M.; investigation, J.M.S., N.C.-T. and J.V.M.; data curation, J.M.S. and J.V.M.; writing—original draft preparation, J.M.S., N.C.-T. and J.V.M.; writing—review and editing, J.M.S., R.M., N.C.-T. and J.V.M.; supervision, J.M.S. and J.V.M. All authors have read and agreed to the published version of the manuscript.

Funding

This research received no external funding.

Institutional Review Board Statement

Not applicable.

Data Availability Statement

The original contributions presented in this study are included in the article and obtained from public sites. Landsat-8 images were provided to J.M.S. for research purposes. Further inquiries can be directed at the corresponding author.

Conflicts of Interest

The authors declare no conflicts of interest.

Abbreviations

The following abbreviations are used in this manuscript:
DANA“Depresión aislada en niveles altos” (in Spanish), the translation is an isolated high-level atmospheric depression
TSSTotal suspended solids
LOILoss of ignition (organic solids)
TPTotal phosphorus
Chl-aChlorophyll-a
CarCarotenoids
CDOMColored dissolved organic matter

Appendix A

Table A1. Location of the studied rain gauges, accumulated rainfall on 29 October 2024, and persistence in hours of rainfall greater than 10 mm/h. Values in bold font are greather thar 200 mm, and represented in Figure 3.
Gauge StationUTM XUTM YRainfall (mm)Persistence (h)
Aliaguilla64342244005601604
Alzira-La Casella72105243362551153
Andilla6877874409574632
Antella7079824328433872
Benagéber *66294643991342499
Bugarra69037543863792389
Buseo676776438493540612
Calles67527543985422008
Carlet *71220843448412746
Casinos6961104396390682
Castelló_Ribera *71481443269981495
Caudete_Fuentes64957943770181437
Chelva67200844049061276
Chiva694817436999249110
Contreras6291814377410291
Cortes_Pallás6793914347985733
Cueva Santa7047054413125383
Domeño67592643968452328
Enguidanos6191714393352551
Estubeny7058464321601211
Forata684087435668325510
Guadassuar71836343421291647
Huerto Mulet72372843408641293
La Muela67878743453591124
Landete63850344190601307
Loriguilla6789944392754711
Manises7141874377332301
Manuel71673343243411135
Marines7084154397655371
Millares6958674343938331
Naranjero68509443500372208
Pedralba69970743868731063
Picassent7169864363362180
Quart_Poblet720280437362980
Real_Montroy70891143541342446
Requena66199143715311777
Ribarroja70780943720982178
Riola7298524342428100
Salvacañete6264864440355772
Sierra Ave69161043529982619
Siete Aguas680661437312229111
Sueca7325424341308100
Tous70353643340571514
Utiel66040143883651334
Vilamarxant70438543840091423
Villatoya6435034354798411
* Rainfall also includes some hours from the day before.
Figure A1. (a) Quay in Albufera of Valencia, where the sampling point is ubicated on 13 May 2024; (b) the same location on 30 October 2024 after the flash flood.
Diversity 17 00119 g0a1aDiversity 17 00119 g0a1b

References

  1. Soria, J.M. Past, present and future of la Albufera of Valencia Natural Park. Limnetica 2006, 25, 135–142. [Google Scholar] [CrossRef]
  2. Rosselló, V.M. Los ríos Júcar y Turia en la génesis de la Albufera de Valencia. Cuad. De Geogr. 1972, 11, 7–25. Available online: http://hdl.handle.net/10550/30642 (accessed on 20 December 2024).
  3. López-Belzunce, M.; Blázquez, A.M.; Sánchez-Palencia, Y.; Torres, T.; Ortiz, J.E. Environmental evidence of Valencia lagoon coastal barrier stabilization from 8500 BP to Present. Climate and eustatic variations. Sci. Total Environ. 2022, 807, 151230. [Google Scholar] [CrossRef]
  4. Peris, T. La problemática génesis del segundo tramo de la acequia real del Xúquer: (orígenes de la «acequia del proyecto» del Duque de Híjar, 1728–1778). Investig. Geográficas 1991, 9, 167–190. [Google Scholar] [CrossRef]
  5. Jégou, A.; Sanchis-Ibor, C. The Opaque Lagoon. Water Management and Governance in l’Albufera de València Wetland (Spain). Limnetica 2019, 38, 503–515. [Google Scholar] [CrossRef]
  6. Marco-Barba, J.; Holmes, J.A.; Mesquita-Joanes, F.; Miracle, M.R. The influence of climate and sea-level change on the Holocene evolution of a Mediterranean coastal lagoon: Evidence from ostracod palaeoecology and geochemistry. Geobios 2013, 5, 409–421. [Google Scholar] [CrossRef]
  7. Rodrigo, M.A.; Alonso-Guillén, J.L.; Soulié-Märsche, I. Reconstruction of the former charophyte community out of the fructifications identified in Albufera de València lagoon sediments. Aquat. Bot. 2010, 92, 14–22. [Google Scholar] [CrossRef]
  8. Martín, M.; Hernández-Crespo, C.; Andrés-Doménech, I.; Benedito-Durá, V. Fifty years of eutrophication in the Albufera lake (Valencia, Spain): Causes, evolution and remediation strategies. Ecol. Eng. 2020, 155, 105932. [Google Scholar] [CrossRef]
  9. Vicente, E.; Miracle, M.R. The coastal lagoon Albufera de Valencia: An ecosystem under stress. Limnetica 1992, 8, 87–100. [Google Scholar] [CrossRef]
  10. Sòria-Perpinyà, X.; Miracle, M.R.; Soria, J.; Delegido, J.; Vicente, E. Remote sensing application for the study of rapid flushing to remediate eutrophication in shallow lagoons (Albufera of Valencia). Hydrobiologia 2019, 829, 125–132. [Google Scholar] [CrossRef]
  11. Soria, J.M.; Miracle, M.R.; Vicente, E. Relations between physico–chemical and biological variables in aquatic ecosystems of the Albufera Natural Park (Valencia, Spain). SIL Proc. 2002, 28, 564–568. [Google Scholar] [CrossRef]
  12. Soria, J.; Vera-Herrera, L.; Calvo, S.; Romo, S.; Vicente, E.; Sahuquillo, M.; Sòria-Perpinyà, X. Residence Time Analysis in the Albufera of Valencia, a Mediterranean Coastal Lagoon, Spain. Hydrology 2021, 8, 37. [Google Scholar] [CrossRef]
  13. Wu, J.; Luo, J.M.; Tang, L. Coupling Relationship between Urban Expansion and Lake Change—A Case Study of Wuhan. Water 2019, 11, 1215. [Google Scholar] [CrossRef]
  14. Pérez-Ruzafa, A.; Marcos-Diego, C.; Ros, J.D. Environmental and biological changes related to recent human activities in the Mar Menor (SE of Spain). Mar. Pollut. Bull. 1991, 23, 747–751. [Google Scholar] [CrossRef]
  15. Camarasa, A.; Segura, F. Flood events in Mediterranean ephemeral streams (ramblas) in Valencia region, Spain. Catena 2001, 45, 229–249. [Google Scholar] [CrossRef]
  16. Barredo, J.I. Major flood disasters in Europe: 1950–2005. Nat. Hazards 2007, 42, 125–148. [Google Scholar] [CrossRef]
  17. Faccini, F.; Luino, F.; Paliaga, G.; Sacchini, A.; Turconi, L.; de Jong, C. Role of rainfall intensity and urban sprawl in the 2014 flash flood in Genoa City, Bisagno catchment (Liguria, Italy). Appl. Geogr. 2018, 98, 224–241. [Google Scholar] [CrossRef]
  18. Sapountzis, M.; Stathis, D. Relationship between Rainfall and Run-off in the Stratoni Region (N. Greece) after the storm of 10th February 2010. Glob. NEST J. 2014, 16, 420–431. [Google Scholar] [CrossRef]
  19. Barriendos, M.; Gil-Guirado, S.; Pino, D.; Tuset, J.; Pérez-Morales, A.; Alberola, A.; Costa, J.; Balasch, J.C.; Castelltort, X.; Mazón, J.; et al. Climatic and social factors behind the Spanish Mediterranean flood event chronologies from documentary sources (14th–20th centuries). Glob. Planet. Change 2019, 182, 102997. [Google Scholar] [CrossRef]
  20. Centre for Research on the Epidemiology of Disasters (CRED). Emergency Events Database (EM-DAT). School of Public Health, Université Catholique de Louvain, Brussels, 2009. Available online: http://www.emdat.be/ (accessed on 16 December 2024).
  21. López-Martínez, F.; Gil-Guirado, S.; Pérez-Morales, A. Who can you trust? Implications of institutional vulnerability in flood exposure along the Spanish Mediterranean coast. Environ. Sci. Pol. 2017, 76, 29–39. [Google Scholar] [CrossRef]
  22. Jiménez, P.A.; González-Rouco, J.F.; Montávez, J.P.; García-Bustamantea, E.; Navarro, J. Climatology of wind patterns in the northeast of the Iberian Peninsula. Int. J. Climatol. 2009, 29, 501–525. [Google Scholar] [CrossRef]
  23. Grau-Bove, J.; Higha, R.; Orr, S.; Kumar, P. Short note on the mapping of heritage sites impacted by the 2024 floods in Valencia, Spain. arXiv 2024, arXiv:2411.08717. [Google Scholar]
  24. Faus, R.D. Exactions, Impact Fees, and Dedications--Local Government Responses to Nollan/Dolan Takings Law Issues. Stetson L. Rev. 1999, 29, 675–708. Available online: https://heinonline.org/HOL/Page?handle=hein.journals/stet29&collection=journals&id=689&startid=&endid=722 (accessed on 19 December 2024).
  25. SAIH-JUCAR. Available online: https://saih.chj.es/chj/saih/?f (accessed on 29 October 2024).
  26. APHA. Standard Methods for the Examination of Water and Wastewater, 18th ed.; American Public Health Association: Washington, DC, USA, 1992; p. 558. [Google Scholar]
  27. Shoaf, W.T.; Lium, B.W. Improved extraction of chlorophyll a and b from algae using dimethyl sulfoxide. Limnol. Oceanogr. 1976, 21, 926–928. [Google Scholar] [CrossRef]
  28. Jeffrey, S.T.; Humphrey, G.F. New spectrophotometric equations for determining chlorophylls a, b, c1 and c2 in higher plants, algae and natural phytoplankton. Biochem. Physiol. Pflanz. 1975, 167, 191–194. [Google Scholar] [CrossRef]
  29. Strickland, J.D.H.; Parsons, T.R. A Practical Handbook of Seawater Analysis; Fisheries Research Board of Canada: Ottawa, ON, Canada, 1972. [Google Scholar]
  30. Murphy, J.; Riley, J.P. A modified single-solution method for the determination of phosphorus in natural waters. Anal. Chim. Acta 1962, 27, 31–36. [Google Scholar] [CrossRef]
  31. Golterman, H.L.; Clymo, R.S.; Ohmstad, M. Methods for Physical and Chemical Analysis of Fresh Waters; IBP/Blackwell Scientific: Oxford, UK, 1978; p. 215. [Google Scholar]
  32. Crumpton, W.G.; Isenhart, T.M.; Mitchell, P.D. Nitrate and Organic N Analyses with Second-Derivative Spectroscopy. Limnol. Oceanogr. 1992, 37, 907–913. [Google Scholar] [CrossRef]
  33. European Spacial Agency (ESA). Sentinel-2: ESA’s Optical High-Resolution Mission for GMES Operational Services; Fletcher, K., Ed.; ESA Communications: Noordwijk, The Netherlands, 2012; p. 77. [Google Scholar]
  34. Soria-Perpinya, X.; Urrego, P.; Pereira-Sandoval, M.; Ruíz-Verdú, A.; Peña, R.; Soria, J.; Delegido, J.; Vicente, E.; Moreno, J. Monitoring the ecological state of a hypertrophic lake (Albufera of València, Spain) using multitemporal Sentinel-2 images. Limnetica 2019, 38, 457–469. [Google Scholar] [CrossRef]
  35. Molner, J.V.; Soria, J.M.; Pérez-González, R.; Sòria-Perpinyà, X. Measurement of Turbidity and Total Suspended Matter in the Albufera of Valencia Lagoon (Spain) Using Sentinel-2 Images. J. Mar. Sci. Eng. 2023, 11, 1894. [Google Scholar] [CrossRef]
  36. Molner, J.V.; Soria, J.M.; Pérez-González, R.; Sòria-Perpinyà, X. Estimating Water Transparency Using Sentinel-2 Images in a Shallow Hypertrophic Lagoon (The Albufera of Valencia, Spain). Water 2023, 15, 3669. [Google Scholar] [CrossRef]
  37. Agencia Estatal de Meteorología (AEMET). Informe Sobre el Episodio Meteorológico de Precipitaciones Torrenciales Persistentes Ocasionadas por una DANA el día 29 de Octubre de 2024. Ministerio para la Transición Ecológica y el Reto Demográfico (Gobierno de España), 2024; p. 13. Available online: https://www.aemet.es (accessed on 11 November 2024).
  38. Llasat, M.C.; Llasat-Botija, M.; Prat, M.A.; Porcu, F.; Price, C.; Mugnai, A.; Yair, Y. High-impact floods and flash floods in Mediterranean countries: The FLASH preliminary database. Adv. Geosci. 2010, 23, 47–55. [Google Scholar] [CrossRef]
  39. Cánovas, M. Avenidas motivadas por las lluvias extraordinarias de los días 13 y 14 de octubre de 1957. Rev. Obras. Públicas 1958, 106, 59–68. Available online: https://quickclick.es/rop/detalle_articulo.php?registro=13574&anio=1958&numero_revista=2914 (accessed on 17 December 2024).
  40. Romero-Aloy, M.J.; Almenar-Muñoz, M.; Fullana-Serra, V. En torno a la riada de 1957 en la ciudad de Valencia. Scr. Nova-Rev. Electron. De Geogr. Y Cienc. Soc. 2019, 23, 622. [Google Scholar] [CrossRef]
  41. Puertes, C. La Riada de Valencia de Octubre de 1957: Reconstrucción Hidrológica y Sedimentológica y Análisis Comparativo con la Situación Actual. Undergraduate Thesis, Polytechnic University of Valencia, Valencia, Spain, 2015. [Google Scholar]
  42. Torcal, F.; Serrano, I.; Havskov, J.; Utrillas, J.L.; Valero, J. Induced seismicity around the Tous New Dam (Spain). Geophys. J. Int. 2005, 160, 144–160. [Google Scholar] [CrossRef]
  43. Alcrudo, F.; Mulet, J. Description of the Tous Dam Break Case Study (Spain). J. Hydraul. Res. 2007, 45, 45–57. [Google Scholar] [CrossRef]
  44. Rosselló, V.M. La revinguda del Xúquer i el desastre de la Ribera. 20–21 octubre 1982: Una perspectiva geogràfica. Cuadernos de Geografía 1983, 32–33, 3–38. Available online: http://hdl.handle.net/10550/30801 (accessed on 9 December 2024).
  45. Serra-Llobet, A.; Tàbara, J.D.; Sauri, D. The Tous dam disaster of 1982 and the origins of integrated flood risk management in Spain. Nat. Hazards 2013, 65, 1981–1998. [Google Scholar] [CrossRef]
  46. Botella, A.; Salom, J. Las inundaciones del Xúquer en 1982: Repercusiones en el sector industrial. Cuad. De Geogr. 1983, 32–33, 187–212. Available online: http://hdl.handle.net/10550/30803 (accessed on 9 December 2024).
  47. Plan de Acción Territorial de Carácter Sectorial Sobre Prevención del Riesgo de Inundación en la Comunidad Valenciana (PATRICOVA). Available online: http://www.cma.gva.es/areas/urbanismo_ordenacion/infadm/publicaciones/pdf_patricova/indice.htm (accessed on 20 December 2024).
  48. Government Department of the Generalitat Valenciana (GDGV). Campaña de Prevención de Inundaciones. Document Divulgatiu; GDGV: Valencia, Spain, 2009. (In Spanish)
  49. Valencian Cartographic Institute. Available online: https://visor.gva.es/visor/ (accessed on 23 December 2014).
  50. Argence, S.; Lambert, D.; Richard, E.; Söhne, N.; Chaboureau, J.P.; Crépin, F.; Arbogast, P. High resolution numerical study of the Algiers 2001 flash flood: Sensitivity to the upper-level potential vorticity anomaly. Adv. Geosci. 2006, 7, 251–257. [Google Scholar] [CrossRef]
  51. Legrand, P.; Brugnot, G.; Baumont, G. Rétour d’experience des inondations de septembre de 2002 dans les départaments du Gard, de l’Hérault, du Vaucluse, des Bouches de Rhône, de l’Ardèche et de la Drôme. Contribution du Groupe d’Appui et d’expertise scientifique 2003 (on CD-ROM). Available online: https://www.vie-publique.fr/files/rapport/pdf/034000547.pdf (accessed on 18 December 2024).
  52. Dronkers, J.; Zimmerman, J.T.F. Some principles of mixing in tidal lagoons. Oceanol. Acta 1982, 4, 107–118. Available online: https://archimer.ifremer.fr/doc/00246/35736/ (accessed on 18 December 2024).
  53. Monsen, N.E.; Cloern, J.E.; Lucas, L.V.; Monismith, S.G. A comment on the use of flushing time, residence time, and age as transport time scales. Limnol. Oceanogr. 2002, 47, 1545–1553. [Google Scholar] [CrossRef]
  54. Soria, J.; Romo, S.; Vera-Herrera, L.; Calvo, S.; Sòria-Perpinyà, X. Evolución de la conductividad en la Albufera de Valencia entre 1985 y 2018. Limnetica 2021, 40, 223–232. [Google Scholar] [CrossRef]
  55. Soria, J.M.; Vicente, E.; Miracle, M.R. The influence of flash floods on the limnology of the Albufera of Valencia lagoon (Spain). SIL Proc. 1922–2010 2000, 27, 2232–2235. [Google Scholar] [CrossRef]
  56. Bijay-Singh; Craswell, E. Fertilizers and nitrate pollution of surface and ground water: An increasingly pervasive global problem. SN Appl. Sci. 2021, 3, 518. [Google Scholar] [CrossRef]
  57. Machado Toffolo, M.; Grilli, F.; Prandi, C.; Goffredo, S.; Marini, M. Extreme Flooding Events in Coastal Lagoons: Seawater Parameters and Rainfall over A Six-Year Period in the Mar Menor (SE Spain). J. Mar. Sci. Eng. 2022, 10, 1521. [Google Scholar] [CrossRef]
  58. Castaño-Ortiz, J.M.; Gil-Solsona, R.; Ospina-Alvarez, N.; García-Pimentel, M.D.M.; León, V.M.; Santos, L.H.M.L.M.; Barceló, D.; Rodríguez-Mozaz, S. Bioaccumulation and fate of pharmaceuticals in a Mediterranean coastal lagoon: Temporal variation and impact of a flash flood event. Environ. Res. 2023, 228, 115887. [Google Scholar] [CrossRef]
  59. Walukow, A.F.; Triwiyono; Sukarta, I.N. Conceptual model of water pollution control strategies in the lower Sentani watershed post flash flood using the swot method. Ecol. Eng. Environ. Technol. 2022, 23, 120–129. [Google Scholar] [CrossRef]
  60. Ntangyong, I.L.; Chaigneau, A.; Morel, Y.; Assogba, A.; Okpeitcha, V.O.; Duhaut, T.; Stieglitz, T.; Van Beek, P.; Baloitcha, E.; Sohou, Z.; et al. Seasonal and Interannual Variations of Suspended Particulate Matter in a West-African Lagoon (Nokoué Lagoon, Benin): Impact of Rivers and Wind. Estuar. Coast. Shelf Sci. 2024, 304, 108821. [Google Scholar] [CrossRef]
  61. Courboulès, J.; Vidussi, F.; Soulié, T.; Nikiforakis, E.; Heydon, M.; Mas, S.; Joux, F.; Mostajir, B. Effects of an experimental terrestrial runoff on the components of the plankton food web in a Mediterranean coastal lagoon. Front. Mar. Sci. 2023, 10, 1200757. [Google Scholar] [CrossRef]
  62. Ligorini, V.; Garrido, M.; Malet, N.; Simon, L.; Alonso, L.; Bastien, R.; Aiello, A.; Cecchi, P.; Pasqualini, V. Response of Phytoplankton Communities to Variation in Salinity in a Small Mediterranean Coastal Lagoon: Future Management and Foreseen Climate Change Consequences. Water 2023, 15, 3214. [Google Scholar] [CrossRef]
Figure 1. Landsat-8 RGB map 30 October 2024. Red line indicates rice fields in Albufera Natural Park. Labels name rivers and ravines, sampling point, and the city of Valencia. See different colors of water with sediments depending on the source, and floating debris on the sea.
Diversity 17 00119 g001
Figure 2. CORINE Land Cover map of the region with the land uses; Albufera’s hydrographic network (blue line) indicating name of intermittent ravines. The blue arrows indicate the three water outflow channels towards the Mediterranean Sea. In the margin, UTM zone coordinates 30S.
Diversity 17 00119 g002
Figure 3. Map of daily accumulated rainfall (mm) as recorded on 29 October 2024. Modified from AEMET [37]. UTM corner coordinates zone 30S.
Diversity 17 00119 g003
Figure 4. Average daily level (m.a.s.l.) of the Albufera (source: Water Information System of the Jucar Basin Authority [25]).
Diversity 17 00119 g004
Figure 5. Temporal evolution of conductivity in the Albufera lake.
Diversity 17 00119 g005
Figure 6. Temporal evolution of nitrate and CDOM in the Albufera lake.
Diversity 17 00119 g006
Figure 7. Temporal evolution of total phosphorus in Albufera lake.
Diversity 17 00119 g007
Figure 8. Temporal evolution of the different fractions of suspended matter and photosynthetic pigments in the Albufera lake.
Diversity 17 00119 g008
Figure 9. Two-dimensional representation of the principal component analysis (PCA) based on the physicochemical and biological variables measured in the lake before (samples on the positive values) and after the DANA (samples on the negative). The evaluated variables are represented as vectors, indicating their contribution and direction within the multivariate space.
Diversity 17 00119 g009
Figure 10. Distribution of chlorophyll-a and TSS after the DANA storm in two areas of Albufera (NE and SW) and in the rice fields in the south area of the Natural Park (Rice Palm) estimated from remote sensing Sentinel-2 images.
Diversity 17 00119 g010
Figure 11. Spatiotemporal variation of chlorophyll-a and TSS on three different days. (A) 26 October 2024, before the storm. (B) 10 November 2024, twelve days after the storm. (C) 20 November 2024, situation after two days of strong westerly wind, up to 40 km/h.
Diversity 17 00119 g011
Figure 12. View of the floodable areas in the Albufera and Jucar basin filled in pastel shades, according to previous research [47], and delimitation of the flooded area during this DANA with blue line. Obtained from Valencian Cartographic Institute [49].
Diversity 17 00119 g012
Table 1. Results of physicochemical and biological variables before and after DANA.
DateTª (°C)pHCond
(µS cm−1)
TSS
(mg L−1)
LOI
(mg L−1)
Chl-a
(mg m−3)
Nitrate (mg L−1)TP
(mg L−1)
Car
(mg m−3)
CDOM
(µg ESQ L−1)
21 August 202429.98.4262666.0055.80115.152.560.0885.592966.13
27 September 202422.68.0182175.6938.15114.051.660.1878.992812.77
17 October 202421.48.42961237.6980.26185.272.260.20143.142458.90
31 October 202420.2-53945.606.372.817.940.112.063297.69
07 November 202422.47.586160.188.9652.706.960.1522.363038.47
18 November 202416.98.4111738.0018.90105.526.040.1350.903302.61
26 November 2024-8.1106091.1317.93134.604.180.1663.083399.26
Disclaimer/Publisher’s Note: The statements, opinions and data contained in all publications are solely those of the individual author(s) and contributor(s) and not of MDPI and/or the editor(s). MDPI and/or the editor(s) disclaim responsibility for any injury to people or property resulting from any ideas, methods, instructions or products referred to in the content.