Article

Elevation-Driven Variations in Species Composition and Biodiversity in a Protected Temperate Forest, Mount Gyebangsan, Korea

1
Ecosystem Service Team, National Institute of Ecology, Seocheon 33657, Republic of Korea
2
Carbon Sequestration Research Team, National Institute of Ecology, Seocheon 33657, Republic of Korea
3
Baekdudaegan National Arboretum, Bonghwa 36209, Republic of Korea
*
Author to whom correspondence should be addressed.
Diversity 2025, 17(12), 828; https://doi.org/10.3390/d17120828 (registering DOI)
Submission received: 6 November 2025 / Revised: 24 November 2025 / Accepted: 27 November 2025 / Published: 28 November 2025
(This article belongs to the Special Issue Forest Management and Biodiversity Conservation—2nd Edition)

Abstract

This study analyzed the spatial patterns of species composition and biodiversity according to elevation on Mt. Gyebangsan, a representative protected ecosystem and the national park in Korea. Based on existing vegetation survey data, differences in species composition heterogeneity according to elevation were verified using non-metric multidimensional scaling and multi-response permutation procedure analyses. Significant differences were identified using the Sørensen distance measure. Zeta (ζ)-diversity was analyzed based on the number of shared species among habitats to quantitatively interpret the structural characteristics of biodiversity along the altitudinal gradient. The analysis revealed that the understory species composition became increasingly distinct and alpha-diversity increased with elevation. High-elevation areas (A3, A4) experienced frequent physical disturbances, including wind damage and limited moisture, resulting in active canopy openings. Consequently, rhizomatous species, including Sasa borealis rapidly covered the ground, influencing the understory vegetation structure. ζ-Diversity analysis showed that the ζ-ratio in high-elevation regions sharply declined with increasing ζ-order, indicating limited species overlap among habitats and the dominance of deterministic processes. Thus, altitudinal gradients represent a key factor in shaping biodiversity, indicating that climatic variables directly affect understory distribution and species turnover. This study quantitatively assessed biodiversity and ecological heterogeneity within the national park, providing a scientific foundation for biodiversity conservation and management.

1. Introduction

Species diversity, one of the core analytical approaches in ecology, has been evaluated through various indices across ecosystem components, including flora and fauna [1,2,3]. These indices have evolved to account not only for species occurrence but also for spatial heterogeneity and regional differentiation [4,5,6]. Therefore, measuring species diversity plays a crucial role in understanding ecosystem structure and function and in establishing biodiversity conservation strategies [7].
Early studies conceptualized diversity at three hierarchical levels—α-, β-, and γ-diversity—representing within-habitat, between-habitat, and regional diversity, respectively [1,4,8]. Distance-based multivariate approaches such as the Jaccard coefficient, NMDS, and CCA have been widely used to assess β-diversity and spatial variation in species composition [9,10]. However, these indices provide a limited interpretation of multi-site compositional heterogeneity.
Recently, zeta (ζ)-diversity has emerged as a multidimensional metric for assessing shared-species structures among sites [11,12]. By quantifying the number of species shared across multiple communities, ζ-diversity enables a more detailed assessment of biodiversity connectivity and turnover than traditional α- or β-diversity [11,12]. It has proven useful for examining habitat fragmentation and environmental filtering [12], aligning with the Convention on Biological Diversity Post-2020 Global Biodiversity Framework, which emphasizes ecosystem-based conservation and expansion of protected areas [13,14].
In Korea, most studies on biodiversity have focused on floristic inventories [15,16,17,18] or α- and β-diversity analyses across forest and mountain ecosystems [19,20,21]. As the effects of climate change and habitat fragmentation have intensified, the need for long-term monitoring and predictive modeling of diversity dynamics has been increasingly recognized [18,22]. Although recent studies applying ζ-diversity to the soil seed bank of Gwangneung Forest and understory vegetation of Ulleung Island [23,24] have expanded this framework, further application across geomorphological and elevational gradients remains limited.
Elevation is among the most influential topographic drivers of biodiversity [25,26]. Understory vegetation, being highly responsive to microclimatic variation, serves as an effective ecological indicator of environmental gradients and ecosystem function [3,27,28]. Nevertheless, most previous elevation-based diversity studies have emphasized α- or β-diversity within discrete altitude zones [29,30], restricting the broader interpretation of shared-species patterns.
Mt. Gyebangsan is recognized as one of the most important biodiversity hotspots on the Korean Peninsula. The area supports exceptionally high species richness and ecological heterogeneity, harboring numerous rare, endemic, and endangered plant species protected under national conservation law [25]. Due to its outstanding ecological value, Mt. Gyebangsan has been designated as a Forest Genetic Resource Reserve by the Korea Forest Service and included within the Odaesan National Park buffer zone, which provides strict protection for its old-growth temperate forests and diverse understory communities [25]. Situated at the transition between the northern and southern floristic regions, the mountain represents an ecologically significant zone for understanding vegetation dynamics and biodiversity responses along environmental gradients.
In this study, we hypothesize that higher elevations, characterized by unique environmental conditions and increased habitat heterogeneity, will exhibit stronger deterministic species-turnover patterns driven by environmental filtering processes. Therefore, this study analyzed species composition and ζ-diversity along an altitudinal gradient in Mt. Gyebangsan—a protected temperate forest ecosystem—to elucidate spatial patterns of shared species and provide fundamental data for biodiversity conservation.

2. Materials and Methods

2.1. Study Area

The administrative location of the study area is the Mt. Gyebangsan (1577 m) vicinity in Hongcheon-gun, Gangwon Special Self-Governing Province, Korea (Figure 1). The plots were located at latitudes 37°21′28.33″–37°45′4.57″ and longitudes 128°26′27.08″–128°29′5.56″. Mt. Bangtaesan, Mt. Odae, Mt. Gariwang, and Mt. Taegisan and Amisan lie to the north, east, south and west, respectively, thus forming a mountainous region with high elevations and rugged terrain. The vegetation of the study site consists of northern temperate deciduous broad-leaved forests and mixed conifer–broad-leaved forests, and it is mainly dominated by Quercus mongolica Fisch. ex Ledeb. Representative overstory species include Quercus mongolica Fisch. ex Ledeb., Prunus spp., Tilia spp., Acer komarovii Pojark., Styrax obassia Siebold & Zucc., Magnolia sieboldii K.Koch, and Picea jezoensis (Siebold & Zucc.) Carrière [31]. Mean climatic variables over the past 30 years in Hongcheon-gun, Korea, are as follows: mean annual air temperature, 11.7 °C; annual precipitation, 1383.6 mm; and mean wind speed, approximately 1.3 m/s [32]. The study site is characterized by a low mean annual temperature, large diurnal temperature range, a cool climate, and abundant annual precipitation; moreover, the vegetation distribution is strongly influenced by wind, indicating pronounced climatic sensitivity [32].

2.2. Vegetation Sampling and Survey

Considering the diverse landforms of Mt. Gyebangsan—including ridges, valleys, and slopes—as well as variations in elevation and slope aspect, we established 153 square plots (20 m × 20 m; 400 m2 each) within the native forest using a stratified random sampling design. Within each plot, the tree and sub-tree layers were surveyed over the entire 20 m × 20 m area, while the shrub and herb layers were surveyed within three replicated subplots of 5 m × 5 m and 2 m × 2 m established inside each main plot. This hierarchical design allowed a consistent comparison of vegetation structure across different strata while minimizing spatial bias in sampling. Using the method of Braun–Blanquet [33], we recorded vegetation cover by strata (tree, sub-tree, shrub, and herb layers). To measure basal area and stand density of the overstory, we measured the diameter at breast height (DBH) of all trees with DBH ≥ 4 cm within each plot and identified them to the species. Field surveys were conducted between March 2015 and October 2022, with plot sampling distributed across different years rather than continuously monitored at fixed intervals. The 153 permanent plots were surveyed at different time points during this period to ensure a comprehensive spatial representation of the study area. All vegetation surveys were carried out during the growing season (May–September), when plant emergence and detectability were at their peak. This seasonal focus enabled accurate identification of understory species and minimized temporal variation associated with phenological changes. Species identification and nomenclature were verified with reference to publications and floristic data from the Korea National Arboretum and the National Institute of Biological Resources [34,35,36,37,38,39,40,41,42]. Scientific and Korean names followed the National Standard Plant List provided by the Korea National Arboretum [42].

2.3. Data Analysis

2.3.1. Plot Adequacy and Elevation Grouping

We verified whether the number of plots was adequate for ecological statistical analyses by estimating species number using species–area curves [43,44]. Specifically, if the estimated increase in species richness approaches zero as the cumulative plot number increases, then the number of plots is considered adequate [44]. For the species–area analysis, we performed 500 random resampling simulations and defined the mean number of species shown on the species–area curve as the outcome of random simulations. Based on the topographic conditions and statistical suitability of the plots, we grouped them in terms of elevation into four classes: <1000 m (A1), 1000–1200 m (A2), 1200–1400 m (A3), and ≥1400 m (A4). These groups were established using the minimum sample size per group required for multivariate analyses to examine heterogeneity in species composition, distribution characteristics, and habitat-specific trends [45]. In addition, these elevation groups were defined based on prior observations that meaningful changes in woody and understory species composition occur at 200–300 m intervals with a threshold around 1000 m elevation in Mt. Gyebangsan [21,25,26].
Vegetation composition along the altitudinal gradient of Mt. Gyebangsan changes markedly with elevation: Quercus mongolica–dominated deciduous broad-leaved forests prevail at low elevations (A1), mixed Acer–Betula deciduous and conifer–broadleaved stands occur at mid-elevations (A2, A3), and subalpine coniferous forests dominated by Abies nephrolepis and Picea jezoensis are found above 1400 m (A4).

2.3.2. Environmental Variables

To assess variations in environmental factors among elevation groups, we measured elevation, slope, rock exposure, basal area of woody plants, stand density, and α-diversity. Slope angles were measured using a handheld clinometer (Suunto PM-5/360 PC; Suunto Oy, Vantaa, Finland), while rock exposure was visually estimated in the field by at least two independent observers. To ensure measurement accuracy, the average value of independent visual estimates was used for subsequent analyses. Mean annual temperature and wind speed for each plot were extracted from the WorldClim 2.1 bioclimatic dataset (spatial resolution: 30 arc-seconds) based on the geographic coordinates of the sampling plots. These climatic variables were used to represent elevational gradients in thermal and wind conditions across Mt. Gyebangsan. The topographic position index (TPI) and topographic wetness index (TWI) were derived from the digital elevation model (DEM) provided by the National Geographic Information Institute [46]. The TWI reflects the degree of soil moisture accumulation, whereas the TPI quantitatively distinguishes ridge and valley landforms, with negative values indicating concave terrain and positive values indicating convex surfaces [47,48].

2.3.3. Diversity and Community Composition

For α-diversity, we calculated species richness, Shannon’s species diversity, and evenness indices following Shannon [6]. To assess understory species composition by elevation, we performed an importance value analysis [49]. From the Braun–Blanquet survey data, we calculated relative coverage and relative frequency (RC and RF, respectively) for species occurring in each plot, and computed the importance value as (RC + RF)/2. Coverage and density were taken as the midpoints of the Braun–Blanquet cover–abundance classes [50].

2.3.4. Multivariate Analyses

To analyze correlations among environmental factors across elevation groups, we applied non-metric multidimensional scaling (NMDS) based on Sørensen distances [10]. The two axes with the highest explanatory power (R2) were retained for ordination. Because ecological datasets are often discontinuous and nonparametric, NMDS was considered appropriate for improving analytical robustness [10].
We further verified the heterogeneity of species composition among groups using the multi-response permutation procedure (MRPP) test, with the Sørensen distance measure and the chance-corrected within-group agreement (A) derived from the test statistic (T) [10]. The T statistic indicates the degree of separation between groups, whereas A represents within-group homogeneity (A ≈ 0: random, A ≈ 1: distinct groups).

2.3.5. Zeta Diversity and Turnover Modeling

To identify trends in shared species among habitats, we analyzed ζ-diversity [11,12]. This index represents the number of shared species across n plots (ζ-order), thereby quantifying multi-site species turnover. The ζ-diversity ratio (ζ-ratio), representing the probability that a species common to (n − 1) plots also occurs in the n-th plot, was calculated using Equation (1).
ζ r a t i o = ζ n ζ n 1
where ζn = number of species shared by n sites and ζn−1 = number of species shared by (n − 1) sites.
An increase in low ζ-orders reflects the contribution of rare species, whereas higher ζ-orders indicate dominant species [11]. ζ-ratios can show increasing, decreasing, or hump-shaped patterns, representing different turnover dynamics. To evaluate habitat-to-habitat turnover processes, both exponential and power-law regression models were fitted to ζ-diversity decline curves. Model performance was assessed using Akaike’s information criterion (AIC) [51], where smaller AIC values indicate a better model fit. Ecologically, a power-law model supports deterministic turnover driven by environmental filtering and niche processes, while an exponential model supports stochastic processes and neutral theory [52,53].

2.3.6. Statistical Testing

Differences in environmental variables and diversity indices among elevation groups were analyzed using one-way analysis of variance (ANOVA) followed by Tukey’s post hoc test to identify pairwise differences. All statistical analyses were performed in R version 4.3.2 (R Core Team, Vienna, Austria), with significance assessed at p < 0.05.

3. Results

3.1. Species Composition and Environmental Factors

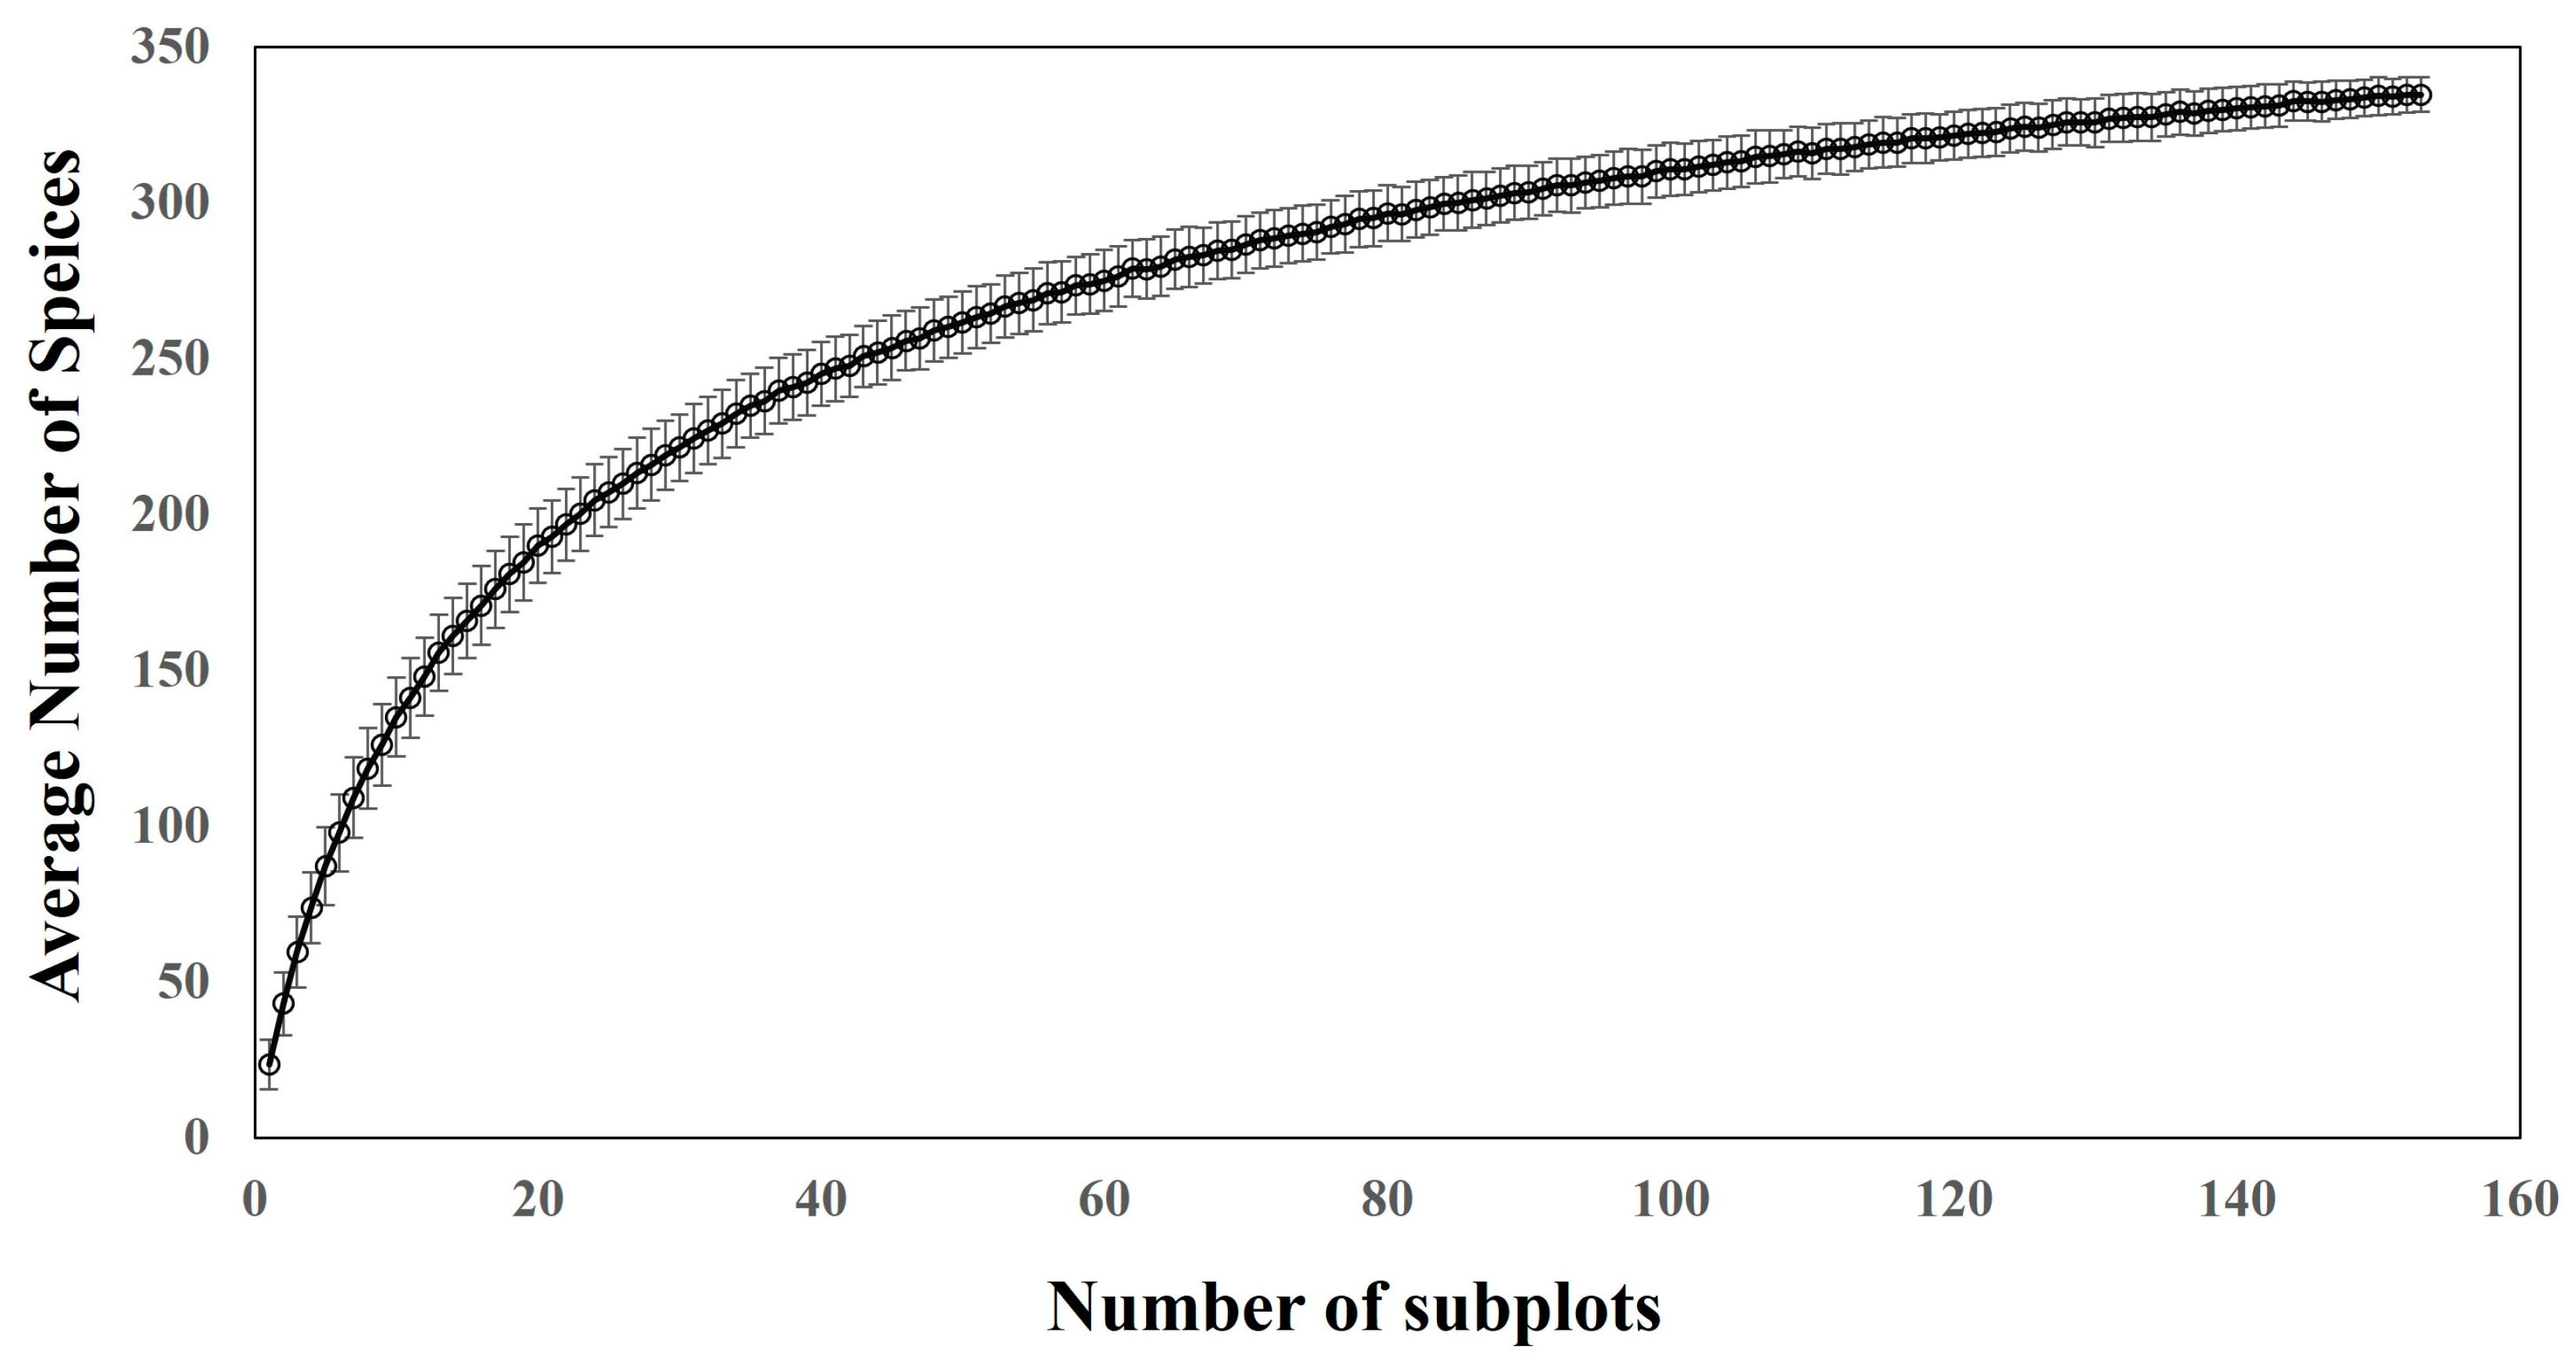
Within the study area, the understory flora consisted of 367 taxa: 81 families, 202 genera, 320 species, 3 subspecies, 40 varieties, and 4 forms (Table 1). According to the species–area analysis (Figure 2), the slope of the species–area curve approached zero as the cumulative plot number increased, indicating that an adequate number of plots was installed for the vegetation analysis.
Environmental factors ordered by elevation group in Mt. Gyebangsan are compared in Table 2. The number of plots per group was as follows: A1 = 35; A2 = 33; A3 = 47; and A4 = 38. The most frequent slope aspects included south for A1, west for A2, east for A3, and north for A4. In our analysis, this aspect was relatively evenly distributed, which facilitated the analysis of understory species composition differences among elevation groups. The mean elevations were 871.3 ± 12.3 m (A1), 1112.5 ± 6.5 m (A2), 1325.6 ± 6.8 m (A3), and 1462.7 ± 6.2 m (A4), with statistically significant differences among groups (p < 0.001). Slope was highest in A3 (24.9 ± 1.3°), but the difference was not significant (p = 0.074). Rock exposure was greatest in A1 (26.3% ± 3.2%), but the difference was not significant (p = 0.074).
The basal area by elevation group was 35.25 ± 2.10 m2/ha (A1), 40.63 ± 2.39 m2/ha (A2), 38.24 ± 3.75 m2/ha (A3), and 27.77 ± 2.82 m2/ha (A4). The lowest basal area occurred in A4, with significant differences among groups (p = 0.009). Stand density was 556 ± 28 stems/ha (A1), 577 ± 33 stems/ha (A2), 970 ± 101 stems/ha (A3), and 814 ± 52 stems/ha (A4). Thus, stand density increased with elevation and showed significant differences (p < 0.001).
Mean temperature and mean wind speed exhibited significant differences among elevation groups (p < 0.001). Mean temperature declined from 6.88 ± 0.07 °C at low elevations (A1) to 5.06 ± 0.03 °C at the highest elevation (A4), while mean wind speed increased from 2.79 ± 0.02 m/s (A1) to 3.39 ± 0.06 m/s (A4). These patterns indicate progressively cooler and more wind-exposed conditions toward higher altitudes, reflecting key environmental drivers of vegetation differentiation along the elevational gradient.
TPI values were –5.81 ± 2.38 (A1), 4.58 ± 2.45 (A2), 5.65 ± 1.78 (A3), and 10.39 ± 1.22 (A4), indicating that TPI increases with elevation (p < 0.001). TWI values were 8.73 ± 0.46 (A1), 7.33 ± 0.33 (A2), 6.36 ± 0.11 (A3), and 6.23 ± 0.07 (A4), indicating that TWI decreases with elevation (p < 0.001).
From the importance-value analysis of understory vegetation by elevation group (Table 3), A1 was ordered Rhododendron schlippenbachii (6.81%) > Quercus mongolica (5.34%) > Acer pseudosieboldianum (4.16%) > Sasa borealis (3.74%); A2 was ordered Sasa borealis (14.80%) > Tripterygium regelii (5.72%) > Acer pseudosieboldianum (3.76%) > Schisandra chinensis (3.60%); A3 was ordered Sasa borealis (6.79%) > Tripterygium regelii (6.23%) > Calamagrostis arundinacea (5.09%) > Acer komarovii (4.50%); and A4 was ordered Tripterygium regelii (6.79%) > Acer barbinerve (5.16%) > Acer komarovii (4.59%) > Acer ukurunduense (3.14%).

3.2. Biodiversity

The species richness, diversity, and evenness results are shown in Table 4. Species richness had the highest mean in A4 (25.79 ± 1.14), although the differences among groups were not significant (p = 0.273). Shannon diversity and evenness also showed the highest mean in A4, and the differences were significant (p < 0.01).
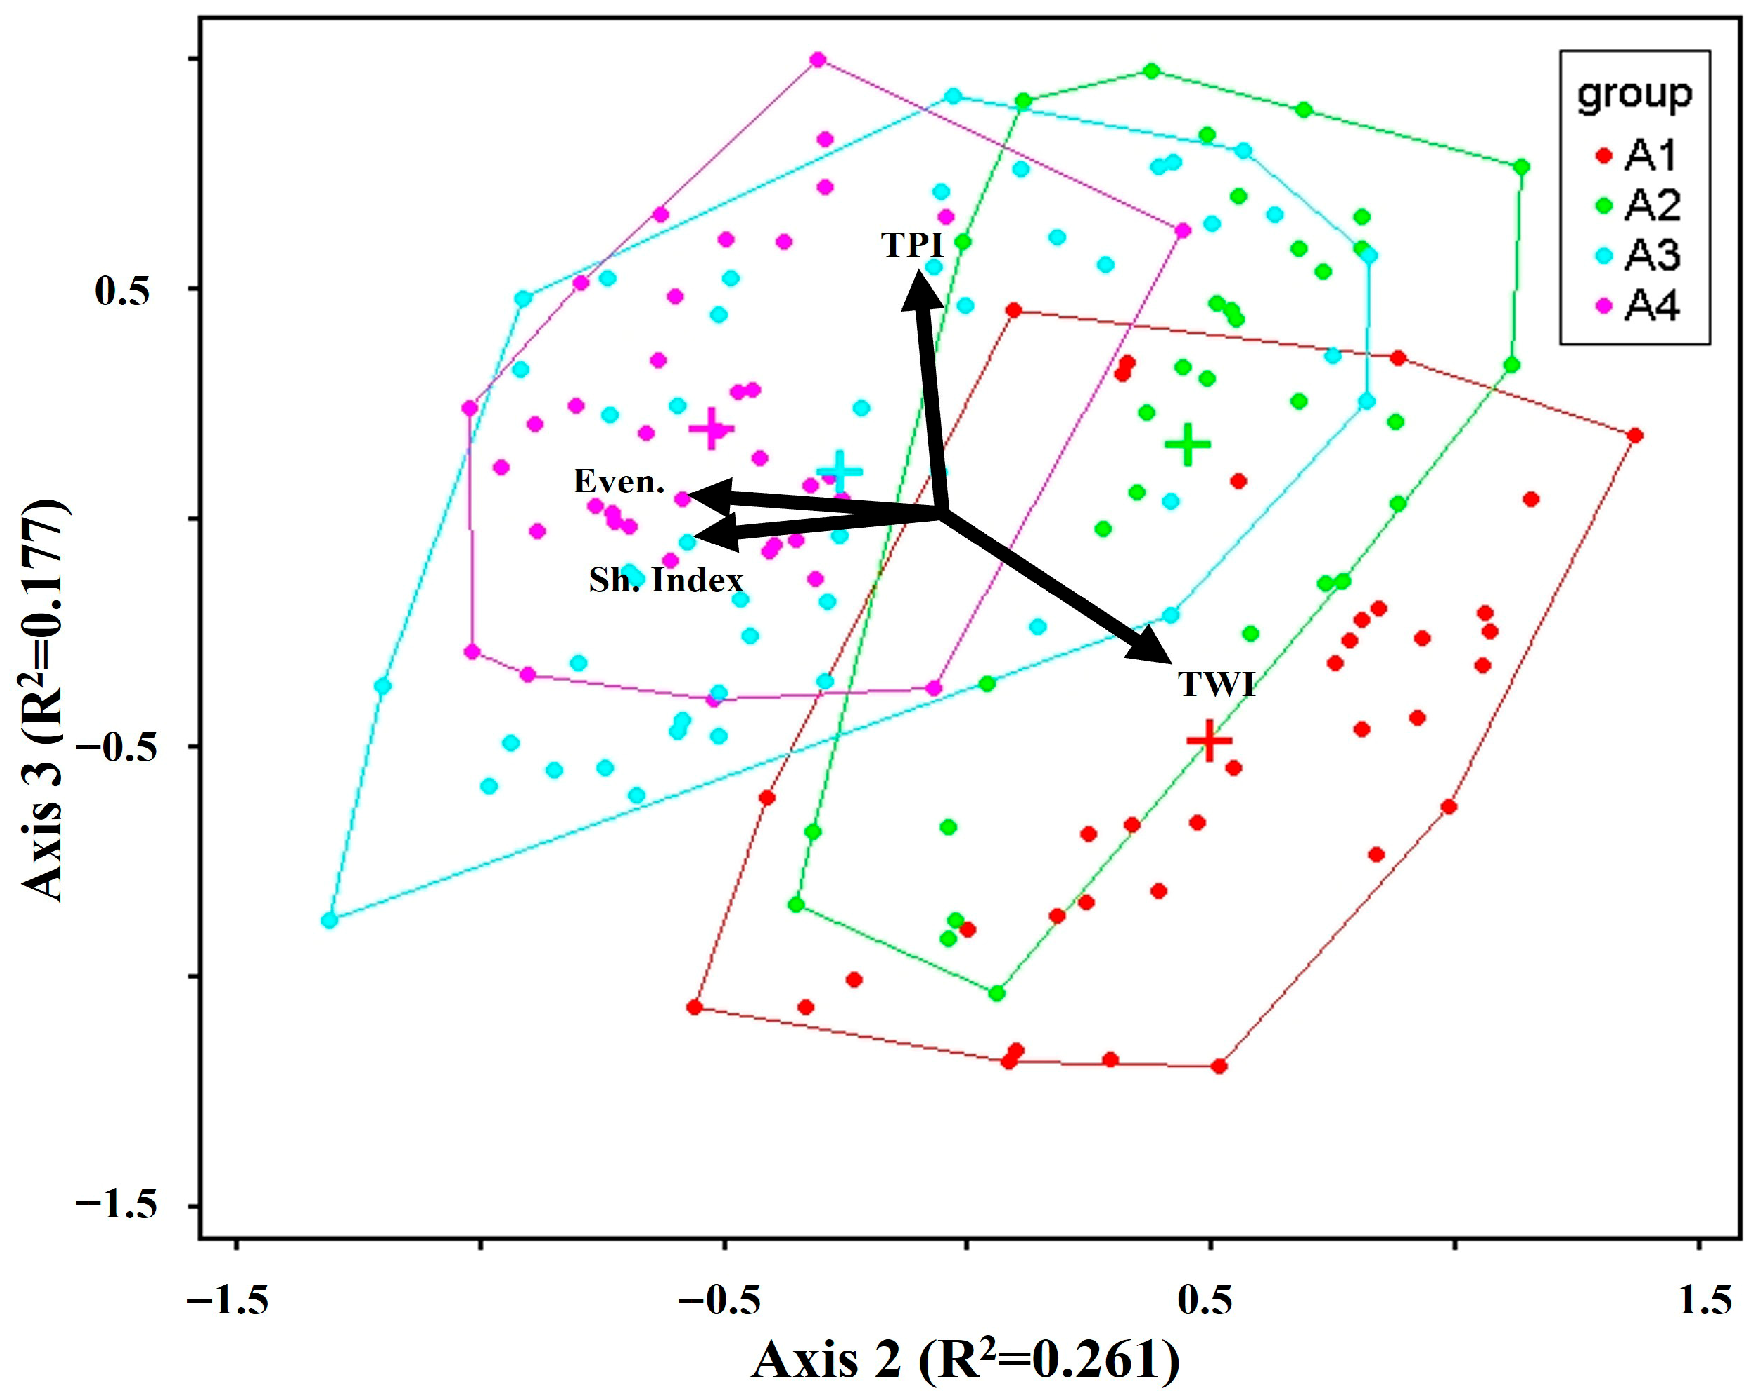
The NMDS ordination among elevation groups is shown in Figure 3. Axes 2 and 3 had the highest explanatory power, with R2 = 0.261 and 0.177, respectively, and the cumulative explanatory power was 0.438. Spatial arrangement of the species composition by elevation group exhibits a central area of overlap. However, the centroids (colored cross marks in Figure 3) indicate that A1 and A2, as well as A3 and A4 were at close proximity, although the two pairs were arranged in distinct spaces. In the NMDS joint plot, A1 was correlated with TWI, whereas the higher-elevation groups A3 and A4 were correlated with evenness, Shannon diversity, and TPI.
To numerically verify the compositional differences, we conducted MRPP tests (Table 5). The heterogeneity of species composition among groups was significant (p < 0.01). The chance-corrected within-group agreement (A) derived from the T statistic was relatively high for A1 vs. A2 (0.2304) and A3 vs. A4 (0.2305), whereas the lowest A was obtained for A1 vs. A4 (0.0315), indicating the greatest dissimilarity. The mean diversity and evenness tended to increase with elevation, and NMDS showed strong associations for A3 and A4.
To examine the degree of shared species and turnover across elevation groups, we analyzed the ζ-diversity and ζ-ratio by the ζ-order (Figure 4a,b). We compared both adjacent elevation groups and physically separated groups and computed values up to order 10 to determine where ζ-diversity approached zero. The ζ-diversity converged to zero between orders 5 and 6 across all comparisons, indicating that 5–6 plots were shared on average. The ζ-decline slope for A1–A2, A1–A3, and A1–A4 decreased sharply, indicating relatively fewer shared species between those groups than in other comparisons. Comparisons that included A4 showed a particularly steep decline from A1 and A2.
In the ζ-ratio analysis (Figure 4c,d), oscillatory patterns appeared between orders 4 and 7. Comparisons including A4 showed sharp decreases in the ratio, whereas only the A1–A2 comparison tended toward values close to 1.
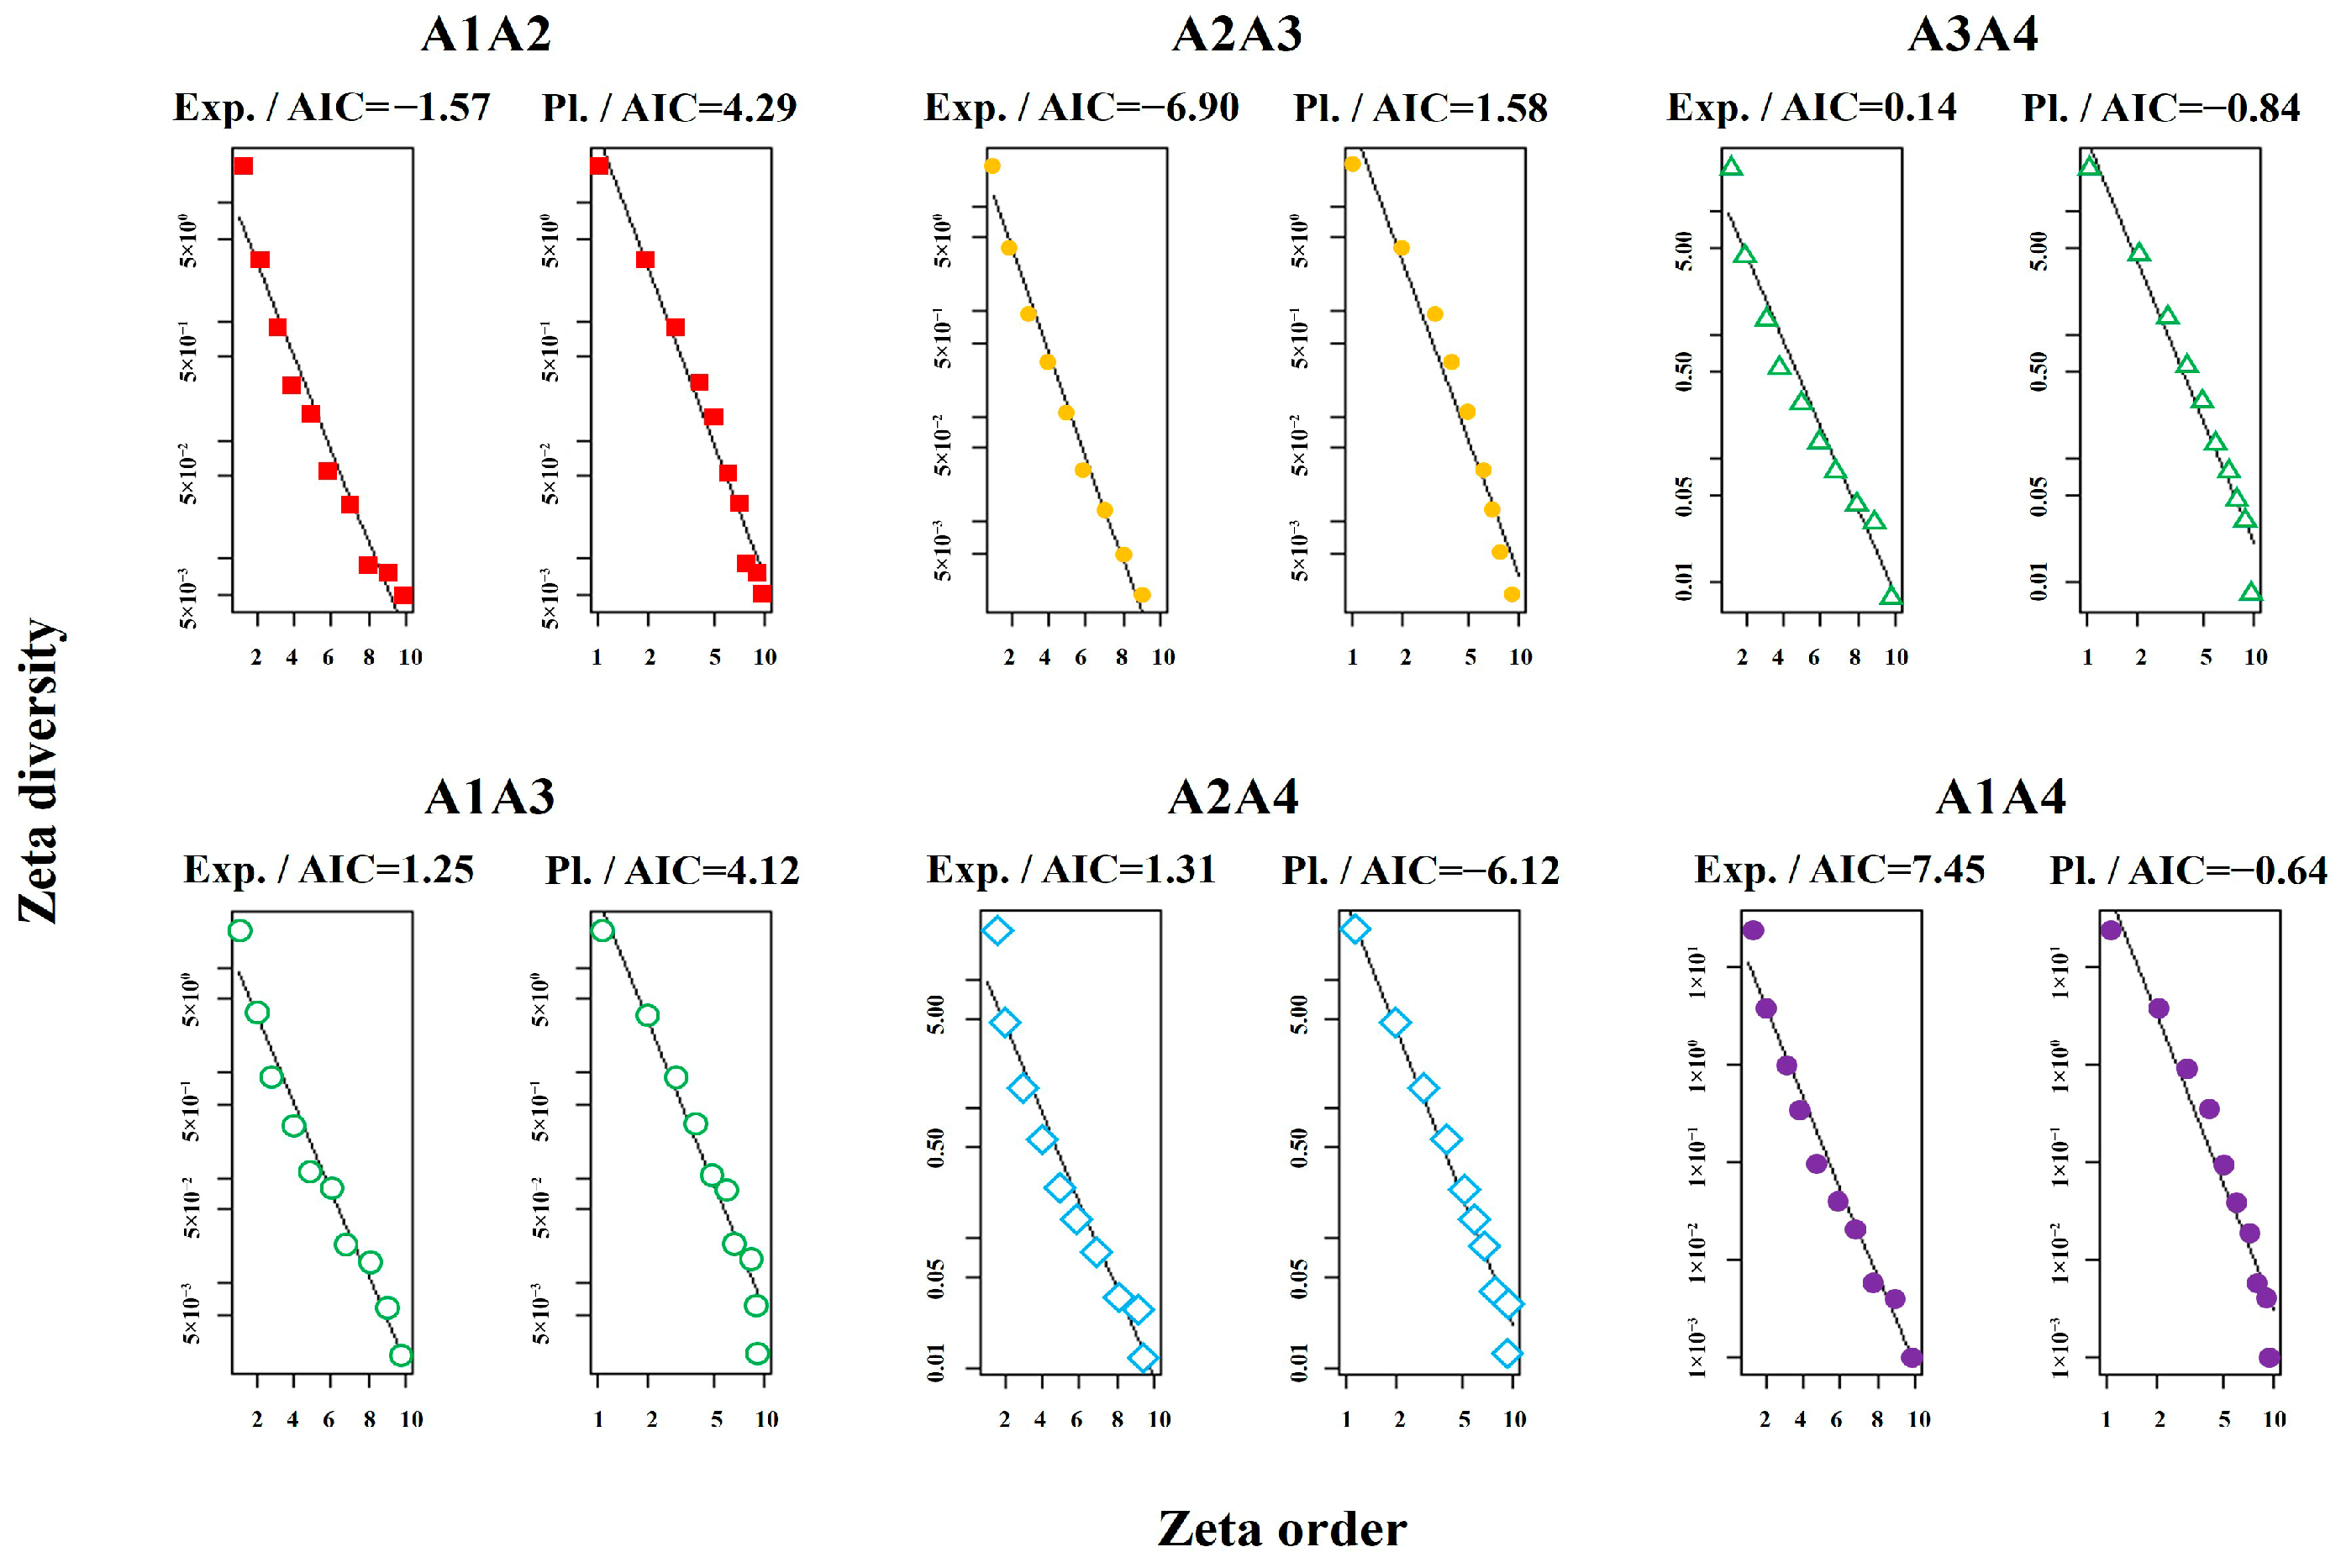
To identify the ecological-process hypothesis that best explains the observed community change, we compared AIC values for exponential vs. power-law fits to the ζ-decline curves (Figure 5). Exponential models fit A1–A2, A2–A3, and A1–A3, whereas power-law models fit the remaining comparisons.

4. Discussion

4.1. Species Composition and Environmental Factors

This study aimed to identify differences in species composition and environmental factors by elevation in Mt. Gyebangsan, a protected ecosystem, and provide baseline information for maintaining and enhancing biodiversity through quantitative and qualitative analyses within specific elevational zones.
Basal area and stand density are key indicators for interpreting forest-ecosystem structure and provide crucial clues for predicting successional processes and stand dynamics [54]. Basal area decreased with elevation, whereas stand density tended to increase. The higher-elevation groups (A3 and A4) experience wind damage and frequent canopy openings, which increase light penetration into stands and likely promote the presence of juvenile woody individuals. The development of the overstory markedly alters within-stand conditions and induces distinct changes in the understory structure [26,55].
With increasing elevation, TPI tended to increase and TWI tended to decrease. The high TPI at higher elevation indicated convex landforms such as ridges and summits [48], which are directly exposed to strong winds. Simultaneously, the lower TWI indicated relatively dry conditions typical of subalpine mixed and conifer forests that arise from strong winds, rapid temperature fluctuations, and soil-layer erosion that reduces the soil water-holding capacity [56,57,58,59].
Importance-value analysis was performed to clarify the species occurrence patterns and ecological implications. In A2, S. borealis was conspicuously abundant. As a rhizomatous species, S. borealis rapidly carpets the ground, inhibits the ingress of other species, and affects understory composition and succession [25]. Nationally, S. borealis has a broad ecological niche and is not strongly constrained by specific environmental factors; moreover, it can temporarily reduce diversity and hinder overstory seed germination [60,61,62]. Around Mt. Gyebangsan, S. borealis mainly occurs in stands of Q. mongolica, which is a major overstory species in Korean forest ecosystems [45,63].
Tripterygium regelii abundance increased with elevation, suggesting that this species, which is primarily distributed in high-mountain environments of Korea’s mid- to northern-temperate zones, may adversely affect overstory development [64]. It also serves as an indicator for Abies nephrolepis forests and can hinder A. nephrolepis regeneration [46,64,65,66].
The importance value of Q. mongolica was highest at a low elevation (A1: 5.34) but sharply decreased at high elevation (A4: 0.32). In contrast, A. komarovii increased from 0.08 (A1) to 4.59 (A4). A. barbinerve and A. ukurunduense also had higher importance values at high elevations (A3, A4), and subalpine conifers such as P. jezoensis and A. nephrolepis began to appear in the understory [20,46,50,65]. A. komarovii and A. barbinerve have wide ecological niches in subalpine conifer forests of Korea and Manchuria and may transition into the overstory in the future [20,46]. In addition, the spatial distribution of A. nephrolepis is similar to that of A. komarovii; thus, the two species show a strong positive association [64].
Differences in ecological niches among plant species reflect habitat-environment differences, and species that share niches tend to inhabit similar conditions. In other words, a plant’s ecological niche is interpreted as its differential capacity to adapt to specific environments [66,67]. Understory woody species respond sensitively to microenvironmental changes along elevation; thus, these changes directly influence the direction and rate of succession. In the present study area, although Mongolian oak dominated at low elevations, competition with Acer species increased with elevation. Along the Baekdudaegan range, Q. mongolica varies in population size, growth status, and composition by elevation [68]. Acer species are generally shade-tolerant [69] and may dominate the overstory with further canopy development [46]. This study showed results that differed from those of Kim et al. [70], who reported the dominance of Quercus mongolica at higher elevations in Mt. Gyebangsan. However, the findings of Cheon et al. [71] support our results, as they observed significant changes in species composition over a 5–10 years period in Mt. Gyebangsan. In particular, the genus Acer, which includes shade-tolerant species, exhibited high importance values in the higher-elevation plots. As this study was based on short-term observations, it could not fully elucidate long-term successional trajectories. Therefore, continued long-term ecological monitoring with specific hypotheses is required [22].

4.2. Biodiversity

Although many factors shape biodiversity patterns along elevation gradients, climatic variables exert the greatest influence [29]. Climate indirectly affects the physiological adaptation of plants within habitats, especially the growth and photosynthesis of the understory [72].
In the northern temperate forest bioclimatic zones of Korea, forests generally transition from deciduous broad-leaved forests to mixed conifer–broad-leaved forests with increasing elevation, and understory diversity tends to increase during this transition [31]. Our study corroborates this pattern based on the pronounced changes in understory species composition at higher elevations. High-elevation regions frequently experience physical disturbances such as strong winds, low temperatures, and snow damage, which often damage the canopy and maintain secondary-forest structures [73,74,75,76]. Such disturbances promote early-successional species and understory proliferation, thereby supporting high species diversity, even under relatively limited light and spatial niches [77,78].
At high elevations, the mean basal area is low but the number of individuals is high, resulting in high stand density [75]. This indicates simultaneous regeneration by many individuals after disturbance, which in turn increases both diversity and evenness. Thus, our results suggest that biodiversity changes along elevation are primarily controlled by climatic factors.
Habitat area is also important for diversity. According to the species–area relationship, larger habitats tend to harbor more species [79] because they provide varied microenvironments that promote species differentiation [80]. In Korea’s mountainous terrain, low elevations have gentler and broader terrain, whereas higher elevations above 1000 m have a narrower and steeper terrain [81]. Thus, biodiversity might be expected to decrease with elevation as landforms simplify [82,83]. However, we observed increasing α-diversity with elevation. We interpret this as the creation of diverse microhabitats due to abrupt topographic changes and microclimate formation at high elevations and the increased opportunity for species influx under frequent wind disturbances [46,76]. Hence, the observed biodiversity increase at our site appears strongly governed by climatic controls.
ζ-Diversity, the number of shared species among habitats, generally decreases with increasing ζ-order and is used to interpret habitat heterogeneity and environmental boundaries [11,84]. A steep ζ-diversity decline indicates a rapid reduction in shared species across habitats, reflecting sharply defined habitat boundaries enforced by environmental constraints [11,12,84].
In our study, the ζ-ratio of the high-elevation groups A3 and A4 decreased with increasing ζ-order, indicating fewer shared species compared with the other regions. The fit of the ζ-decline pattern at high elevations to a power-law model supports deterministic processes, implying environmental filtering. This indicates that high-elevation areas form distinct biodiversity patterns, thus providing an ecological basis for the maintenance of independent relict populations [85,86,87].
Consistent with our findings, previous studies conducted in the same region have also reported non-linear diversity patterns along the elevational gradient. An et al. [88] observed that species richness decreased with elevation and then increased again at higher altitudes, showing a reverse hump-shaped pattern. Similarly, Cheon et al. [71] reported that the number of indicator species was lower at mid-elevations but increased again at higher elevations.
It is noteworthy that the study by Yang et al. [89] was conducted nearly a decade earlier than our survey. Over time, the elevational pattern of species richness in Mt. Gyebangsan appears to have shifted from a unimodal (hump-shaped) distribution—peaking around 800–1000 m—to a reverse hump-shaped trend, as reported by An et al. [88] and in the present study. While part of this difference may arise from variations in sampling design and analytical scale, it may also reflect distinct ecological processes, such as increased disturbance frequency, microclimatic variability, and habitat heterogeneity, acting more strongly in the high-elevation zones of Mt. Gyebangsan.
This temporal change may indicate that disturbance events have become more frequent and intense in high-elevation habitats, resulting in more dynamic processes of species immigration and emigration. Such dynamics are consistent with our ζ-diversity analysis, which revealed stronger environmental filtering and greater compositional turnover toward higher elevations. Collectively, these findings suggest that species composition and diversity along elevation in Mt. Gyebangsan are shaped by complex interactions among climatic stress, disturbance regimes, and habitat heterogeneity. In particular, the high-elevation zones, characterized by frequent canopy openings and pronounced microclimatic fluctuations, promote the coexistence of shade-tolerant and disturbance-adapted species, thereby maintaining relatively high understory diversity. The consistent patterns observed across studies highlight that elevational gradients in this region serve as a primary driver of biodiversity structure and turnover.
Moreover, although α- and β-diversity are limited to describing diversity within a single habitat or between two habitats, ζ-diversity quantifies cumulative biodiversity changes across multiple habitats, enabling quantitative evaluation of landscape-scale turnover and shared-species structure. Thus, ζ-diversity provides a broader analytical framework for interpreting spatial biodiversity complexity at regional scales.

4.3. Limitation and Implications

In this study, air temperature and wind speed data were derived from gridded climate datasets (WorldClim 2.1), and therefore microclimatic variations within the forest were not fully captured. Future research should incorporate fine-scale environmental measurements to complement these large-scale datasets and enhance ecological interpretation.
Our findings highlight that elevational ecosystems, particularly those at higher altitudes, require adaptive conservation approaches that consider the dynamic processes of ecosystem change. Understanding the ecological mechanisms underlying biodiversity shifts along elevation is essential for evaluating and managing protected areas under climate change.
Continuous biodiversity monitoring will also help elucidate the time-series relationships between biotic and abiotic factors, thereby enabling the establishment of proactive conservation strategies. Furthermore, research that integrates the functional aspects of specific habitats—such as those addressed in this elevational study—will provide deeper insights into how ecosystem changes ultimately influence human well-being.

5. Conclusions

This study examined elevational patterns of biodiversity in Mt. Gyebangsan, a representative protected ecosystem in Korea. Species richness (α-diversity) tended to increase with elevation, and high-elevation groups (A3, A4) showed distinct species compositions in the NMDS ordination. Declines in ζ-diversity indicated stronger species turnover with increasing elevational distance, emphasizing that altitude is a key determinant of biodiversity structure.
Microclimatic differences—such as temperature, precipitation, slope, and soil moisture—were quantitatively verified as major drivers of compositional variation. These results support previous ecological theories and confirm the environmental filtering effects operating along the elevational gradient.
Given the ongoing impacts of climate change, long-term monitoring that integrates ζ-diversity with GIS- and remote-sensing–based systems is essential to capture temporal biodiversity shifts. Utilizing national ecosystem datasets and predictive modeling will enhance the precision of biodiversity forecasting and support evidence-based conservation planning.

Author Contributions

Conceptualization, B.-J.P.; methodology, K.C. and B.-J.P.; software, K.C. and B.-J.P.; validation, K.C., E.-S.L. and B.-J.P.; formal analysis, B.-J.P.; investigation, K.C. and B.-J.P.; resources, K.C. and E.-S.L.; data curation, E.-S.L. and B.-J.P.; writing—original draft preparation, K.C. and B.-J.P.; writing—review and editing, B.-J.P.; visualization, B.-J.P.; supervision, B.-J.P.; project administration, K.C.; funding acquisition, K.C. All authors have read and agreed to the published version of the manuscript.

Funding

This research was funded by the National Institute of Ecology (Project No. NIE-B-2025-03) and Korea Environment Industry and Technology Institute (KEITI) through Climate Change R&D Project for New Climate Regime, funded by Korea Ministry of Environment (MOE) (RS-2022-KE002369).

Institutional Review Board Statement

Not applicable.

Data Availability Statement

The raw data supporting the conclusions of this article will be made available by the authors on request.

Acknowledgments

We thank all participants involved in the National Ecosystem Survey for their contributions.

Conflicts of Interest

The authors declare no conflicts of interest.

Abbreviations

The following abbreviations are used in this manuscript:
NMDSnon-metric multidimensional scaling
MRPPmulti-response permutation procedure
Ttest statistic
Awithin-group agreement
AICAkaike’s information criterion
TPItopographic position index
TWItopographic wetness index
RCrelative coverage
RFrelative frequency

References

  1. Whittaker, R.H. Evolution and measurement of species diversity. Taxon 1972, 21, 213–251. [Google Scholar] [CrossRef]
  2. MacArthur, R.H. Patterns of species diversity. Biol. Rev. 1965, 40, 510–533. [Google Scholar] [CrossRef]
  3. Magurran, A.E. Measuring Biological Diversity; Blackwell Publishing: Oxford, UK, 2004; pp. 72–161. ISBN 9780632056330. [Google Scholar]
  4. Whittaker, R.H. Vegetation of the Siskiyou Mountains, Oregon and California. Ecol. Monogr. 1960, 30, 279–338. [Google Scholar] [CrossRef]
  5. Fisher, R.A.; Corbet, A.S.; Williams, C.B. The relation between the number of species and the number of individuals in a random sample of an animal population. J. Anim. Ecol. 1943, 12, 42–58. [Google Scholar] [CrossRef]
  6. Shannon, C.E. A mathematical theory of communication. Bell Syst. Tech. J. 1948, 27, 379–423. [Google Scholar] [CrossRef]
  7. Simpson, E.H. Measurement of diversity. Nature 1949, 163, 688. [Google Scholar] [CrossRef]
  8. Jaccard, P. The distribution of the flora in the alpine zone. New Phytol. 1912, 11, 37–50. [Google Scholar] [CrossRef]
  9. Legendre, P.; De Cáceres, M. Beta diversity as the variance of community data: Dissimilarity coefficients and partitioning. Ecol. Lett. 2013, 16, 951–963. [Google Scholar] [CrossRef]
  10. McCune, B.; Grace, J.B. Analysis of Ecologcial Communities; MjM Software Design: Gleneden Beach, OR, USA, 2002; pp. 15–204. ISBN 9780972129008. [Google Scholar]
  11. Hui, C.; McGeoch, M.A. Zeta diversity as a concept and metric that unifies incidence-based biodiversity patterns. Am. Nat. 2014, 184, 684–694. [Google Scholar] [CrossRef]
  12. Latombe, G.; McGeoch, M.A.; Nipperess, D.A.; Hui, C. zetadiv: Functions to compute compositional turnover using zeta diversity. Methods Ecol. Evol. 2018, 9, 431–442. [Google Scholar]
  13. Koo, K.A.; Park, S.U. A review of ecological niche theory from the early 1000s to the present. Korean J. Environ. Ecol. 2021, 35, 316–335. [Google Scholar] [CrossRef]
  14. Convention on Biological Diversity. Available online: https://www.cbd.int/gbf (accessed on 29 July 2025).
  15. Lee, W.T. Coloured Standard Illustrations of Korean Plants; Academy Books: Seoul, Republic of Korea, 1996; pp. 1–1688. ISBN 9788976161598. [Google Scholar]
  16. Kim, C.H. A study on the plant community classification of Korean forests. Korean J. Ecol. 1992, 15, 125–140. [Google Scholar]
  17. Yun, S.H.; Kim, J.H.; Lee, J.H. Effects of habitat fragmentation on plant species diversity in Korean forests. J. Ecol. Environ. 2016, 39, 341–355. [Google Scholar]
  18. Choi, H.S.; Park, S.J.; Lee, B.Y. Predicting future plant diversity changes in response to climate change in South Korea. Ecol. Model. 2020, 419, 108960. [Google Scholar]
  19. Lee, C.B.; Chun, J.H.; Kim, H.H. Elevational patterns and determinants of α and β plant diversity on the ridge of the Baekdudaegan Mountains, South Korea. J. Agric. Life Sci. 2014, 48, 93–104. [Google Scholar] [CrossRef]
  20. Park, B.J.; Byeon, J.G.; Heo, T.I.; Cheon, K.; Yang, J.C.; Oh, S.H. Comparison of species composition among Picea jezoensis (Siebold & Zucc.) Carrière forests in Northeast Asia (from China to South Korea). J. Asia-Pac. Biodivers. 2023, 16, 272–281. [Google Scholar]
  21. Park, B.J.; Kim, J.J.; Byeon, J.G.; Cheon, K.I.; Joo, S.H.; Lee, Y.G. Classification of forest community and characteristics of stand structure in Mt. Myeonbong—Focused on the research forest of Kyungpook National University, Cheongsong. J. Korean For. Soc. 2016, 105, 391–400. [Google Scholar] [CrossRef]
  22. Son, Y.H. Long-term ecological research: Importance and approaches. Nat. Resour. Res. 1997, 5, 29–42. [Google Scholar]
  23. Kim, H.G.; Oh, S.H.; Cho, Y.C. Structurization in community composition and diversity pattern of soil seed banks in Gwangneung Forest, South Korea. J. Korean For. Sci. 2021, 110, 577–589. [Google Scholar]
  24. Jung, S.; Sim, H.S.; Kim, J.S.; Bae, K.H.; Cho, Y.C. Processes driving understory community dynamics in Ulleungdo Island broadleaved forest, South Korea. Ecol. Res. 2021, 36, 686–700. [Google Scholar] [CrossRef]
  25. Cheon, K.I.; Joo, S.H.; Sung, J.H.; Chun, J.H.; Lee, Y.G. Understory vegetation structure by altitude and azimuth slope and indicator species analysis in Mt. Gyebang. J. Korean For. Sci. 2014, 103, 165–174. [Google Scholar] [CrossRef]
  26. Leith, H.; Aston, D.H. The light compensation point of some herbaceous plants inside and outside deciduous woods in Germany. Can. J. Bot. 1961, 39, 1255–1259. [Google Scholar] [CrossRef]
  27. Gilliam, F.S. The ecological significance of the herbaceous layer in temperate forest ecosystems. Bioscience 2007, 57, 845–858. [Google Scholar] [CrossRef]
  28. Mabry, C.M.; Gerken, M.E.; Thompson, J.R. Seasonal storage of nutrients by perennial herbaceous species in undisturbed and disturbed deciduous hardwood forests. Appl. Veg. Sci. 2008, 11, 37–44. [Google Scholar] [CrossRef]
  29. McCain, C.M. Global analysis of bird elevational diversity. Glob. Ecol. Biogeogr. 2009, 18, 346–360. [Google Scholar] [CrossRef]
  30. Davidar, P.; Rajagopal, B.; Mohandass, D.; Puyravaud, J.P.; Condit, R.; Wright, S.J.; Leigh, E.G., Jr. The effect of climatic gradients, topographic variation and species traits on the beta diversity of rainforest trees. Glob. Ecol. Biogeogr. 2007, 16, 510–518. [Google Scholar] [CrossRef]
  31. Korea National Arboretum. Forest of Korea(IV) Biogeography of Korea: Flora and Vegetation; Sumeungil: Seoul, Republic of Korea, 2020; pp. 42–79. ISBN 9791190509497. [Google Scholar]
  32. The Services of Climatic Data Portal of Korea Meteorological Administration. Available online: https://data.kma.go.kr/cmmn/main.do/ (accessed on 1 August 2025).
  33. Braun–Blanquet, J. Pflanzensoziologie: Grundzüge der Vegetationskunde; Springer: Wien, Austria, 1964; pp. 17–205. ISBN 9783709181119. [Google Scholar]
  34. Lee, T.B. Coloured Flora of Korea; Hyangmoonsa: Seoul, Republic of Korea, 2003; Volume 1, pp. 1–916. ISBN 9788971871959. [Google Scholar]
  35. Lee, T.B. Coloured Flora of Korea; Hyangmoonsa: Seoul, Republic of Korea, 2003; Volume 2, pp. 1–910. ISBN 9788971871966. [Google Scholar]
  36. Korea Fern Society. Ferns and Fern Allies of Korea; Geobook: Seoul, Republic of Korea, 2005; pp. 1–399. ISBN 9788995504925. [Google Scholar]
  37. Korea National Arboretum. Rare Plants Data Book in Korea; Geobook: Seoul, Republic of Korea, 2008; pp. 1–332. ISBN 9788991458352. [Google Scholar]
  38. Korea National Arboretum. Invasive Alien Plant Impact on Forest; Sumeungil: Seoul, Republic of Korea, 2015; pp. 1–280. ISBN 9791187031185. [Google Scholar]
  39. Korea National Arboretum. Checklist of Vascular Plants in Korea; Samsung edCOM: Seoul, Republic of Korea, 2017; pp. 1–1000. ISBN 9791188720125. [Google Scholar]
  40. Cho, Y.H.; Kim, J.H.; Park, S.H. Grasses and Sedges in South Korea; Geobook: Seoul, Republic of Korea, 2016; pp. 1–528. ISBN 9788994242422. [Google Scholar]
  41. Knowledge System of National Species in Korea. Available online: http://www.nature.go.kr/kpni/index.do (accessed on 3 August 2025).
  42. Korea National Arboretum: The List of National Species: Vascular Plants. Available online: https://www.nature.go.kr/kpni/stndasrch/dtl/selectNtnStndaPlantList1.do (accessed on 3 August 2025).
  43. Park, I.H.; Seo, Y.K. Plot size for investigating forest community structure (V): Adequate number of plots for tree and shrub strata in a mixed forest community of broad-leaved trees at Guryongsan area. Korean J. Environ. Ecol. 2002, 15, 394–400. [Google Scholar]
  44. Chao, A.; Chazdon, R.L.; Colwell, R.K.; Shen, T.J. A new statistical approach for assessing similarity of species composition with incidence and abundance data. Ecol. Lett. 2005, 8, 148–159. [Google Scholar] [CrossRef]
  45. Mielke, P.W., Jr. Meteorological applications of permutation techniques based on distance functions. In Handbook of Statistics; Krishnaiah, P.R., Ed.; Elsevier: Amsterdam, The Netherlands, 1984; Volume 4, pp. 813–830. [Google Scholar]
  46. Cheon, K.; Byeon, J.G.; Kim, J.I.; Park, B.J. Community structure of Abies nephrolepis habitats and characteristics of understory vegetation in Mt. Gyebang and Mt. Odae. J. Korean Environ. Restor. Technol. 2022, 25, 59–76. [Google Scholar]
  47. Petroselli, A.; Vessella, F.; Lucia, C.; Piovesan, G.; Schirone, B. Ecological behavior of Quercus suber and Quercus ilex inferred by topographic wetness index (TWI). Trees 2013, 27, 1201–1215. [Google Scholar] [CrossRef]
  48. Zwolinski, Z.; Stefańska, E. Relevance of moving window size in landform classification by TPI. In Geomorphometry for Geosciences; Bogucki Wydawnictwo Naukowe: Poznań, Poland, 2015; pp. 273–277. [Google Scholar]
  49. Curtis, J.T.; McIntosh, R.P. An upland forest continuum in the prairie–forest border region of Wisconsin. Ecology 1951, 32, 476–496. [Google Scholar] [CrossRef]
  50. Park, B.J.; Heo, T.I.; Cheon, K.I. Analyzing generalist plant species using topographic characteristics of Picea jezoensis (Siebold & Zucc.) Carrière forests in East Asia: From China (Mt. Changbai) to South Korea. Int. J. Plant Biol. 2024, 15, 320–339. [Google Scholar] [CrossRef]
  51. Akaike, H. A new look at the statistical model identification. IEEE Trans. Autom. Control 1974, 19, 716–723. [Google Scholar] [CrossRef]
  52. Gaston, K.J.; He, F. The distribution of species range size: A stochastic process. Proc. R. Soc. Lond. B Biol. Sci. 2002, 269, 1079–1086. [Google Scholar] [CrossRef]
  53. Zuppinger-Dingley, D.; Schmid, B.; Petermann, J.S.; Yadav, V.; De Deyn, G.B.; Flynn, D.F. Selection for niche differentiation in plant communities increases biodiversity effects. Nature 2014, 515, 108–111. [Google Scholar] [CrossRef]
  54. Newton, A.C. Forest Ecology and Conservation; Oxford University Press Inc.: New York, NY, USA, 2007; pp. 85–146. ISBN 9780198567455. [Google Scholar]
  55. Park, B.J.; Cheon, K. Herbaceous layer response to Overstory vegetation change in Quercus mongolica Fisch. ex Ledeb. Forests in Korea. Forests 2025, 16, 1344. [Google Scholar] [CrossRef]
  56. Germino, M.J.; Smith, W.K.; Resor, A.C. Conifer seedling distribution and survival in an alpine-treeline ecotone. Plant Ecol. 2002, 162, 157–168. [Google Scholar] [CrossRef]
  57. Kong, W.S. Species composition and distribution of Korean Alpine Plants. J. Korean Geogr. Soc. 2002, 37, 357–370. [Google Scholar]
  58. Mori, A.; Mizumachi, E.; Osono, T.; Doi, Y. Substrate-associated seedling recruitment and establishment of major conifer species in an old-growth subalpine forest in central Japan. For. Ecol. Manag. 2004, 196, 287–297. [Google Scholar] [CrossRef]
  59. Han, A.R.; Lee, S.K.; Suh, G.U.; Park, Y.; Park, P.S. Wind and topography influence the crown growth of Picea jezoensis in a subalpine forest on Mt. Deogyu, Korea. Agric. For. Meteorol. 2012, 166–167, 207–214. [Google Scholar] [CrossRef]
  60. Cha, Y.J.; Lee, K.J. Nutrient contents and biomass production of dwarf bamboo (Sasa borealis) along the developmental stages of deciduous forests after clearcutting in Mt. Baekwoon, Chonnam Province, Korea. J. Korean For. Soc. 2002, 91, 396–404. [Google Scholar]
  61. Park, S.G.; Yi, M.H.; Yoon, J.W.; Shin, H.T. Environmental factors and growth properties of Sasa borealis (Hack.) Makino community and its effects on the development of lower vegetation in Jirisan National Park. Korean J. Environ. Ecol. 2012, 26, 82–90. [Google Scholar]
  62. Kim, J.D.; Lim, J.H.; Yun, C.W. Dynamics of Abies nephrolepis seedlings in relation to environmental factors in Seorak Mountain, South Korea. Forests 2019, 10, 702. [Google Scholar] [CrossRef]
  63. Kim, J.W.; Lee, Y.G. Classification and Assessment of Plant Communities; World Science: Seoul, Republic of Korea, 2006; pp. 14–72. ISBN 9788958810605. [Google Scholar]
  64. Lee, A.R.; Shin, D.B.; Lee, S.J.; Byeon, J.G.; Kim, J.S.; Oh, S.H. Vegetation structure and characteristic analysis of the Abies nephrolepis forest according to the appearance of Tripterygium regelii. J. Korean For. Soc. 2023, 112, 405–416. [Google Scholar]
  65. Park, B.J.; Heo, T.I. Vegetation structure of Mt. Bangtae among protected areas for forest genetic resource conservation. Korean J. Plant Resour. 2024, 37, 461–474. [Google Scholar]
  66. Pickett, S.T.A. Population patterns through twenty years of old-field changes. Plant Ecol. 1982, 49, 45–59. [Google Scholar] [CrossRef]
  67. Li, G.; Gong, Z.; Li, W. Niches and Interspecifc associations of dominant populations in three changed stages of natural secondary forests on Loess Plateau, P.R. China. Sci. Rep. 2017, 7, 6604. [Google Scholar]
  68. Jeong, B.K.; Oh, C.H. Analysis on the community structure of Quercus mongolica in the Baekdudaegan Mountains by elevation. Korean J. Environ. Ecol. 2013, 27, 449–461. [Google Scholar]
  69. Ko, D.W.; Lee, D.W. Dendroecological reconstruction of disturbance dynamics and human legacy in an old-growth hardwood forest in Korea. For. Ecol. Manag. 2013, 302, 43–53. [Google Scholar] [CrossRef]
  70. Kim, C.H.; Oh, J.G.; Kang, E.O.; Yun, C.S.; Lim, J.K. Community distribution on mountain forest vegetation of the Gyebangsan area in the Odaesan National Park, Korea. Korean J. Ecol. Environ. 2014, 47, 135–145. [Google Scholar] [CrossRef]
  71. Cheon, K.I.; Chun, J.H.; Yang, H.M.; Lim, J.H.; Shin, J.H. Changes of understory vegetation structure for 10 years in long-term ecological research site at Mt. Gyebang. J. Korean Soc. For. Sci. 2014, 103, 1–11. [Google Scholar] [CrossRef]
  72. Hawkins, B.A.; Field, R.; Cornell, H.V.; Currie, D.J.; Guégan, J.F.; Kaufman, D.M.; Kerr, J.T.; Mittelbach, G.G.; Oberdorff, T.; O’Brien, E.M.; et al. Energy, water, and broad-scale geographic patterns of species richness. Ecology 2003, 84, 3105–3117. [Google Scholar] [CrossRef]
  73. Hunziker, U.; Brang, P. Microsite patterns of conifer seedling establishment and growth in a mixed stand in the southern Alps. For. Ecol. Manag. 2005, 210, 67–79. [Google Scholar] [CrossRef]
  74. Kong, W.S.; Kim, K.; Lee, S.; Park, H.; Cho, S.H. Distribution of high mountain plants and species vulnerability against climate change. J. Environ. Impact Assess. 2014, 23, 119–136. [Google Scholar] [CrossRef]
  75. Körner, C. Concepts in alpine plant ecology. Plants 2023, 12, 2666. [Google Scholar] [CrossRef]
  76. Park, B.J.; Heo, T.I.; Cheon, K. Ecological niches of generalist and specialist plants in the subalpine conifer habitats (Abies sp.) of Northeast Asia: From South Korea to the Manchurian region of China. Forests 2024, 15, 2119. [Google Scholar] [CrossRef]
  77. Grime, J.P. Competitive exclusion in herbaceous vegetation. Nature 1973, 242, 344–347. [Google Scholar] [CrossRef]
  78. Veblen, T.T. Regeneration dynamics. In Plant Succession: Theory and Prediction; Glenn-Lewin, D.C., Peet, R.K., Veblen, T.T., Eds.; Chapman & Hall: London, UK, 1992; pp. 152–187. [Google Scholar]
  79. McCain, C.M. Area and mammalian elevational diversity. Ecology 2007, 88, 76–86. [Google Scholar] [CrossRef]
  80. Rosenzweig, M.L. Species Diversity in Space and Time; Cambridge University Press: Cambridge, UK, 1995; pp. 1–436. ISBN 9780521493463. [Google Scholar]
  81. Kim, J.; Lee, M.; Kong, W.; Kim, T.; Kang, C.; Park, K.; Park, B.; Park, H.; Sung, H.; Son, M.; et al. The Physical Geography of Korea; Seoul National University Press: Seoul, Republic of Korea, 2022; pp. 1–496. ISBN 9788952121929. [Google Scholar]
  82. Kim, J.U.; Park, S.Y.; Lee, C.H. Geomorphology; Seoul National University Press: Seoul, Republic of Korea, 2003; pp. 1–420. ISBN 9788970965513. [Google Scholar]
  83. National Institute of Forest Science. Forest Ecosystems of Korea; Korea Forest Service: Daejeon, Republic of Korea, 2015; pp. 1–310. ISBN 9788989863709. [Google Scholar]
  84. McGeoch, M.A.; Latombe, M.; Andrew, N.R.; Nakagawa, S.; Nipperess, D.A.; Roigé, M.; Marzinelli, E.M.; Campbell, A.H.; Vergés, A.; Thomas, T.; et al. Measuring continuous compositional change using decline and decay in zeta diversity. Ecology 2019, 100, e02832. [Google Scholar] [CrossRef]
  85. Habel, J.C.; Assmann, T.; Schmitt, T.; Avise, J.C. Relict Species: From Past to Future; Springer: Berlin, Germany, 2010; pp. 1–5. ISBN 9783540921608. [Google Scholar]
  86. Grandcolas, P.; Nattier, R.; Trewick, S. Relict species: A relict concept? Trends Ecol. Evol. 2014, 29, 655–663. [Google Scholar] [CrossRef]
  87. Legg, S. IPCC, 2021: Climate Change 2021-The Physical Science Basis. Interaction 2021, 49, 44–45. [Google Scholar]
  88. An, J.H.; Park, H.J.; Nam, G.H.; Lee, B.Y.; Park, C.H.; Kim, J.H. Vertical distribution of vascular plant species along an elevational gradient in the Gyebangsan area of Odaesan National Park. Korean J. Ecol. Environ. 2017, 50, 381–402. [Google Scholar] [CrossRef]
  89. Yang, J.C.; Hwang, H.S.; Lee, H.J.; Jung, S.Y.; Ji, S.J.; Oh, S.H.; Lee, Y.M. Distribution of vascular plants along the altitudinal gradient of Gyebangsan (Mt.) in Korea. J. Asia-Pac. Biodivers. 2014, 7, e40–e71. [Google Scholar] [CrossRef]
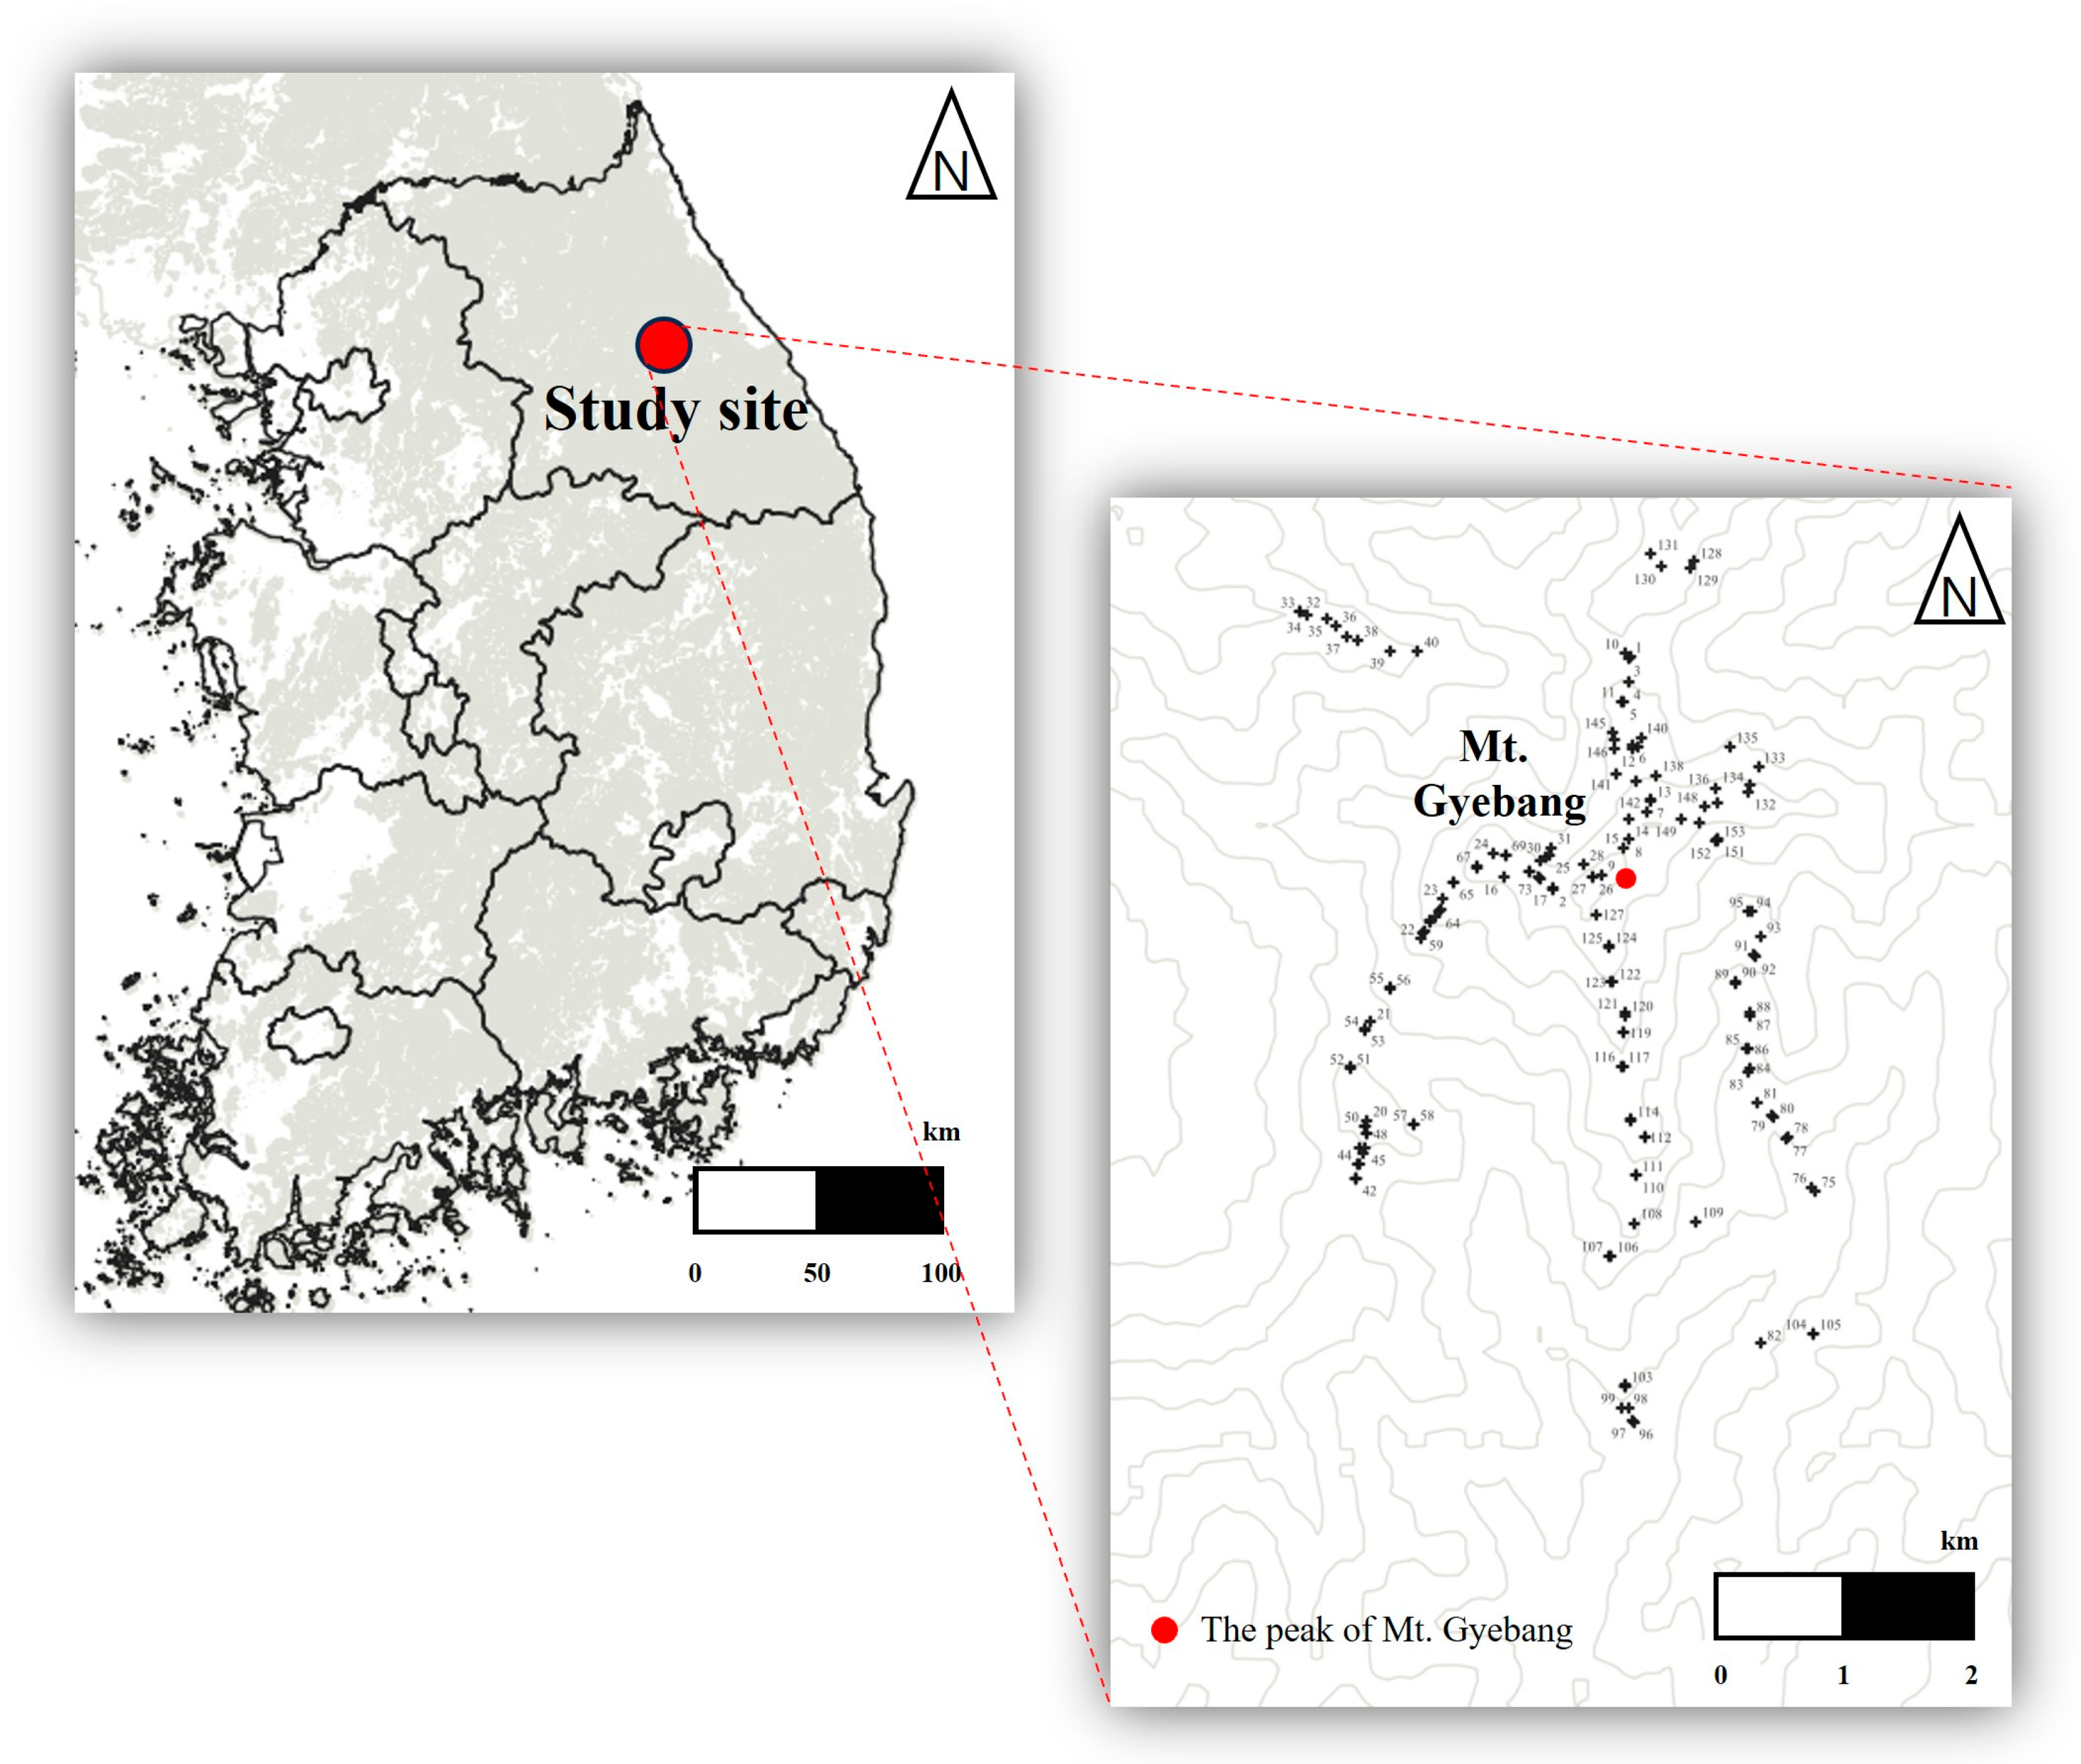
Figure 1. Geographic location of the surveyed plots on Mt. Gyebangsan, Korea.
Diversity 17 00828 g001
Figure 2. Species area curve for estimating the species richness of the study sites. The number of replicates per sample size was 500. The Chao 1 estimator was used, and the standard error was included.
Diversity 17 00828 g002
Figure 3. Non-metric multidimensional scaling (NMDS) ordination for each group. Cut off R2 = 0.3, Even.: evenness, Sh. Index: Shannon’s species diversity.
Diversity 17 00828 g003
Figure 4. Comparisons of zeta diversity decline (a,b) and zeta ratio (c,d) for each group. Altitude groups were classified based on their spatial contiguity: (a,c): contiguous; (b,d): isolated.
Diversity 17 00828 g004
Figure 5. Comparisons of exponential fit (Exp.) and power law fit (Pl.) graphs for species turnover among altitude groups.
Diversity 17 00828 g005
Table 1. List of vascular plants of the understory in study sites.
ContentsFamilyGenusSpeciesSub-
Species
VariantFormTotalRatio
(%)
Pteridophyta81627-2-297.9
Gymnospermae357---71.9
Angiospermae70181286338433190.2
Dicotyledoneae62149232332327073.6
Monocotyledoneae83254-616116.6
Total812023203404367100.0
Table 2. Environmental description and information among altitude groups.
ContentsA1A2A3A4Fp
Total plots35334738--
Aspect
(No. of plots)
N771114--
E78137--
S128117--
W9101210--
Altitude (m) **871.3 ± 12.3 a1112.5 ± 6.5 b1325.6 ± 6.8 c1462.7 ± 6.2 d951.920<0.001
Slope (°) ns22.5 ± 1.318.0 ± 1.124.9 ± 1.323.5 ± 1.54.3710.068
Rock exposure (%) ns26.3 ± 3.211.0 ± 2.823.2 ± 3.518.4 ± 3.53.5120.074
Basal area (m2/ha) **35.25 ± 2.10 ab40.63 ± 2.39 b38.24 ± 3.75 ab27.77 ± 2.82 a3.9130.009
Stand density (stem/ha) **556 ± 28 a577 ± 33 a970 ± 101 b814 ± 52 b8.269<0.001
Mean temperature
(°C)
6.88 ± 0.07 d6.24 ± 0.05 c5.31 ± 0.04 b5.06 ± 0.03 a304.246<0.001
Mean wind speed (m/s)2.79 ± 0.02 a2.94 ± 0.02 b3.31 ± 0.02 c3.39 ± 0.06 d283.269<0.001
TPI **−5.81 ± 2.38 a4.58 ± 2.45 b5.65 ± 1.78 b10.39 ± 1.22 b11.238<0.001
TWI **8.73 ± 0.46 c7.33 ± 0.33 b6.36 ± 0.11 a6.23 ± 0.07 a17.874<0.001
F statistic indicates the ratio of the variance among group means to the variance within groups, serving as a measure of overall significance in the ANOVA test. N: north; E: east; S: south; W: west; TPI: topographic position index; TWI: topographic wetness index; ns: non-significant; **: significant differences at p < 0.01, respectively, by one-way ANOVA and Tukey’s post hoc; and a, b, c and d show between–group differences in environmental information.
Table 3. Importance values among altitude groups.
Scientific NameGroup
A1A2A3A4
Sasa borealis (Hack.) Makino3.7414.806.790.07
Tripterygium regelii Sprague & Takeda 3.005.726.236.79
Rhododendron schlippenbachii Maxim. 6.811.242.451.51
Isodon excisus (Maxim.) Kudo 0.894.611.682.05
Calamagrostis arundinacea (L.) Roth 0.610.375.092.27
Quercus mongolica Fisch. ex Ledeb.5.342.050.620.32
Carex siderosticta Hance 1.732.041.432.58
Schisandra chinensis (Turcz.) Baill. 2.943.600.800.32
Acer pseudosieboldianum (Pax) Kom.4.163.762.571.53
Acer pictum subsp. mono (Maxim.) Ohashi 1.531.660.750.11
Acer komarovii Pojark. 0.080.514.504.59
Acer barbinerve Maxim. 0.820.074.435.16
Acer ukurunduense Trautv. & C.A.Mey.-0.191.123.14
Weigela florida (Bunge) A.DC. 0.140.811.161.28
Picea jezoensis (Siebold & Zucc.) Carriere --0.610.69
Abies nephrolepis (Trautv.) Maxim. --1.160.63
Symplocos chinensis f. pilosa (Nakai) Ohwi 0.762.882.751.26
Omitted species67.44 (163 taxa)55.69 (171 taxa)55.85 (154 taxa)65.68 (163 taxa)
Table 4. Species diversity for each group.
ContentsA1A2A3A4Fp
Alpha diversitySpecies richness ns23.26 ± 1.7023.24 ± 1.3122.60 ± 0.9125.79 ± 1.141.3120.273
Shannon index **2.59 ± 0.08 a2.60 ± 0.08 a2.65 ± 0.05 a2.89 ± 0.03 b3.9040.010
Evenness **0.840 ± 0.012 a0.838 ± 0.015 a0.859 ± 0.011 a0.899 ± 0.007 b5.3730.002
ns: non-significant; **: significant difference at p < 0.01 based on one-way ANOVA and Tukey’s post hoc; and a, b, c and d show between–group differences in species diversity.
Table 5. Results of the multi-response permutation procedure (MRPP)-test group comparisons.
Compared GroupsTAp
A3 vs. A4−22.90270.2305<0.001
A3 vs. A2−15.88990.1434
A3 vs. A1−10.01330.1099
A4 vs. A2−12.77170.1146
A4 vs. A1−3.683450.0315
A2 vs. A1−22.11040.2304
T: MRPP-test statistic; A: chance-corrected within-group agreement.
Disclaimer/Publisher’s Note: The statements, opinions and data contained in all publications are solely those of the individual author(s) and contributor(s) and not of MDPI and/or the editor(s). MDPI and/or the editor(s) disclaim responsibility for any injury to people or property resulting from any ideas, methods, instructions or products referred to in the content.