Article

Target-Tree Management Enhances Understory Biodiversity and Productivity in Larix principis-rupprechtii Plantations

1
College of Forestry, Northeast Forestry University, Harbin 150040, China
2
Department of Ecology, Hebei University of Environmental Engineering, Qinghuangdao 066102, China
3
Hebei Key Laboratory of Agroecological Safety, Qinhuangdao 066102, China
*
Authors to whom correspondence should be addressed.
Diversity 2025, 17(11), 787; https://doi.org/10.3390/d17110787 (registering DOI)
Submission received: 28 September 2025 / Revised: 5 November 2025 / Accepted: 6 November 2025 / Published: 9 November 2025
(This article belongs to the Section Plant Diversity)

Abstract

Northern artificial forests play a vital role in enhancing carbon sequestration and ecosystem services, yet quantitative evidence on how different management measures affect understory biodiversity and productivity remains limited. This study focused on Larix gmelinii var. principis-rupprechtii (Mayr) Pilg. plantations in Weichang, Hebei Province, and compared three forest management regimes: target-tree management, homogeneous management, and un-managed stands. We systematically examined understory plant diversity indices (Shannon, Simpson, Margalef, Gleason, and Pielou), shrub–herb layer biomass, soil organic carbon (SOC), and total nitrogen (TN), and employed correlation analysis and random forest modeling to identify the main driving factors. Results showed that target-tree management significantly enhanced both understory biodiversity and shrub–herb biomass, followed by homogeneous management, while unmanaged stands had the lowest values. Differences in SOC and TN among treatments were not significant. Stand structural factors were the dominant drivers: stand density and basal area were negatively correlated with diversity and biomass, while community evenness (Pielou) was positively correlated with biomass. Random forest analysis further indicated that basal area and stand density had the highest relative importance, followed by evenness, whereas soil factors contributed less. Mechanistically, target-tree management improved light availability and spatial distribution by reducing stand density, thereby increasing evenness and promoting biomass accumulation. Overall, optimizing stand structure, rather than merely increasing species richness, proved more effective in simultaneously enhancing biodiversity and productivity in light-limited Larix plantations. From a management perspective, target-tree management combined with density regulation and structural optimization is recommended to achieve near-natural management goals and enhance multiple ecological functions.

1. Introduction

Forests, as the dominant component of terrestrial ecosystems, play a pivotal role in sustaining the global carbon cycle and biodiversity. However, land-use change and intensive management practices have become major drivers of biodiversity loss and ecological degradation worldwide [1,2]. In northern China, the North China larch (Larix gmelinii var. principis-rupprechtii (Mayr) Pilg.) is one of the most important species in plantation forestry, providing substantial benefits for soil and water conservation, ecological restoration, and carbon sequestration [3,4]. The Saihanba and Weichang regions of Hebei Province once experienced severe desertification due to land reclamation and logging, but decades of large-scale afforestation have successfully transformed these barren landscapes into thriving oases. Most plantations, however, were established under traditional intensive management regimes characterized by monoculture, high stand density, and periodic clear-cutting, rendering them far inferior to natural forests in species composition and ecosystem stability [5,6]. Their simplified composition and structure contrast sharply with the structural diversity of natural forests [7]. Although this model achieved rapid tree growth and high timber yields in the short term, biodiversity loss has substantially undermined forest productivity and ecosystem services under accelerating climate and environmental change [8,9]. Empirical evidence further indicates that such simplified management has triggered multiple ecological problems: (1) Biodiversity decline—monoculture stands fail to provide diverse ecological niches, leading to limited species composition, simplified food web structure, and reduced ecosystem stability and resilience; (2) Suppression of understory vegetation—dense canopies restrict light penetration, inhibiting shrub and herb growth, resulting in low understory cover and biomass that weakens soil conservation and nutrient cycling; and (3) Soil degradation—slow litter decomposition and lack of diverse organic inputs in pure stands cause declining soil organic matter, compaction, and nutrient imbalance, threatening long-term forest productivity. Therefore, elucidating and quantifying the relationship between biodiversity and biomass is essential not only for enhancing carbon sequestration and biomass management in forest ecosystems but also for advancing biodiversity conservation in the context of climate change [10]. Against the backdrop of rapid climate change, these challenges have become more pronounced, constraining the multifunctional and sustainable management of plantation forests. Previous studies have demonstrated that biodiversity affects forest productivity and ecosystem services through two primary mechanisms: niche complementarity and selection effects [11,12,13,14]. Niche complementarity emphasizes that functional trait differences among species enhance resource-use efficiency, thereby increasing community productivity. In contrast, the selection effect suggests that the disproportionate contribution of a few dominant species to biomass drives overall functional enhancement. However, the relationship between forest species diversity and aboveground biomass remains debated: some studies have reported positive correlations [15], others negative correlations [16], and still others no significant association [17]. These inconsistencies are often shaped by multiple factors, including climatic conditions, soil properties, forest management practices, and spatial–temporal scales. Among these, soil characteristics exert particularly strong influences on biomass dynamics, given their central role in nutrient cycling and carbon sequestration [18].
In temperate plantation forests, silvicultural practices directly shape stand structure and ecological functions [19]. In recent years, the concept of near-natural forest management has gained increasing recognition in international forestry. Its core principle is to respect natural processes and guide the development of plantations toward the structure and functions of natural forests through practices such as target tree management, multi-layered restructuring, promotion of natural regeneration, and habitat conservation, thereby enhancing forest health and stability [20]. Understory herbaceous plants, as an essential component of forests, are highly sensitive to disturbances. Their diversity and biomass closely reflect the impacts of management interventions on ecosystem stability, making them widely regarded as key indicators of forest health. Monoculture plantations, however, remain structurally simplistic and ecologically fragile, underscoring the need for scientific management to improve stand quality and ecosystem functions.
Against this backdrop, forest tending has become a key strategy for implementing near-natural management practices. Common approaches include: Target tree management, which promotes the development of uneven-aged, multi-layered structures by selectively retaining dominant trees, thereby improving understory light availability and facilitating regeneration; Homogeneous management, which applies uniform thinning to enhance spatial utilization, though it may simplify understory competition patterns; and Unmanaged stands, which maintain the original stand density and depend solely on natural regeneration. These practices influence understory plant establishment and competition by regulating canopy closure, litter accumulation, and soil conditions, ultimately shaping community diversity, biomass distribution, and ecosystem functions [21,22,23]. Therefore, investigating the interactions among understory vegetation, soil nutrients, and biomass under different silvicultural regimes is critical for elucidating the ecological mechanisms of plantation forests and optimizing pathways for sustainable management.
Based on this context, the present study investigates artificial North China larch forests in Weichang Manchu Autonomous County, Hebei Province. Three representative management regimes—target tree management, homogeneous management, and unmanaged stands—were implemented. The study systematically compared understory plant diversity, soil carbon and nitrogen status, and aboveground biomass across these treatments. It further examined the relationships between biodiversity and biomass, as well as between soil nutrients and biomass. The objective is to clarify the regulatory effects of different tending practices on understory ecological functions, thereby providing a theoretical foundation and practical guidance for enhancing the ecological services and long-term sustainability of larch plantations in northern China.

2. Materials and Methods

2.1. Study Area and Sampling Locations

The study was conducted in the Mulan Hunting Ground State Forest Farm, located in Weichang Manchu Autonomous County, Chengde City, Hebei Province (116°51′–117°45′ E, 41°47′–42°06′ N) (Figure 1). The Mulan Hunting Ground Nature Reserve lies in northeastern Hebei Province at the junction of Hebei and Inner Mongolia, covering a total area of 50,637.4 ha. The reserve is situated in the transitional zone between the northern Hebei mountains and the Inner Mongolia Plateau, where the Greater Khingan Range, Yin Mountains, and Yanshan Mountains converge. It spans 2324 km2 with elevations ranging from 750 to 1900 m, gradually decreasing from northwest to southeast. Approximately 350 km from Beijing, the reserve serves as a critical ecological barrier for the Beijing–Tianjin region. It contains diverse vegetation types, including forests, grasslands, and wetlands, which mitigate sandstorms, stabilize shifting sands, and play essential roles in carbon sequestration, oxygen release, soil and water conservation, flood regulation, and water retention [24].
To investigate the effects of different management strategies, comparative experiments were conducted in Larix gmelinii var. principis-rupprechtii (Mayr) Pilg. plantations located in Mulan Weichang, Hebei Province, northern China (Table 1). Since 2010, this region has comprehensively implemented near-natural forest management, transitioning from traditional periodic harvesting to continuous and adaptive management. Within this framework, three long-term silvicultural regimes were simultaneously established in 2010 and have been consistently maintained since then: (1) Target tree management (TTM), which promotes natural regeneration with limited human intervention. In this regime, target trees are identified based on their growth potential and spatial distribution, while competing trees and understory shrubs or herbs are selectively removed to improve target tree growth and optimize stand structure. (2) Homogeneous management (HM), which involves selectively removing suppressed or poorly formed trees and adjusting the spatial distribution of remaining trees to achieve a more uniform growing space. This approach aims to improve stand growth conditions, maintain stable stand density, and enhance the overall uniformity of stand structure. (3) Unmanaged stands (CK), which are left completely free from human or animal disturbance and rely solely on natural regeneration, serving as control plots.
In both TTM and HM stands, tending operations are conducted on a 6–7-year cycle, removing suppressed or defective trees in accordance with their respective management objectives, while CK remains undisturbed. The most recent tending operation was completed in November 2023, approximately six months before field sampling in 2024. These long-term management regimes modify canopy closure, litter accumulation, and soil properties, thereby influencing understory vegetation establishment, community diversity, biomass allocation, and ecosystem functioning.

2.2. Sample Collection

In the Mulan Hunting Ground, North China larch forests under different management regimes were selected as study sites. The chosen plots exhibited comparable stand conditions and site quality. For each management type, five plots were established, resulting in a total of 15 fixed standard plots measuring 25.82 m × 25.82 m. Within each plot, three 5 m × 5 m subplots were randomly selected to collect understory shrub, herbaceous, and soil samples. The specific sampling procedures were as follows: (1) Shrub layer: All understory shrubs within each 5 m × 5 m subplot were harvested. Shrub species, canopy cover, number of individuals, and average height were recorded. Samples were transported to the laboratory, where fresh and dry weights were measured to determine shrub layer biomass. (2) Herbaceous layer: Within each 5 m × 5 m subplot, three 1 m × 1 m quadrats were established. All herbaceous plants were harvested, and their species, number of clumps, average height, and cover were recorded. Fresh weights were measured separately for each quadrat, followed by laboratory drying and dry weight determination to estimate herbaceous layer biomass. (3) Soil sampling: In each plot, soil samples were collected from the 0–10 cm mineral topsoil using a stainless steel ring knife. Three subsamples were randomly taken and composited into one representative sample per plot. The samples were air-dried and sieved through 1 mm and 0.149 mm meshes for the determination of soil organic carbon (SOC) and total nitrogen (TN).

2.3. Index Determination

The basal area was determined following a two-step procedure. Initially, individual-tree basal area was computed using the formula:
a_i = π × (DBH_i/200)2,
where a_i represents the basal area (m2) of the i-th tree, and DBH_i denotes its diameter at breast height (cm). Subsequently, the basal areas of all living trees within each plot were summated and scaled to a per-hectare basis, yielding the total stand basal area (m2·ha−1).
Soil organic carbon was determined using the potassium dichromate volumetric method (dilution calorimetry), followed by calculation using the formula: C(V0 − V) × 10−3 × 3.0 × 1.33; Soil organic carbon (g/kg) = 1000 W. Among these: 1.33: Oxidation correction factor; 3.0: Molar mass of carbon-14 atoms (g·mol−1); C: Concentration of the 0.2 mol/L FeSO4 standard solution; V0: Volume of standard FeSO4 solution used for the blank (mL); V: Volume (mL) of the FeSO4 standard solution used for the sample; W: Soil weight (grams).
Total soil nitrogen was determined using the Kjeldahl method; Understory shrub and herb biomass was surveyed using the harvest method, with dry weight per unit area of shrub and herb layer vegetation serving as the metric after drying at 80 °C to constant weight. Diversity indices require comprehensive consideration of multiple aspects, including species diversity, evenness, and richness. This study selected the Pielou’s evenness index (J), Shannon-Wiener index (H), and Simpson’s index (D) as measures of understory plant diversity. The respective calculation formulas are as follows [25,26,27,28]:
(1)
Shannon-wiener (H):
H = i = 1 S P i l o g P i                     ( i = 1 , 2 , 3 s )
(2)
Pielou (J)
J = H l n S
(3)
Simpson (D)
D = 1 i = 1 S ( P t ) 2                     ( i = 1 , 2 , 3 s )
(4)
Margalef (R)
R = S 1 l n N
(5)
Gleason (G)
G = S l n A

2.4. Data Analysis

Experimental data entry, preliminary collation, and basic calculations were performed using Microsoft Excel 2019. According to the experimental design, the data were grouped and organized to ensure that the structure met the requirements for subsequent analyses. Statistical analyses were conducted using IBM SPSS Statistics 23.0 and R 4.4.0. One-way analysis of variance (ANOVA) was applied to test the effects of different management regimes on understory shrub and herbaceous biomass, plant diversity indices, and soil organic carbon, with the significance level set at p < 0.05. The normality of the data was assessed with the Shapiro–Wilk test, and the homogeneity of variances was examined using Levene’s test. When assumptions were violated, data were log- or square-root transformed; if heteroscedasticity persisted, Welch’s ANOVA or the non-parametric Kruskal–Wallis H test was used as an alternative. When overall differences were significant, Tukey’s honestly significant difference (HSD) test or Dunn’s multiple comparisons test was employed to determine pairwise differences between treatments. Spearman’s correlation analysis was used to evaluate the relationships between understory biomass, soil properties, and biodiversity indices. In addition, a random forest (RF) model was applied to evaluate whether variations in understory biomass were primarily driven by community diversity indices or by soil variables, and to quantify the relative importance of these predictors. To further visualize how each predictor influences understory biomass, one-dimensional partial dependence plots (PDPs) were generated based on the RF model. The PDPs illustrate the marginal effect of individual predictors on biomass, averaging over the influence of other variables, thereby revealing nonlinear response patterns across the observed range.

3. Results

3.1. Analysis of Biodiversity Under Different Management Models

Analysis of biodiversity index differences across management regimes (Table 2) showed significant variations (p < 0.05) in four of the five indices. The Simpson_1-D index ranged from 0.794 to 0.886, with the highest value (0.886 ± 0.01) under target tree management, representing an 11.6% increase compared to the lowest value under the unmanaged regime (0.794 ± 0.03). The Shannon_H index also peaked under target tree management (2.493 ± 0.14), which was significantly higher than that of the unmanaged stands (1.95 ± 0.11), a 27.8% increase over the lowest value. Similarly, the Margalef index reached its maximum under target tree management (4.27 ± 0.68), while the unmanaged regime recorded the lowest value (2.53 ± 0.22), corresponding to a 68.8% difference. The Pielou index, however, did not differ significantly among the three management regimes (p > 0.05), although target tree management (0.771 ± 0.009) was slightly higher than unmanaged stands (0.71 ± 0.043). The Gleason index was also highest under target tree management (6.90 ± 1.12) and lowest under unmanaged stands (4.09 ± 0.42), with a difference of 68.7%. Overall, the diversity indices followed the trend: target tree management > homogeneous management > unmanaged stands, indicating that target tree management was the most effective regime for enhancing understory vegetation diversity.

3.2. Changes in Understory Biomass Under Different Management Systems

Analysis of understory biomass across different management regimes (Figure 2) showed that management had a significant effect on understory plant biomass (shrubs + herbs) per unit area (p < 0.05). Biomass under target tree management was 4.53 ± 0.58 t·ha−1, significantly higher than that under homogeneous management (3.92 ± 0.53 t·ha−1) and unmanaged stands (1.89 ± 0.24 t·ha−1). Compared with unmanaged stands, biomass increased by approximately 147% under target tree management and by 133% under homogeneous management. Overall, the pattern followed the order: target tree management > homogeneous management > unmanaged stands.

3.3. Variations in Stand Structural Attributes and Soil Properties Across Management Regimes

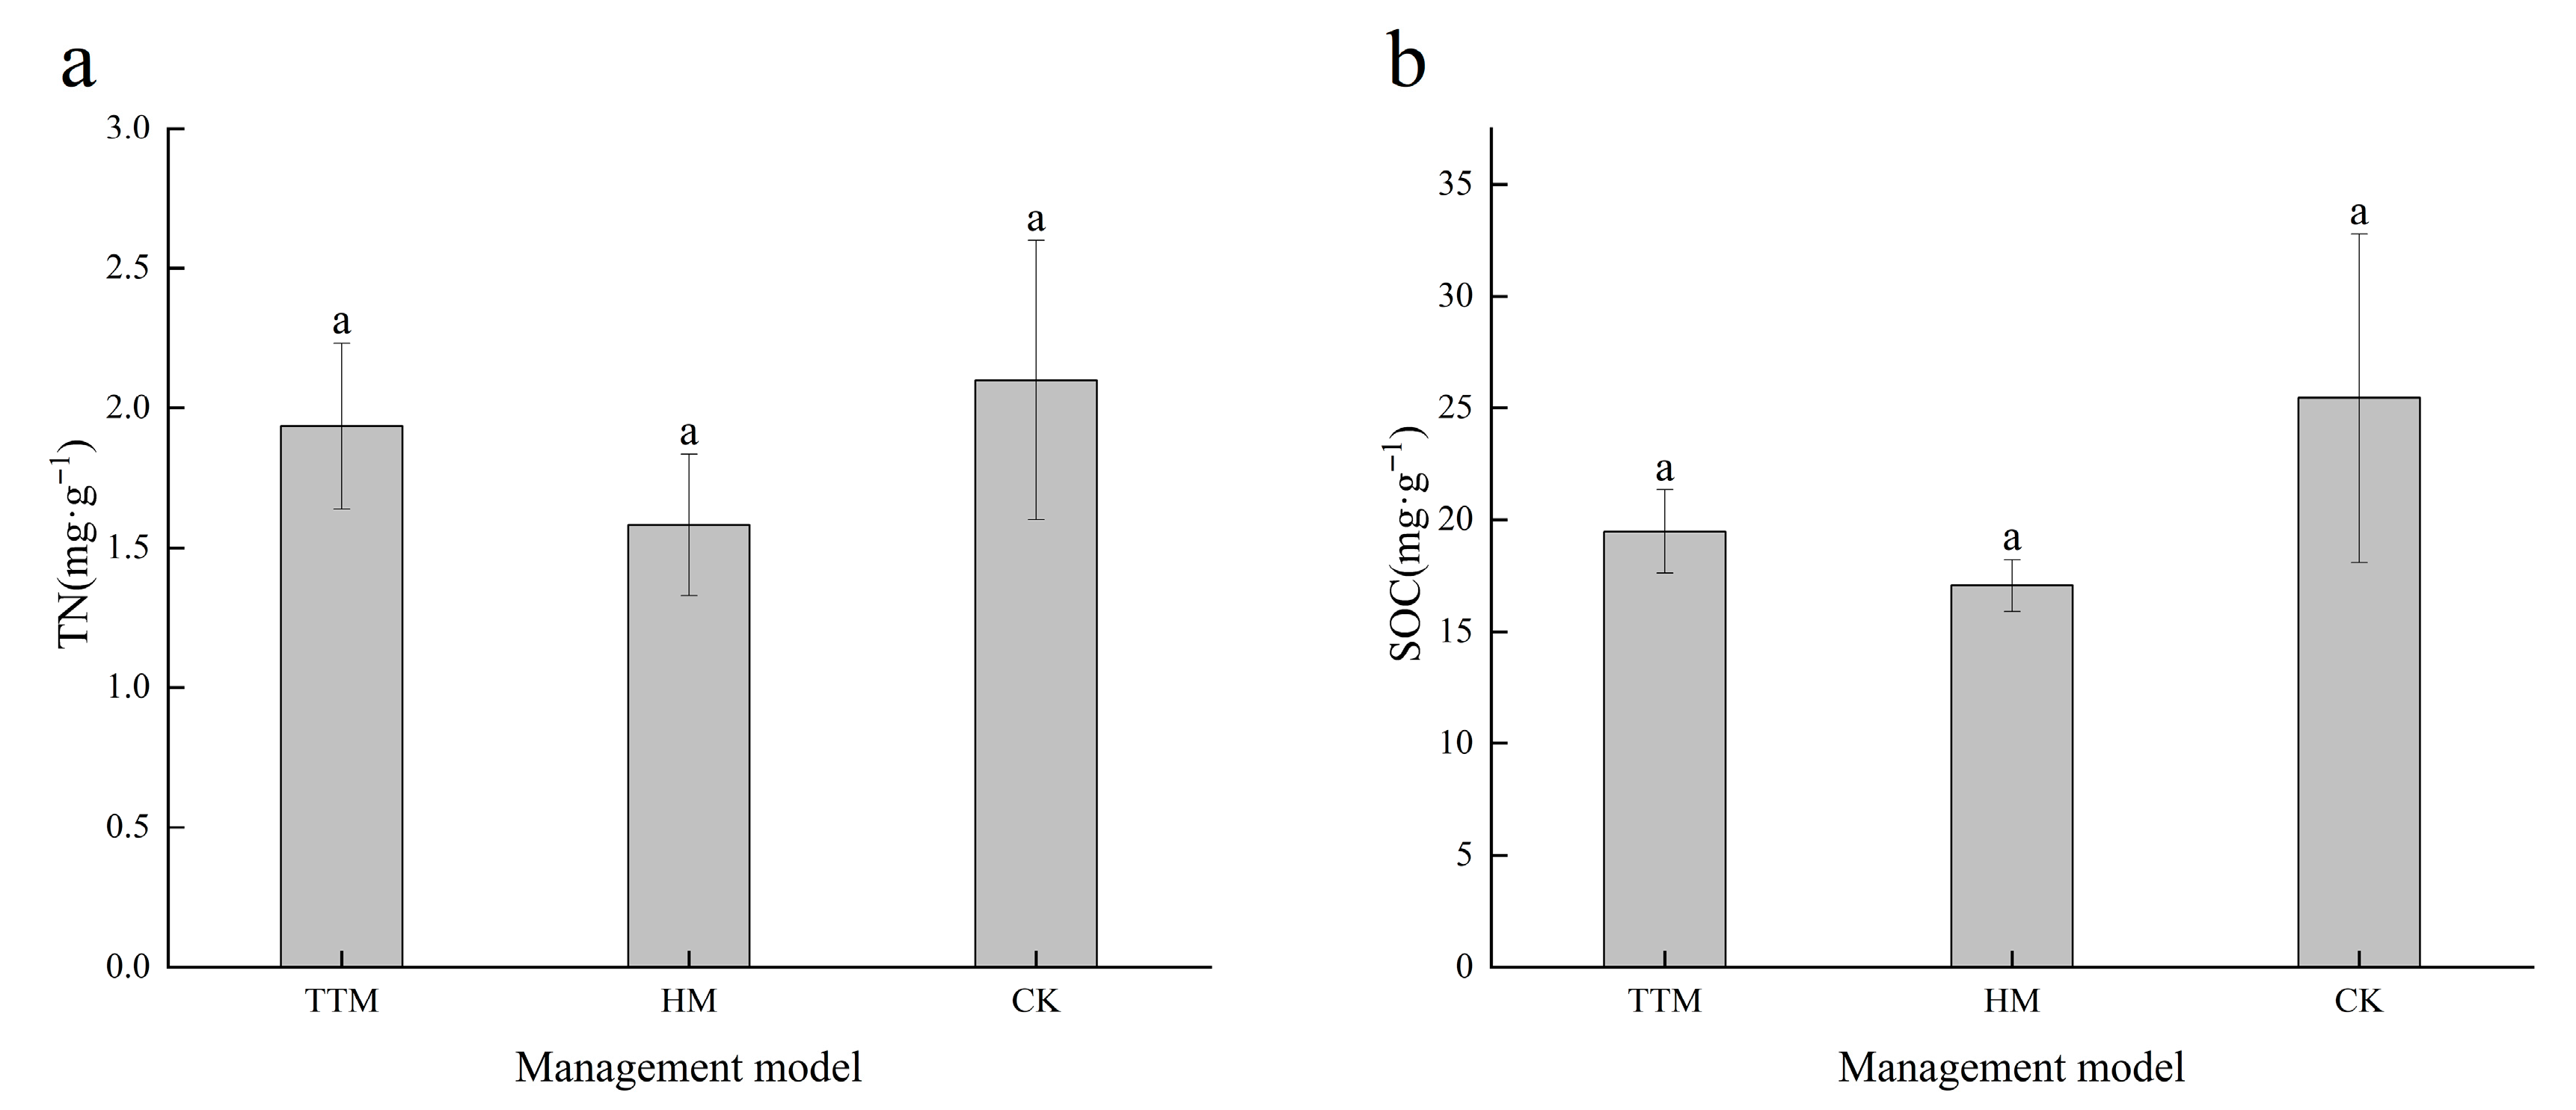
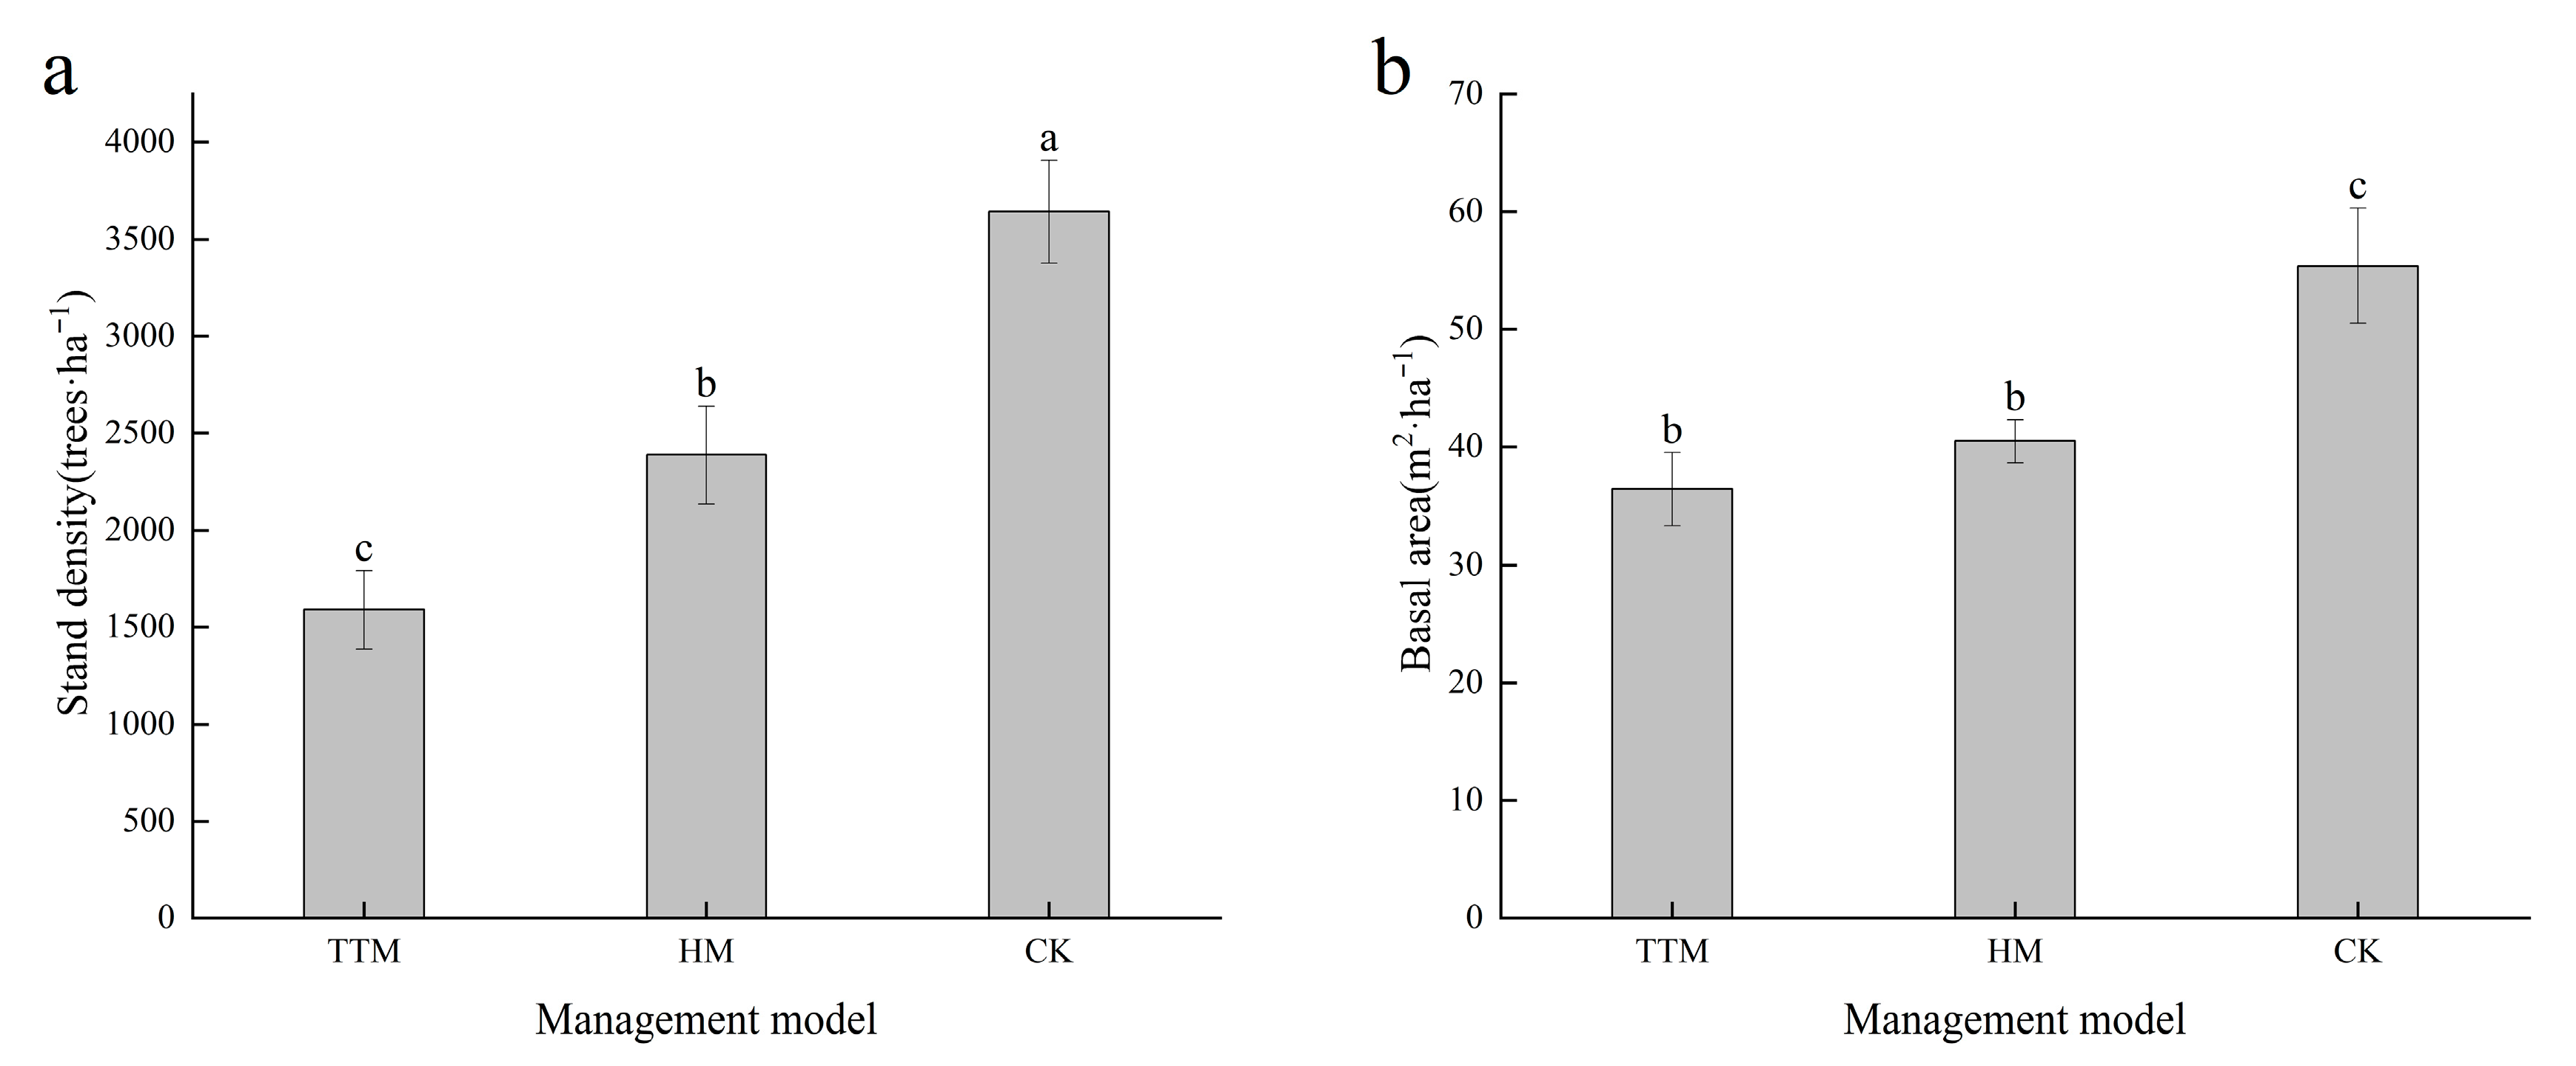
Results from one-way ANOVA indicated that total nitrogen (TN) and soil organic carbon (SOC) contents in the understory soil did not differ significantly among management regimes (p > 0.05), whereas stand density and basal area varied significantly (p < 0.05) (Figure 3 and Figure 4). The mean TN content was 1.93 ± 0.30 g·kg−1 under target tree management (TTM), 1.58 ± 0.25 g·kg−1 under homogeneous management (HM), and 2.10 ± 0.50 g·kg−1 under unmanaged stands (Figure 3a), with no significant intergroup differences. For SOC, the unmanaged stands exhibited the highest mean value (25.44 ± 7.33 g·kg−1), followed by TTM (19.47 ± 1.87 g·kg−1) and HM (17.06 ± 1.16 g·kg−1) (Figure 3b), although the differences were also non-significant. In contrast, both stand density and basal area differed markedly among the three management regimes. Stand density was highest under unmanaged stands (3642 ± 263 trees·ha−1), followed by HM (2338 ± 252 trees·ha−1) and TTM (1590 ± 203 trees·ha−1) (Figure 4a). Similarly, basal area showed significant differences, with the highest value in CK (55.40 m2·ha−1), followed by HM (40.50 m2·ha−1) and the lowest under TTM (36.44 m2·ha−1) (Figure 4b).

3.4. Correlation Analysis Between Biodiversity and Ecological Factors

Using Spearman’s correlation analysis, we examined the relationships among plant diversity indices, stand density, basal area, and soil nutrient variables (SOC and TN) (Figure 5). The results showed strong and significant positive correlations among the diversity indices. The Shannon diversity index (Shannon_H) exhibited highly significant positive correlations (p < 0.001) with the Simpson index (Simpson_1-D), Margalef richness index, and Pielou evenness index. Similarly, the Gleason richness index was strongly and positively correlated with the Shannon, Margalef, and Pielou indices (p < 0.001). Stand density was negatively associated with several diversity indices. Specifically, significant negative correlations (p < 0.05) were observed with the Simpson, Shannon, Margalef, and Gleason indices, suggesting that higher stand density may suppress understory plant diversity. However, its correlation with the Pielou index was not significant. Regarding soil nutrients, SOC and TN were highly positively correlated (p < 0.001), reflecting their strong coupling in soil nutrient cycling. In contrast, neither SOC nor TN showed significant correlations with any of the diversity indices. Basal area exhibited significant negative correlations with the Margalef and Gleason indices (both p < 0.05), and a highly significant positive correlation with stand density (p < 0.01). Overall, these findings suggest that plant diversity indices are closely interrelated, while stand density exerts a negative regulatory effect on understory diversity. Soil carbon and nitrogen are tightly linked to each other but do not directly affect diversity indices (Figure 5).

3.5. Analysis of Factors Affecting Understory Biomass

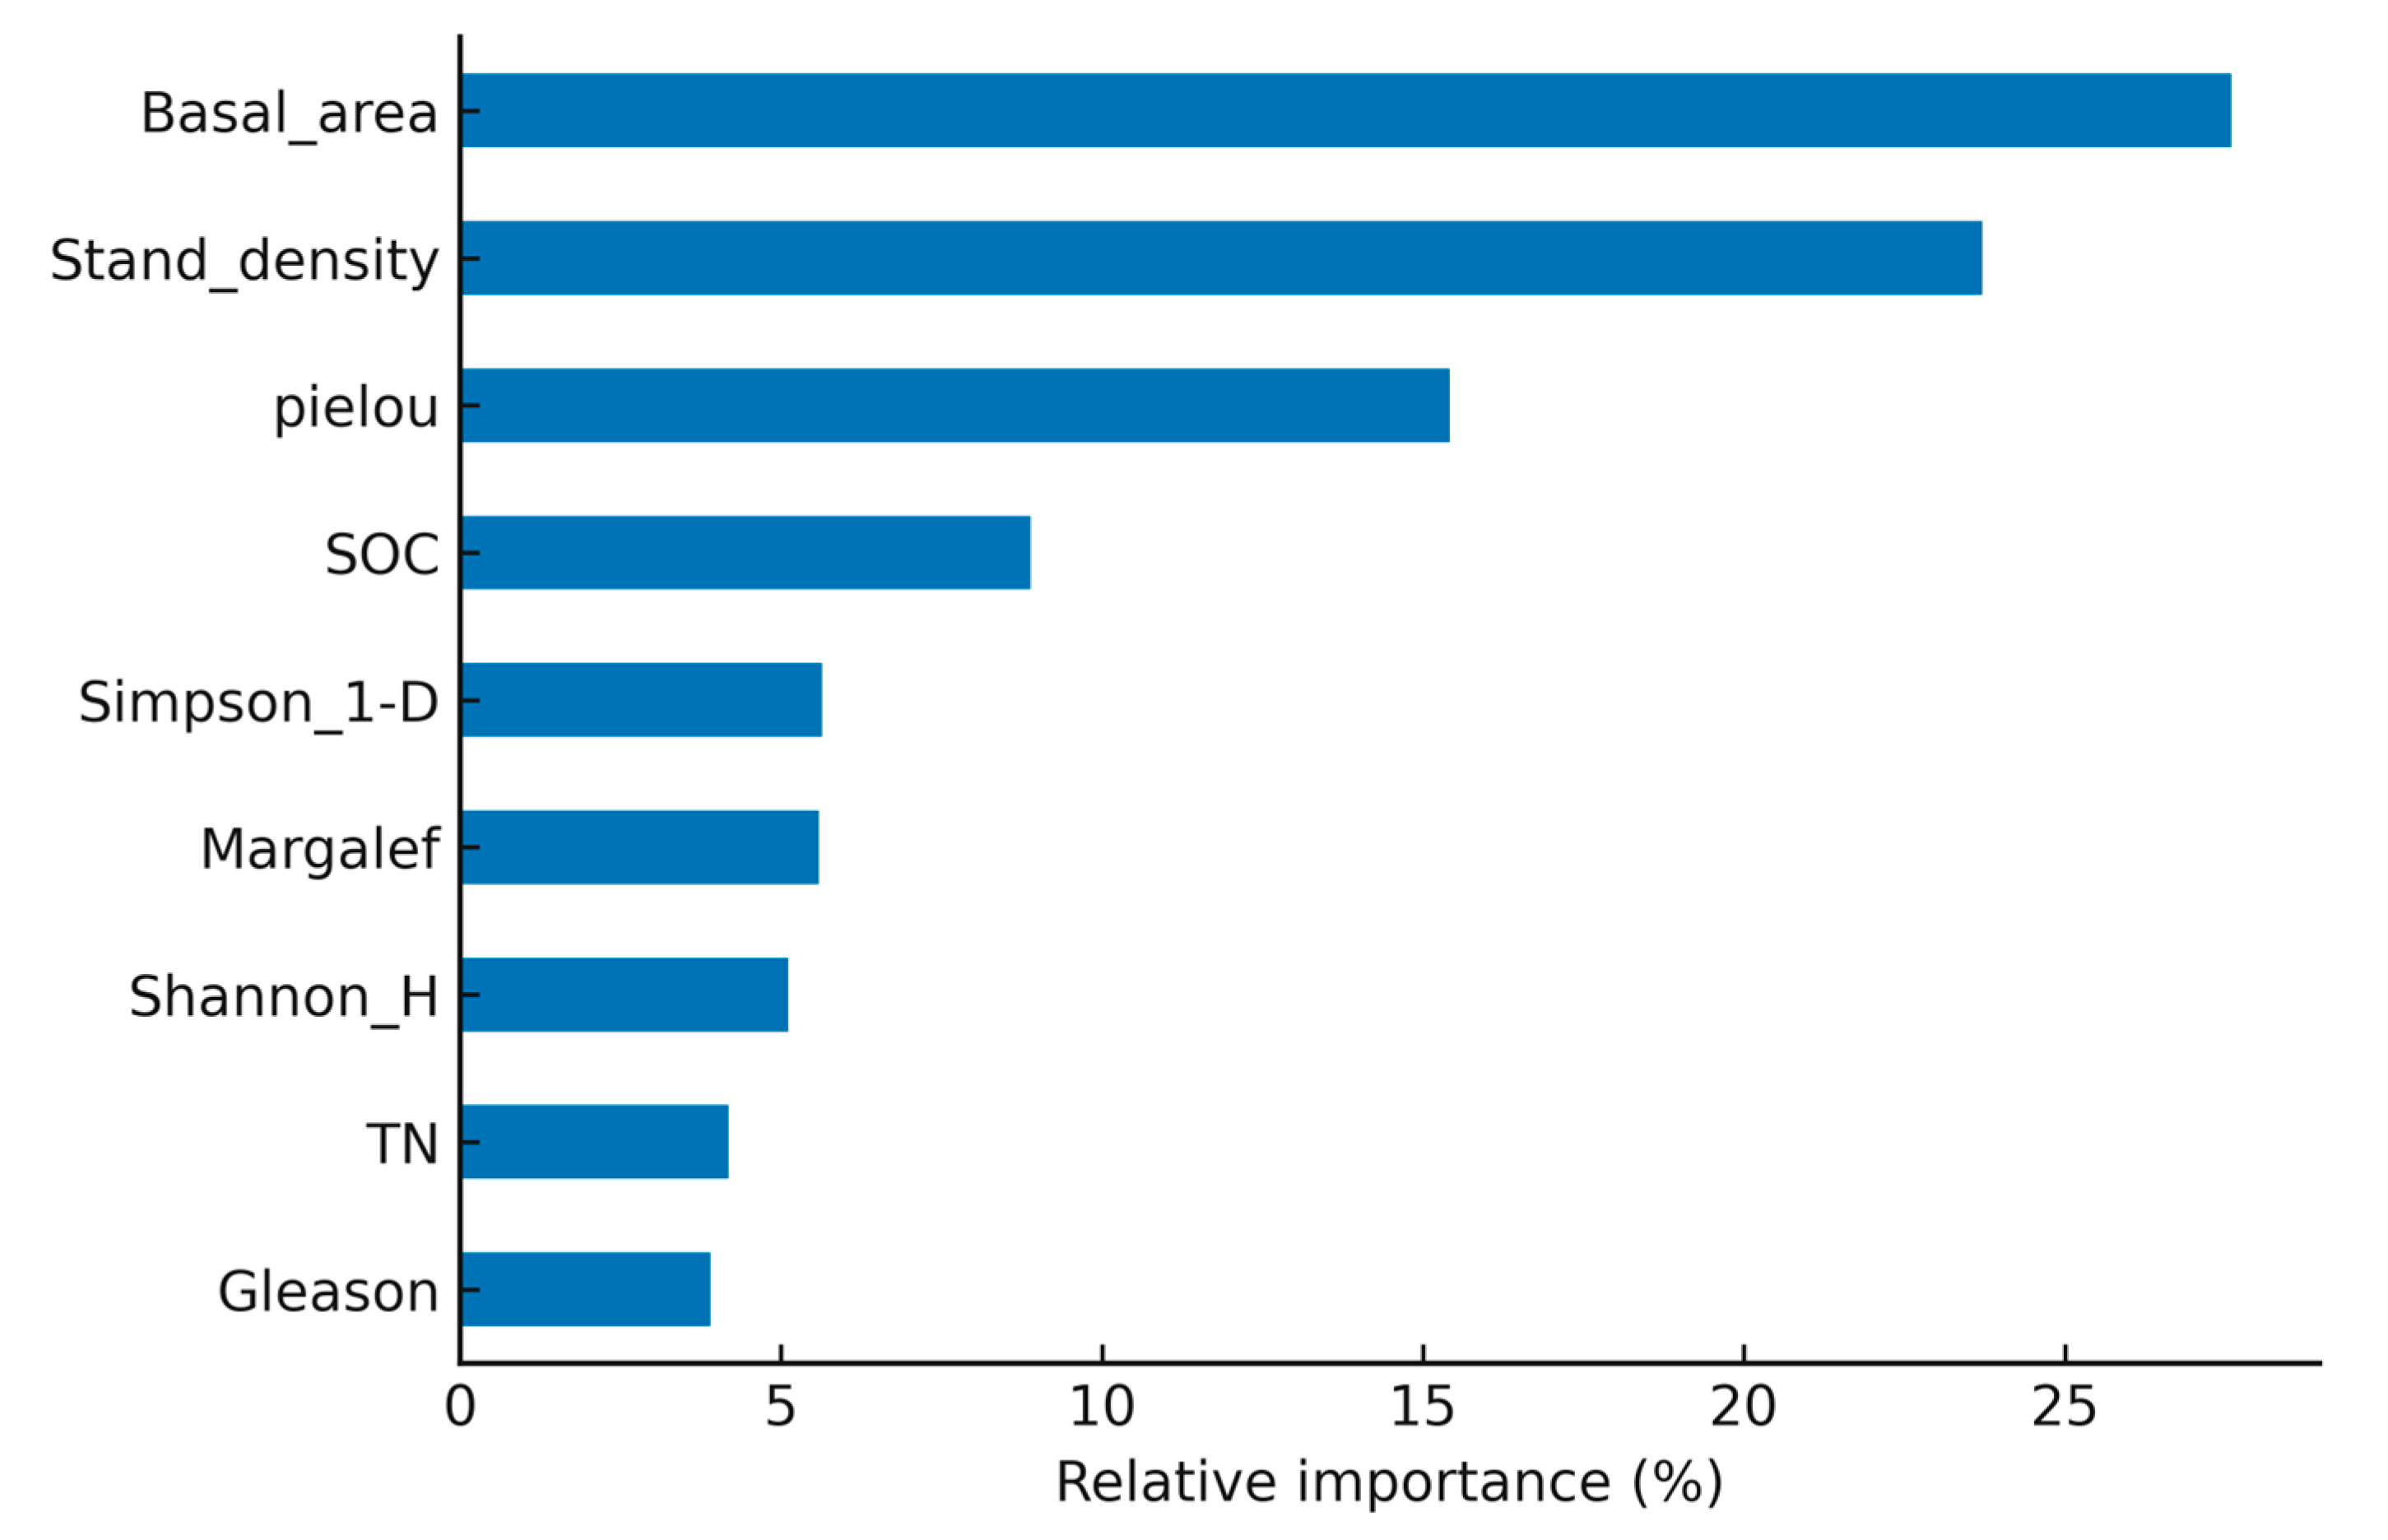
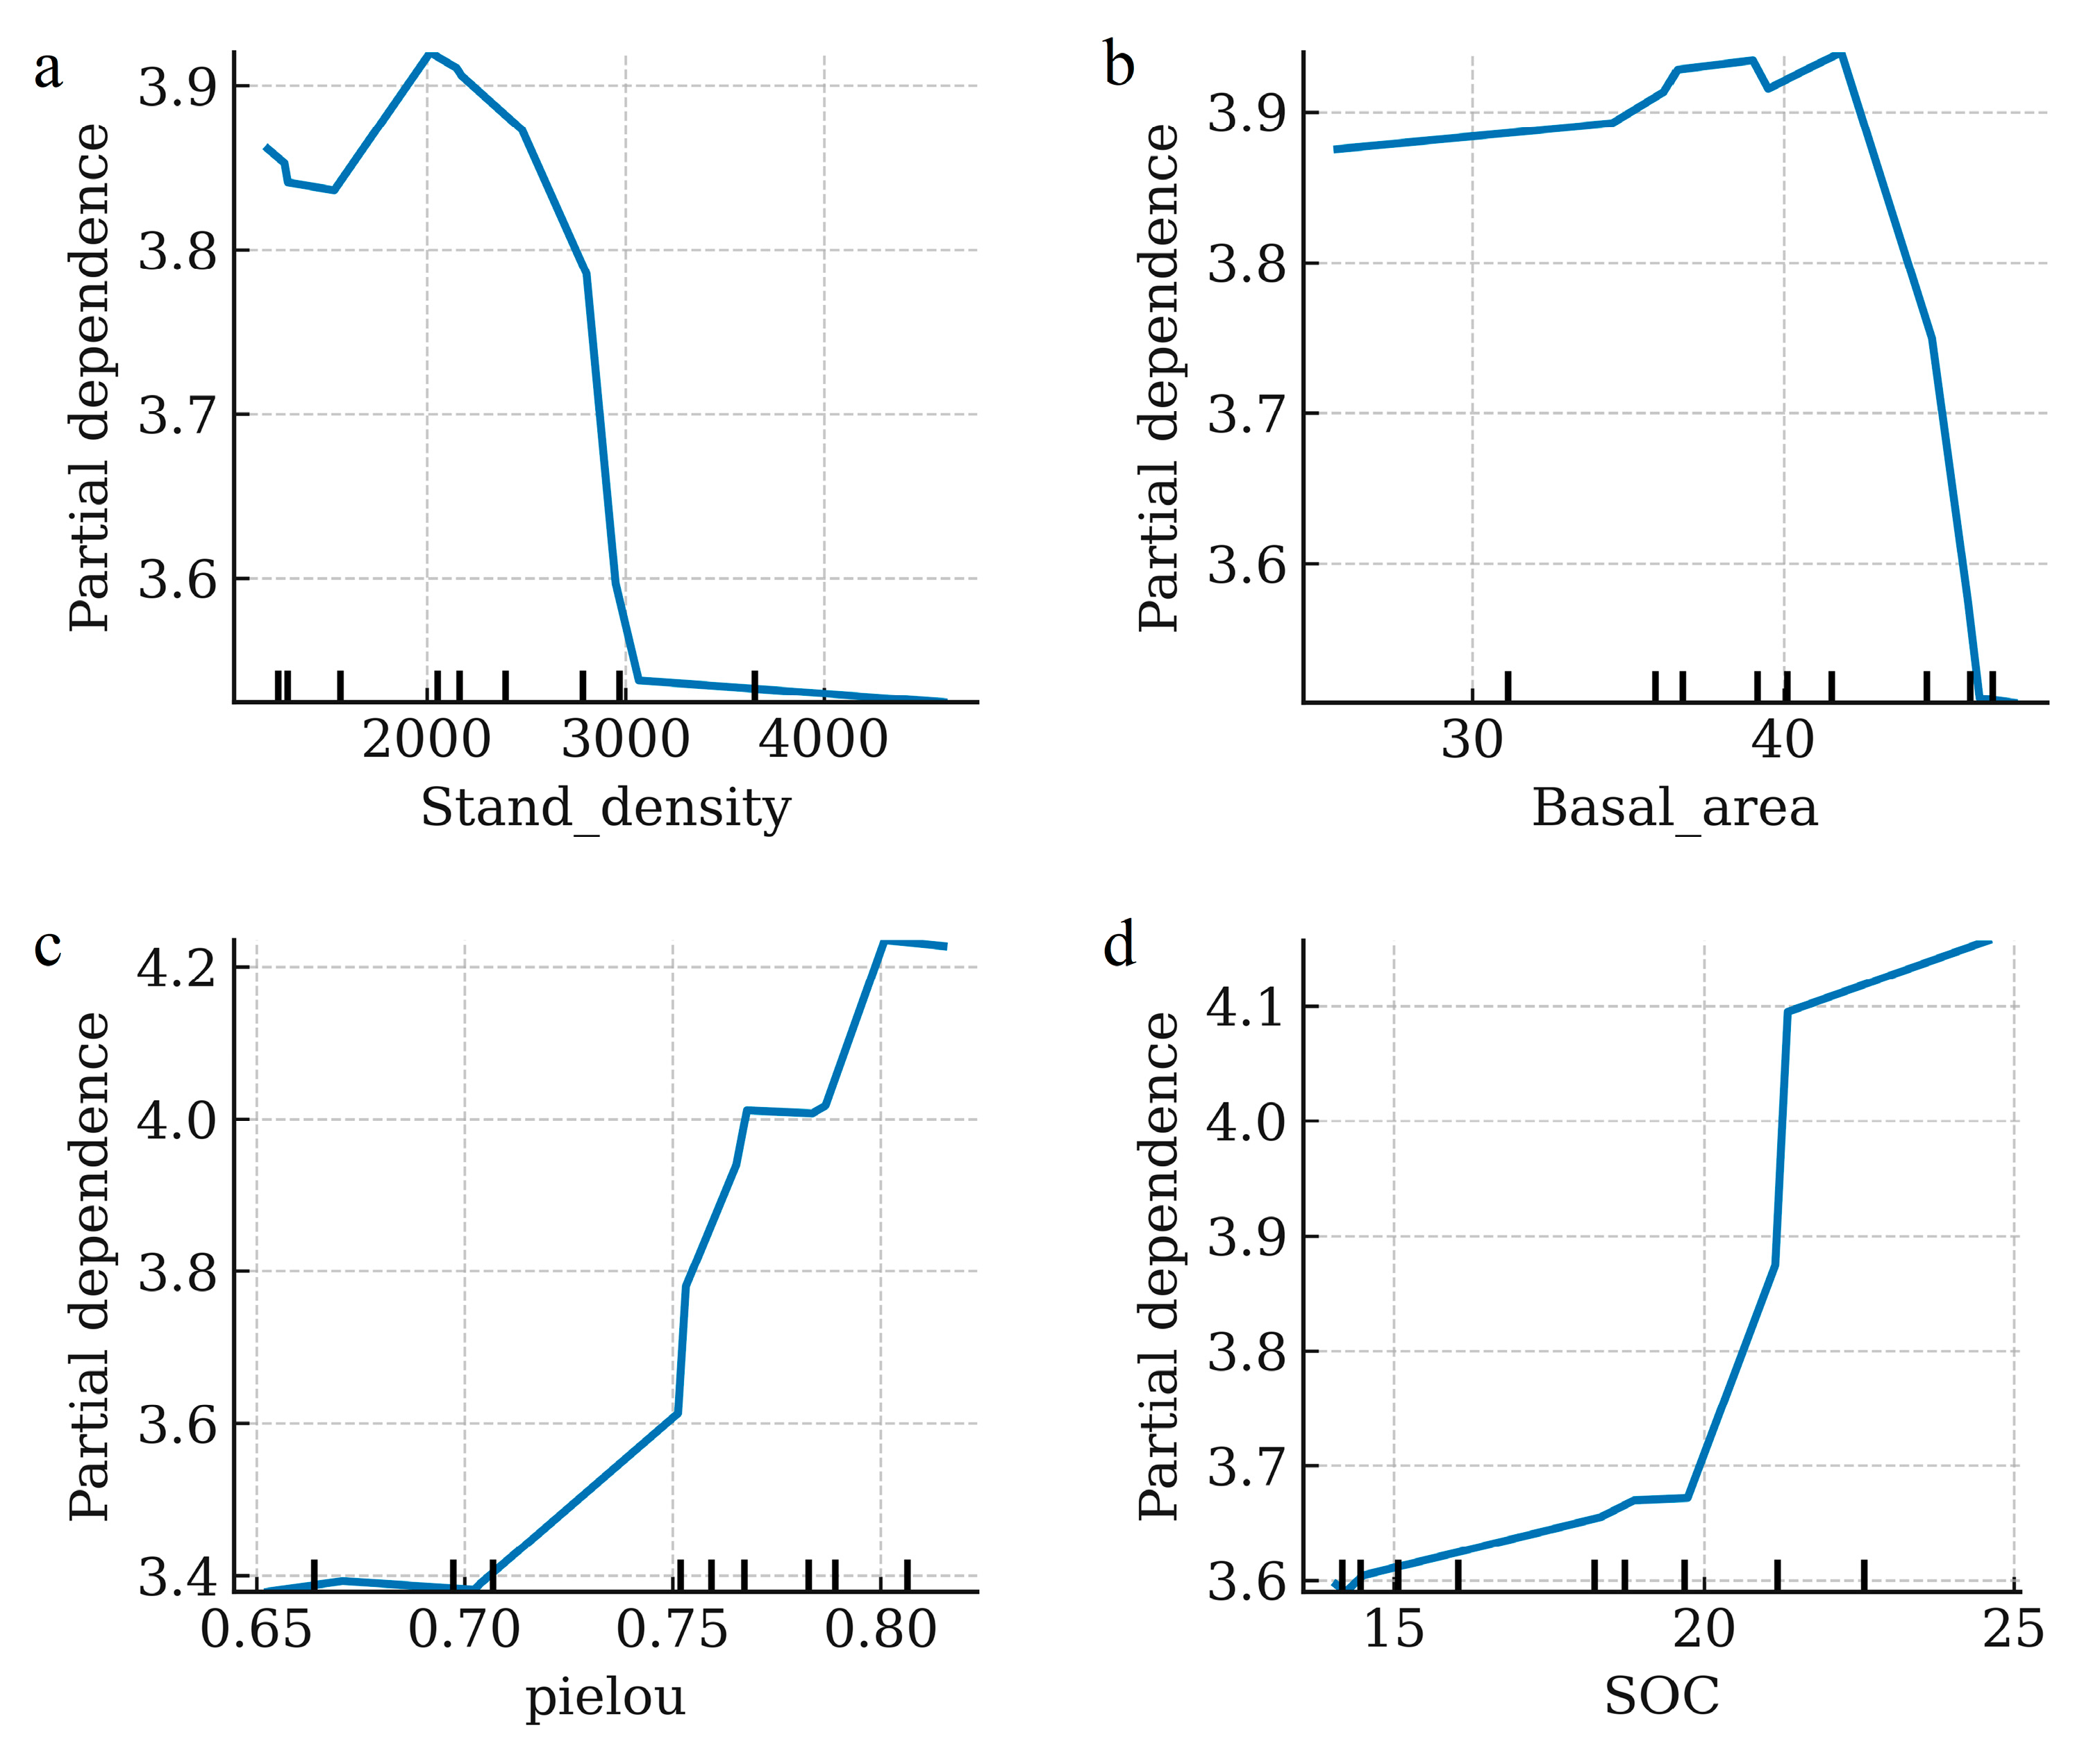
To evaluate the drivers of understory aboveground biomass, we fitted a random forest (RF) model using community diversity indices, soil properties, and stand structural variables as predictors. The RF achieved high explanatory performance (R2 = 0.906; RMSE = 0.455 t·ha−1). Variable-importance analysis (Figure 6), basal area (27.5%), identified stand density (23.7%), Pielou’s evenness (15.4%) and SOC (8.9%) as the most influential predictors, whereas other diversity indices and TN contributed minimally. Partial-dependence analyses (Figure 7) indicated nonlinear response patterns with consistent directional trends across the observed ranges: understory biomass generally decreased with increasing stand density and basal area (with minor mid-range fluctuations), and predominantly increased with Pielou’s evenness, approaching a stable upper range at high values. SOC showed an overall positive trend accompanied by local variations. Collectively, the multivariate results show clear nonlinear yet directionally consistent relationships between biomass and the principal predictors.

4. Discussion

Species diversity and stand structural characteristics are key factors influencing forest community structure and carbon storage [29]. The results of this study indicate that, in Larix principis-rupprechtii plantations in northern China, both target-tree management and homogeneous management exerted positive effects on understory species diversity and significantly increased the biomass of shrubs and herbs. The impact of forest management on plant diversity depends on both the biotic and abiotic conditions as well as the applied management approaches [30,31]. In this study, the Simpson_1-D, Shannon_H, Margalef, Pielou, and Gleason indices under the target-tree management regime were all significantly higher than those under homogeneous and unmanaged regimes. This finding is consistent with Paillet et al. [32], who reported that forest management increases canopy openings and thereby promotes the regeneration and diversity of non-dominant species. Similarly, Torras et al. [33] found that plant diversity was significantly higher in selectively logged stands than in unmanaged forests in Spain. Kern et al. [34] also suggested that forest management enhances diversity by enlarging canopy gaps, improving light availability, and altering the microenvironment. In our results, besides stand density, basal area also showed a clear gradient—highest in unmanaged stands, intermediate in homogeneous management, and lowest in target-tree management. Basal area was negatively correlated with richness indices (e.g., Margalef, Gleason) and positively correlated with stand density, suggesting that quantitative and size-related crowding jointly increased canopy closure and suppressed diversity. Significant differences in stand density were also observed among the three regimes, with unmanaged stands being much denser than managed ones. The enhanced diversity observed under the target-tree regime mainly resulted from the selective removal of competing and dominant trees, which locally disrupted canopy closure and improved the understory light environment, providing more favorable conditions for the regeneration of subordinate species. Target-tree management may also reduce litter accumulation and thereby mitigate allelopathic inhibition by larch litter, indirectly promoting understory regeneration [35]. In contrast, although homogeneous management included tending operations, it imposed a uniform, even-aged and even-diameter structure, which reduced horizontal and vertical heterogeneity in the canopy. This structural uniformity limited the spatial heterogeneity of light within the stand, resulting in a more homogeneous light environment that constrained its effectiveness in enhancing diversity. In addition, mechanical site preparation may have disturbed the litter layer, increased diurnal temperature variation in surface soils, and further restricted the microhabitats available for species establishment. Nonetheless, homogeneous management still showed higher diversity and biomass than the unmanaged regime, indicating that moderate intervention can at least alleviate the limitations caused by high stand density. By contrast, unmanaged stands exhibited the highest density and canopy closure, resulting in limited light penetration and intensified competition, which in turn produced the lowest species diversity. The correlation analysis further supports this interpretation. The diversity indices were highly positively correlated with one another, reflecting both mathematical interdependence and a common response to shared environmental drivers. Stand density showed significant negative correlations with the Simpson, Shannon, Margalef, and Gleason indices, indicating that increases in diversity were primarily attributable to reduced stand density rather than random regeneration or external seed input. Although SOC and TN did not differ significantly among management regimes and showed no significant linear correlations with diversity indices, this does not imply that soil factors play no role. SOC and TN were strongly positively correlated, indicating tight coupling in nutrient cycling, while the use of mixed topsoil samples (0–20 cm) may have averaged out subtle gradients and weakened detectable effects. Soil influences may also manifest through nonlinear, lagged, or interactive pathways with structural and light-related factors. At the same time, the specific ecological context of the study area provides a reasonable explanation for the absence of significant soil effects: in light-limited understory conditions, light rather than nutrients is the dominant limiting factor. Therefore, it can be concluded that the enhancement of diversity under the target-tree management regime was mainly driven by improved understory light availability via stand density regulation, whereas soil nutrients did not show a significant short-term effect. Overall, within the spatial and temporal scales of this study, structural factors exerted stronger influences than soil factors, though the latter’s potential indirect effects cannot be excluded. Future studies incorporating soil stratification, seasonal dynamics, and microbial community characteristics are needed to further elucidate the long-term and indirect roles of soil in shaping diversity.
With respect to understory biomass, the results revealed significant differences among management regimes (p < 0.05), with the target-tree regime having the highest and the unmanaged regime the lowest biomass. Combined with diversity patterns, the target-tree management stands exhibited both high diversity and high biomass. Chen et al. [36] reported that forest tending practices increased understory biomass and that diversity was positively correlated with understory productivity. Likewise, Li et al. [37] found that forest tending significantly enhanced shrub diversity (by 28%) and herb diversity (by 24%) across multiple forest sites in China. These findings support the results of the present study, confirming that target-tree management can simultaneously increase diversity and biomass, achieving both ecological and economic sustainability.
Regarding soil nutrients, no significant differences were detected among management regimes. This is consistent with Khanalizadeh et al. [38], who found that selective logging had a limited influence on soil physicochemical properties in Hyrcanian forests. Similarly, Elliott and Knoepp [39] and Ujhazy [40] observed no significant differences in soil properties between managed and unmanaged forests across various forest types. These results validate the comparability of soil conditions among management regimes in the present study, thereby strengthening the methodological reliability of our conclusions.
Based on the analysis of the random forest (RF) model and its partial dependence plots (PDP), we found that the relationships between understory aboveground biomass and various biodiversity indices were generally weak, which is consistent with the results of Chen and Klinka. Although the overall explanatory power of the RF model was high, the variable importance results indicated that the marginal contributions of diversity indices were limited. Stand density and basal area were identified as the dominant factors, followed by Pielou’s evenness index. The PDP results further showed that biomass decreased with increasing density and basal area but increased with higher evenness, exhibiting nonlinear yet consistent trends. These findings suggest that the increase in biodiversity indices in Larix principis-rupprechtii plantations in North China did not directly translate into productivity improvement. This result differs from studies reporting that forest ecosystem productivity increases with species richness [41,42], but it aligns more closely with those observing non-significant relationships. This can be attributed to the structural characteristics of larch plantations, where a single tree species and high planting density result in strong canopy closure. Consequently, light and space become the primary limiting factors for understory vegetation growth, masking the potential positive effects of diversity on productivity. Hordijk et al. [43] reported that tree species richness and evenness are negatively correlated in forests, and that the relationship between diversity and productivity varies with evenness: communities with higher evenness achieve higher productivity at greater species richness levels. In this study, both species richness and evenness were significantly higher under target-tree management than under the other two regimes, indicating that increased evenness under higher richness levels promoted biomass accumulation, which is consistent with the findings of Hordijk et al. The RF results also showed that evenness played a key role, and the PDP revealed that increasing evenness was associated with higher biomass. This suggests that evenness serves as a critical link between diversity and productivity. In light-limited artificial forests, the distribution of light among individuals—who gain access to light and how much—appears to be a stronger determinant of understory productivity than the number of species present.
Regarding soil factors, the RF and PDP analyses did not detect significant or consistent direct effects. Across the three management regimes, neither total nitrogen (TN) nor soil organic carbon (SOC) differed significantly, and neither variable showed a strong relationship with understory biomass. These findings are consistent with the conclusions of DeWalt and Chave [44] in tropical forests of Panama and Castilho et al. [45] in the Amazon, which reported limited effects of management on soil properties. Although SOC was not among the dominant predictors, it still exerted a secondary influence. The PDP indicated a weak but positive relationship, suggesting that SOC effects may be modulated by structural factors. This result implies that SOC in the surface soil is relatively stable under current conditions and may influence biomass indirectly by improving microenvironmental conditions, facilitating litter decomposition, and maintaining soil moisture. In high-density stands, the dominant role of light limitation likely suppressed the expression of soil effects, leading to their partial masking in the overall model. From a management perspective, optimizing stand density and basal area while maintaining surface organic matter and soil structure could still yield modest but sustained benefits for understory biomass.
In summary, the results of this study demonstrate that stand density is the primary controlling factor of understory aboveground biomass in Larix principis-rupprechtii plantations, whereas biodiversity and soil nutrients play relatively minor roles under current environmental conditions. Furthermore, the consistent evidence from the RF and PDP analyses indicates that stand density and basal area dominate, evenness has a stable positive effect on biomass, and SOC has a weak yet non-negligible influence. Target-tree management enhances both understory species diversity and aboveground biomass while exerting limited short-term effects on soil nutrients. This management strategy contributes to the ecological stability and carbon sequestration potential of forest communities and possesses high practical applicability and adaptability. In practice, reducing excessive stand density, regulating basal area, and improving evenness, while maintaining the stability of surface organic matter and soil structure, can achieve synergistic benefits through both structural and soil pathways. Future research should extend the observation period to monitor soil nutrient dynamics and vegetation succession, thereby clarifying the coupled mechanisms linking diversity, biomass, and soil nutrients.

5. Conclusions

This study demonstrates that in Larix principis-rupprechtii plantations of northern China, understory ecological functioning is primarily influenced by stand structural attributes rather than by species richness alone. Variations in stand density and basal area determine the availability of light and space within the understory, thereby shaping both species diversity and aboveground biomass. Biodiversity contributes to productivity mainly when structural competition is reduced and resources are more evenly distributed, highlighting the key role of community evenness as a functional link between diversity and biomass. Richness-related indices show limited explanatory power, suggesting that the number of species alone is insufficient to enhance ecosystem functioning under dense canopy conditions. Soil organic carbon and total nitrogen exhibit weak and indirect effects, implying that structural factors currently outweigh edaphic constraints within the studied range. Collectively, these findings reveal a structural regulation pattern in temperate plantations: when stand architecture promotes balanced resource access, both biodiversity and productivity increase. Target-tree management, by optimizing stand density, basal area, and community evenness, provides an effective and ecologically sound pathway for improving the stability, resilience, and multifunctionality of larch plantations in northern China.

Author Contributions

Methodology, Z.Z.; Investigation, Y.W., S.W., Z.Z. and P.Z.; Writing—original draft, Y.W.; Supervision, Z.Z. and L.M. All authors have read and agreed to the published version of the manuscript.

Funding

This work was supported by Hebei Province Key R&D Program project carbon peak and carbon neutrality innovation special project [22374208D].

Institutional Review Board Statement

Not applicable.

Data Availability Statement

The original contributions presented in this study are included in the article. Further inquiries can be directed to the corresponding authors.

Conflicts of Interest

The authors declare no conflicts of interest.

References

  1. Newbold, T.; Hudson, L.N.; Hill, S.L.; Contu, S.; Lysenko, I.; Senior, R.A.; Börger, L.; Bennett, D.J.; Choimes, A.; Collen, B.J.N. Global effects of land use on local terrestrial biodiversity. Nature 2015, 520, 45–50. [Google Scholar] [CrossRef]
  2. Flynn, D.F.; Gogol-Prokurat, M.; Nogeire, T.; Molinari, N.; Richers, B.T.; Lin, B.B.; Simpson, N.; Mayfield, M.M.; DeClerck, F. Loss of functional diversity under land use intensification across multiple taxa. Ecol. Lett. 2009, 12, 22–33. [Google Scholar] [CrossRef]
  3. Han, C.; Li, Y.G.; Dong, X.X.; Zhao, C.M.; An, L.Z. Pinus tabulaeformis Forests Have Higher Carbon Sequestration Potential Than Larix principis-rupprechtii Forests in a Dryland Mountain Ecosystem, Northwest China. Forests 2022, 13, 739. [Google Scholar] [CrossRef]
  4. Hansen, A.J.; Spies, T.A.; Swanson, F.J.; Ohmann, J.L. Conserving biodiversity in managed forests. BioScience 1991, 41, 382–392. [Google Scholar] [CrossRef]
  5. Barlow, J.; Gardner, T.A.; Araújo, I.S.; Ávila-Pires, T.C.; Bonaldo, A.B.; Costa, J.E.; Espósito, M.C.; Ferreira, L.V.; Hawes, J.; Hernández, M.I.M.; et al. Quantifying the biodiversity value of tropical primary, secondary, and plantation forests. Natl. Acad. Sci. 2007, 104, 18555–18560. [Google Scholar] [CrossRef]
  6. Stephens, S.S.; Wagner, M.R. Forest plantations and biodiversity: A fresh perspective. J. For. 2007, 105, 307–313. [Google Scholar] [CrossRef]
  7. Burrascano, S.; Keeton, W.S.; Sabatini, F.M.; Blasi, C.J. Management. Commonality and variability in the structural attributes of moist temperate old-growth forests: A global review. For. Ecol. Manag. 2013, 291, 458–479. [Google Scholar] [CrossRef]
  8. Potter, K.M.; Woodall, C.W. Management. Does biodiversity make a difference? Relationships between species richness, evolutionary diversity, and aboveground live tree biomass across US forests. For. Ecol. Manag. 2014, 321, 117–129. [Google Scholar] [CrossRef]
  9. Liang, J.J.; Zhou, M.; Tobin, P.C.; McGuire, A.D.; Reich, P.B. Biodiversity influences plant productivity through niche-efficiency. Proc. Natl. Acad. Sci. USA 2015, 112, 5738–5743. [Google Scholar] [CrossRef] [PubMed]
  10. Mori, A.S.; Lertzman, K.P.; Gustafsson, L. Biodiversity and ecosystem services in forest ecosystems: A research agenda for applied forest ecology. J. Appl. Ecol. 2017, 54, 12–27. [Google Scholar] [CrossRef]
  11. Ali, A.; Lin, S.L.; He, J.K.; Kong, F.M.; Yu, J.H.; Jiang, H.S. Climate and soils determine aboveground biomass indirectly via species diversity and stand structural complexity in tropical forests. For. Ecol. Manag. 2019, 432, 823–831. [Google Scholar] [CrossRef]
  12. Ali, A.; Mattsson, E. Individual tree size inequality enhances aboveground biomass in homegarden agroforestry systems in the dry zone of Sri Lanka. Sci. Total Environ. 2017, 575, 6–11. [Google Scholar] [CrossRef] [PubMed]
  13. Huston, M.A. Hidden treatments in ecological experiments: Re-evaluating the ecosystem function of biodiversity. Oecologia 1997, 110, 449–460. [Google Scholar] [CrossRef] [PubMed]
  14. Ali, A. Biodiversity-ecosystem functioning research: Brief history, major trends and perspectives. Biol. Conserv. 2023, 285, 110210. [Google Scholar] [CrossRef]
  15. Mensah, S.; Veldtman, R.; Assogbadjo, A.E.; Glèlè Kakaï, R.; Seifert, T. Evolution. Tree species diversity promotes aboveground carbon storage through functional diversity and functional dominance. Ecol. Evol. 2016, 6, 7546–7557. [Google Scholar] [CrossRef]
  16. Jacob, M.; Leuschner, C.; Thomas, F.M. Productivity of temperate broad-leaved forest stands differing in tree species diversity. Ann. For. Sci. 2010, 67, 503. [Google Scholar] [CrossRef]
  17. Chen, H.; Klinka, K. Aboveground productivity of western hemlock and western redcedar mixed-species stands in southern coastal British Columbia. For. Ecol. Manag. 2003, 184, 55–64. [Google Scholar] [CrossRef]
  18. Zhang, Y.; Wang, R.H.; Liu, C.; Liu, Q.; Li, M.H.; Zhang, Z.D. Biodiversity and Soil Jointly Drive Ecosystem Multifunctionality in Larch Forests. Forests 2025, 16, 745. [Google Scholar] [CrossRef]
  19. Su, X.; Li, S.; Wan, X.; Huang, Z.; Liu, B.; Fu, S.; Kumar, P.; Chen, H.Y. Management. Understory vegetation dynamics of Chinese fir plantations and natural secondary forests in subtropical China. For. Ecol. Manag. 2021, 483, 118750. [Google Scholar] [CrossRef]
  20. Qiu, Z.L.; Zhang, M.; Wang, K.F.; Shi, F.C. Vegetation community dynamics during naturalized developmental restoration of Pinus tabulaeformis plantation in North warm temperate zone. J. Plant Ecol. 2023, 16, rtac102. [Google Scholar] [CrossRef]
  21. Huang, Y.; Xu, X.; Zhang, L.; Song, Y.; Luo, Z. Ten-years period of grass and small woody plant dynamics in a 5-ha evergreen forest plot in Baishanzu, Zhejiang Province. Biodivers. Sci. 2016, 24, 1353. [Google Scholar] [CrossRef]
  22. Gong, G.; Niu, M.; Mu, C.; Chen, J.; Li, Y.; Zhu, Z.; Zheng, S. Impacts of different thinning intensities on growth of Cupressus funebris plantation and understory plants. Sci. Silvae Sin. 2015, 51, 8–15. [Google Scholar]
  23. Li, R.; Ma, H.; Min, J.; Hao, J.; Guan, Q. Short-term and Long-term effects of thinning on the undergrowth diversity in the Pinus massoniana plantation. Ecol. Environ. 2012, 21, 807. [Google Scholar]
  24. Cui, L.; Guo, J.; Gong, j.; Li, D.; Li, X. Preliminary Study on Forest Carbon Sink Estimation Method in Mulan Forest Farm. J. Zhejiang For. Sci. Technol. 2024, 44, 80–86. [Google Scholar]
  25. Zhao, S.; Wang, R.; Liu, K.; Dong, K.; Gong, Y.; Zhang, B.; Zhou, Y. Effects of thinning on growth and understory vegetation diversity of Chinese fir plantation at different ages. J. Cent. South Univ. For. Technol. 2020, 40, 34–43. [Google Scholar]
  26. Shannon, C.E. The mathematical theory of communication. 1963. M.D. Comput. Comput. Med. Pract. 1997, 14, 306–317. [Google Scholar]
  27. Pielou, E.C. The measurement of diversity in different types of biological collections. J. Theor. Biol. 1966, 13, 131–144. [Google Scholar] [CrossRef]
  28. Simpson, E.H. Measurement of Diversity. Nature 1949, 163, 688. [Google Scholar] [CrossRef]
  29. Martinez, J.; Camara, L.; Tigar, B.; Castillo, O. Relationship between carbon stocks and structural diversity in humid and subhumid tropical forest of Mexico. Écoscience 2016, 22, 125–131. [Google Scholar] [CrossRef]
  30. Schall, P.; Gossner, M.M.; Heinrichs, S.; Fischer, M.; Boch, S.; Prati, D.; Jung, K.; Baumgartner, V.; Blaser, S.; Böhm, S.; et al. The impact of even-aged and uneven-aged forest management on regional biodiversity of multiple taxa in European beech forests. J. Appl. Ecol. 2018, 55, 267–278. [Google Scholar] [CrossRef]
  31. Penone, C.; Allan, E.; Soliveres, S.; Felipe-Lucia, M.R.; Gossner, M.M.; Seibold, S.; Simons, N.K.; Schall, P.; van der Plas, F.; Manning, P.; et al. Specialisation and diversity of multiple trophic groups are promoted by different forest features. Ecol. Lett. 2019, 22, 170–180. [Google Scholar] [CrossRef] [PubMed]
  32. Paillet, Y.; Bergès, L.; Hjältén, J.; Odor, P.; Avon, C.; Bernhardt-Römermann, M.; Bijlsma, R.J.; De Bruyn, L.; Fuhr, M.; Grandin, U.; et al. Biodiversity Differences between Managed and Unmanaged Forests: Meta-Analysis of Species Richness in Europe. Conserv. Biol. 2010, 24, 101–112. [Google Scholar] [CrossRef]
  33. Torras, O.; Gil-Tena, A.; Saura, S. Changes in biodiversity indicators in managed and unmanaged forests in NE Spain. J. For. Res. 2012, 17, 19–29. [Google Scholar] [CrossRef]
  34. Kern, C.C.; Montgomery, R.A.; Reich, P.B.; Strong, T.F. Harvest-Created Canopy Gaps Increase Species and Functional Trait Diversity of the Forest Ground-Layer Community. For. Sci. 2013, 60, 335–344. [Google Scholar] [CrossRef]
  35. Zhou, Y.; Gao, Y.; Zhao, H.; Zhao, Z.; Ji, C.; Yang, C.; Liu, Q. Vertical Spatial Heterogeneity of Light Inhibition in North China Larch and Its Primary Influencing Factors. Chin. J. Ecol. 2025, 44, 383–388. [Google Scholar]
  36. Chen, S.S.; Wu, S.J.; Yang, J. Forest management has a mixed effect on understory biomass, but understory species diversity and stand structure are key. Eur. J. For. Res. 2025, 144, 255–265. [Google Scholar] [CrossRef]
  37. Li, X.K.; Li, Y.N.; Zhang, J.; Peng, S.Z.; Chen, Y.M.; Cao, Y. The effects of forest thinning on understory diversity in China: A meta-analysis. Land Degrad. Dev. 2020, 31, 1225–1240. [Google Scholar] [CrossRef]
  38. Khanalizadeh, A.; Rad, J.E.; Amiri, G.Z.; Zare, H.; Schall, P.; Lexer, M.J. The relationship between plant diversity and aboveground biomass in managed and unmanaged temperate forests. Eur. J. For. Res. 2023, 142, 1167–1175. [Google Scholar] [CrossRef]
  39. Elliott, K.J.; Knoepp, J.D. The effects of three regeneration harvest methods on plant diversity and soil characteristics in the southern Appalachians. For. Ecol. Manag. 2005, 211, 296–317. [Google Scholar] [CrossRef]
  40. Crotteau, J.S.; Rue-Johns, A.Z.; Barnard, J.C. Effects on understory biomass and forage 8–10 years after precommercial thinning of Sitka spruce—Western hemlock stands in southeast Alaska. Can. J. For. Res. 2020, 50, 215–225. [Google Scholar] [CrossRef]
  41. Cardinale, B.J.; Wright, J.P.; Cadotte, M.W.; Carroll, I.T.; Hector, A.; Srivastava, D.S.; Loreau, M.; Weis, J.J. Impacts of plant diversity on biomass production increase through time because of species complementarity. Proc. Natl. Acad. Sci. USA 2007, 104, 18123–18128. [Google Scholar] [CrossRef]
  42. Grace, J.B.; Anderson, T.M.; Seabloom, E.W.; Borer, E.T.; Adler, P.B.; Harpole, W.S.; Hautier, Y.; Hillebrand, H.; Lind, E.M.; Pärtel, M.; et al. Integrative modelling reveals mechanisms linking productivity and plant species richness. Nature 2016, 529, 390–393. [Google Scholar] [CrossRef] [PubMed]
  43. Hordijk, I.; Maynard, D.S.; Hart, S.P.; Mo, L.D.; ter Steege, H.; Liang, J.J.; de-Miguel, S.; Nabuurs, G.J.; Reich, P.B.; Abegg, M.; et al. Evenness mediates the global relationship between forest productivity and richness. J. Ecol. 2023, 111, 1308–1326. [Google Scholar] [CrossRef]
  44. DeWalt, S.J.; Chave, J. Structure and biomass of four lowland Neotropical forests. Biotropica 2004, 36, 7–19. [Google Scholar] [CrossRef]
  45. de Castilho, C.V.; Magnusson, W.E.; de Araújo, R.N.O.; Luizao, R.C.C.; Lima, A.P.; Higuchi, N. Variation in aboveground tree live biomass in a central Amazonian Forest:: Effects of soil and topography. For. Ecol. Manag. 2006, 234, 85–96. [Google Scholar] [CrossRef]
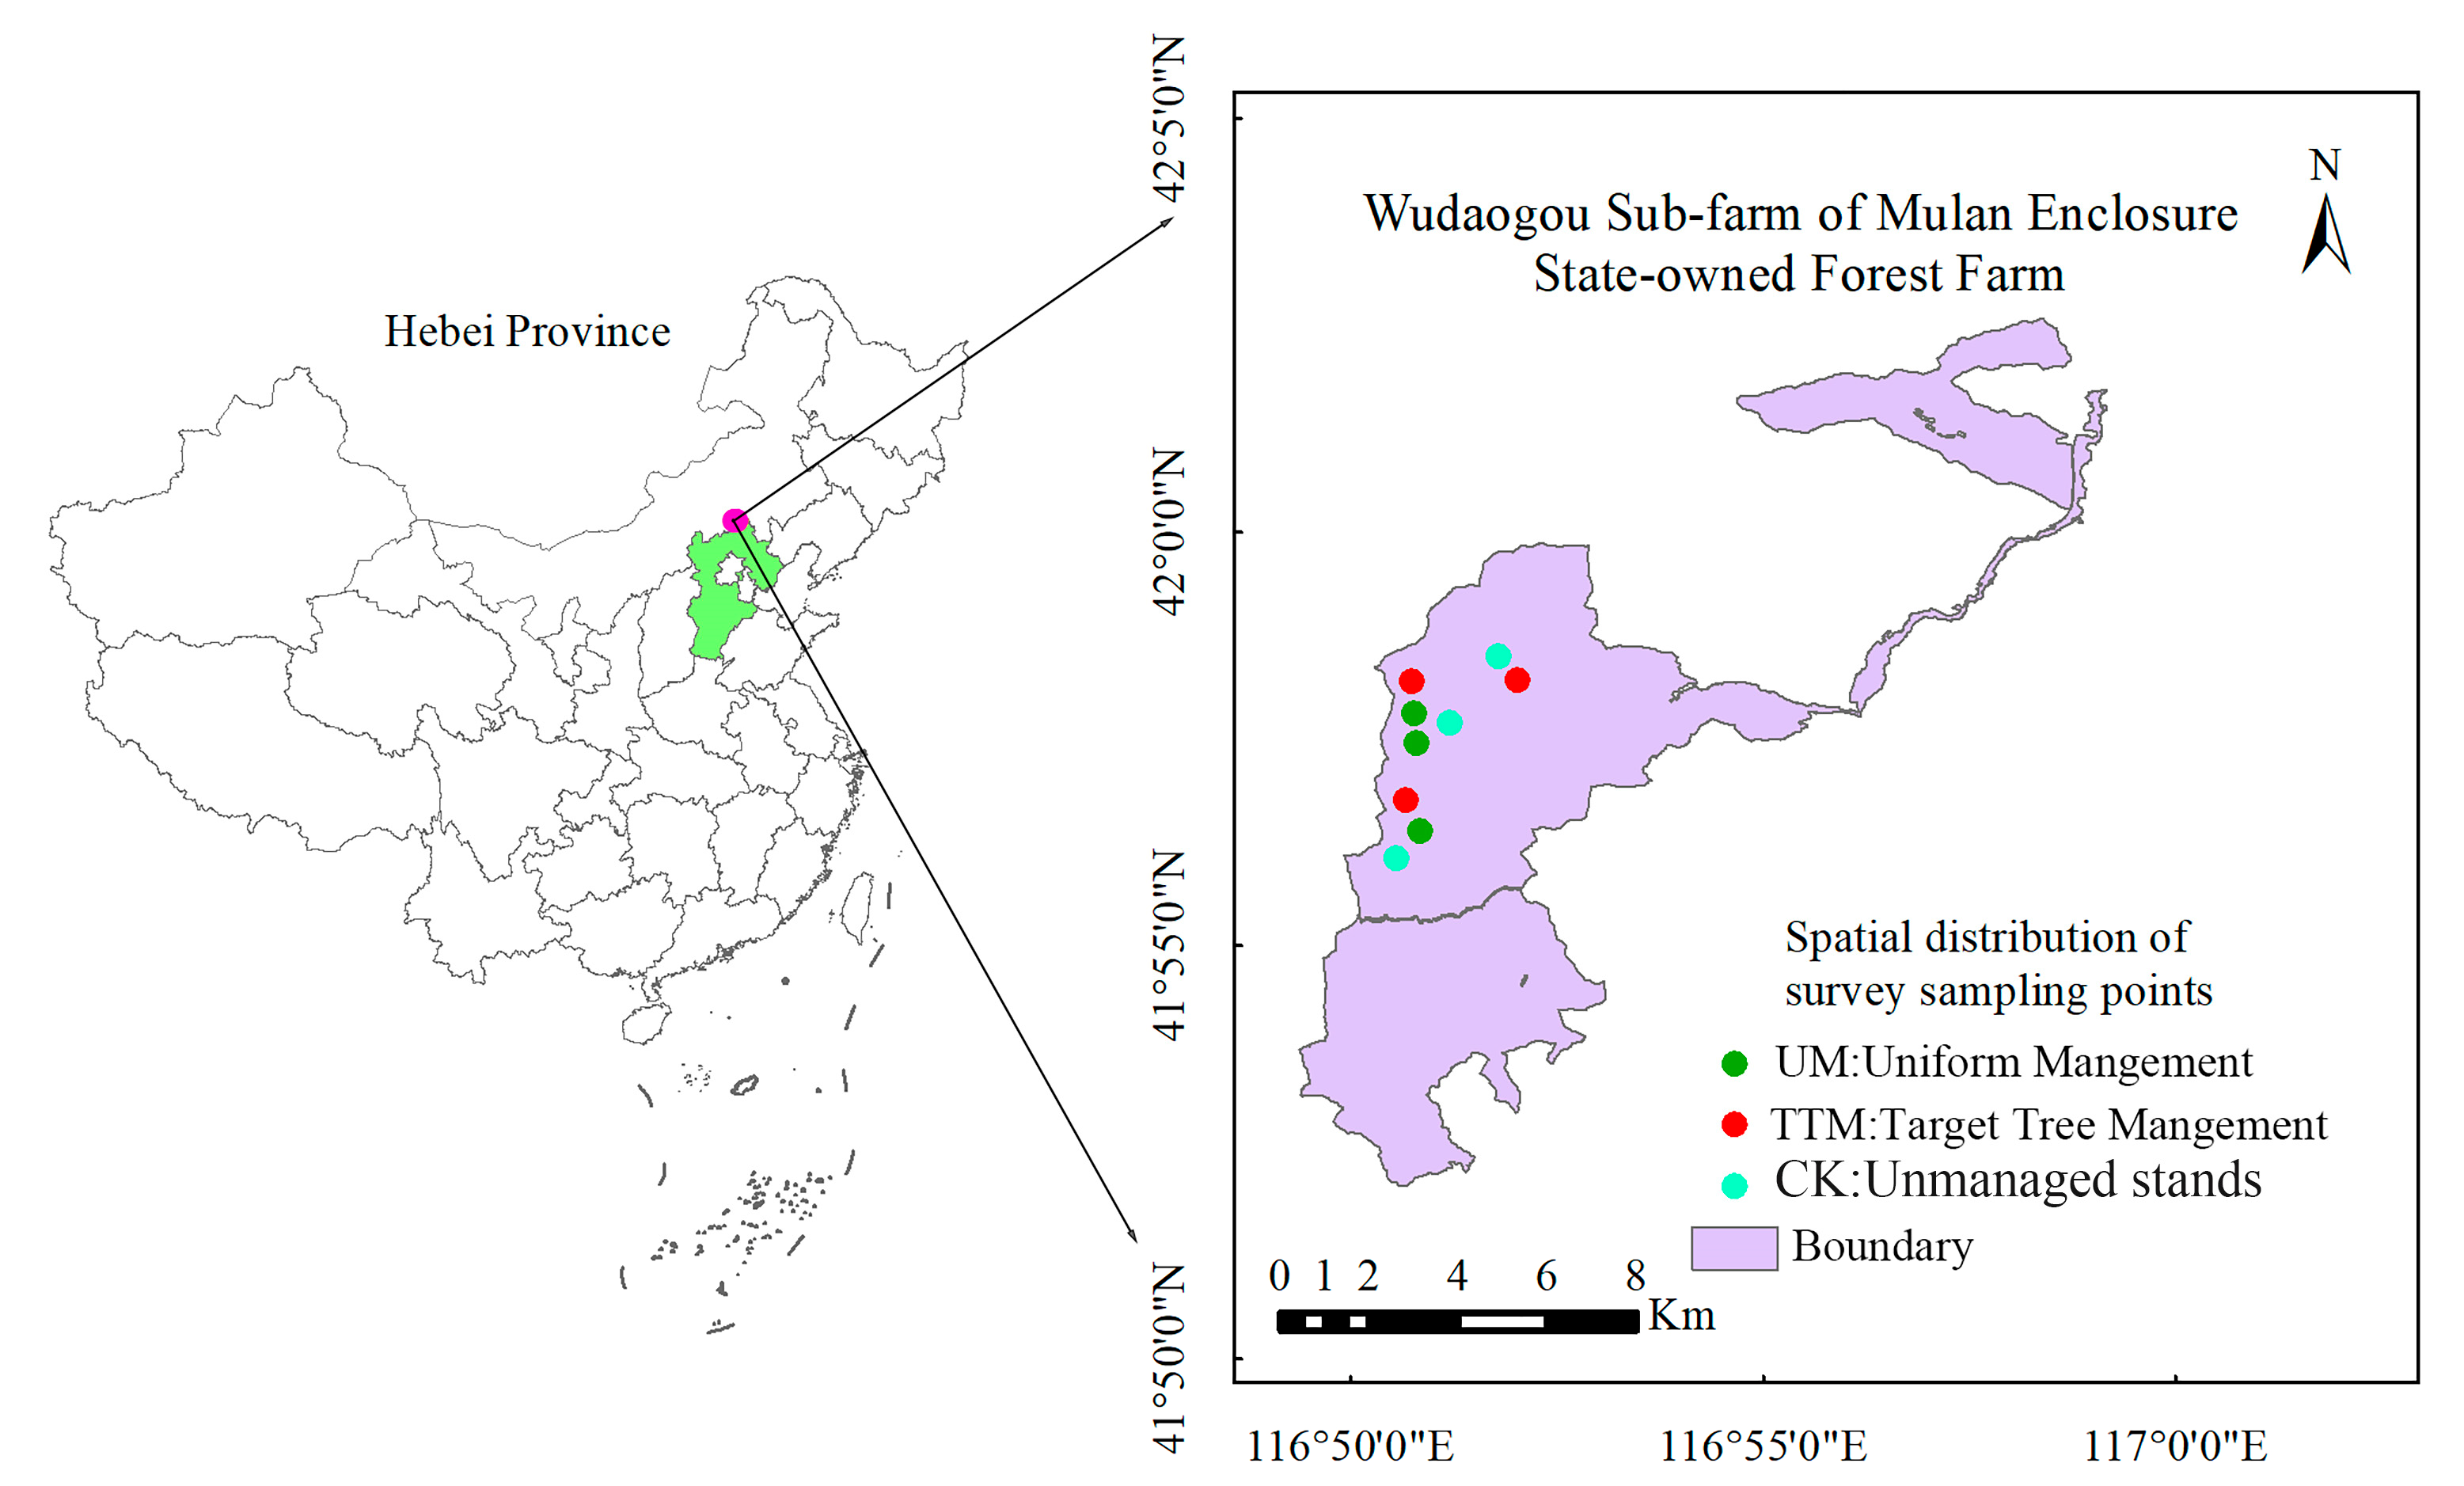
Figure 1. Map of China and the study area and sampling sites for this study.
Diversity 17 00787 g001
Figure 2. Comparison of understorey shrub and herb biomass under different management models. TTM represents target tree management, HM represents homogeneous management, and CK represents non-disruptive control. Bars indicate mean ± standard error (SE). Different lowercase letters indicate significant differences.
Diversity 17 00787 g002
Figure 3. Soil nutrient contents under different management models. (a) Total nitrogen (TN), (b) soil organic carbon (SOC). TTM represents target tree management, HM represents homogeneous management, and CK represents non-disruptive control. Bars indicate mean ± standard error (SE). Identical lowercase letters denote no significant differences among treatments (p > 0.05).
Diversity 17 00787 g003
Figure 4. Stand structural attributes under different management models. (a) Stand density and (b) basal area. TTM represents target tree management, HM represents homogeneous management, and CK represents the unmanaged control. Bars indicate mean ± standard error (SE). Different lowercase letters denote significant differences among treatments (p < 0.05).
Diversity 17 00787 g004
Figure 5. Correlation heatmap among plant diversity indices, stand density, and soil nutrient variables. Simpson_1-D, Shannon_H, Margalef, Pielou, and Gleason represent diversity indices; stand density indicates tree density; SOC and TN represent soil organic carbon and total nitrogen, respectively. The color and size of circles indicate the direction and strength of correlation coefficients. *, **, and *** denote significance at p < 0.05, p < 0.01, and p < 0.001, respectively.
Diversity 17 00787 g005
Figure 6. Random forest variable importance for predicting understory aboveground biomass. Stand density, basal area, diversity indices (Simpson_1-D, Shannon_H, Margalef, Pielou, Gleason), and soil variables (SOC, TN) were used as predictors. The bar length represents each variable’s relative contribution to model performance; greater values indicate higher importance.
Diversity 17 00787 g006
Figure 7. Partial dependence plots of the main predictors of understory aboveground biomass derived from the random forest model. (a) Stand density, (b) basal area, (c) Pielou’s evenness index, and (d) soil organic carbon (SOC). The y-axis represents the predicted partial dependence of biomass, while the x-axis shows the observed range of each variable.
Diversity 17 00787 g007
Table 1. Basic information of the three management modes.
Management ModesPlotsStand Density
(Trees·ha−1)
Mean Breast Diameter
(cm)
Average Tree Height
(m)
Canopy DensityAltitude
(m)
Slope
(°)
Slope PositionSoil TypeTerrainMeasures for the Year
TTM1215036.5915.710.71356.413Upper slopeLoamMountainous terrain2010
TTM22016.739.0015.290.71369.613Upper slopeLoamMountainous terrain2010
TTM3130025.6515.990.7136812Upper slopeLoamMountainous terrain2010
TTM4120036.1516.070.71372.912Upper slopeLoamMountainous terrain2010
TTM51283.344.7715.800.71335.413Upper slopeLoamMountainous terrain2010
HM12803.554.8613.420.81348.613Upper slopeLoamMountainous terrain2010
HM21533.334.5016.500.81367.414Upper slopeLoamMountainous terrain2010
HM3295059.9014.360.81367.513Upper slopeLoamMountainous terrain2010
HM4247951.3714.620.81365.412Upper slopeLoamMountainous terrain2010
HM5217551.9316.870.81338.111Upper slopeLoamMountainous terrain2010
CK1345761.2112.980.9135011Upper slopeLoamMountainous terrain2010
CK23333.374.2314.290.91366.413Upper slopeLoamMountainous terrain2010
CK3460047.3914.110.91368.514Upper slopeLoamMountainous terrain2010
CK4375871.9313.540.91358.412Upper slopeLoamMountainous terrain2010
CK53066.668.5013.580.91336.814Upper slopeLoamMountainous terrain2010
Note: TTM, target-tree management; HM:homogeneous management; CK, unmanaged stands. Initial plantation establishment in 2010; the most recent management measures were conducted in October.
Table 2. One-way ANOVA tables for biodiversity indices under different management model.
Management ModelSimpson_1-DShannon_HMargalefPielouGleason
Target tree management0.886 ± 0.01 a2.493 ± 0.14 a4.27 ± 0.68 a0.771 ± 0.009 a6.90 ± 1.12 a
Homogeneous management0.826 ± 0.02 ab2.22 ± 0.03 ab3.3 ± 0.31 ab0.748 ± 0.027 a5.16 ± 0.53 ab
Unmanaged stands0.794 ± 0.03 b1.95 ± 0.11 b2.53 ± 0.22 b0.71 ± 0.043 a4.09 ± 0.42 b
Note: Data are mean ± standard deviations. Different lowercase letters in the same column represent significant differences between different management models of the same biodiversity index (p < 0.05).
Disclaimer/Publisher’s Note: The statements, opinions and data contained in all publications are solely those of the individual author(s) and contributor(s) and not of MDPI and/or the editor(s). MDPI and/or the editor(s) disclaim responsibility for any injury to people or property resulting from any ideas, methods, instructions or products referred to in the content.