Abstract
Local leaf size diversity (LLSD) is an essential functional indicator of plant biodiversity; however, massive challenges are encountered when quantifying it and decoding its global ecological patterns. To address this limitation, the present study defined a quantitative indicator of LLSD, termed coefficient of variation index (CVI), for the leaf sizes, regardless of plant species, collected in each sampling site. Then, we innovatively derived a set of global CVI values from a published dataset, which was obtained through a meta-analysis of global leaf area samples and their related climate factors. Our macroecological analyses indicate that the CVI values vary across continents and fluctuate with latitude. The global CVI values are predominantly influenced by the mean temperature of the coldest month during the growing season in the negative correlation mode. When two leading climate drivers are considered, the global CVI values are primarily influenced by the mean temperature during growing season and the mean annual sum precipitation. Overall, all of these contributions are pioneering in their implications for characterizing the global distribution and ecological patterns of LLSD and advancing the cutting-edge research domain of leaf functional biodiversity to a new quantitative stage.
1. Introduction
In the burgeoning field of biodiversity research, local leaf size diversity (LLSD) is a subject of extensive interest [1,2,3]. Leaves are plants’ primary functional organs that support fundamental physiological processes, such as photosynthetic carboxylation and catabolic respiration [1]. LLSD, undoubtedly, adds complexity to understanding the mechanisms that underlie these processes. As one of the most prominent functional traits in leaf ecology is leaf size [2], comprehensively investigating the determinants of leaf sizes may provide revolutionary ecological insights. Moreover, a diverse array of leaf sizes tends to exist within any given climate or latitude [3], whereas the ecological mechanisms regulating their individual characteristics remain unclear. Thus, exploring LLSD and its ecological patterns can enhance our understanding of its characteristics and determinants.
However, quantifying LLSD and, subsequently, decoding its ecological patterns has proven to still be a significant challenge. To date, there are efficient solution plans that can measure all the leaves on a plant without causing damage [4], yet few methods exist for quantifying LLSD in local areas. This challenge becomes more pronounced when considering its distribution patterns and ecological roles at the global scale. Notably, even state-of-the-art satellite-based remote sensing technologies, which have been widely used for global mapping, lack the resolution required for accurate measurement of individual leaf sizes [5]. Collectively, measurement across scales—from the individual level to ecosystem level—presents methodological challenges.
Specifically, traditional approaches to investigating leaf size typically involve direct physical measurements of collected samples using basic tools such as rulers, calipers, or graph paper [6,7,8,9,10,11]. These methods, while sometimes being labor-intensive, can provide fundamental metrics including leaf length, width, area, and perimeter—core parameters for assessing LLSD. However, these approaches [6,7,8,9,10,11] present challenges for large-scale studies due to time constraints and potential leaf damage during collection. Particularly for delicate leaves, the process of collection and transport can alter morphological traits, leading to measurement artifacts [12]. Additionally, traditional methods often involve destructive sampling, which may not be desirable for endangered species or long-term monitoring plots where repeated measurements are necessary [13].
Recent technological advancements have revolutionized the measurement of leaf shapes through non-destructive, high-throughput methods that enhance accuracy while reducing processing time. These approaches include portable scanning devices, digital image analysis, and automated classification algorithms that can capture not only size metrics but also shape characteristics [14,15,16,17]. Such approaches typically apply computer vision algorithms to distinguish leaf tissue from background, automatically extracting leaf morphological parameters with minimal human intervention [18,19]. Unfortunately, these techniques also present challenges for large-scale studies.
Additionally, understanding LLSD requires careful consideration of environmental influences and measurement scale, because leaf size varies significantly along climatic gradients [20,21,22] and across organizational levels [23]. Research has demonstrated that environmental factors such as temperature, precipitation, and solar radiation strongly influence leaf size patterns [24]. A comprehensive study across three distinctive plateaus in China found that leaf size was positively correlated with growing-season temperature and precipitation but negatively correlated with ultraviolet radiation, suggesting that environmental filtering plays a more important role than phylogeny in determining leaf size distribution [25]. Similarly, global analyses have revealed that diurnal temperature range significantly influences leaf size patterns, with larger leaves predominating in areas with smaller day-night temperature variations [26].
However, almost no research has been conducted to facilitate the explicit analyses of the ecological determinants and patterns of LLSD in different scenarios, let alone its global scale. The objective of this study was to fill this gap by specifically addressing the issue of quantitatively characterizing LLSD and revealing its global ecological pattern. The validated indicator can serve as a common index for use by the LLSD research community, and the derived ecological models can generate new insights into the macro-scale LLSD-indicated distribution of phytosphere worldwide. The findings have wide implications for advancing research in leaf ecophysiology, plant biogeography, plant community ecology, ecosystem process modeling, biosphere productivity, and even Earth system science.
2. Materials and Methods
2.1. General Scheme
We proposed a quantitative indicator of LLSD—coefficient of variation index (CVI)—for the leaf sizes, regardless of plant species, collected in each sampling site. The decision not to consider plant species, as in [20], is rooted in the difficulty of collecting leaf size samples at the global scale, in contrast to those in intraspecific [22] and interspecific [24] studies. Utilizing this indicator, we systematically examined the macroecological pattern of LLSD based on a published dataset that was generated through a meta-analysis of global leaf size samples and their associated climate factors [20]. The 16 climate factors include mean annual temperature (MAT, °C), mean temperature during growing season (Tgs, °C), mean temperature of the coldest month (TCM, °C), mean temperature of the coldest month during growing season (TCMgs, °C), mean temperature of the warmest month (TWM, °C), mean annual sum precipitation (MAP, mm), mean growing season precipitation (PPTgs, mm), coefficient of variation of monthly precipitation (cvPPT, mm), annual equilibrium moisture index (MIann, mm mm−1), growing season equilibrium moisture index (MIgs, mm mm−1), sum annual equilibrium evapotranspiration (ETq, mm), sum growing season equilibrium evapotranspiration (ETqgs, mm), mean daily irradiance, annual (RADann, W m−2), mean daily irradiance during growing season (RADgs, W m−2), mean annual daytime relative humidity (RHann, %), and mean daytime relative humidity during growth season (RHgs, %).
2.2. LLSD Quantification
The rationale of introducing CV into the characterization of LLSD is that the ranges of leaf sizes may be different across different sampling sites, which, in terms of locations (latitude and longitude), were determined by following the rules in [20]. In this context, CV can serve as a viable solution. Specifically, CV is a statistical measure that quantifies the relative dispersion of data values in a dataset around the mean. It has been utilized in the development of indicators for retrieving plant attributes [27]. For the selected sites, each exhibiting more than nine sampling specimens in terms of leaf sizes, CVI is defined as follows:
where xi denotes the leaf size value of the ith sample within the considered site that comprises n samples, μ is the mean of those leaf sizes, and σ is the standard deviation of those leaf sizes. As a standardized measure of the dispersion within a probability distribution or a frequency distribution, the CV-based definition of LLSD can quantify the situations of leaf diversities in different environments of plant growths.
For the 16 ancillary climate factors, their statistical distribution modes were derived by examining their histograms. Subsequently, the identified strongly right-skewed climate factors (MAP, PPTgs, MIann, and MIgs) were log-transformed. In contrast, the strongly left-skewed climate factors (MAT and TCM, pre-scaled by dividing by 10 and 20, respectively) were exponentially transformed. All transformations yielded approximately Gaussian distributions.
2.3. Global Ecological Analysis
To explore potential relationships between CVI and the climatic factors, Pearson’s correlation analysis [28] was employed to assess the strength of associations between these variables. A strong correlation, indicated by a high correlation coefficient (R) and a low p-value, suggests a close relationship, whereas a weak correlation (low R and high p-value) indicates minimal association [28]. Specifically, relationships between CVI and each of the 16 climatic factors were quantified using the Correlation Analysis module in MATLAB (www.matlab.cn, accessed on 3 September 2024). Results from these analyses help elucidate the influence of climatic factors on CVI variation.
Next, dominance analysis [29] was conducted to evaluate the relative contributions of the 16 climatic factors to the spatial distribution of CVI. This method of statistical analysis can determine the relative importance of predictors within a linear regression model [29]. The procedure is designed as follows: CVI is designated as the dependent variable, and the 16 climatic factors as predictors. These variables are individually input into the Dominance Analysis module of DPS software [29] for analysis, consequently without the need to consider the autocorrelation between the predictors. The resulting model coefficients reflect the relative contributions of the corresponding climatic factors, and the comparison of the coefficients identifies the leading climatic factor exerting a primary influence on the global CVI pattern.
To examine nonlinear relationships between CVI and the 16 climatic factors, two univariate regression methods were employed, namely quadratic regression and Gaussian regression [30], and the analyses were performed by using MATLAB. Additionally, bivariate regression was implemented using the poly11 and poly22 tools in MATLAB to investigate interactive effects of paired climatic factors on CVI variations. Note that this explicit scenario relates to the unnecessity of considering the autocorrelation between the 16 climatic factors. At last, all the results provide insights into the macroecological mechanisms through which climate shapes global CVI patterns.
3. Results
3.1. Global Pattern of LLSD
Based on the dataset of leaf size samples extracted from the published dataset [20], the global distribution of LLSD was quantitatively derived, as shown by the global map of 504 CVI sample sites in Figure 1. Across the range of calculated CVI values, most of the sampling sites exhibit relatively lower CVI magnitudes.
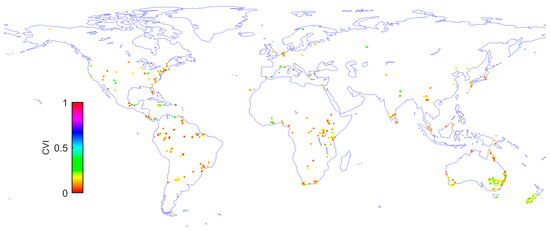
Figure 1.
The derived global CVI map based on the dataset of leaf size samples that were extracted from the published dataset [20].
Specifically, the CVI values fluctuate with latitude, with decreasing values toward the equator and increasing values toward the poles (Figure 2a). In terms of continental variations, Oceania is characterized by the highest mean CVI values, while Africa demonstrates the lowest mean CVI values (Figure 2b). Oceania displays the largest range of CVI variation, whereas South America shows the smallest range of CVI variability (Figure 2b). Overall, Earth exhibits pronounced spatial heterogeneity in local leaf size distribution.
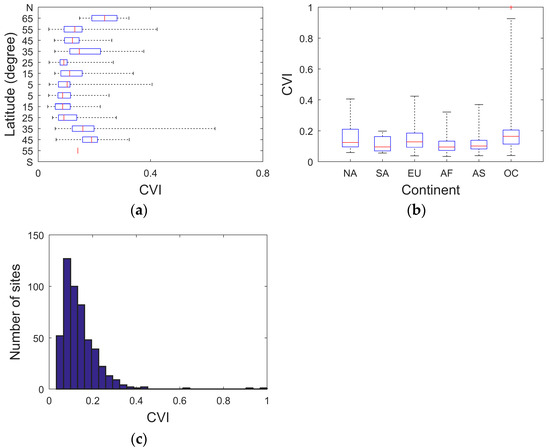
Figure 2.
(a) Boxplot of the derived CVI values along with latitude; (b) boxplot of the CVI values for the six continents: North America (NA), South America (SA), Europe (EU), Africa (AF), Asia (AS), and Oceania (OC). (c) Histogram of the numbers of sampling sites for the derived CVI values.
The histogram of the CVI values for all the considered samples in the present study demonstrates a pronounced right-skewed distribution (Figure 2c). Given this statistical distribution, the original CVI values were log-transformed for both logical and statistical reasons. Log transformation enables a more meaningful interpretation as it operates on a multiplicative rather than arithmetic scale, which is biologically more relevant for size variables. Additionally, it reduces the positive skewness, thereby helping to stabilize the variance in relation to the mean [27]. This approach was implemented to support the subsequent macroecological analyses aimed at uncovering those yet-unknown global determinants of LLSD.
3.2. Global Ecological Pattern of LLSD
For the task of exploring the macroecological relationships between the global CVI values and 16 climate factors, linear regression analyses revealed their correlations (Figure 3a), and dominance analyses quantified the relative contributions of the latter in influencing the former (Figure 3b). Most climate factors show explicit relationships with CVI values. The dominant climate factor is TCMgs, which has the highest absolute correlation coefficient value (−0.41) and the highest contribution (9.32%).
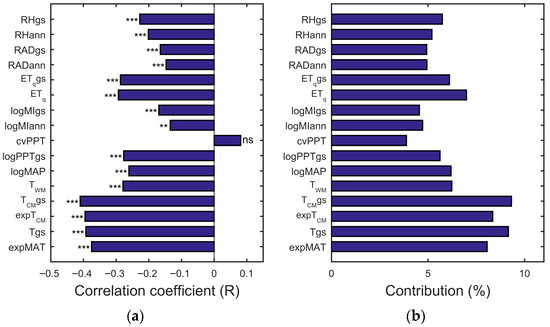
Figure 3.
(a) The correlation coefficients between the derived CVI values and the 16 climate factors and (b) the contributions of the latter to the former. The statistical significance is indicated as follows: *** p-value < 0.001; ** 0.001 < p-value < 0.01; * 0.01 < p-value < 0.05; ns p-value > 0.05.
This suggests that, at the global scale, the primary driving force on CVI is the temperature-related climate factor. However, the total variation in CVI is inadequately explained by the climate factors when the linear regression fitting techniques are used, as indicated by the derived R2 values, which show that climate factors account for only 0.66% to 16.82% of the variations in CVI. These results underline the need for applying nonlinear (e.g., polynomial) regression models to more effectively elucidate the potential mechanisms through which climate influences LLSD.
The quadratic and Gaussian regression models applied to each of the 16 climate factors account for relatively higher ratios of variation in the global CVI values than linear models. In these two scenarios, the highest ratios of variation are 16.82% (Figure 4a) and 16.83% (Figure 4b), respectively, both of which are best explained by TCMgs, as indicated by the 5th and 95th quantile regression fits. In comparison, the Gaussian regression model marginally outperformed the quadratic one. Although CVI decreases with TCMgs in both models, the minimal improvements in R2 values (0.1682 and 0.1683) compared to the best result (0.1681) of linear regression analyses suggest that the global variation in CVI in response to climate drivers is more likely to be nonlinear.
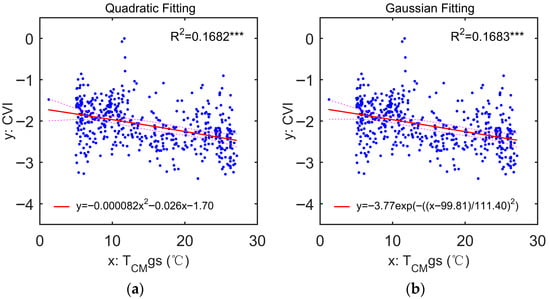
Figure 4.
The cases performing with the highest correlations between CVI and TCMgs in terms of (a) quadratic regression fit (logCVI = −0.000082 TCMgs2 − 0.026 TCMgs − 1.70; R2 = 0.1682, p-value < 0.0001) and (b) Gaussian regression fit (logCVI = −3.77 exp(−((TCMgs − 99.81)/111.40)2); R2 = 0.1683, p-value < 0.0001). In (a,b), the bold red lines show the regression fits, and the red dashed lines show the 5th and 95th quantile regression fits. The performance of Gaussian fitting is a little better than that of quadratic fitting. The statistical significance is indicated as follows: *** p-value < 0.001; ** 0.001 < p-value < 0.01; * 0.01 < p-value < 0.05; ns p-value > 0.05.
Furthermore, first-order and second-order bivariate regression analyses were made for all possible combinations of the 16 climate factors considered in the present study. Collectively, the fitting performance shows a gradual improvement. In these analyses, the combination of Tgs and logMAP is identified as the most effective predictor pair. The fitted plane and curved surface corresponding to their respective highest R2 values are shown in Figure 5a,b (0.1794 and 0.1982, respectively), representing an increase in explanatory power from 17.94% to 19.82%. In other words, the ecological predicting model corresponding to the fitted curved surface provides a slightly better explanation for the variation in CVI values. Consequently, it can be inferred that the varying climatic conditions exert a more complex influence on global LLSD patterns.
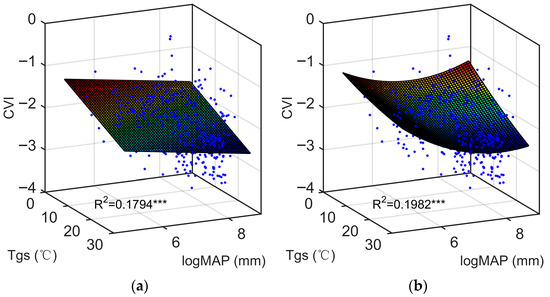
Figure 5.
The best (a) first- and (b) second-order regression fits of CVI to a bivariate function of Tgs and logMAP present as a plain and twisted plane with the functional forms of logCVI = −0.66 − 0.032 Tgs − 0.12 logMAP and logCVI = 2.99 + 0.0043 Tgs − 1.29 logMAP + 0.00036 Tgs2 − 0.0068 Tgs × logMAP + 0.092 logMAP2, respectively. The statistical significance is marked as follows: *** p-value < 0.001; ** 0.001 < p-value < 0.01; * 0.01 < p-value < 0.05; ns p-value > 0.05.
Overall, compared to the scenarios based on univariate regression analyses, the combinations of two climate factors demonstrated a greater capacity to explain the variations in CVI values. In addition to verifying the initial hypothesis that LLSD should be influenced by its growth environment, this stepwise improvement facilitated the discovery of new ecological knowledge about LLSD.
4. Discussion and Conclusions
The present study has accomplished the groundbreaking task of developing a primary indicator of LLSD and characterizing its global macroecological patterns. This pioneering research provides new quantitative insights into the global variation and spatial distribution of LLSD. However, the quantitative characterization of CVI and its macroecological patterns may involve various aspects of plant biodiversity [31] and their complex growth environments. Nevertheless, many facets remain unexplored. Relying solely on the coefficient of variation in leafvariation of leaf sizes as an LLSD indicator is insufficient; consequently, subsequent research must refine LLSD indicators, e.g., by introducing new statistical models.
To this end, subsequent work will incorporate as many factors influencing LLSD as possible. It is noted that leaf size represents only one functional trait for characterizing leaf biodiversity. Apart from the ecological drivers examined in the present study, traits characterizing plant leaf diversity span structural, genetic, functional, biogeographic, biochemical, physiological, and phylogenetic dimensions [32,33,34,35,36,37,38,39]. For example, species and phylogenetic lineages have evolved to differ in the way that they acquire and deploy resources, with consequences for their physiological, chemical, and structural attributes [36], and more such information can be disclosed by exploring LLSD. This theoretical prospect suggests that additional factors may influence CVI, underscoring the need to determine the relative weights of LLSD functional traits and their systematic relationships to establish robust leaf biodiversity indicators. Such an approach will enable the development of more effective indicators and potentially a comprehensive framework for characterizing leaf biodiversity.
Although our macroecological analysis of CVI was conducted globally, achieving a comprehensive ecological understanding of LLSD remains quite distant. Enhancing the ecological assessment of leaf biodiversity is thus imperative. Potential improvements include expanding sample sizes, adopting novel measurement techniques, acquiring additional leaf feature parameters, enhancing functional synergy among heterogeneous parameters [40], implementing spatiotemporal big data indexing methods [41], and integrating improved LLSD indices. These advancements will yield a more systematic LLSD distribution map applicable across scales. The ecological mechanisms identified can subsequently inform biomimicry applications, support plant conservation, and deepen insights into natural evolution.
When selecting LLSD measurement methods, researchers must weigh trade-offs among accuracy, efficiency, destructiveness, and technical requirements. Traditional methods offer low technical barriers but are often time-consuming and potentially destructive, while technological approaches provide greater efficiency and digital archiving capabilities but require specialized equipment and expertise. The choice of methods should align with research objectives—intraspecific variation studies tend to require detailed measurements of sample leaves, whereas community-level assessments may prioritize rapid sampling across numerous species [42]. This point also explains the theoretical foundation of this study without regarding plant species.
Future methodological developments should focus on standardizing protocols to facilitate cross-study comparisons. Current variability in measurement techniques may complicate meta-analyses and large-scale synthesis. Developing universal calibration models that incorporate leaf shape parameters, akin to those proposed in global studies of the Montgomery equation [43], offers a promising path toward standardizing leaf area estimation across diverse floras. Similarly, integrating machine learning algorithms for automated leaf classification and measurement [44,45,46,47] could enhance throughput and accuracy while minimizing human bias.
As technology advances, maintaining connections to traditional validation methods and establishing robust quality control protocols will be essential. Ultimately, methodological integration—using high-throughput techniques for large-scale screening and traditional methods for calibration and validation—will provide the most comprehensive understanding of LLSD across ecosystems. This integrated approach will be crucial for addressing fundamental questions in plant ecology and predicting vegetation responses to ongoing environmental change.
In summary, this study’s contributions from a functional synergy [40] and big data [41] perspective have pioneering significance for deciphering global ecological patterns of LLSD and, in a broader sense, advancing the emerging field of leaf functional biodiversity into a quantitative macroecological stage.
Author Contributions
Conceptualization, Y.L.; methodology, B.Y. and Y.L.; software, S.L.; validation, D.L.; writing—original draft preparation, Y.L.; writing—review and editing, T.-O.C.; funding acquisition, Y.L. All authors have read and agreed to the published version of the manuscript.
Funding
This research was funded by the National Key Research and Development Program of China (grant number 2022YFE0112700) and the National Natural Science Foundation of China (grant number 32171782).
Institutional Review Board Statement
Not applicable.
Data Availability Statement
The data in the present study was derived from the “global leaf size data set” (https://doi.org/10.1126/science.aal4760).
Acknowledgments
We thank Ian J. Wright and his coauthors for publishing the original dataset.
Conflicts of Interest
The authors declare no conflicts of interest. The funders had no role in the design of the study; in the collection, analyses, or interpretation of data; in the writing of the manuscript; or in the decision to publish the results.
Abbreviations
The following abbreviations are used in this manuscript:
| LLSD | local leaf size diversity |
| CV | coefficient of variation |
| CVI | CV index for the leaf sizes in each sampling site |
| MAT | mean annual temperature |
| Tgs | mean temperature during growing season |
| TCM | mean temperature of the coldest month |
| TCMgs | mean temperature of the coldest month during growing season |
| TWM | mean temperature of the warmest month |
| MAP | mean annual sum precipitation |
| PPTgs | mean growing season sum precipitation |
| cvPPT | coefficient of variation in monthly precipitation |
| MIann | annual equilibrium moisture index |
| MIgs | growing season equilibrium moisture index |
| ETq | sum annual equilibrium evapotranspiration |
| ETqgs | sum growing season equilibrium evapotranspiration |
| RADann | annual mean daily irradiance |
| RADgs | growing season mean daily irradiance |
| RHann | mean annual daytime relative humidity |
| RHgs | mean daytime relative humidity during growth season |
References
- Gates, D.M. Energy, plants, and ecology. Ecology 1965, 46, 1–13. [Google Scholar] [CrossRef]
- Peppe, D.J.; Royer, D.L.; Cariglino, B.; Oliver, S.Y.; Newman, S.; Leight, E.; Enikolopov, G.; Fernandez-Burgos, M.; Herrera, F.; Adams, J.M.; et al. Sensitivity of leaf size and shape to climate: Global patterns and paleoclimatic applications. New Phytol. 2011, 190, 724–739. [Google Scholar] [CrossRef] [PubMed]
- Kattge, J.; Bönisch, G.; Díaz, S.; Lavorel, S.; Prentice, I.C.; Leadley, P.; Tautenhahn, S.; Werner, G.D.A.; Aakala, T.; Abedi, M.; et al. TRY plant trait database—Enhanced coverage and open access. Glob. Change Biol. 2020, 26, 119–188. [Google Scholar] [CrossRef] [PubMed]
- Schrader, J.; Shi, P.; Royer, D.L.; Peppe, D.J.; Gallagher, R.V.; Li, Y.; Wang, R.; Wright, I.J. Leaf size estimation based on leaf length, width and shape. Ann. Bot. 2021, 128, 395–406. [Google Scholar] [CrossRef] [PubMed]
- Moreno-Martínez, A.; Camps-Valls, G.; Kattge, J.; Robinson, N.; Reichstein, M.; van Bodegom, P.; Kramer, K.; Cornelissen, J.H.C.; Reich, P.; Bahn, M.; et al. A methodology to derive global maps of leaf traits using remote sensing and climate data. Remote Sens. Environ. 2018, 218, 69–88. [Google Scholar] [CrossRef]
- Pandey, S.K.; Singh, H. A simple, cost-effective method for leaf area estimation. J. Bot. 2011, 2011, 658240. [Google Scholar] [CrossRef]
- Easlon, H.M.; Bloom, A.J. Easy Leaf Area: Automated digital image analysis for rapid and accurate measurement of leaf area. Appl. Plant Sci. 2014, 2, 1400033. [Google Scholar] [CrossRef]
- Shaddox, T.W.; Unruh, J.B. Correlating methods of measuring zoysiagrass thatch. Crop Sci. 2019, 59, 792–799. [Google Scholar] [CrossRef]
- Kałuża, T.; Tymków, P.; Strzeliński, P. Use of remote sensing for investigating riparian shrub structures. Pol. J. Environ. Stud. 2012, 21, 115–122. [Google Scholar]
- Babaev, R.N. Application of the Adobe Photoshop software package in leaf blade area measurement of woody plants. Lesn. Zhurnal For. J. 2021, 5, 185–191. [Google Scholar] [CrossRef]
- Igathinathane, C.; Chennakesavulu, B.; Manohar, K.; Womac, A.; Pordesimo, L. Photovoltaic leaf area meter development and testing. Int. J. Food Prop. 2008, 11, 53–67. [Google Scholar] [CrossRef]
- Sack, L.; Caringella, M.; Scoffoni, C.; Mason, C.; Rawls, M.; Markesteijn, L.; Poorter, L. Leaf vein length per unit area is not intrinsically dependent on image magnification: Avoiding measurement artifacts for accuracy and precision. Plant Physiol. 2014, 166, 829–838. [Google Scholar] [CrossRef] [PubMed]
- Ramirez-Builes, V.H.; Porch, T.G.; Harmsen, E.W. Development of linear models for estimation of leaflet area in common bean (Phaseolus vulgaris L.). J. Agric. Univ. PR 2008, 92, 171–182. [Google Scholar] [CrossRef]
- Hosoi, F.; Omasa, K. Factors contributing to accuracy in the estimation of the woody canopy leaf area density profile using 3D portable lidar imaging. J. Exp. Bot. 2007, 58, 3463–3473. [Google Scholar] [CrossRef] [PubMed]
- Amean, Z.M.; Low, T.; Hancock, N. Automatic leaf segmentation and overlapping leaf separation using stereo vision. Array 2021, 12, 100099. [Google Scholar] [CrossRef]
- Fuentes, S.; Hernández-Montes, E.; Escalona, J.M.; Bota, J.; Viejo, C.G.; Poblete-Echeverría, C.; Tongson, E.; Medrano, H. Automated grapevine cultivar classification based on machine learning using leaf morpho-colorimetry, fractal dimension and near-infrared spectroscopy parameters. Comput. Electron. Agric. 2018, 151, 311–318. [Google Scholar] [CrossRef]
- Gong, L.; Chen, R.; Zhao, Y.S.; Liu, C.L. Model-based in-situ measurement of pakchoi leaf area. Int. J. Agric. Biol. Eng. 2015, 8, 35–42. [Google Scholar]
- Gong, A.; Wu, X.; Qiu, Z.; He, Y. A handheld device for leaf area measurement. Comput. Electron. Agric. 2013, 98, 74–80. [Google Scholar] [CrossRef]
- Hu, T.; Shen, P.; Zhang, Y.; Zhang, J.; Li, X.; Xia, C.; Liu, P.; Lu, H.; Wu, T.; Han, Z. OpenPheno: An open-access, user-friendly, and smartphone-based software platform for instant plant phenotyping. Plant Methods 2025, 21, 76. [Google Scholar] [CrossRef]
- Wright, I.J.; Dong, N.; Maire, V.; Prentice, I.C.; Westoby, M.; Díaz, S.; Gallagher, R.V.; Jacobs, B.F.; Kooyman, R.; Law, E.A.; et al. Global climatic drivers of leaf size. Science 2017, 357, 917–921. [Google Scholar] [CrossRef]
- Bairstow, K.A.; Clarke, K.L.; McGeoch, M.A.; Andrew, N.R. Leaf miner and plant galler species richness on Acacia: Relative importance of plant traits and climate. Oecologia 2010, 163, 437–448. [Google Scholar] [CrossRef]
- Salazar, P.C.; Navarro-Cerrillo, R.M.; Cruz, G.; Villar, R. Intraspecific leaf functional trait variability of eight Prosopis pallida tree populations along a climatic gradient of the dry forests of northern Peru. J. Arid. Environ. 2018, 152, 12–20. [Google Scholar] [CrossRef]
- Schubert, N.; Freitas, C.; Silva, A.; Costa, M.M.; Barrote, I.; Horta, P.A.; Rodrigues, A.C.; Santos, R.; Silva, J. Photoacclimation strategies in northeastern Atlantic seagrasses: Integrating responses across plant organizational levels. Sci. Rep. 2018, 8, 14825. [Google Scholar] [CrossRef]
- Innangi, M.; Friščić, M.; Hazler Pilepić, K.; Danise, T.; Conti, F.; Bartolucci, F.; Fioretto, A.; Peruzzi, L. Explaining intricate morphometric variability with environmental predictors: The case of Globularia cordifolia species complex. Plants 2020, 9, 314. [Google Scholar] [CrossRef]
- Ren, T.; He, N.; Liu, Z.; Li, M.; Zhang, J.; Li, A.; Wei, C.; Lü, X.; Han, X. Environmental filtering rather than phylogeny determines plant leaf size in three floristically distinctive plateaus. Ecol. Indic. 2021, 130, 108049. [Google Scholar] [CrossRef]
- Gallou, A.; Jump, A.S.; Lynn, J.S.; Field, R.; Irl, S.D.H.; Steinbauer, M.J.; Beierkuhnlein, C.; Chen, J.-C.; Chou, C.-H.; Hemp, A.; et al. Diurnal temperature range as a key predictor of plants’ elevation ranges globally. Nat. Commun. 2023, 14, 7890. [Google Scholar] [CrossRef]
- Kacira, M.; Ling, P.P.; Short, T.H. Machine vision extracted plant movement for early detection of plant water stress. Trans. ASAE 2002, 45, 1147–1153. [Google Scholar] [CrossRef] [PubMed]
- Rodgers, J.L.; Nicewander, W.A. Thirteen ways to look at the correlation coefficient. Amer. Statis. 2012, 42, 59–66. [Google Scholar] [CrossRef]
- Azen, R.; Budescu, D.V. The dominance analysis approach for comparing predictors in multiple regression. Sych. Methods 2003, 8, 129–148. [Google Scholar] [CrossRef] [PubMed]
- Tang, Q.; Feng, M. DPS Data Processing System: Experimental Design, Statistical Analysis, and Data Mining; Science Press: Beijing, China, 2007. [Google Scholar]
- Nakayama, H. Leaf form diversity and evolution: A never-ending story in plant biology. J. Plant Res. 2024, 137, 547–560. [Google Scholar] [CrossRef] [PubMed]
- Osnas, J.L.D.; Katabuchi, M.; Kitajima, K.; Wright, S.J.; Reich, P.B.; Van Bael, S.A.; Kraft, N.J.B.; Samaniego, M.J.; Pacala, S.W.; Lichstein, J.W. Divergent drivers of leaf trait variation within species, among species, and among functional groups. Proc. Natl. Acad. Sci. USA 2018, 115, 5480–5485. [Google Scholar] [CrossRef] [PubMed]
- Onoda, Y.; Wright, I.J.; Evans, J.R.; Hikosaka, K.; Kitajima, K.; Niinemets, Ü.; Poorter, H.; Tosens, T.; Westoby, M. Physiological and structural tradeoffs underlying the leaf economics spectrum. New Phytol. 2017, 214, 1447–1463. [Google Scholar] [CrossRef]
- Silva, J.L.A.; Souza, A.F.; Santiago, L.S.; Gripp, A.D.R.; Asato, A.E.B.; Silva, G.H.S.; de Alencar, M.I.G.; Caliman, A. Small biodiversity effects on leaf litter production of a seasonal heath vegetation. J. Veg. Sci. 2020, 31, 877–886. [Google Scholar] [CrossRef]
- Wang, R.; Gamon, J.A.; Cavender-Bares, J. Seasonal patterns of spectral diversity at leaf and canopy scales in the Cedar Creek prairie biodiversity experiment. Remote Sens. Environ. 2022, 280, 113169. [Google Scholar] [CrossRef]
- Cavender-Bares, J.; Meireles, J.E.; Couture, J.J.; A Kaproth, M.; Kingdon, C.C.; Singh, A.; Serbin, S.P.; Center, A.; Zuniga, E.; Pilz, G.; et al. Associations of leaf spectra with genetic and phylogenetic variation in oaks: Prospects for remote detection of biodiversity. Remote Sens. 2016, 8, 221. [Google Scholar] [CrossRef]
- White, D.M.; Cavender-Bares, J.; Davis, C.C.; Guzmán, Q.J.A.; Kothari, S.; Robles, J.M.; Meireles, J.E. Seeing herbaria in a new light: Leaf reflectance spectroscopy unlocks trait and classification modeling in plant biodiversity collections. New Phytol. 2025; early view. [Google Scholar] [CrossRef]
- Lepoint, G.; Balancier, B.; Gobert, S. Seasonal and depth-related biodiversity of leaf epiphytic Cheilostome Bryozoa in a Mediterranean Posidonia oceanica meadow. Cah. Biol. Mar. 2014, 55, 57–67. [Google Scholar]
- Martínez-Garza, C.; Pena, V.; Ricker, M.; Campos, A.; Howe, H.F. Restoring tropical biodiversity: Leaf traits predict growth and survival of late-successional trees in early-successional environments. For. Ecol. Manag. 2005, 217, 365–379. [Google Scholar] [CrossRef]
- Gao, Y.; Liu, J.; Wang, D.; An, Y.; Ma, H.; Tong, S. Synergy and trade-off between plant functional traits enhance grassland multifunctionality under grazing exclusion in a semi-arid region. J. Environ. Manag. 2025, 373, 123877. [Google Scholar] [CrossRef]
- Tian, R.; Zhai, H.; Zhang, W.; Wang, F.; Guan, Y. A survey of spatio-temporal big data indexing methods in distributed environment. IEEE J. Sel. Top. Appl. Earth Obs. Remote Sens. 2022, 15, 4132–4155. [Google Scholar] [CrossRef]
- Suzuki, S.N.; Hirao, T. Recruitment drives successional changes in the community-level leaf mass per area in a winter-deciduous broad-leaf forest. J. Veg. Sci. 2018, 29, 756–764. [Google Scholar] [CrossRef]
- Shi, Z.; Wang, J.; Sun, G.; Yao, W.; Shi, P.; Ruan, H. Application of the Montgomery Equation in morphometric analysis of Tepals: A case study of Liriodendron × sinoamericanum. Plants 2025, 14, 1861. [Google Scholar] [CrossRef] [PubMed]
- Piccolo, E.L.; Matteoli, S.; Landi, M.; Guidi, L.; Massai, R.; Remorini, D. Measurements of anthocyanin content of prunus leaves using proximal sensing spectroscopy and statistical machine learning. IEEE Trans. Instrum. Meas. 2022, 71, 2508110. [Google Scholar] [CrossRef]
- Tan, J.W.; Chang, S.W.; Abdul-Kareem, S.; Yap, H.J.; Yong, K.-T. Deep learning for plant species classification using leaf vein morphometric. IEEE/ACM Trans. Comput. Biol. Bioinform. 2018, 17, 82–90. [Google Scholar] [CrossRef] [PubMed]
- Sharma, G.; Kumar, A.; Gour, N.; Saini, A.K.; Upadhyay, A.; Kumar, A. Cognitive framework and learning paradigms of plant leaf classification using artificial neural network and support vector machine. J. Exp. Theor. Artif. Intell. 2024, 36, 585–610. [Google Scholar] [CrossRef]
- Suto, J. Plant leaf recognition with shallow and deep learning: A comprehensive study. Intell. Data Anal. 2020, 24, 1311–1328. [Google Scholar] [CrossRef]
Disclaimer/Publisher’s Note: The statements, opinions and data contained in all publications are solely those of the individual author(s) and contributor(s) and not of MDPI and/or the editor(s). MDPI and/or the editor(s) disclaim responsibility for any injury to people or property resulting from any ideas, methods, instructions or products referred to in the content. |
© 2025 by the authors. Licensee MDPI, Basel, Switzerland. This article is an open access article distributed under the terms and conditions of the Creative Commons Attribution (CC BY) license (https://creativecommons.org/licenses/by/4.0/).