Article

Integrating Species Distribution Models to Identify Overlapping Predator–Prey Conservation Priorities in Misiones, Argentina

by
Karen E. DeMatteo
1,2,*,
Delfina Sotorres
3,4,5,
Orlando M. Escalante
3,4,6,
Daiana M. Ibañez Alegre
3,4,
Pryscilha M. Delgado
3,4,
Miguel A. Rinas
7 and
Carina F. Argüelles
3,4
1
Department of Biology, Washington University in St. Louis, St. Louis, MO 63130, USA
2
WildCare Institute, Saint Louis Zoo, St. Louis, MO 63110, USA
3
Grupo de Investigación en Genética Aplicada (GIGA), Instituto Biología Subtropical—Nodo Posadas, Universidad Nacional de Misiones—CONICET, Posadas N3300NFK, Argentina
4
Departamento de Genética, Facultad de Ciencias Exactas, Químicas y Naturales, Universidad Nacional de Misiones, Posadas N3300LQH, Argentina
5
Departamento de Ecología, Genética y Evolución, Facultad de Ciencias Exactas y Naturales, Universidad de Buenos Aires, Ciudad Autónoma de Buenos Aires C1428EGA, Argentina
6
Facultad de Ciencias Exactas y Naturales y Agrimensura, Universidad Nacional del Nordeste, Corrientes W3404AAS, Argentina
7
Ministerio de Ecología y Recursos Naturales Renovables, Posadas N3301, Argentina
*
Author to whom correspondence should be addressed.
Diversity 2025, 17(11), 748; https://doi.org/10.3390/d17110748 (registering DOI)
Submission received: 25 August 2025 / Revised: 7 October 2025 / Accepted: 23 October 2025 / Published: 25 October 2025
(This article belongs to the Section Biodiversity Conservation)

Abstract

Misiones province covers < 1% of Argentina’s land area yet harbors > 50% of the country’s biodiversity, with a significant remnant of Atlantic Forest, a global biodiversity hotspot. Approximately 540,000 ha of this native forest is protected, with the remaining areas facing threats from ongoing land conversion, an expanding road network, and a growing rural population. A prior study incorporated noninvasive data on five carnivores into a multifaceted cost analysis to define the optimal location for a multispecies biological corridor, with the goal of enhancing landscape connectivity among protected areas. Subsequent analyses, with an updated framework, emphasized management strategies that balanced human–wildlife coexistence and habitat needs. Building on these efforts, our study applied ecological niche modeling to data located by conservation detection dogs, with genetics used to confirm species identity, and two land-use scenarios, to predict potential distributions of three game species—lowland tapir (Tapirus terrestris), white-lipped peccary (Tayassu pecari), and collared peccary (Pecari tajacu)—that are not only threatened by poaching, road mortality, and habitat loss but also serve as essential prey for carnivores. We assessed the suitability of unique and overlapping vegetation types, within and outside of protected areas, as well as within this multispecies corridor, identifying zones of high conservation concern that underscore the need for integrated planning of predators and prey. These results highlight that ensuring the long-term viability of wildlife across the heterogeneous land-use matrices of Misiones requires going beyond protected areas to promote functional connectivity, restore degraded habitats, and balance human–wildlife needs.

1. Introduction

The survival of apex predators in the Neotropics, such as the jaguar (Panthera onca) and puma (Puma concolor), is tightly linked to the extensive habitats they require, making them critical indicators of ecosystem health [1,2,3]. Moreover, the persistence of these carnivores depends on the availability of their prey, which includes the lowland tapir (tapir; Tapirus terrestris), white-lipped peccary (Tayassu pecari), and collared peccary (Pecari tajacu), that are highly vulnerable to deforestation, habitat fragmentation, poaching, and other anthropogenic pressures [4,5,6,7,8,9]. The threats to carnivores and their prey, including habitat loss, road mortality, human–wildlife conflict, and disease, often operate synergistically, creating a cascading effect that compromises their long-term persistence and ecosystem stability [5,6,10,11,12,13,14,15,16,17]. For instance, the absence of adequate prey can force carnivores to expand their foraging ranges into fragmented or human-dominated landscapes, thereby increasing mortality risks [9,18,19,20,21]. Even the loss of a single prey species may trigger shifts in community structure and function, including density compensation, a key aspect of ecological release, where surviving species expand their realized ecological niche and increase population densities [9,20,22,23,24,25].
The relationship between predators, prey, and habitat is complex, extending beyond the habitat use (i.e., how a species interacts or uses the environment) to its suitability (i.e., how effective an environment is at supporting a population) [26]. Predator–prey interactions have the potential to be enhanced or diminished by various physiological consequences (e.g., microclimate effects on physiological capacities) and biotic interactions (e.g., competition), with the latter considering how the physical environment (i.e., habitat) interacts with population and communities [27,28]. At a fine scale (i.e., home range), predators and prey focus on resource utilization and balancing trade-offs between resource abundance (i.e., food) and risk avoidance (i.e., safety) [29,30]. These trade-offs often differ for predators and prey. For example, while a complex habitat can provide physical refuge for prey, this same scenario can increase predation costs for predators [28,31]. However, these dynamics can shift when expanding scale to the broader landscape, with the introduction of additional factors, such as human disturbance (e.g., roads, human settlements) [29,32]. Understanding shifts in habitat suitability at different scales is fundamental to determining how ecological challenges, including climate change and land modifications, may influence the habitat-species occurrence [26,29,32]. The importance of this understanding extends to habitat restoration efforts, where successful predator–prey coexistence depends on the new environment balancing the costs and benefits of both [28].
Although large, protected areas are ideal for maintaining biodiversity, small reserves and habitat fragments can also contribute to connectivity, if appropriately located [15,16,33]. However, their effectiveness varies across species. For example, the white-lipped peccary tends to avoid heavily converted landscapes, even when forest corridors exist [34]. Ensuring functional connectivity between core habitat patches is therefore essential to support animal movement, genetic flow, and resilience in the face of increasing environmental transformation [6,17,35,36,37]. The urgency of maintaining these connections is further amplified by climate change, which may alter habitat suitability and species distributions [35,38,39,40,41].
In this context, the province of Misiones in northeastern Argentina represents both a conservation opportunity and a challenge. Specifically, although it comprises <1% of Argentina’s territory, it harbors > 50% of the country’s biodiversity and contains one of the largest remaining tracts of Atlantic Forest, a recognized global biodiversity hotspot [42,43,44,45,46]. Despite its small size, Misiones was recently declared the National Capital of Biodiversity (National Law No. 27.494), with the province designating approximately 540,000 ha of native forest as protected areas. However, these protected areas are increasingly threatened by an expanding road network (many located inside), land-use changes, and human encroachment along and outside their borders. To address this, the provincial government created the Green Corridor (Corredor Verde; Provincial Law XVI No 60) in 1999, encompassing about 1.1 million ha of this forest, but weak enforcement continues to leave both habitat and species vulnerable to degradation [13,47,48,49,50,51]. To reverse these trends, DeMatteo et al. [52] modeled a multispecies biological corridor (~400,000 ha) that connected key protected areas in the northern-central (N-C) zone of Misiones by incorporating the spatial needs of five carnivore species: jaguar, puma, ocelot (Leopardus pardalis), southern tiger cat (Leopardus guttulus), and bush dog (Speothos venaticus). Unlike single-species models, multispecies corridors account for diverse ecological requirements and offer broader conservation utility [36,53,54,55,56,57]. Later work by DeMatteo et al. [58] provided management strategies to mitigate human–wildlife conflicts and prioritize areas for protection and restoration, but prey distribution was not integrated into these models.
Our study aimed to fill this gap by generating ecological niche models (ENMs) for three prey species—tapir, white-lipped peccary, and collared peccary—whose ecological roles as seed dispersers, vegetation regulators, and ecosystem engineers are critical to forest regeneration and biodiversity maintenance [4,5,6,7,8,9,59,60,61,62,63,64,65]. Because these models extend beyond predicting prey presence to potential areas of high species richness, it allows them to be a proxy for areas with high prey abundance and resource availability [66]. These potential distributions across the N-C region of Misiones used presence-only data located by conservation detection dogs, with genetics used to confirm species identity, and two alternative land-use layers. Subsequent threshold-defined spatial analyses were used to evaluate habitat suitability and develop management strategies (i.e., areas in need of protection and/or restoration based on importance and ecological role for the species) [31,67], as well as quantify overlaps with the previously modeled multispecies corridor [52,58]. Our results provide insight into areas where prey persistence may be compromised and inform corridor design by integrating both predator and prey spatial requirements, ultimately supporting more effective, evidence-based conservation strategies in Misiones.

2. Materials and Methods

2.1. Study Area

This study was conducted in the province of Misiones, Argentina, located in the Upper Paraná Atlantic Forest ecoregion, one of the most biologically diverse and endangered tropical forests globally [42,45,68,69] (Figure 1). This region is home to a variety of threatened or endangered vertebrates and is increasingly affected by landscape fragmentation resulting from human activities [44,45,46,47,50,69]. Misiones encompasses numerous protected areas, including the UNESCO-designated Yabotí Biosphere Reserve and one of the most significant remnants of continuous forest in the Atlantic Forest ecosystem [42,43,45,47,69].

2.2. Focal Species and Field Surveys

We selected three large-bodied Neotropical mammals—white-lipped peccary, collared peccary, and tapir—as focal species due to their ecological roles, conservation concerns, and sensitivity to habitat disturbance. These species, which are commonly hunted for subsistence and poaching, are important indicators of forest integrity [71,72,73]. All three species are listed under conservation categories by the IUCN and Argentina’s national legislation [72,73,74,75,76,77].
Data were collected during two surveys (2016 & 2018) conducted primarily during the austral winter (May–August) in Misiones, Argentina. The Ministerio de Ecología y Recursos Naturales Renovables (MEyRNR) issued all general permits related to the project in the province, as well as those related to the collection, storage, and analysis of samples from multiple provincial parks.
The 2016 surveys were completed using two detection dogs: one with three years of field experience in Argentina locating scat from three primates [78,79] and one with seven years of field experience in Argentina and the USA finding scat from five carnivores [52,58,80,81,82]. The 2018 surveys were completed with only the latter detection dog. Within Misiones, detection dogs offer a reliable sampling, even in remote or human-dominated landscapes, where camera traps are not feasible [80,81,82]. They also remove the potential bias in population sampling that could occur with the inability to deploy camera traps outside of protected areas, which would affect the breadth and scale at which data could be interpreted [16,83,84,85,86].
Survey tracks consisted of two-lane paved roads, 1–2 lane dirt roads, and a variety of established trails (e.g., machete-cut, illegal hunting, animal). The team surveyed a total of 131 unique routes and walked a total of 908.56 km [mean (SD) = 6.94 (3.71) km; range = 0.21–15.15 km per route; Figure 1], with previous studies estimating the dog covered an average distance 4–6× that walked by humans [80,87]. These surveys were spread over northern-central Misiones to determine focal species presence across the various habitats in the heterogeneous landscape of the multispecies corridor [52,58]. Most surveys (667.86 km; 73.51%) covered unique habitats, including private native forests, small-scale agriculture, monoculture plantations of pine and eucalyptus, small communities with subsistence agriculture, pastures, and human-occupied areas, with the remainder located in protected areas of native forest, with varying degrees of legal protection (Figure 1).
The training of the detection dog, swabbing of scat for genetic analysis, collection-storage of scats, and recording of field data were carried out using the same strategies optimized in previous surveys [81,82,88].

2.3. Genetic Analysis and Species Occurrence Data

Scat swabs were processed using DNA extraction protocols and genetic analyses detailed in [88], with a summary of the genetic procedures provided here. DNA was extracted from one of two independent swabs using a manual extraction method [89]. For samples that presented complications in subsequent analyses (PCR amplification), the second swab was extracted using a Qiagen (Venlo, the Netherlands) DNeasy™ DNA extraction kit following a modified protocol by Vynne et al. [90]. To confirm species identity, a 110-bp fragment (171-bp with primers) of the carnivore-specific region of mitochondrial cytochrome b gene [91], which has been shown to yield better results for degraded samples, was amplified with a modified version of the protocols, plus reagents described by Farrell et al. [91] and Miotto et al. [92]. Amplifications were performed on a Veriti Thermal Cycler System (Applied Biosystems, Waltham, MA, USA) in 25-µL volumes, with purified PCR products sequenced using the ABI (Applied Biosystems, Inc.) PRISM BigDye Terminator v3.1 Cycle Sequencing Kits and analyzed by Macrogen (Seoul, Korea) on ABI 3730 Genetic Analyzer (ABI). Sequences were edited and aligned using BioEdit Sequence Alignment Editor 7.2.6 [93] and compared with reference entries in GenBank using the Basic Local Alignment Search Tool (BLAST 2.10.0) [94] to identify sequences from Neotropical species that had high similarity and closely matched sample sequences (threshold of ≥98% match).
Of the 242 total samples collected, species identity was confirmed in 186 (76.86%; Table A1). While most samples were identified as white-lipped peccary (n = 128; 68.82%), there were 37 (19.89%) tapir and 21 (11.29%) collared peccary [88,95]. In the remaining scat swabs, species identity was not possible due to the low quantity/quality of DNA or urine contamination from animals’ scent marking on the scat. Only genetically confirmed presence points were used in the models, with data from both years (2016 & 2018) combined for each of the three species. Exact sample locations are not reported or displayed at the government’s request, as a precaution to protect these threatened and endangered game species from targeted poaching.

2.4. Modeling the Ecological Niche

We implemented the Maximum Entropy algorithm, a machine learning method, in MaxEnt 3.3.3.k [96] to model the potential distribution of each of the three game species and evaluate habitat suitability. MaxEnt was chosen for its strong performance with presence-only data and small sample size [97], as it has been reported to perform consistently better than other algorithms [97,98,99]. Models were fit using auto features and default parameters for regularization multiplier (1), convergence threshold (1.0 × 10⁻⁵), and background points (10,000) [100,101,102]. For each species, models were tested randomly, withholding 25% of presence localities and running 15 subsample replicates, with the average output used for interpretation [103]. We generated a logistic output, which gives the probability of species presence on a scale of 0 to 1 and has been shown to improve model performance via model calibration of output values and corresponding suitability [100].
Applying threshold or ‘cutoff’ values to the logistic output of MaxEnt enables it to be converted into predictions that allow habitat suitability to be evaluated, with habitat categories defined as suitable (high probability of species’ presence) or unsuitable. Ecologically, values equal to or greater than the defined threshold value can be interpreted to contain cells that are predicted to be at least as suitable as those where the species was identified present. We compared the extrinsic omission rate and proportional predicted area (proxy for commission rate) at several logistic thresholds [e.g., minimum training presence (MTP), fixed cumulative value 1 (FCV1)] [100,104,105], with our criteria to have an omission rate of zero but set lower restrictions on the size of the potential predicted area. Second, the total suitable habitat for each species was subdivided into marginal and optimal habitats using the maximum training sensitivity plus specificity (MTSS), a threshold noted to be most appropriate at defining optimal habitats in presence-only models [104,106,107]. This threshold approach allows for a direct inference of habitat suitability, which allows for areas to be defined based on their importance and ecological role for species [31,67]. Ecologically, a marginal habitat corresponds to values equal to or greater than the binary threshold but less than the MTSS threshold. In contrast, optimal habitat corresponds to values greater than the MTSS threshold.

2.5. Predictor Variables for the Ecological Niche Model (ENM)

We compared two data sets that have a strong fit to the years of data collection (2016 & 2018), which effectively capture forest loss and land conversion across the landscape (Figure 1). Model 1 used a land use derived from a mosaic of Landsat-8 TM (Thematic Mapper) satellite images from 2015 [43]. Model 2 utilized a land use derived from automated classification of satellite images from 2018 [70]. Both layers were used to ensure that the inconsistencies in how intact or altered habitats are defined in the highly heterogeneous habitat outside of protected areas, as found in DeMatteo et al. [58], do not affect comparability in the final model results. Any discrepancy between the two models seems to be an artifact of how the pixels are defined versus an actual shift in habitat quality (e.g., intact versus altered), with the heterogeneous landscape outside of protected areas difficult to distinguish, with a mix of habitats in proximity and intermixed with each other, resulting in comparable results where the definition of intact or altered is consistent even if the define type of habitat varies [58]. Information directly related to road (frequency or distance) was not included in either model, as we believed these data would skew the model since a large portion of sample locations were closely associated with them.
Using ArcGIS Pro (Version 3.3; ESRI Inc., Redlands, CA, USA), a neighborhood analysis, with neighborhood scale set equal to a species-specific home range, was conducted by applying a focal statistic frequency operation to calculate the frequency (i.e., %) of each predictor variable in each land use layer at a 30 m × 30 m resolution (Table 1). The landscape heterogeneity index is based on the Shannon–Wiener diversity index of habitat type diversity, where higher heterogeneity values represent strongly anthropogenic landscapes (i.e., a significant number of human-modified landscapes in a small area) [108]. A neighborhood scale of 96 cells × 96 cells was used to represent a home range of approximately 8 km2 (8.31 km2) for the tapir, the average value determined by Medici et al. [109], a comprehensive study for tapir across three Brazilian ecosystems, including several habitat types, a breadth of individuals, and substantial duration of monitoring. A neighborhood scale of 145 cells × 145 cells was used to represent a home range of approximately 19 km2 (18.92 km2) for the white-lipped peccary, a value determined from a long-term radio telemetry study in fragment of the Atlantic Forest in Brazil [110], which was similar to limited studies in continuous forest [111,112]. In comparison, a neighborhood scale of 49 cells × 49 cells was used to represent a home range of approximately 2 km2 (2.16 km2) for the collared peccary [113], which represents the average value determined from an extended study using radio telemetry to evaluate seasonal variation in the rain forest of French Guiana. For peccary, both values are conservative compared to some studies but equal to values found in fragmented and continuous forests like those present in Misiones, Argentina. With all three species, the aim was to adopt a conservative approach, which was believed to provide a more accurate measure given the scale of these analyses.
The initial species-specific ENMs were run with all defined predictor variables, 12 in Model 1 and 11 in Model 2 (Table 1). Evaluation of jackknife tests of variable importance and response curves for individual variables eliminated select variables from each final model, due to either no effect or a negative effect on model performance. Both models eliminated wetlands and areas with no vegetation or naturally bare ground. Model 1 also eliminated pastures and water bodies (natural and artificial). This evaluation used the regularized training gain and test gain generated by MaxEnt, which accounts for dependency among predictor variables and compares the effect of a specific feature by itself, with a model of all features except that single feature. Efficacy of the selected predictor variables was evaluated by MaxEnt jackknife tests using test gain and area under the ROC curve (AUC) on test data, with the latter providing a threshold-independent measure of overall model accuracy [114].

2.6. Potential Species Richness (PSR)

The PSR, which is obtained by combining the three species-specific ENMs, as defined by the species-specific binary logistic threshold of suitable and unsuitable habitat, identifies areas where none (value = 0) or all (value = 3) of the species overlap in habitat defined as suitable [115]. PSR highlights areas where multiple species have suitable habitat and quantifies the number of species. This degree of overlap is used as an additional method to confirm range-restricted species and identify areas where habitat restoration could result in increased PSR. This PSR was also compared with the upper levels of PSR for carnivores (3–5 and 4–5 species; DeMatteo et al. [58]) across the N-C zone of Misiones, as well as within the DeMatteo et al. [52] multispecies corridor, to evaluate their degree of overlap across this heterogeneous and unprotected landscape.

2.7. Identification of Regions in Need of Management Strategies

The three species-specific ENMs with suitable areas defined as marginal and optimal were combined to generate a PSR, which identified areas in need of management strategies for these three species, specifically determining which areas required restoration, protection, or a combined approach. To simplify the analyses and interpretation, game species data were grouped into five classes: 0 species or unsuitable habitat, 1–2 species with marginal habitat in need of restoration, 1–2 species with optimal habitat in need of restoration and protection, 2 species with optimal habitat in need of protection, and 3 species with optimal habitat in need of protection. The overlap of these refined levels of marginal and optimal suitability was compared to the DeMatteo et al. [52] multispecies corridor and its ‘connectors’, which were those areas (26.02%) identified as threatening connectivity across the N-C zone due to their low levels in carnivore PSR and habitat integrity.

3. Results

3.1. Model Performance

Both models demonstrated high discriminatory power with AUC values indicating high accuracy in discriminating areas of species presence and absence [116]. In Model 1, the AUC values were ≥0.90 for test data from tapir [0.96 ± 0.04 (SD)] and white-lipped peccary (0.90 ± 0.02), with the collared peccary ≥ 0.85 for test data (0.85 ± 0.09). In Model 2, all AUC values were ≥0.90 for test data [tapir = 0.95 ± 0.04 (SD), white-lipped peccary = 0.95 ± 0.01, and collared peccary = 0.90 ± 0.05].

3.2. Predicted Habitat Suitability and Habitat Quality

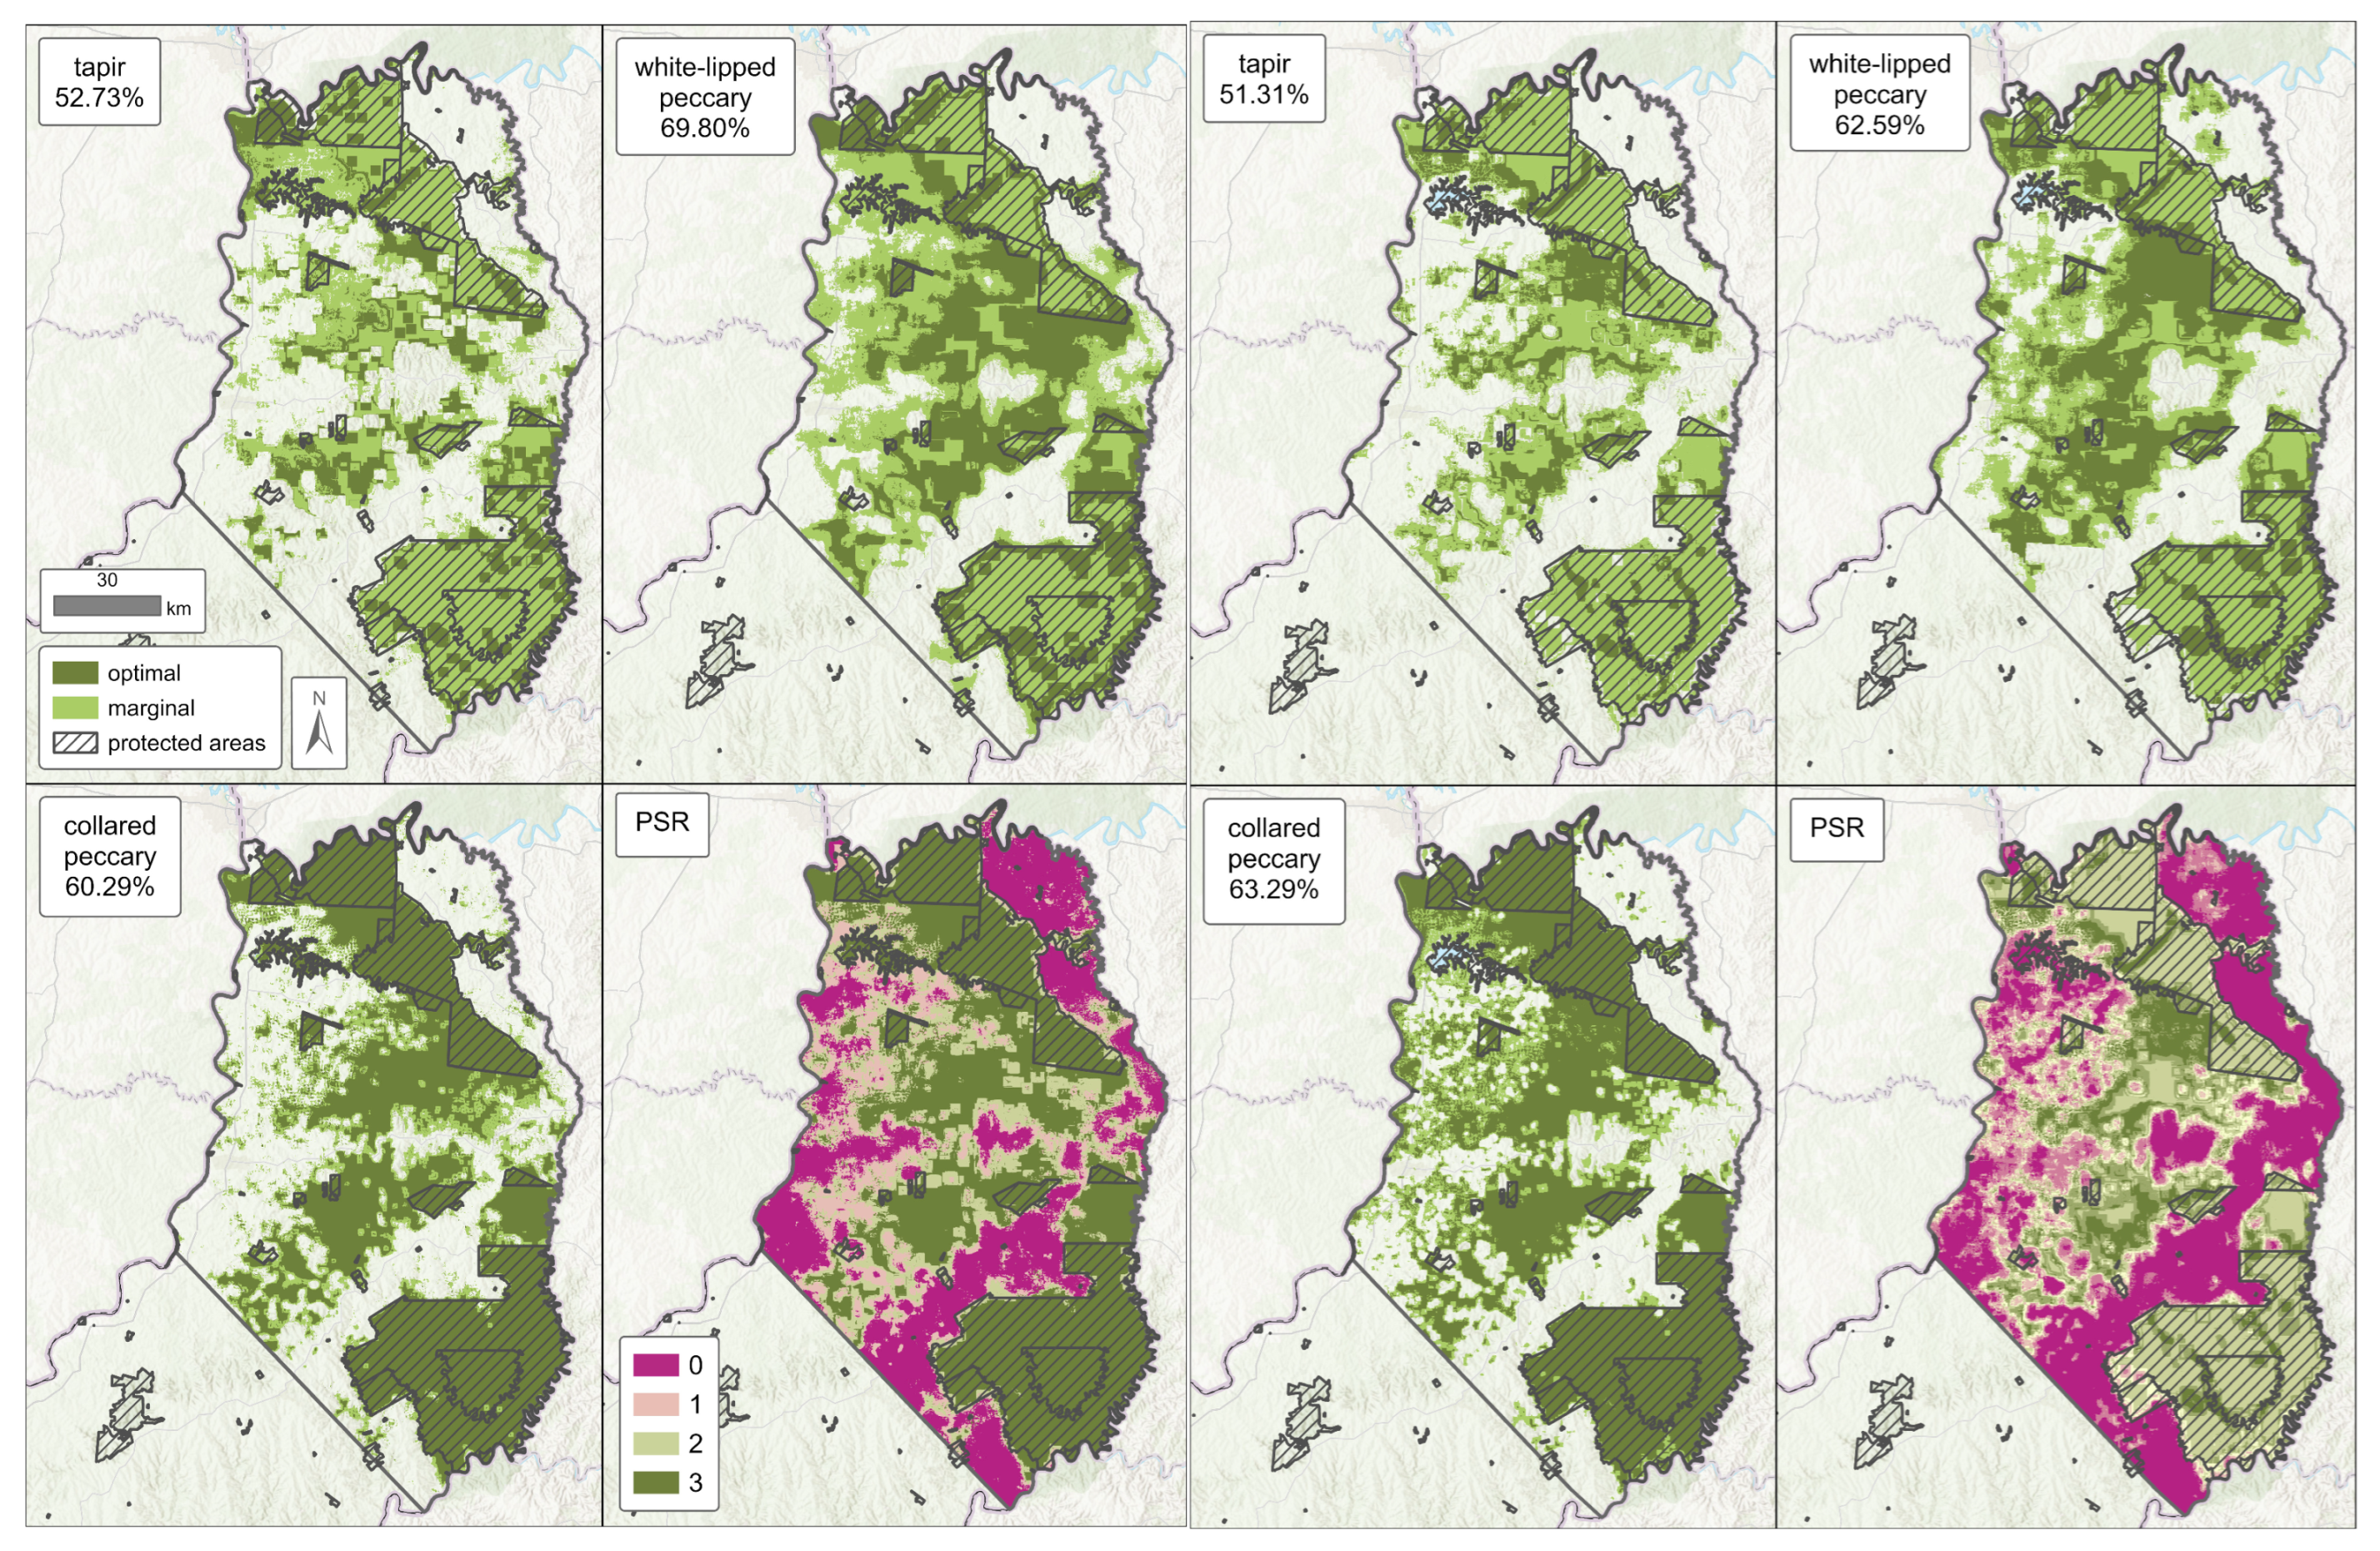
Models were converted to a binary prediction of suitable and unsuitable habitat (Figure 2). In Model 1, FCV1 best fits the defined threshold criteria for tapir (0.0055), white-lipped peccary (0.0189), and collared peccary (0.0407). In Model 2, the results were similar, with FCV1 having the best fit for the defined threshold criteria for tapir (0.0131), white-lipped peccary (0.0183), and collared peccary (0.0735). While MTP also fit the criteria, FCV1 was determined to be the more conservative choice in both models, which was considered the better choice because it identified the maximum potential areas possible, while still maintaining a zero-omission rate for both training and test data.
When binary threshold values were assigned to habitat suitability and the area restricted to the N-C zone of Misiones (i.e., where the surveys occurred), the tapir was identified as the most restricted species (Table 2). While there was a difference between the models, Model 1 (52.73%) had a higher total area of habitat defined as suitable for the tapir compared to Model 2 (51.31%); this difference was minimal (1.42%) (Table 2). In the white-lipped peccary, this pattern of Model 2 (62.59%) having a lower proportion of suitable habitat than Model 1 (69.80%) was more pronounced (7.21%) (Table 2). Unlike the other game species, the collared peccary had higher values in Model 2 (63.29%) compared to Model 1 (60.29%), with a slight difference between the two models (3.00%) (Table 2). When these values were averaged across the three game species, the proportion of suitable habitat in Model 1 (60.94%) was only slightly higher (1.88%) than Model 2 (59.06%) (Table 2).
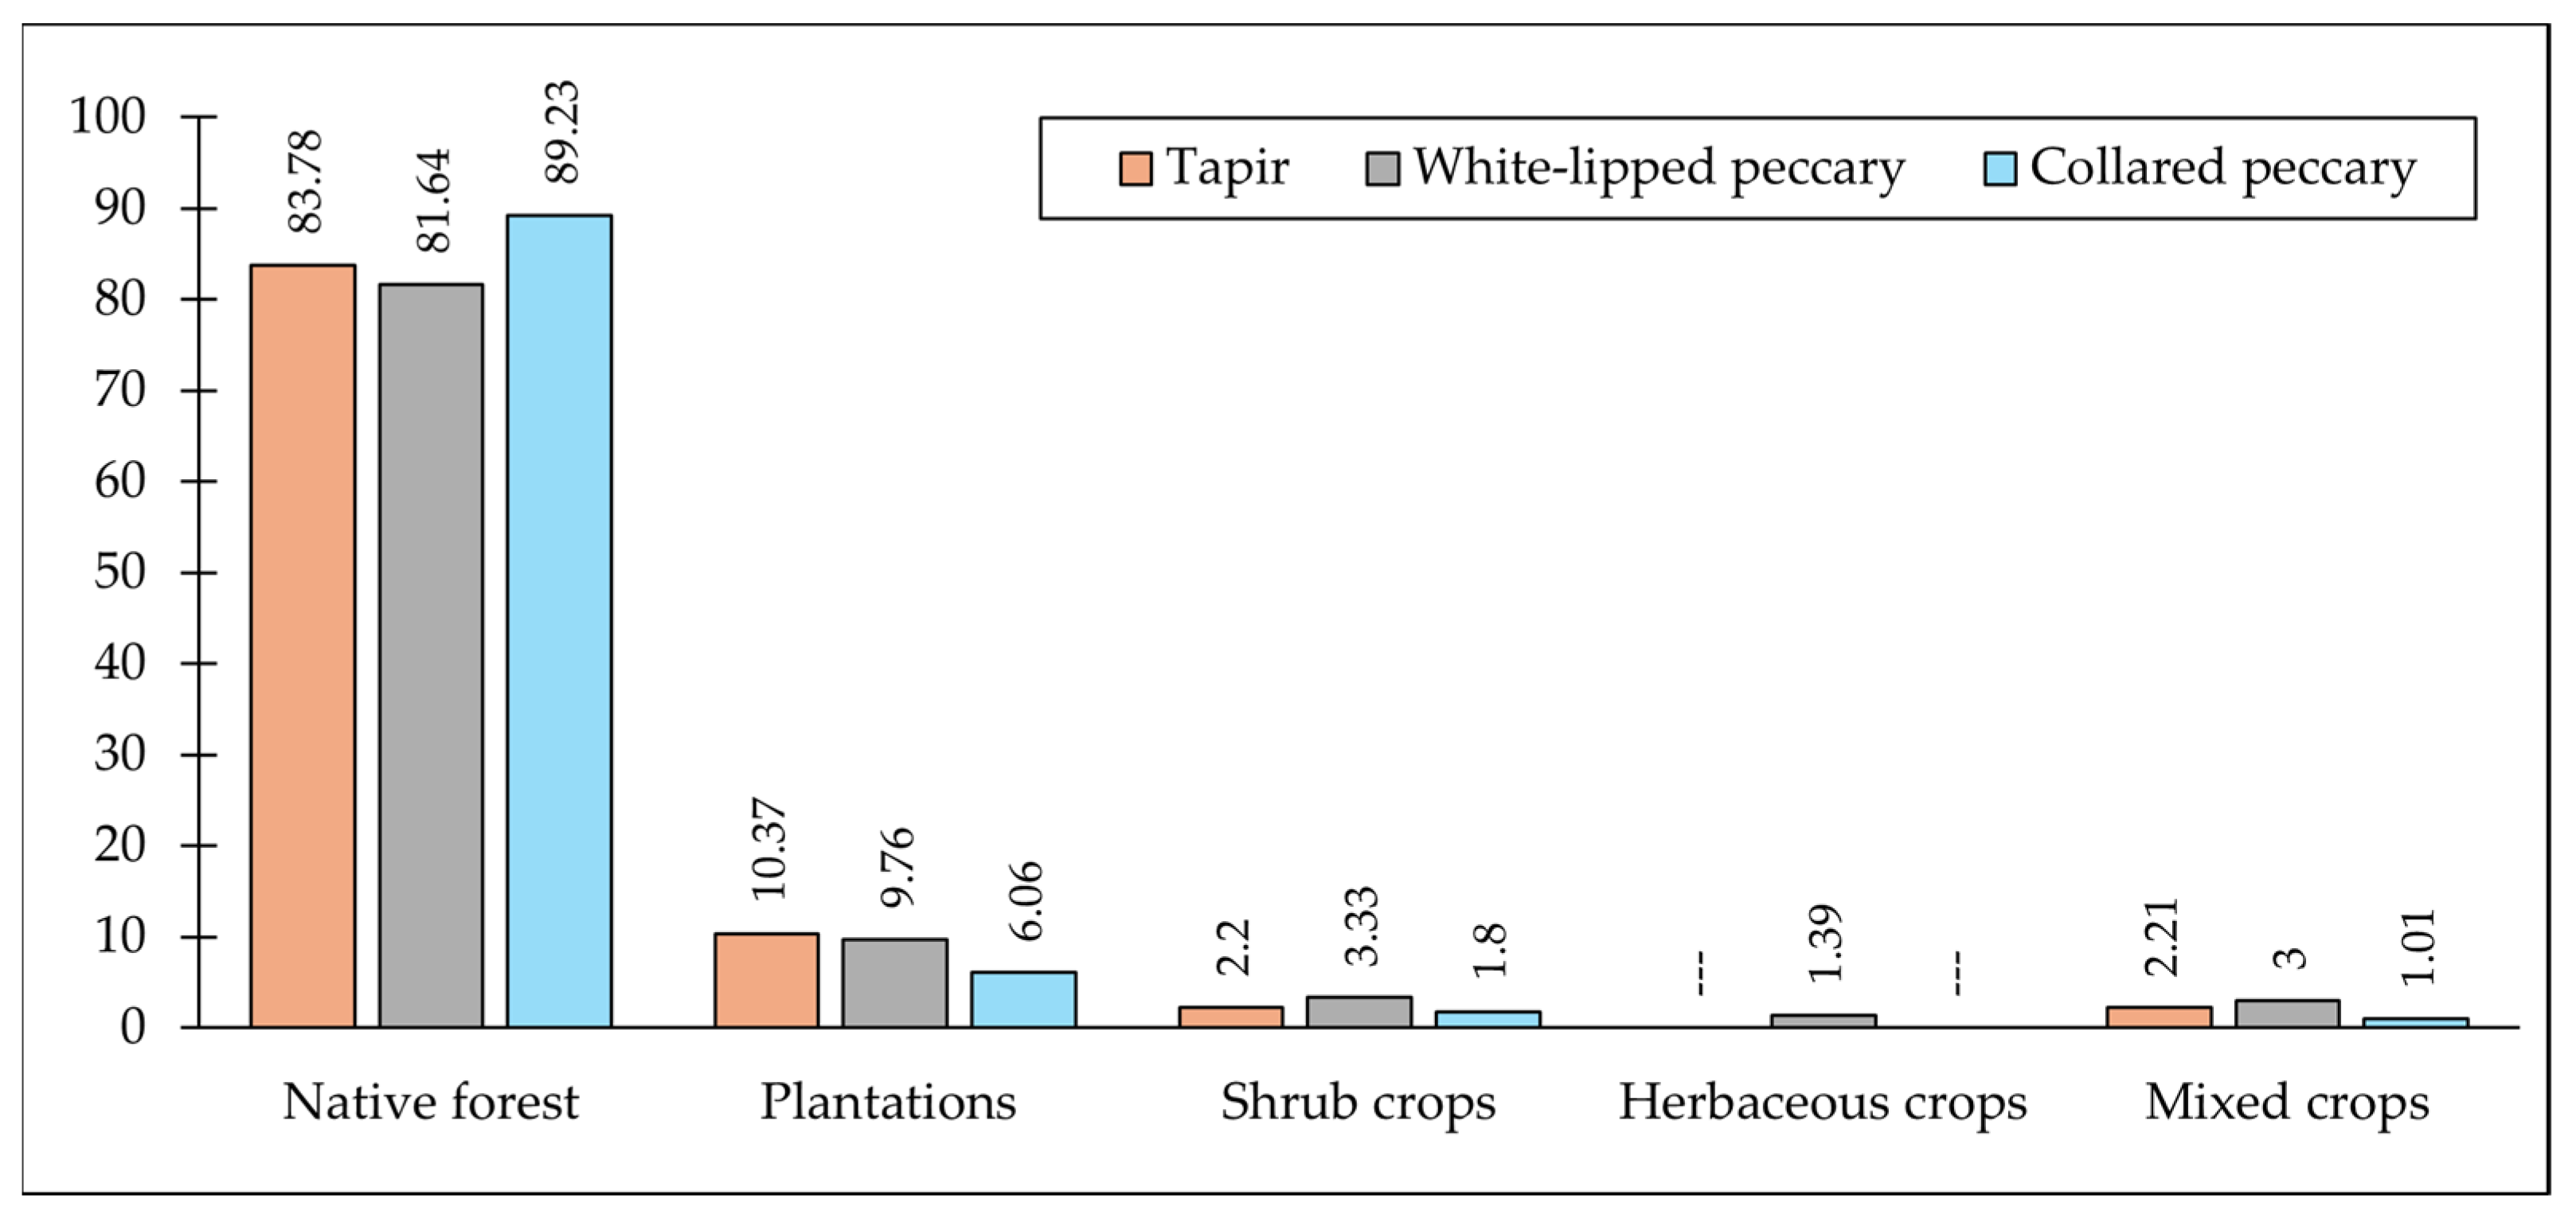
Despite this range in the proportion of suitable habitat among the three game species in Model 1 (range = 52.73–69.80%) and Model 2 (range = 51.31–63.29%), all had relatively high proportions of forest in their potential distributions, with relatively small spread or difference between the two models (7.59% and 5.90%, respectively) (Figure 3). In both models, tapir and collared peccary had the highest proportions of forest, with slightly lower levels in white-lipped peccary. Forest plantations were the most modified habitat among all three species, with each having lower levels of habitat modified by crops and mixed use (Figure 3). Breaking down these proportions of suitable habitat into those located outside protected areas provides insight into their sensitivity to ongoing landscape changes (Table 2). The average proportion across all three species showed slight variation, with very little difference between the two models (47.51% and 46.64%, respectively). The proportion of suitable area outside protected areas varied between the white-lipped peccary and collared peccary models, with the tapir having similar values in both models (Table 2). The tapir had the lowest proportions of suitable habitat outside of protected areas (37.91% and 37.11%, respectively). In comparison, the white-lipped peccary and collared peccary had higher proportions of suitable habitat outside of protected areas (>50%), except for the collared peccary in Model 1 (45.55%).
When these binary thresholds of suitable habitat were further subdivided into marginal and optimal habitat (Figure 2; Table 2), the tapir (36.17% and 38.15%, respectively) and white-lipped peccary (40.85% and 37.68%, respectively) had higher proportions of marginal habitat in both models, which contrasted with the collared peccary that had higher proportions of optimal habitat in both models (46.12% and 47.21%, respectively). All three species exhibited a consistent pattern across the two models in the proportion of marginal to optimal habitat (Table 2). The patterns were similar when the marginal and optimal habitat in the N-C zone was divided into the proportion located outside of protected areas, with the tapir and white-lipped peccary having higher proportions of marginal habitat located outside of protected areas in both models. In contrast, the collared peccary had higher proportions of optimal habitat outside of protected areas (Table 2).

3.3. PSR

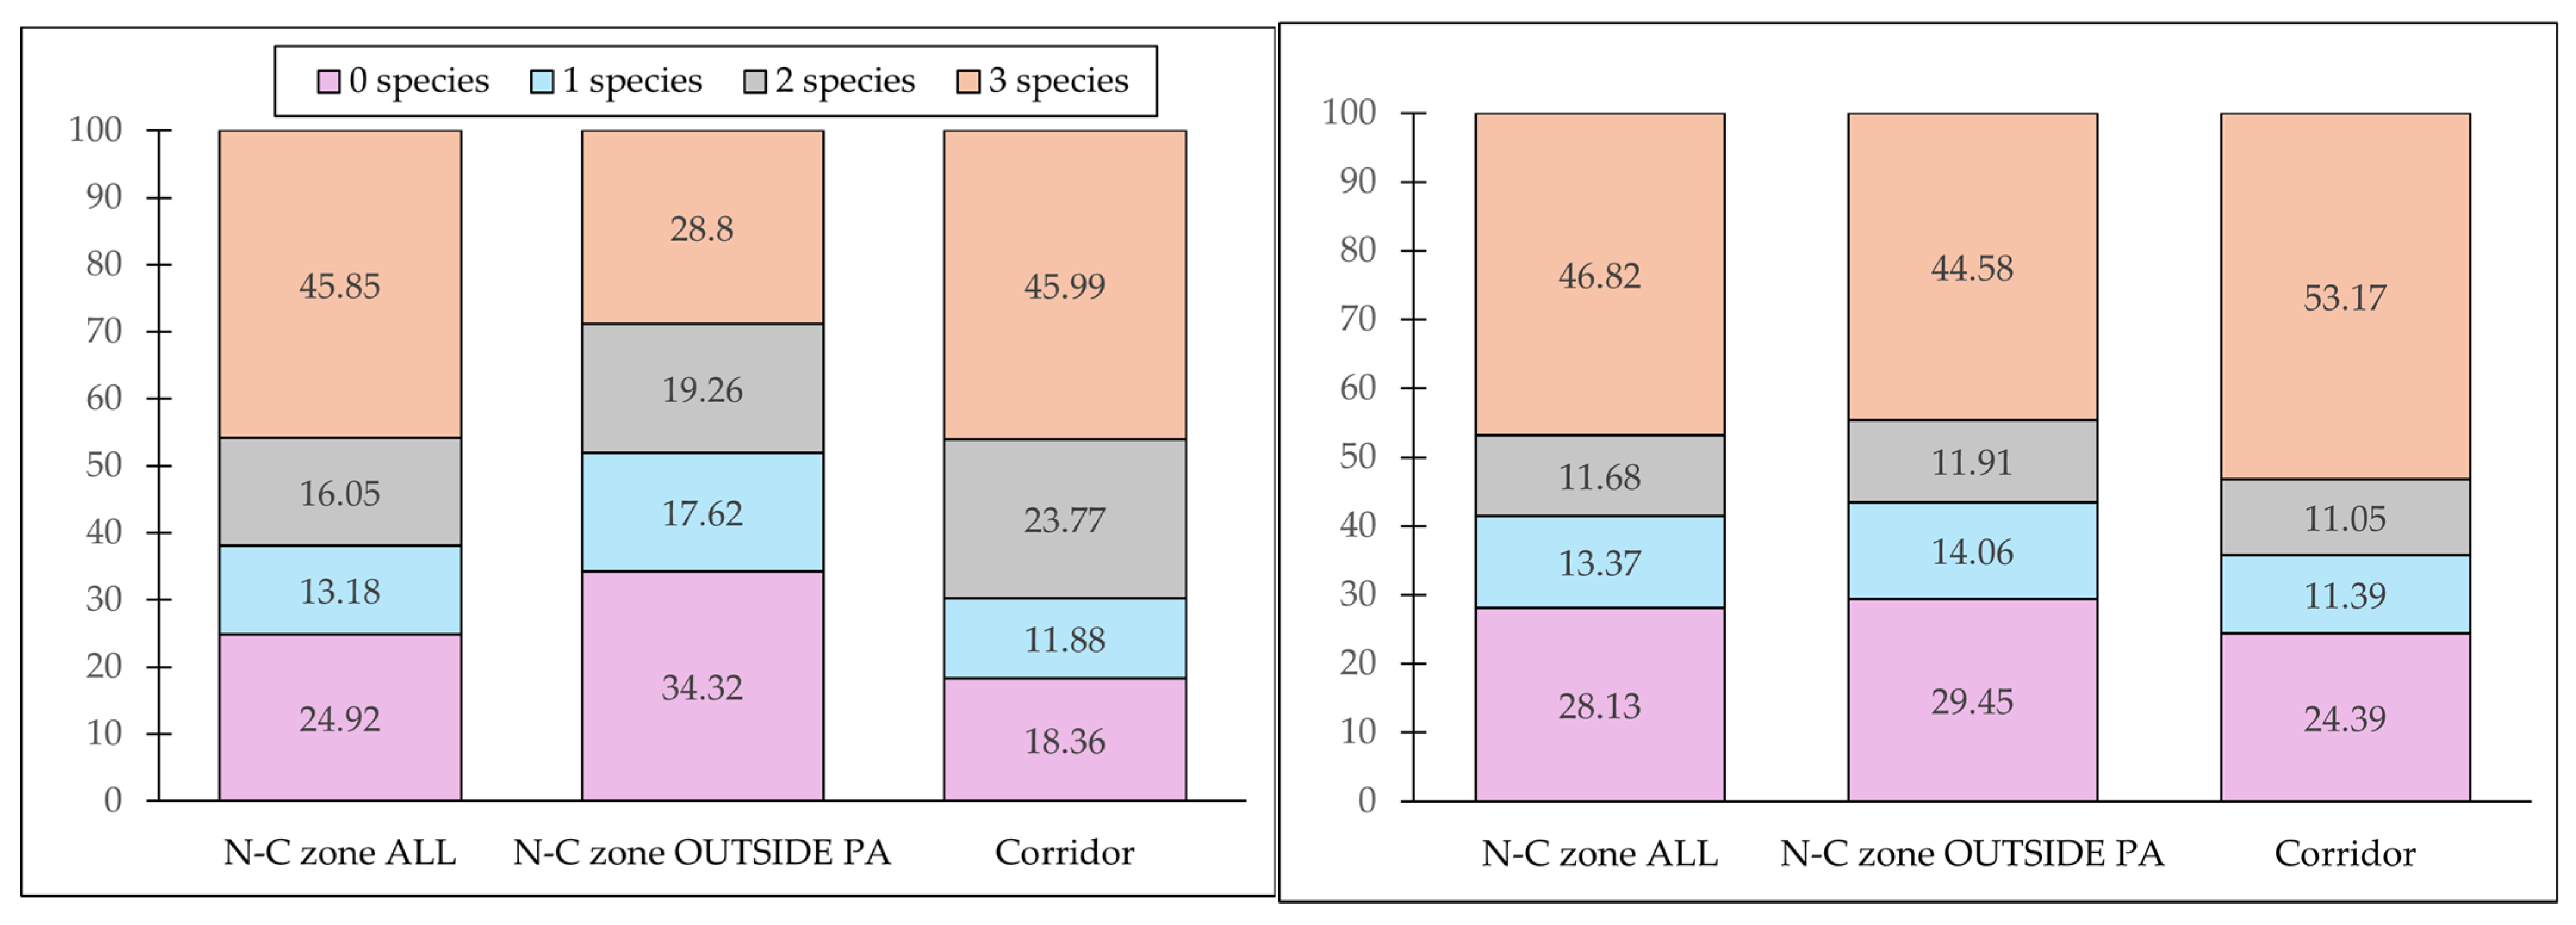
This low degree of variation among the three game species in their proportion (Table 2) and type (Figure 3) of suitable habitat can help explain the PSR or spatial overlap among species (Figure 2 and Figure 4). The three species-specific ENMs captured the overlap and unique characteristics of the three game species, as indicated by the proportion of area occupied by the highest PSR level (3 species), with Model 1 (45.85%) and Model 2 (46.82%) having similar proportions and a difference of only 1% (0.97%) (Figure 4). While Model 2 showed a similar value (44.58%) at the highest PSR level (3 species) outside of protected areas, Model 1 showed a decreased proportion of high species richness (28.80%) resulting in a pronounced difference between the two models (16.78%) (Figure 4). There was a relatively substantial overlap between the PSR of these game species and the five carnivores, with the highest PSR (3 species) of both models aligning with about half of the areas defined as suitable habitat for either 3–5 carnivores (44.63% and 44.47%, respectively) or 4–5 carnivores (43.98% and 42.05%, respectively) [58].

3.4. Comparison with DeMatteo et al. [52] Multispecies Corridor Model

The proportion of suitable habitat captured by the DeMatteo et al. [52] corridor allows insight into the risk still facing each game species, as these areas represent regions lacking formal protection, with all areas intersecting protected areas excluded from these analyses (Table 2). For the tapir, Model 2 (59.34%) had a higher proportion of suitable habitat captured by the corridor than Model 1 (51.52%) (Table 2). The opposite was the case in the white-lipped peccary (78.01% and 69.31%, respectively), with the collared peccary having little difference between the two models (67.86% and 64.36%, respectively) (Table 2). While no single species showed a dramatic difference in the proportion of suitable habitat captured by either model (range across both models = 3.5–8.7%) (Table 2), differences were observed among the species. The proportion of suitable habitat captured by the DeMatteo et al. [52] corridor was the lowest for the tapir in both models. At the same time, the white-lipped peccary had the highest proportion in both models, with a more pronounced difference between Model 1 (26.49%) and Model 2 (9.97%) (Table 2). The proportion of suitable habitat for the collared peccary in both models (67.86% and 64.36%, respectively) was similar to the levels of the white-lipped peccary in Model 2 (Table 2).
While the proportion of marginal habitat captured by the DeMatteo et al. [52] corridor was similar for the tapir and white-lipped peccary, the latter had a higher proportion of optimal habitat within the corridor, comparable to that of the collared peccary (Table 2). Within individual species, the most extensive spread, or difference, between the two models for suitable habitat in the corridor was seen in the tapir (7.82%) and white-lipped peccary (8.7%), with the collared peccary being less pronounced (3.5%) (Table 2). Across the three species, the spread, or difference, between the proportion of marginal habitat captured by the corridor was higher in Model 2 (27.10%) than in Model 1 (10.76%), with this spread less pronounced for optimal habitat in the corridor between the two models (20.76% and 25.78%, respectively) (Table 2).
There was a 7.18% difference in the proportion of the highest PSR levels (3 species) captured by the DeMatteo et al. [52] corridor between the two models (45.99% and 53.17%, respectively) (Figure 4). While the level of habitat considered suitable and captured by the corridor was consistent for the lowest PSR level (1 species), the two models differed at the other levels. Model 2 (24.39%) had a higher proportion of unsuitable habitat (0 species) compared to Model 1 (18.36%), while Model 1 (23.77%) had a higher level of habitat considered suitable at a moderate PSR level (2 species) compared to Model 2 (11.05%). There was a relatively substantial overlap between the PSR of these game species and the five carnivores within the DeMatteo et al. [52] multispecies corridor, with the highest PSR (3 species) in both models aligning with about half of the areas defined as suitable habitat for either 3–5 carnivores (45.94% and 52.16%, respectively) or 4–5 carnivores (45.60% and 51.08%, respectively).
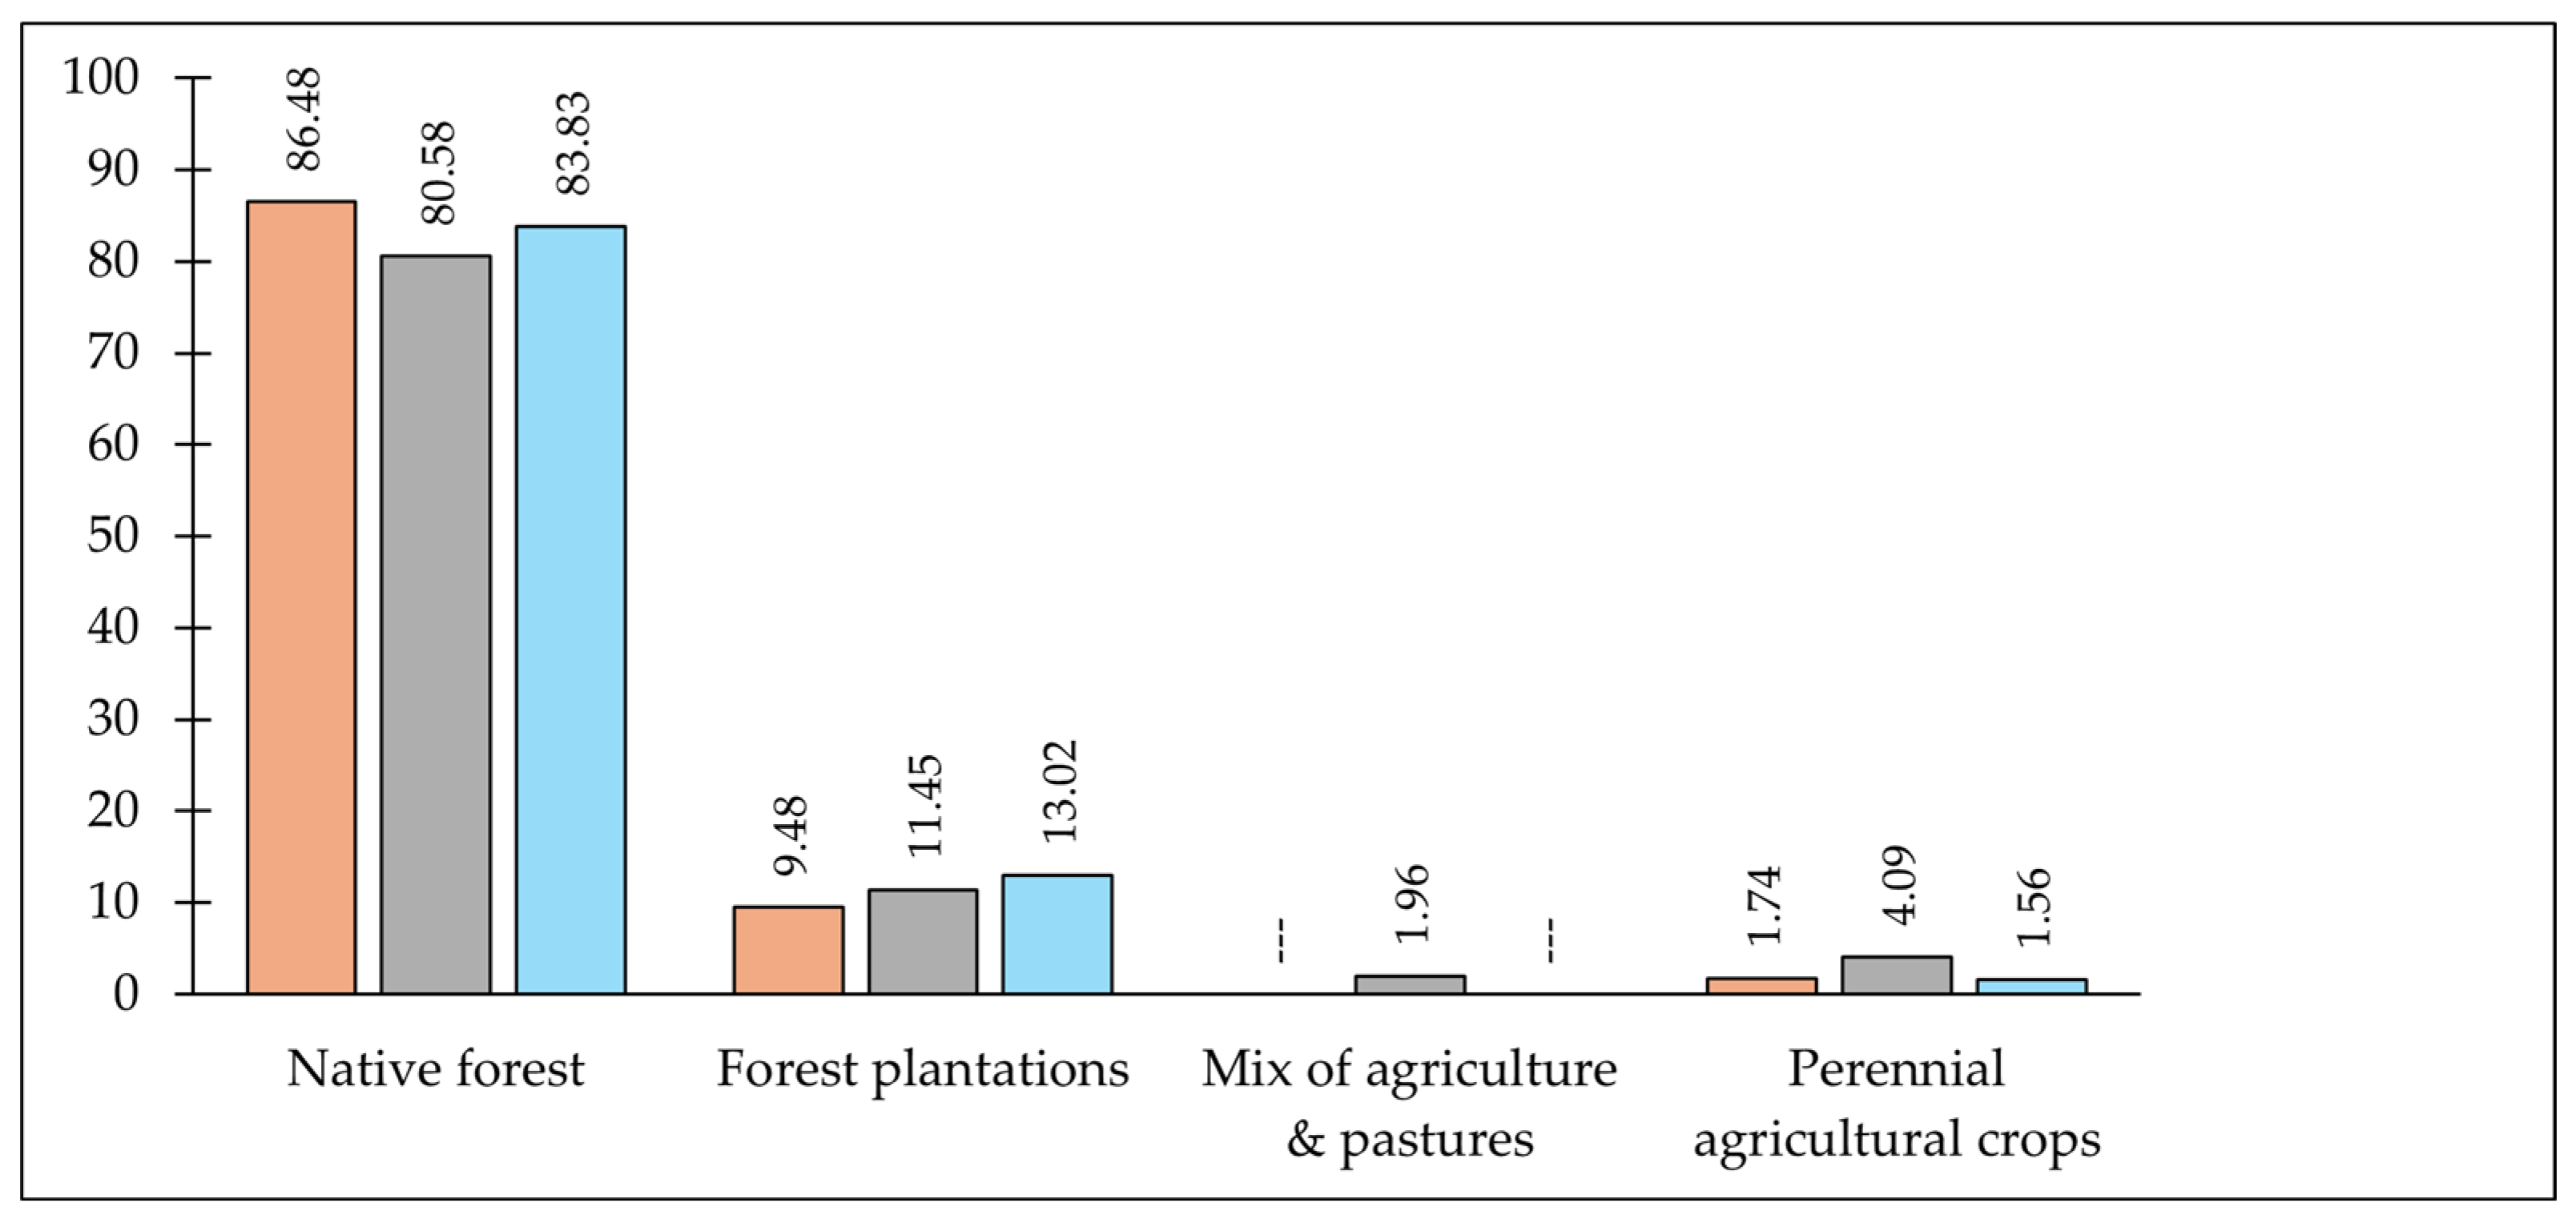
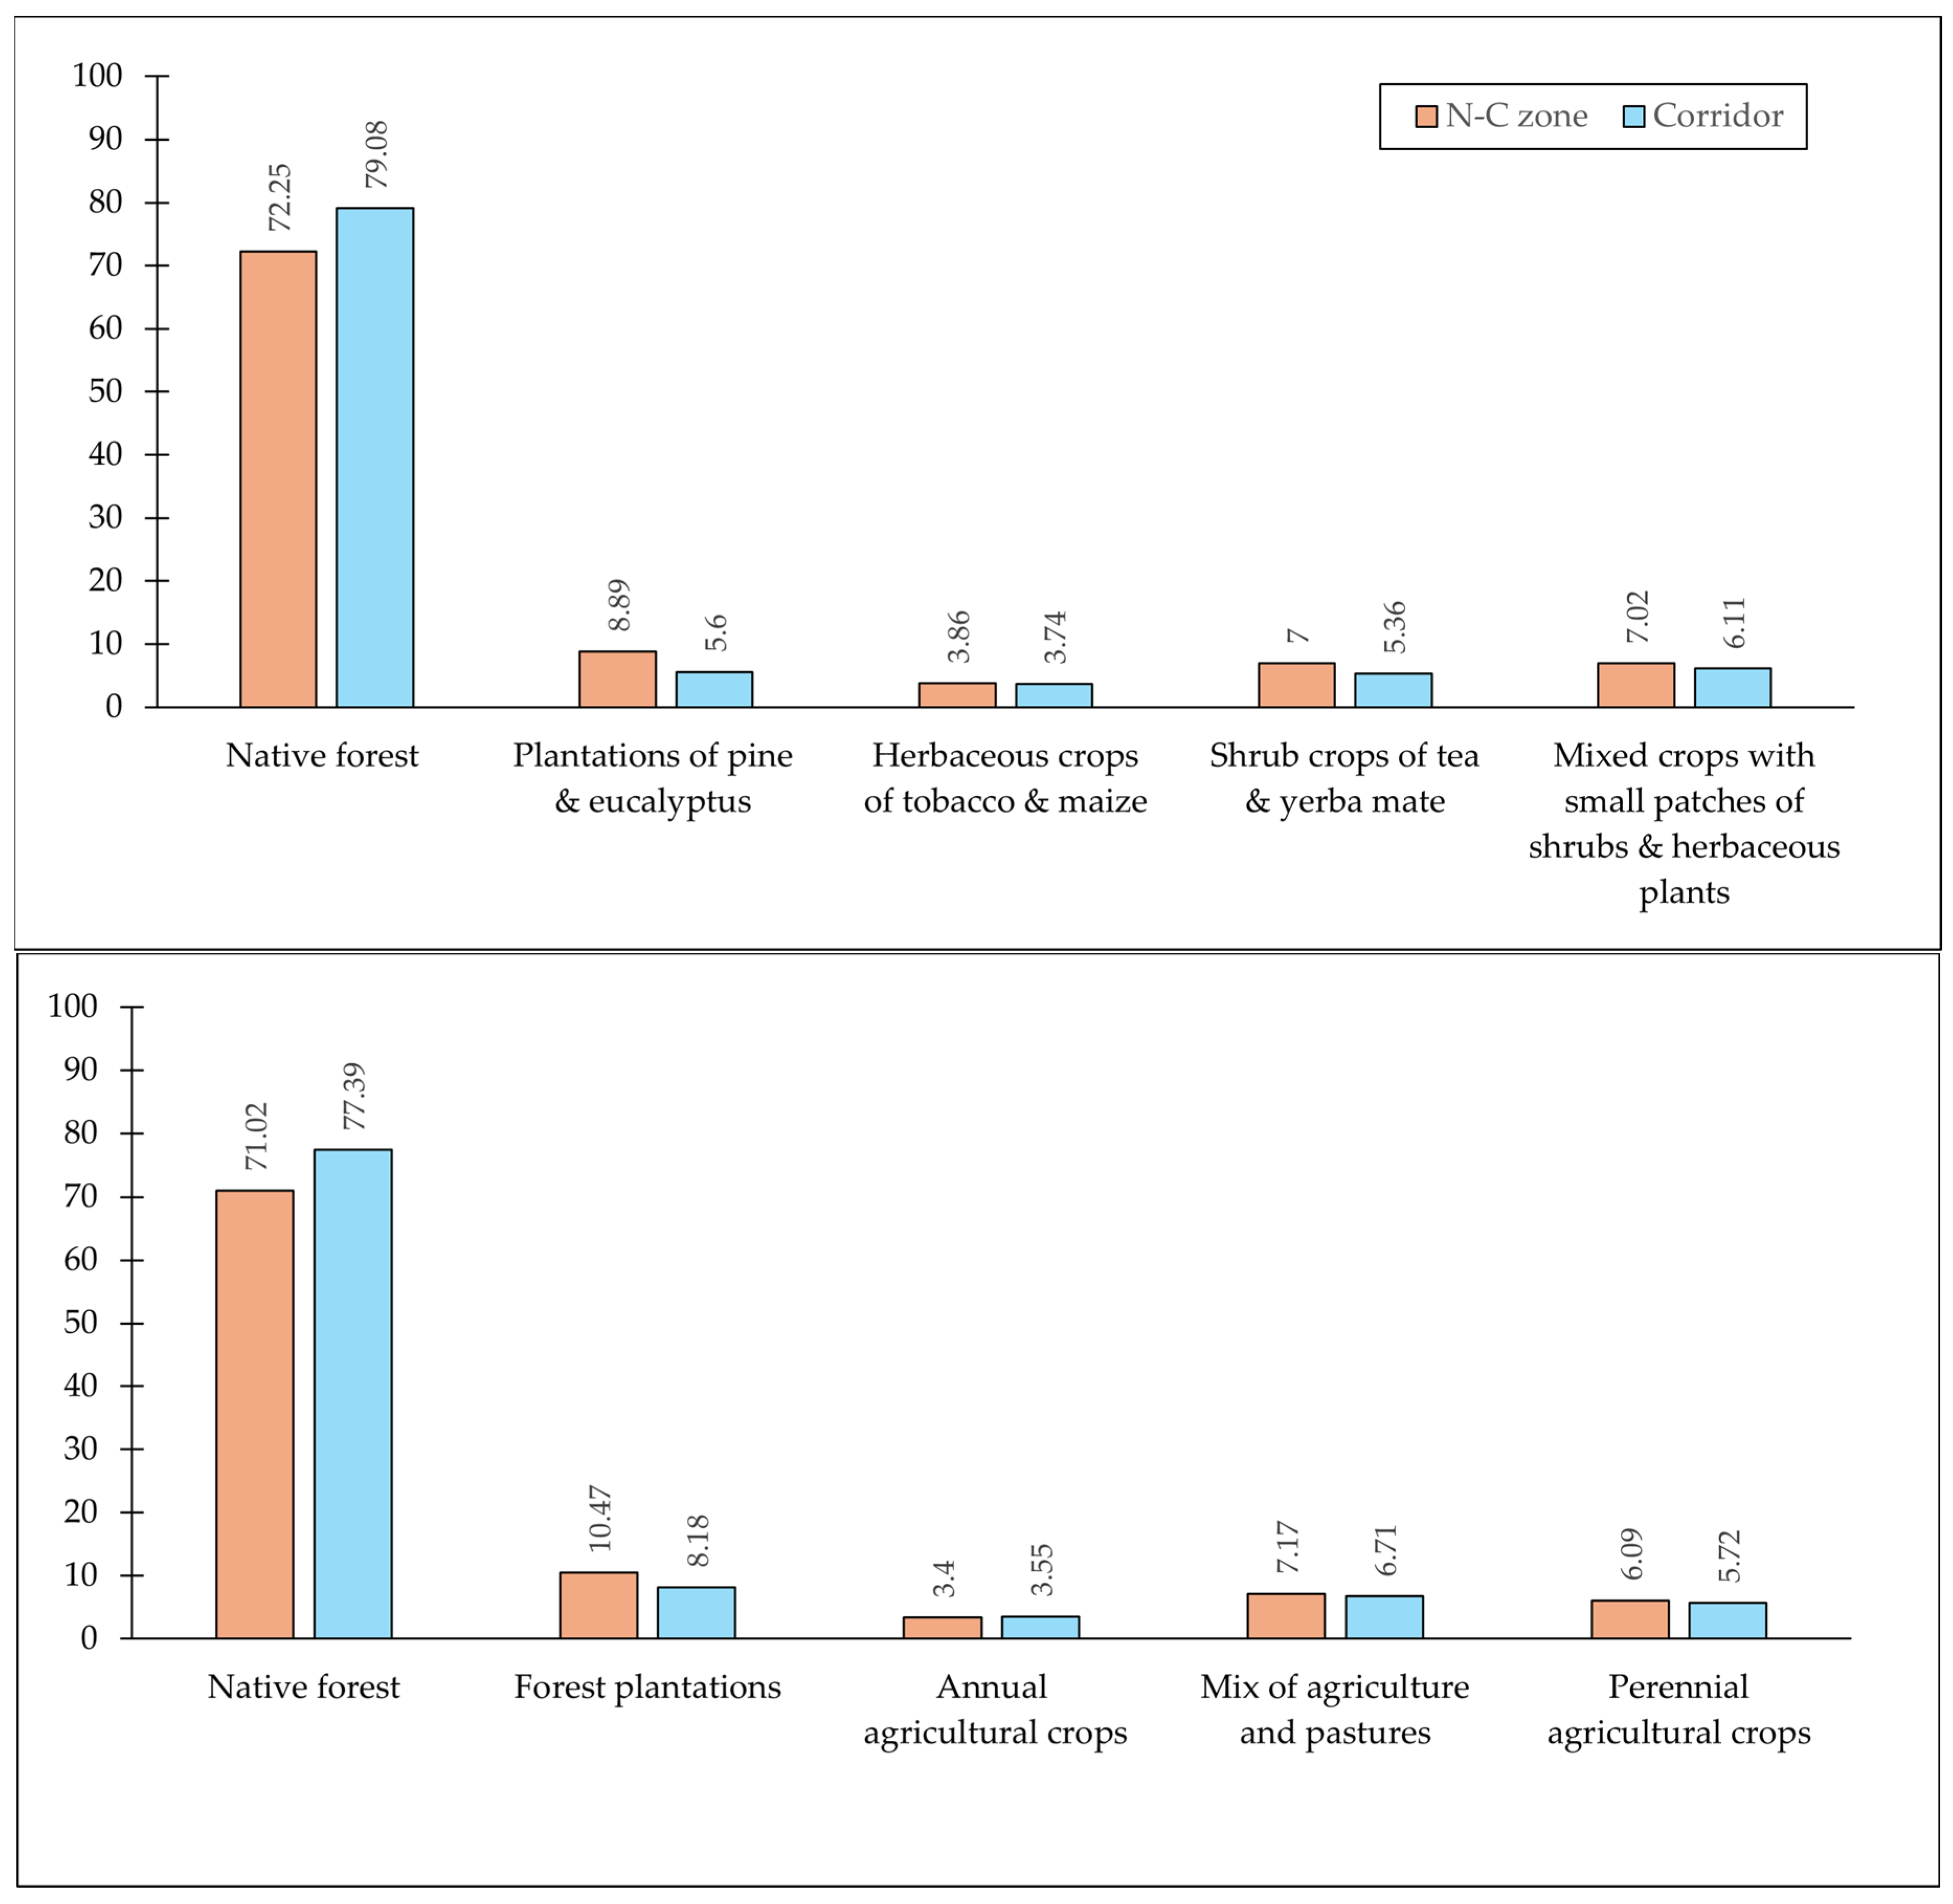
As with DeMatteo et al. [52] and DeMatteo et al. [58], both models showed higher levels of native forest (72.25% and 71.02%, respectively) versus modified habitats occupying the N-C zone (Figure 5). While the proportion of native forest occupying the corridor in both models (79.08% and 77.39%) (Figure 5) was slightly lower than the average proportion of native forest across the three ENMs in the N-C zone for both models (84.88% and 83.63%, respectively) (Figure 3), both had native forest as the most dominant habitat type. While land-use-defined categories varied according to the data used in each model, modified land-use types were grouped into four main categories: forest plantations, agriculture at different scales, pastures, and waterways.

3.5. Identification of Regions in Need of Management Strategies

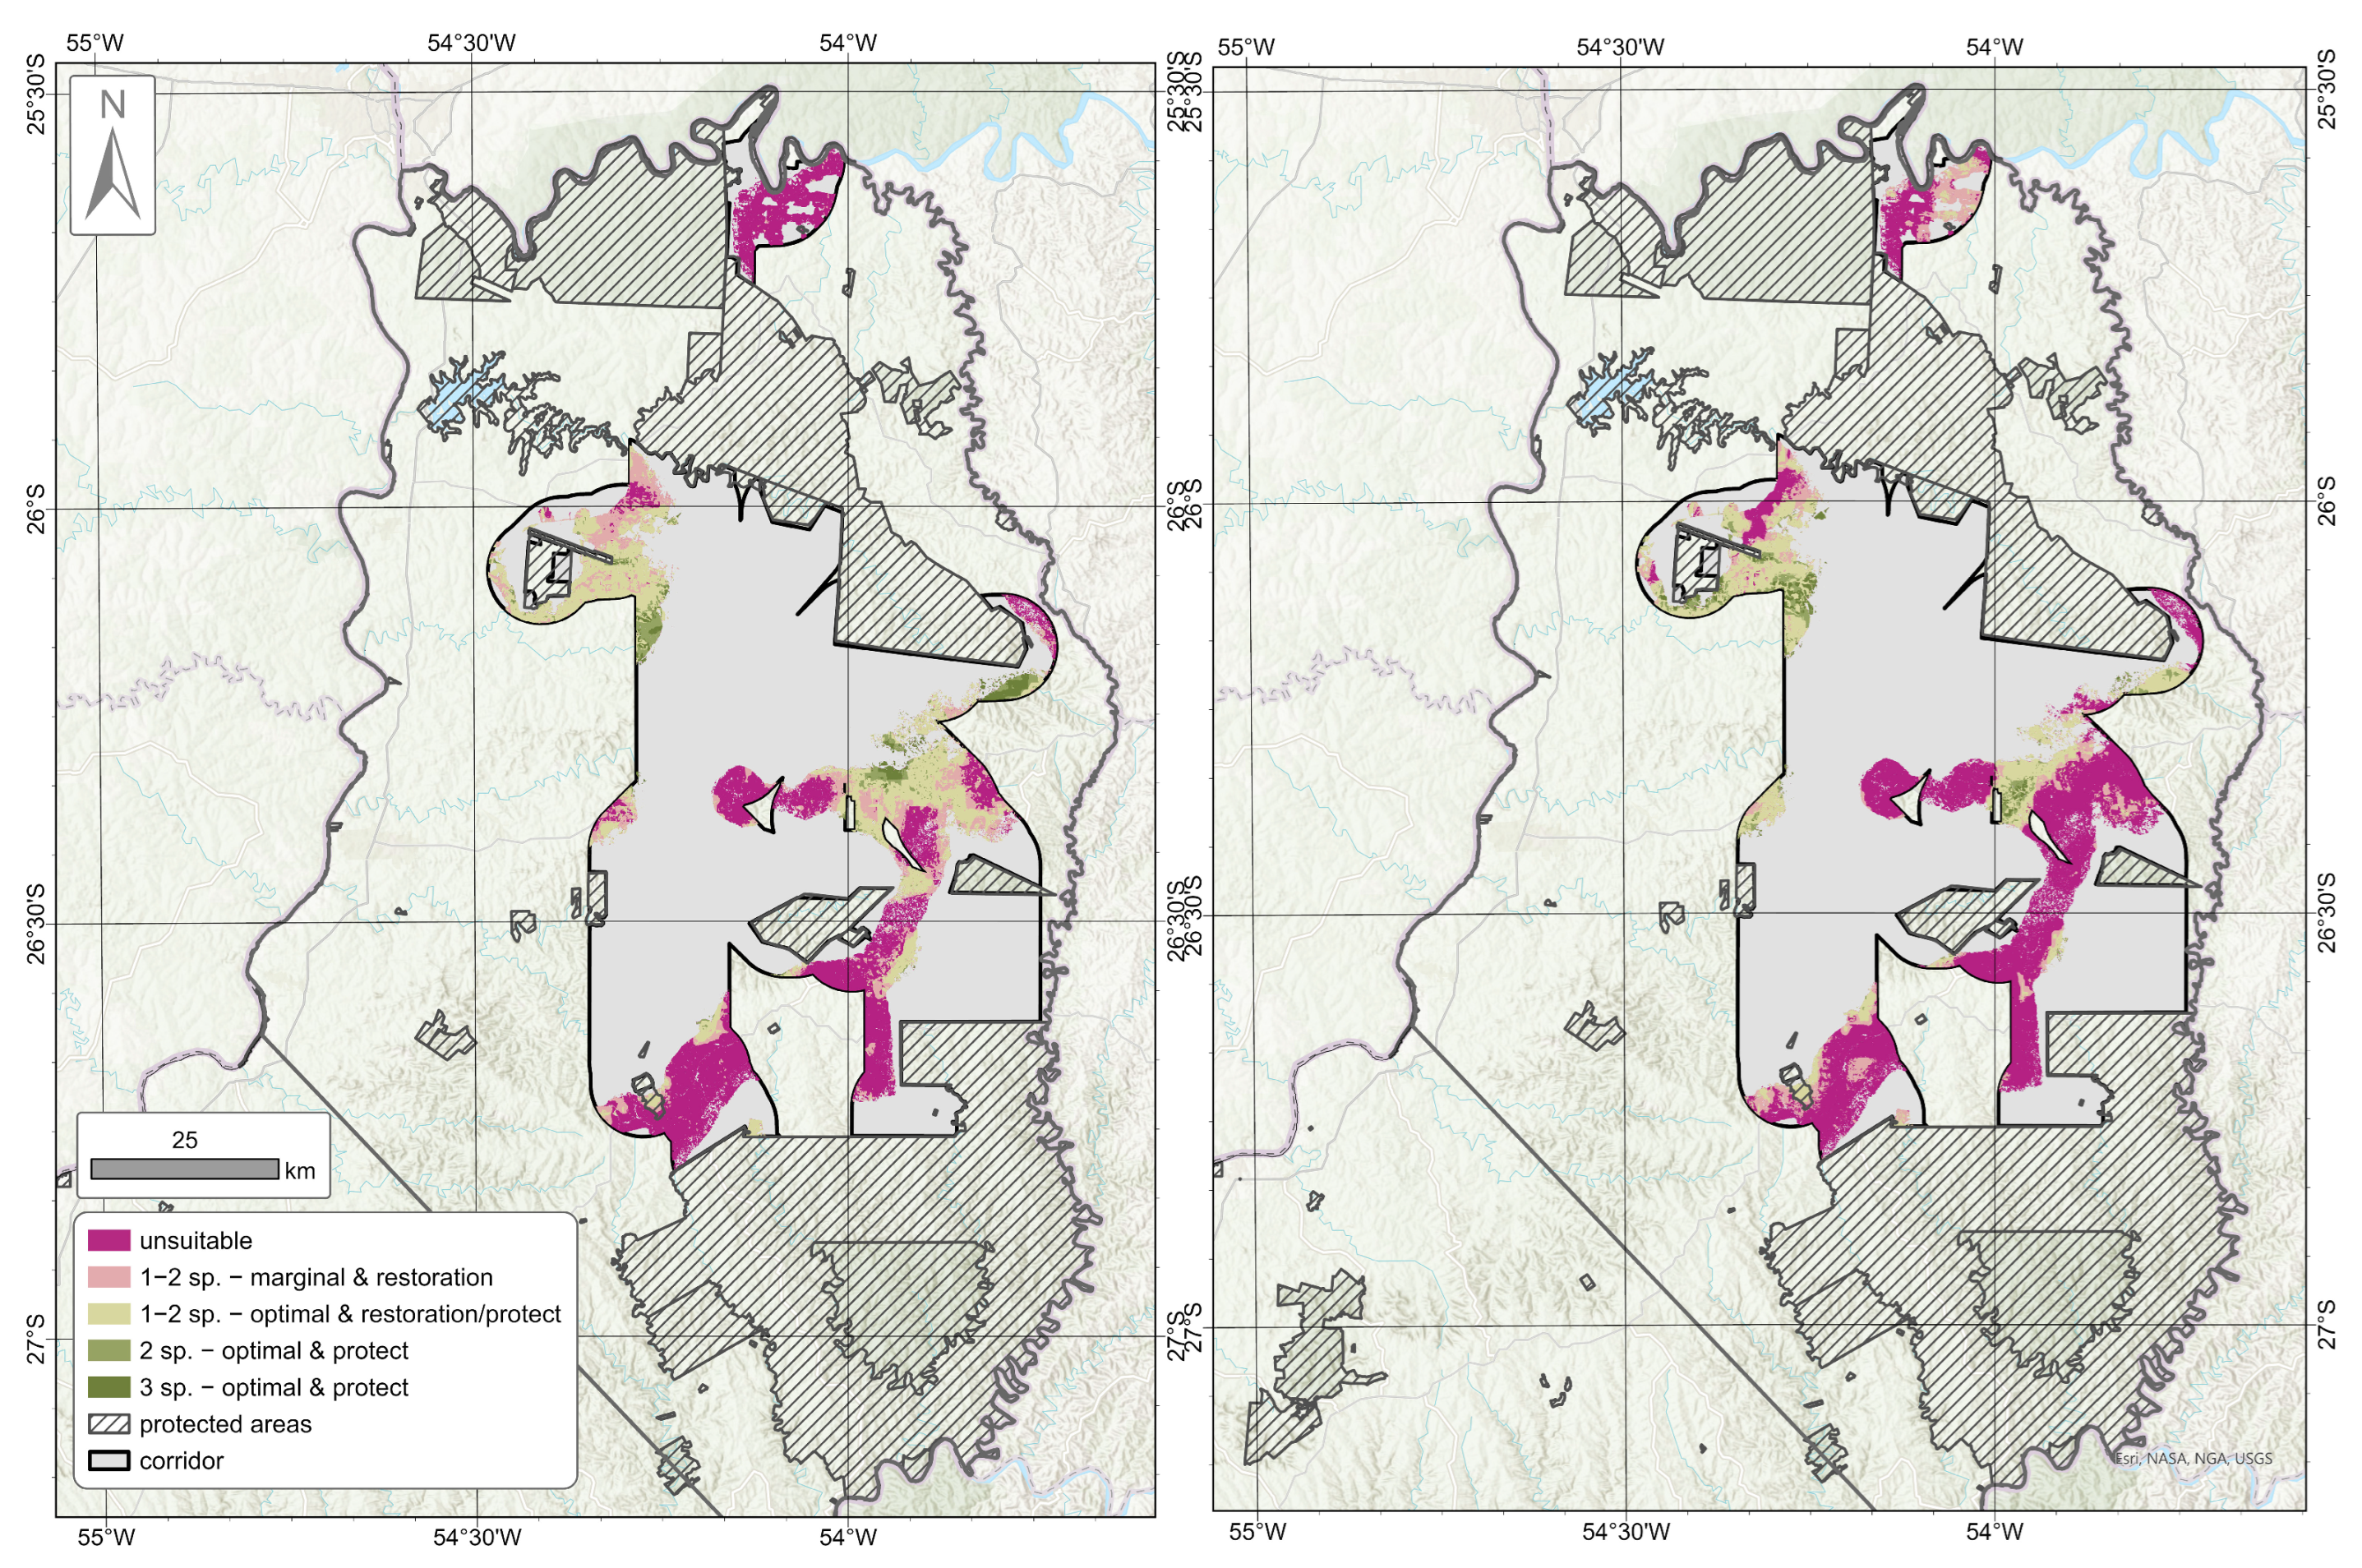
As with DeMatteo et al. [58], the areas in need of habitat restoration and/or protection were evaluated based on the levels of PSR, as defined by marginal and optimal habitat (Figure 6), which provided the ability to evaluate the quality of habitat for these overlapping species. Across the N-C zone, Model 1 and Model 2 captured comparable totals of suitable habitat (75.08% and 71.87%, respectively), with similar levels of marginal habitat (12.02% and 11.05%, respectively), optimal habitat with 1–2 species (39.06% and 38.77%, respectively), optimal habitat with 2 species (12.70% and 13.38%, respectively), and optimal habitat for 3 species (11.30% and 8.67%) (Figure 7). The optimal habitat was highest across both models for PSR levels of 1–2 species, followed by habitat defined as unsuitable. The total optimal habitat defined as suitable (1–3 species) was similar between Model 1 and Model 2 (63.06% and 60.82%, respectively) (Figure 7).
When the areas in need of habitat restoration and/or protection were narrowed to the area within the multispecies corridor from DeMatteo et al. [52], the model showed that this corridor effectively captured a high proportion of suitable habitat (marginal and optimal) for game species in Model 1 and Model 2 (81.64% and 75.61%, respectively). The area at the lower end of optimal habitat (1–2 species) was found to require habitat restoration and protection (39.49% and 32.79%, respectively), with those levels slightly higher than the area at the high end of optimal habitat (2 or 3 species) that showed in need of habitat protection (31.69% and 32.99%, respectively) (Figure 7). Unfortunately, there was a dramatic decrease in the quantity of suitable habitat captured within the connectors of the DeMatteo et al. [52] corridor in Model 1 and Model 2 (52.63% and 42.67%, respectively), with these levels dropping further for the total amount of optimal habitat captured by the connectors (35.49% and 28.48%, respectively) (Figure 7,Figure 8). Of this optimal habitat, the majority needs habitat restoration and protection (1–2 species; 29.11% and 22.73%, respectively), with <7% (6.38% and 5.75%, respectively) of high PSR (2 or 3 species), with habitat not needing restoration but in need of protection (Figure 7).

4. Discussion

This study provides the first spatially explicit assessment of habitat suitability for three ecologically essential game species, with similar but disparate sensitivities to environmental disturbance—the tapir, white-lipped peccary, and collared peccary—in the N-C zone of Misiones, Argentina. These species are not only targets of illegal hunting but also serve as critical prey for large carnivores, whose persistence depends on prey availability and landscape connectivity [117]. By integrating ENMs with two alternative land-use layers, we identified shared and species-specific patterns of suitable habitat and priority areas, as well as evaluated their alignment with the multispecies carnivore corridor proposed by DeMatteo et al. [52].

4.1. Predicted Habitat Suitability

Of the three species, the large-bodied, solitary tapir was the most restricted, with only half of the N-C zone in Misiones suitable and even lower levels when the region was restricted to outside of the protected areas. In both scenarios, the proportion of marginal versus optimal habitat was higher, suggesting potential habitat flexibility in the tapir in Misiones. This pattern aligns with its ability to adapt to using a variety of habitats, including disturbed and secondary forests, plantations, and agricultural lands [118]. However, the drop in suitability levels outside of protected areas likely reflects other findings of Flesher and Medici [118] that hunting and highways restrict the movement of this species. Therefore, even though suitable habitats may exist in other regions of N-C zone of Misiones, the tapir is likely unable to move to these areas given the ever-expanding human population in rural Misiones and the extensive network of roads that cross the region, with many intersecting protected areas and others being converted to wide, paved highways [11,13]. Consequently, even though our surveys covered a diverse breadth of habitats throughout the N-C zone, if the tapir distribution is restricted to isolated populations in specific localities, it could skew the habitats considered suitable for it in Misiones, Argentina.
In contrast, across the N-C zone of Misiones, the white-lipped peccary had the broadest distribution, with the collared peccary intermediate among the three species. While both species exhibited a similar decline outside of protected areas, they remained approximately equal to or greater than 50% suitable habitat, with the peccary at the lower end of this range. While the white-lipped peccary and tapir had more marginal than optimal habitat in the N-C zone, the collared peccary was the opposite, with more optimal than marginal habitat, a pattern that was paralleled outside of the protected areas. The differences between these two group-living species may reflect their resource partitioning on the landscape scale. Specifically, the white-lipped peccary exhibits large movements in search of abundant but dispersed food resources, whereas collared peccaries utilize dispersed resources on a smaller scale [111,119,120]. While the higher levels of marginal habitat in the white-lipped peccary could align with greater habitat flexibility, it is more likely associated with the species’ need for a larger home range in fragmented or disturbed habitat where food sources are at lower levels [7]. The need to increase levels of optimal habitat for the white-lipped peccary is essential, given that these areas appear to act as important sources for recolonization during natural population cyclicity [25].
The effect decreased levels of habitat suitability outside of protected areas has on all three species is emphasized by the increased pressures in these areas, including agricultural expansion, road proliferation, and poaching, threats widely recognized in the context of the Atlantic Forest [50]. Roads pose dual risks by fragmenting habitats and facilitating human access [11], with recent data from Misiones indicating an increase in wildlife-vehicle collisions in unmitigated stretches [13]. The white-lipped peccary is especially vulnerable due to its large range requirements and susceptibility to hunting [5], while tapir populations risk genetic isolation in fragmented habitats [6]. The collared peccary’s broader tolerance may mask population declines in more sensitive species, underscoring the importance of monitoring across multiple prey taxa.

4.2. PSR and Habitat Quality

Despite the three game species varying in their home range sizes and sociality [7,109,110,113,118,119], all showed similar habitat associations, with all primarily coupled to forested areas. Among modified or altered habitats, all three species had similar averages across both models, with higher proportions of monoculture plantations and only the white-lipped peccary having an association with two unique vegetation types (herbaceous crops or a mix of agriculture and pastures). This strong intersection of the three species at the landscape scale is reflected in our finding that almost half of the N-C zone had a complete overlap of areas considered suitable for all three species—the highest PSR. The fact that this overlap is not higher than half of the N-C zone highlights that the distribution of the three game species extends beyond habitat association and emphasizes their underlying differences in habitat flexibility and sensitivity to human disturbance [7,25,111,118,119,120,121]. This disconnect between similar habitat associations and habitat predicted to be suitable is also reflected in a visual examination of the pattern, or configuration, of the individual species distribution models for the N-C zone. Specifically, a clear pattern is evident, with the tapir exhibiting an extremely patchy and discontinuous distribution in suitable habitats, where these levels decrease in the white-lipped peccary and are substantially lower in the collared peccary. The low overlap among the three species in suitable habitat, with most shared habitat occurring in marginal zones, is a pattern also reported in carnivores [58]. These findings emphasize the need to increase internal connectivity across the N-C zone of Misiones, as well as underscore the importance of an integrated approach that includes predators and their prey when identifying conservation priorities.

4.3. Identification of Regions in Need of Management Strategies

Within the DeMatteo et al. [52] corridor, all three species showed a slightly higher average in total suitable habitat compared to the N-C zone of Misiones. However, while the tapir and collared peccary maintained higher levels of marginal versus optimal habitat, the white-lipped peccary shifted, with the proportion of optimal habitat rising above that of marginal habitat, a pattern opposite to that found in the N-C zone of Misiones or outside of protected areas. The fact that both the white-lipped peccary and collared peccary have high levels of optimal habitat in the corridor, with even the tapir showing a slight increase, suggests that the corridor is capturing the habitat preferences of these three game species. This is supported by the two models, which average a 50% overlap among the suitable habitats for the three species (the highest level of PSR), with almost three-quarters of the total area suitable for between 1–3 species.
The overlap of marginal and optimal habitats among these three game species enables a refined assessment of the quality of these habitats and whether they require restoration, protection, or a combination of both management strategies. Our analyses revealed that most areas designated as suitable within the DeMatteo et al. [52] corridor fall into categories requiring either restoration, protection, or a combined approach. However, there is concern when this evaluation is limited to connectors within the DeMatteo et al. [52] corridor, with these areas defined as the regions that put the long-term connectivity across the N-C zone of Misiones at risk. Within these connectors, only about half were considered suitable habitat, which represents a 30% decrease compared to the larger multispecies corridor. This is lower than that found in carnivores, with about half of the connectors corresponding to marginal habitats for five carnivores, and the remainder to optimal habitats, with varying levels of PSR [58]. This gains relevance considering the knowledge that more than half of this corridor is privately owned, rural populations continue to increase, and these connectors are primarily composed of privately owned parcels less than 100 ha in size [52].
Given the spatial mismatch between species-specific optimal habitats in the corridor and those areas designated as connectors, a layered management approach is essential. Core zones should focus on the strict protection of high-quality habitats, while connector zones require targeted restoration that improves suitability, especially for tapirs. Measures should include antipoaching enforcement, road mitigation structures (e.g., wildlife crossings, speed reduction zones), and community engagement to promote human–wildlife coexistence, aligning with recommendations from DeMatteo et al. [52]. While the high levels of optimal habitat combined with a small home range [113] suggest that the collared peccary could serve as a resilience indicator species, the tapir’s discontinuous distribution and sensitivity to human disturbance [118], and the white-lipped peccary’s high levels of marginal habitat and need for larger home ranges in fragmented habitat [110], suggests they could function as early-warning species for connectivity breakdown. Taken together, these comparisons emphasize the value of integrating prey-based distribution models with carnivore-focused corridor designs. Aligning both perspectives can improve the ecological validity of connectivity planning by ensuring that proposed linkages not only connect landscapes structurally but also maintain functional habitats capable of sustaining predator–prey interactions.

4.4. Limitations of the Study

While our approach provides a robust framework, it is not without limitations that warrant attention. First, the models rely on available occurrence records, which may underrepresent particular species due to detectability biases related to irregular and low population densities across the heterogeneous landscape. Second, land-use layers were treated as static, though rapid agricultural expansion and infrastructure development may quickly alter habitat suitability in the near term. Third, climate change impacts—not addressed here—could further shift species distributions in unpredictable ways. Fourth, our analysis did not explicitly account for hunting pressure, which is a critical factor affecting game species distributions and densities in the region. Addressing these uncertainties will require integrating dynamic land-use and climate models, as well as spatial data on hunting intensity and accessibility, which could provide a more comprehensive assessment of threats and inform management strategies that address both habitat and human pressures. Additionally, it will be necessary to validate ENM outputs with movement and occupancy data.

4.5. Conclusions and Future Directions

Our results underscore the importance of integrating multispecies ENMs with existing corridor designs, which offer a powerful approach for evaluating landscape-scale conservation strategies. In N-C Misiones, the multispecies carnivore corridor effectively captures much of the optimal habitat for key game species, but connectivity gaps—especially for tapirs—require targeted interventions. Conservation planning should therefore prioritize (1) protection and restoration of connector areas, (2) reduction in hunting and road-related threats, and (3) landscape-level coordination that considers prey-predator dynamics.
Our findings emphasize the importance of ongoing efforts in the region to work with landowners in the multispecies corridor of DeMatteo et al. [52] to develop specific management strategies that balance human–wildlife needs [58,122,123,124,125,126,127,128,129,130]. These efforts go beyond habitat restoration and focus on protecting areas of optimal habitat and, therefore, the species that inhabit them. Landscape restoration and the promotion of forest regrowth are management strategies that can help restore connectivity across a complex landscape, especially when strategically placed in areas with high potential for species richness [58]. These efforts, combined with the protection of high-quality or optimal habitat, can optimize the proportion of forest across the landscape, which is important given the high levels of forest associated with carnivores and the prey they depend on.
Ensuring connectivity must be paired with safeguarding animal movement across the landscape [6,17,35,36]. The fact that this is a major factor threatening the long-term survival of biodiversity in Misiones, Argentina, is evident from the patterns seen during the two years (2016 & 2018) of this study. Specifically, there was a dramatic decline in the number of scats located from carnivores (41.77%) and game species (47.06%), which was paired with a large increase in the evidence of illegal hunting [95]. While the MEyRNR reacted to these findings with the formation of a group of provincial park guards tasked with priority towards antipoaching (fauna and flora) patrols (Grupo de Operaciones en Selva or GOS; Provincial Resolution No. 492), there is a desperate need to increase the personnel, logistical, and tactical resources provided.
The threats facing the fauna, flora, and humans that coexist on the landscape are magnified with Misiones showing evidence of climate change in shifting seasonality in rainfall and temperatures, which affect water availability, soil moisture levels, and risk of fire, all of which will inevitably change what habitats are defined as marginal or optimal in their suitability for carnivores and the prey they depend on [131,132,133,134,135]. While none of these findings, or the need for additional understanding, are unique to Misiones, Argentina, given that species expand across borders [134] and the human footprint ignores boundaries [136,137], the approaches taken in this study can be applied to other regions locally, nationally, and internationally.
As human pressures continue to reshape the Atlantic Forest, our approach offers a timely and evidence-based tool to support practical conservation planning and enhanced habitat connectivity in one of South America’s most threatened ecosystems. Future efforts should extend this multispecies prey-predator approach to other portions of the Atlantic Forest (Paraguay and Brazil), especially in transboundary contexts where conservation planning efforts require coordination across political borders. Ultimately, sustaining both carnivores and their prey in Misiones will demand adaptive, cross-sectoral management that balances human livelihoods with biodiversity protection.

Author Contributions

Conceptualization, K.E.D., M.A.R. and C.F.A.; methodology, K.E.D., D.S., O.M.E., D.M.I.A., P.M.D. and C.F.A.; formal analysis, K.E.D., D.S., O.M.E., P.M.D., D.M.I.A. and C.F.A.; investigation, K.E.D., D.S., O.M.E., D.M.I.A., P.M.D., M.A.R. and C.F.A., resources, K.E.D., M.A.R. and C.F.A.; writing—original draft preparation, K.E.D.; writing—review & editing, K.E.D., D.S., O.M.E., D.M.I.A., P.M.D., M.A.R. and C.F.A.; visualization, K.E.D.; supervision, K.E.D., M.A.R. and C.F.A.; funding acquisition, K.E.D., M.A.R. and C.F.A. All authors have read and agreed to the published version of the manuscript.

Funding

This field and lab portions of this study were supported by Chester Zoo, the Conservation, Food and Health Foundation, Eppley Foundation for Research, Fresno Chaffee Zoo Wildlife Conservation Fund, Jaguar Conservation Fund (Woodland Park Zoo), Kickstarter, Kolmârden Foundation, Little Rock Zoo Foundation, National Geographic Society (C193-11 & C235-13), Palm Beach Zoo Conservation & Science Program, Paris Zoo, Phoenix Zoo Conservation & Science Program, Zoo Atlanta (Georgia AAZK, Reeder Conservation & Science Program, & Quarters for Conservation), Riverbanks Zoo and Garden, Sequoia Park Zoo, and the New England Conservation Committee. The Consejo Nacional de Investigaciones Científicas y Técnicas (CONICET) provided doctoral fellowships to D.S. and O.M.E.

Institutional Review Board Statement

Not applicable, as this study did not require ethical approval.

Data Availability Statement

Because the locational data is associated with endangered and threatened endemic species (both carnivores and game species), the government desires to restrict open access to the data; however, they will provide access to the data if requested by researchers. Specifically, the MEyRNR will maintain a database of all results from this study and control the release of the data as a safeguard for the security of the animals, which poachers in the area often target. Interested qualified researchers can send requests for data to the current administration at https://ecologia.misiones.gob.ar/ (accessed on 23 October 2025).

Acknowledgments

The MEyRNR of Misiones and the Administración de Parques Nacionales of Argentina provided permits and assistance with field logistics. The MEyRNR provided housing. Numerous Argentinean students assisted in the field, and provincial/national park guards, NGOs, local conservationists, and private land/reserve owners helped with various aspects of this project in the field and the lab. The PackLeader Conservation Detection Dogs provided guidance. Of course, ‘Train’ and ‘April’ made it all possible with their amazing work ethic.

Conflicts of Interest

The authors declare that they have no conflicts of interest.

Abbreviations

The following abbreviations are used in this manuscript:
AUCArea Under the ROC Curve
ENMEcological Niche Model
FCV1Fixed Cumulative Value 1
MEyRNRMinisterio de Ecología y Recursos Naturales Renovables of Misiones
MTPMinimum Training Presence
MTSSMinimum Training Sensitivity plus Specificity
N-CNorthern-Central
PAsProtected Areas
PSRPotential Species Richness
SDStandard Deviation

Appendix A

Table A1. Details of the 186 scat swabs with confirmed species identity. For the 37 tapir, 128 white-lipped peccary (WLP), and 21 collared peccary (CP) samples, the location and zone [north (N) and central (C)] are summed by species. For protected areas, the total area is reported in parentheses.
LocationZoneTapirWLPCP
P.P. Urugua-í (84,000 ha)N2011
Refugio Privado Aguaraí-mi (3050 ha)N179
Reserva de Vida Silvestre Urugua-í (3243 ha)N------2
P.P. Cruce Caballero (522 ha) & Valle del Arroyo Alegría (8000 ha)C---1---
P.P. Esmeralda (31,569 ha) & Reserva de Biósfera Yabotí (236,313 ha)C213---
Reserva Privada Yaguaroundí (400 ha)C---2---
outside protected areasN11748
outside protected areasC3202

References

  1. Simberloff, D. Flagships, Umbrellas, and Keystones: Is Single-Species Management Passé in the Landscape Era? Biol. Conserv. 1998, 83, 247–257. [Google Scholar] [CrossRef]
  2. Martinez del Rio, C.; Dugelby, B.; Foreman, D.; Miller, B.; Noss, R.; Phillips, M. The Importance of Large Carnivores to Healthy Ecosystems. Endanger. Species Update 2001, 18, 202. [Google Scholar]
  3. Natsukawa, H.; Sergio, F. Top Predators as Biodiversity Indicators: A Meta-Analysis. Ecol. Lett. 2022, 25, 2062–2075. [Google Scholar] [CrossRef]
  4. Keuroghlian, A.; Eaton, D.P. Removal of Palm Fruits and Ecosystem Engineering in Palm Stands by White-Lipped Peccaries (Tayassu Pecari) and Other Frugivores in an Isolated Atlantic Forest Fragment. Biodivers. Conserv. 2009, 18, 1733–1750. [Google Scholar] [CrossRef]
  5. Altrichter, M.; Taber, A.; Beck, H.; Reyna-Hurtado, R.; Lizarraga, L.; Keuroghlian, A. Range-Wide Declines of a Key Neotropical Ecosystem Architect, the Near Threatened White-Lipped Peccary Tayassu pecari. Oryx 2012, 46, 87–98. [Google Scholar] [CrossRef]
  6. Medici, E.P.; Desbiez, A.L.J. Population Viability Analysis: Using a Modeling Tool to Assess the Viability of Tapir Populations in Fragmented Landscapes. Integr. Zool. 2012, 7, 356–372. [Google Scholar] [CrossRef]
  7. Keuroghlian, A.; Carmo Andrade Santos, M.; Eaton, D.P. The Effects of Deforestation on White-Lipped Peccary (Tayassu Pecari) Home Range in the Southern Pantanal. Mammalia 2014, 79, 491–497. [Google Scholar] [CrossRef]
  8. de Bustos, S. Dispersal and Herbivory of the Tapir (Tapirus terrestris) in a Yungas Forest [Dispersión y Herbivoría del Tapir (Tapirus terrestris) en un Bosque de Yungas]. Ph.D. Dissertation, Universidad Nacional de Tucumán, Tucumán, Argentina, 2018. [Google Scholar]
  9. Whitworth, A.; Beirne, C.; Basto, A.; Flatt, E.; Tobler, M.; Powell, G.; Terborgh, J.; Forsyth, A. Disappearance of an Ecosystem Engineer, the White-Lipped Peccary (Tayassu pecari), Leads to Density Compensation and Ecological Release. Oecologia 2022, 199, 937–949. [Google Scholar] [CrossRef] [PubMed]
  10. Gordon, I.J. What Is the Future for Wild, Large Herbivores in Human-Modified Agricultural Landscapes? Wildl. Biol. 2009, 15, 1–9. [Google Scholar] [CrossRef] [PubMed]
  11. Laurance, W.F.; Goosem, M.; Laurance, S.G.W. Impacts of Roads and Linear Clearings on Tropical Forests. Trends Ecol. Evol. 2009, 24, 659–669. [Google Scholar] [CrossRef]
  12. Wolf, C.; Ripple, W.J. Prey Depletion as a Threat to the World’s Large Carnivores. R. Soc. Open Sci. 2016, 3, 160252. [Google Scholar] [CrossRef]
  13. Bauni, V.; Anfuso, J.; Schivo, F. Wildlife Roadkill Mortality in the Upper Paraná Atlantic Forest, Argentina [Mortalidad de Fauna Silvestre por Atropellamientos en el Bosque Atlántico del Alto Paraná, Argentina]. Ecosistemas 2017, 26, 54–66. [Google Scholar] [CrossRef]
  14. de Bustos, S.; Varela, D.; Lizárraga, L.; Camino, M.; Quiroga, V. Tayassu pecari. In Categorización del Estado de Conservación de Mamíferos de Argentina. Lista Roja de los Mamíferos de Argentina; SAYDS–SAREM, Ed.; SAYDS–SAREM: Buenos Aires, Argentina, 2019; pp. 1–10. [Google Scholar]
  15. Fort, J.L.; Suriyamongkol, T.; Nielsen, C.K.; Carver, A.D.; Moreno, R.; Meyer, N.F.V. Large Felid and Peccary Habitat Use in Isolated and Contiguous Forest in Panamá: Implications for Conservation. Trop. Conserv. Sci. 2022, 15, 1–18. [Google Scholar] [CrossRef]
  16. Piña-Covarrubias, E.; Chávez, C.; Chapman, M.A.; Morales, M.; Elizalde-ArellanaArellano, C.; Doncaster, C. Ecology of Large Felids and Their Prey in Small Reserves of the Yucatán Peninsula of Mexico. J. Mammal. 2022, 104, 115–127. [Google Scholar] [CrossRef] [PubMed]
  17. Falconi-Briones, F.A.; Bolom-Huet, R.; Naranjo, E.J.; Reyna-Hurtado, R.; Enríquez-Rocha, P.L.; Moreira-Ramírez, J.F. Connectivity at Risk: A Critical Scenario for the Endangered Baird’s Tapir and the Vulnerable White-Lipped Peccary in the Maya Forest. Biodivers. Conserv. 2025, 34, 235–254. [Google Scholar] [CrossRef]
  18. Snider, M.H.; Athreya, V.R.; Balme, G.A.; Bidner, L.R.; Farhadinia, M.S.; Fattebert, J.; Gompper, M.; Hunter, L.; Isbell, L.; Macdonald, D.; et al. Home Range Variation in Leopards Living across the Human Density Gradient. J. Mammal. 2021, 102, 1138–1148. [Google Scholar] [CrossRef]
  19. Thompson, J.J.; Morato, R.G.; Niebuhr, B.B.; Alegre, V.B.; Oshima, J.E.F.; Barros, A.E. Environmental and Anthropogenic Factors Synergistically Affect Space Use of Jaguars. Curr. Biol. 2021, 31, 3457–3466. [Google Scholar] [CrossRef] [PubMed]
  20. Johnson-Bice, S.M.; Gable, T.D.; Roth, J.D.; Bump, J.K. Patchy Indirect Effects of Predation: Predators Contribute to Landscape Heterogeneity and Ecosystem Function via Localized Pathways. Oikos 2023, 2023, 10065. [Google Scholar] [CrossRef]
  21. Zanón Martínez, J.; Iranzo, E.; Travaini, A.; McNitt, D.; Mansilla, A.; Llanos, R.; Kelly, M. Puma Density, Habitat Use, and Activity Patterns across a Mosaic Landscape of Ranches, Game Reserves, and a Protected Area in Central Argentina. Eur. J. Wildl. Res. 2023, 69, 89. [Google Scholar] [CrossRef]
  22. Fragoso, J.M.V. Chapter 18: A Long-Term Study of White-Lipped Peccary (Tayassu pecari) Population Fluctuations in Northern Amazonia—Anthropogenic Versus “Natural” Causes. In People in Natures: Wildlife Conservation in South and Central America; Silvius, K.M., Bodmer, R.E., Fragoso, J.M.V., Eds.; Columbia University Press: New York, NY, USA, 2004; pp. 286–296. [Google Scholar]
  23. Moreno, R.S.; Kays, R.W.; Samudio, R., Jr. Competitive Release in Diets of Ocelot (Leopardus pardalis) and Puma (Puma concolor) after Jaguar (Panthera onca) Decline. J. Mammal. 2006, 87, 808–816. [Google Scholar] [CrossRef]
  24. Winnie, J., Jr.; Creel, S. The Many Effects of Carnivores on Their Prey and Their Implications for Trophic Cascades, and Ecosystem Structure and Function. Food Webs 2017, 12, 88–94. [Google Scholar] [CrossRef]
  25. Fragoso, J.M.V.; Antunes, A.P.; Silvius, K.M.; Constantino, P.A.L.; Zapata-Ríos, G.; El Bizri, H.R. Large-Scale Population Disappearance and Cycling in the White-Lipped Peccary, a Tropical Forest Mammal. PLoS ONE 2022, 17, 0276297. [Google Scholar] [CrossRef]
  26. Northrup, J.; Vander Wal, E.; Bonar, M.; Fieberg, J.; Laforge, M.; Leclerc, M.; Prokopenko, C.; Gerber, B. Conceptual and Methodological Advances in Habitat-Selection Modeling: Guidelines for Ecology and Evolution. Ecol. Appl. 2022, 32, e02470. [Google Scholar] [CrossRef] [PubMed]
  27. Huey, R. Physiological Consequences of Habitat Selection. Am. Nat. 1991, 137, S91–S115. [Google Scholar] [CrossRef]
  28. Lennox, R.; Kambestad, M.; Berhe, S.; Birnie-Gauvin, K.; Cooke, S.; Dahlmo, L.; Eldoy, S.; Sindre, H.; Davidsen, J.; Hanssen, E.; et al. The Role of Habitat in Predator-Prey Dynamics with Applications to Restoration. Restor. Ecol. 2025, 33, e14354. [Google Scholar] [CrossRef]
  29. Ripari, L.; Premier, J.; Belotti, E.; Bluhm, H.; Breitenmoser-Wursten, C.; Bufka, L.; Cerveny, J.; Drouet-Hoguet, N.; Fuxjager, C.; Jedrzejewski, W.; et al. Human Disturbance Is the Most Limiting Factor Driving Habitat Selection of a Large Carnivore throughout Continental Europe. Biol. Conserv. 2022, 266, 109446. [Google Scholar] [CrossRef]
  30. Smith, B.; MacNulty, D.; Stahler, D.; Smith, D.; Avgar, T. Density-Dependent Habitat Selection Alters Drivers of Population Distribution in Northern Yellowstone Elk. Ecol. Lett. 2023, 26, 245–256. [Google Scholar] [CrossRef] [PubMed]
  31. Grenier-Potvin, A.; Clermont, J.; Gauthier, G.; Berteaux, D. Prey and Habitat Distribution Are Not Enough to Explain Predator Habitat Selection: Addressing Intraspecific Interactions, Behavioural State and Time. Mov. Ecol. 2021, 9, 12. [Google Scholar] [CrossRef] [PubMed]
  32. Lathouwers, M.; Dendoncker, N.; Artois, T.; Meenaerts, N.; Conway, G.; Henderson, I.; Shewring, M.; Cross, T.; Ulenaers, E.; Eens, R. Multi-Scale Habitat Selection throughout the Annual Cycle of a Long-Distance Avian Migrant. Ecol. Indic. 2023, 156, 111099. [Google Scholar] [CrossRef]
  33. Meyer, N.; Esser, H.J.; Moreno, R.; va Langevelde, F.; Liefting, Y.; Oller, D.R.; Vogels, C.; Carver, A.; Nielsen, C.; Jansen, P. An Assessment of the Terrestrial Mammal Communities in Forest of Central Panama Using Camera-Trap Surveys. J. Nat. Conserv. 2015, 26, 28–35. [Google Scholar] [CrossRef]
  34. Núñez-Reguerio, M.; Branch, L.; Fletcher, R., Jr.; Marás, G.A.; Derlindata, E.; Tálamo, A. Spatial Patterns of Mammal Occurrence in Forest Strips Surrounded by Agricultural Crops of the Chaco Region, Argentina. Biol. Conserv. 2015, 187, 19–26. [Google Scholar] [CrossRef]
  35. Malakoutikhah, S.; Fakheran, S.; Hemami, M.R.; Tarkesh, M.; Senn, J. Assessing Future Distribution, Suitability Corridors and Efficiency of Protected Areas to Conserve Vulnerable Ungulates under Climate Change. Divers. Distrib. 2020, 26, 1383–1396. [Google Scholar] [CrossRef]
  36. Riggio, J.; Foreman, K.; Freedman, E.; Gottlieb, B.; Hendler, D.; Radomille, D. Predicting Wildlife Corridors for Multiple Species in an East African Ungulate Community. PLoS ONE 2022, 17, 0265136. [Google Scholar] [CrossRef] [PubMed]
  37. Macdonald, E.; Macdonald, D.; Cushman, S. Using Simulation Modelling to Evaluate the Relative Efficacy of Core Area and Corridor-Based Conservation Designs for Biodiversity Conservation. Landsc. Ecol. 2025, 40, 171. [Google Scholar] [CrossRef]
  38. Watson, J.E.M.; Iwamura, T.; Butt, N. Mapping Vulnerability and Conservation Adaptation Strategies under Climate Change. Nat. Clim. Change 2013, 3, 989–994. [Google Scholar] [CrossRef]
  39. Siddig, A.A.H.; Ellison, A.M.; Ochs, A.; Villar-Leeman, C.; Lau, M.K. How Do Ecologists Select and Use Indicator Species to Monitor Ecological Change? Insights from 14 Years of Publication in Ecological Indicators. Ecol. Indic. 2016, 60, 223–230. [Google Scholar] [CrossRef]
  40. Schuster, R.; Buxton, R.; Hanson, J.O.; Binley, A.D.; Pittman, J.; Tulloch, V. Protected Area Planning to Conserve Biodiversity in an Uncertain Future. Conserv. Biol. 2023, 37, 14048. [Google Scholar] [CrossRef]
  41. Chanove-Manrique, A.; Cárdenas-Pillco, B. Landscape Fragmentation and Loss of Connectivity in Peru’s Queñua (Polylepis) Forests and Their Vulnerability to Climate Change [Fragmentación del Paisaje y Pérdida de Conectividad en los Bosque de Queñua (Polylepis) en Perú y su Vulnerabilidad ante el Cambio Climático]. Madera Bosques 2024, 30, 3032593. [Google Scholar] [CrossRef]
  42. Galindo-Leal, C.; Gusmão Câmara, I. Chapter 1: The Atlantic Forest Hotspot: An Overview. In The Atlantic Forest of South America: Biodiversity, Status, Threats, and Outlooks (State of the Hotspots); Island Press: Washington, DC, USA, 2003; pp. 3–11. ISBN 1-55963-989-X. [Google Scholar]
  43. Zuleta, G.A.; Gauto, O.A.; Varela, D.M.; Angelo, C.; Johnson, B.G.; Lorán, D. Strategic Environmental Assessments and Biodiversity Monitoring Program in the Mesopotamia and Paraná Delta Regions [Evaluaciones Ambientales Estratégicas y Programa de Monitoreo de la Biodiversidad en las Regiones de Mesopotamia y Delta de Paraná]. In Final Report (Informe Final). 2016. Ministerio de Agroindustria de la Nación; Universidad Maimónides: Buenos Aires, Argentina; Universidad Nacional de Misiones—CONICET: Posadas, Argentina, 2016. [Google Scholar]
  44. Iezzi, M.E.; Cruz, P.; Diego, V.; Bitetti, M.S.; Angelo, C. Fragment Configuration or Environmental Quality? Understanding What Really Matters for the Conservation of Native Mammals in the Atlantic Forest of Argentina. J. Nat. Conserv. 2019, 52, 125751. [Google Scholar] [CrossRef]
  45. Marques, M.; Trindade, W.; Bohn, A.; Grelle, C. Chapter 1: The Atlantic Forest: History, Biodiversity, Threats and Opportunities of the Megadiverse Forest of South America. In The Atlantic Forest: History, Biodiversity, Threats and Opportunities of Mega-diverse Forest; Springer Nature: Cham, Switzerland, 2021; pp. 3–23. ISBN 978-3-030-55322-7. [Google Scholar]
  46. de Lima, R.; Dauby, G.; Gasper, A.; Fernandez, E.; Vibrans, A.; Oliveira, A.; Prado, P.; Souza, V.; Siqueira, M.; Steege, H. Comprehensive Conservation Assessments Reveal High Extinction Risks across Atlantic Forest Trees. Science 2024, 383, 219–255. [Google Scholar] [CrossRef]
  47. Izquierdo, A.E.; Angelo, C.D.; Aide, T.M. Thirty Years of Human Demography and Land-Use Change in the Atlantic Forest of Misiones, Argentina: An Evaluation of the Forest Transition Model. Ecol. Soc. 2008, 13, 3. [Google Scholar] [CrossRef]
  48. Haag, T.; Santos, A.; Sana, D.; Morato, R.; Cullen, L., Jr.; Crawshaw, P., Jr.; De Angelo, C.; Di Bitetti, M.; Salzano, F.; Eizirik, E. The Effect of Habitat Fragmentation on the Genetic Structure of a Top Predator: Loss of Diversity and High Differentiation among Remnant Populations of Atlantic Forest Jaguars (Panthera onca). Mol. Ecol. 2010, 19, 4906–4921. [Google Scholar] [CrossRef]
  49. Sancha, N.U.; Higgins, C.L.; Presley, S.J.; Strauss, R.E. Metacommunity Structure in a Highly Fragmented Forest: Has Deforestation in the Atlantic Forest Altered Historic Biogeographic Patterns? Divers. Distrib. 2014, 20, 1058–1070. [Google Scholar] [CrossRef]
  50. Galetti, M.; Brocardo, C.R.; Begotti, R.; Hortenci, L.; Rocha-Mendes, F.; Bernardo, C.; Bueno, R.; Nobre, R.; Bovendorp, R.; Marques, R.; et al. Defaunation and Biomass Collapse of Mammals in the Largest Atlantic Forest Remnant. Anim. Conserv. 2017, 20, 270–281. [Google Scholar] [CrossRef]
  51. Iezzi, M.E.; Cruz, P.; Varela, D.; Angelo, C.; Bitetti, M.S. Tree Monocultures in a Biodiversity Hotspot: Impact of Pine Plantations on Mammal and Bird Assemblages in the Atlantic Forest. For. Ecol. Manag. 2018, 424, 216–227. [Google Scholar] [CrossRef]
  52. DeMatteo, K.E.; Rinas, M.A.; Zurano, J.P.; Selleski, N.; Schneider, R.G.; Argüelles, C.F. Using Niche-Modelling and Species-Specific Cost Analyses to Determine a Multispecies Corridor in a Fragmented Landscape. PLoS ONE 2017, 12, 0183648. [Google Scholar] [CrossRef]
  53. Lambeck, R.J. Focal Species: A Multi-Species Umbrella for Nature Conservation. Conserv. Biol. 1997, 11, 849–856. [Google Scholar] [CrossRef]
  54. Beier, P.; Majka, D.R.; Newell, S.L. Uncertainty Analysis of Least-Cost Modelling for Designing Wildlife Linkages. Ecol. Appl. 2009, 19, 2067–2077. [Google Scholar] [CrossRef]
  55. Brodie, J.F.; Giordana, A.J.; Dickson, B.; Hebblewhite, M.; Bernard, H.; Mohd-Azlan, J. Evaluating Multispecies Landscape Connectivity in a Threatened Tropical Mammal Community. Conserv. Biol. 2014, 29, 122–132. [Google Scholar] [CrossRef]
  56. Wood, S.L.R.; Martins, K.T.; Dumais-Lalonde, V.; Tangua, O.; Maure, F.; St-Denis, A.; Rayfield, B.; Martin, A.; Gonzalez, A. Missing Interactions: The Current State of Multispecies Connectivity Analysis. Front. Ecol. Evol. 2022, 10, 830822. [Google Scholar] [CrossRef]
  57. Bohnett, E.; Oetting, J.; Noss, R.; O’Brien, M.; Frakes, R.; Smith, D. Consolidating Diverse Modeling Methods and Spatial Prioritization for Multispecies Connectivity Planning. Front. Conserv. Sci. 2024, 5, 1406944. [Google Scholar] [CrossRef]
  58. DeMatteo, K.E.; Rinas, M.A.; Escalante, O.M.; Sotorres, D.; Ibañez Alegre, D.M.; Argüelles, C.F. A Multispecies Corridor in a Fragmented Landscape: Evaluating Effectiveness and Identifying High-Priority Target Areas. PLoS ONE 2023, 18, 0283258. [Google Scholar] [CrossRef]
  59. Galetti, M.; Keuroghlian, A.; Hanada, L.; Morato, M.I. Frugivory and Seed Dispersal by the Lowland Tapir (Tapirus terrestris) in Southeast Brazil. Biotropica 2001, 33, 723–726. [Google Scholar] [CrossRef]
  60. Beck, H.; Thebpanya, P.; Filiaggi, M. Do Neotropical Peccary Species (Tayassuidae) Function as Ecosystem Engineers for Anurans? J. Trop. Ecol. 2010, 26, 407–414. [Google Scholar] [CrossRef]
  61. Simpson, B.K.; Shukor, M.N.; Magintan, D.; Ling, W.S. Food Selection of the Maylayan Tapir (Tapirus indicus) under Semi-Wild Conditions. In Proceedings of the 2013 UKM FST Postgraduate Colloquium—AIP Conference Proceedings, Selangor Kembangan, Malaysia, 3–4 July 2013; Murad, A.M.H.A., Yen, C.C., Ismail, E.S., Maskat, M.Y., Noorani, M.S.M., Ibrahim, N., Eds.; AIP Publishing: Melville, NY, USA, 2013; pp. 317–324. [Google Scholar]
  62. Giombini, M.I.; Bravo, S.P.; Tosto, D.S. The Key Role of the Largest Extant Neotropical Frugivore (Tapirus terrestris) in Promoting Admixture of Plant Genotypes across the Landscape. Biotropica 2016, 48, 499–508. [Google Scholar] [CrossRef]
  63. Ranzani de Luca, J.; Pardini, R. Use of Early and Late Successional Forest Patches by the Endangered Lowland Tapir Tapirus terrestris (Perissodactyla: Tapiridae). Mamm. Biol. 2017, 86, 107–114. [Google Scholar] [CrossRef]
  64. Vélez, J.; Espelta, J.M.; Rivera, O.; Armenteras, D. Effects of Seasonality and Habitat on the Browsing and Frugivory Preferences of Tapirus terrestris in North-Western Amazonia. J. Trop. Ecol. 2017, 33, 395–406. [Google Scholar] [CrossRef]
  65. Cruz, L.; Muylaert, R.; Galetti, M.; Pires, M. The Geography of Diet Variation in Neotropical Carnivora. Mammal Rev. 2022, 52, 112–128. [Google Scholar] [CrossRef]
  66. King, R.; Braun, J.; Westphal, M.; Lortie, C. Prey Distribution Mapping to Support Conservation Planning. Divers. Distrib. 2025, 31, e70048. [Google Scholar] [CrossRef]
  67. de Gabriel Hernando, M.; Karamanlidis, A.; Grivas, K.; Krambokoukis, L.; Papakostas, G.; Beecham, J. Habitat Use and Selection Patterns Inform Habitat Conservation Priorities of an Endangered Large Carnivore in Southern Europe. Endanger. Species Res. 2021, 44, 203–215. [Google Scholar] [CrossRef]
  68. de Bustos, S.; Varela, D.; Lizárraga, L.; Cirignoli, S.; Quiroga, V.; Chalukián, S.; Giombini, M. Tapirus terrestris. In Categorización del Estado de Conservación de Mamíferos de Argentina—Lista Roja de los Mamíferos de Argentina; SAYDS–SAREM, Ed.; SAYDS–SAREM: Buenos Aires, Argentina, 2019; pp. 1–18. [Google Scholar]
  69. Vancine, M.H.; Muylaert, R.L.; Niebuhr, B.B.; Faria Oshima, J.E.; Tonetti, V.; Bernardo, R. The Atlantic Forest of South America: Spatiotemporal Dynamics of the Vegetation and Implications for Conservation. Biol. Conserv. 2024, 291, 110499. [Google Scholar] [CrossRef]
  70. Souza, C., Jr.; Shimbo, J.; Rosa, M.; Parente, L.; Alencar, A.; Rudorff, B. Reconstructing Three Decades of Land Use and Land Cover Changes in Brazilian Biomes with Landsat Archive and Earth Engine. Remote Sens. 2020, 12, 2735. [Google Scholar] [CrossRef]
  71. Reyna-Hurtado, R.; Rojas-Flores, E.; Tanner, G.W. Home Range and Habitat Preferences of White-Lipped Peccaries (Tayassu Pecari) in the Calakmul Forest, Campeche, Mexico. J. Mammal. 2009, 90, 1199–1209. [Google Scholar] [CrossRef]
  72. Keuroghlian, A.; Desbiez, A.; Reyna-Hurtado, R.; Altrichter, M.; Beck, H.; Taber, A.; Fragoso, J.M.V. Tayassu Pecari. IUCN Red List. Threat. Species 2013, 2013, e.T41778A44051115. [Google Scholar] [CrossRef]
  73. Medici, E.P.; Desbiez, A.L.J.; Gatti, A.; Chalukian, S.C. Report of the Tapir Specialist Group. In IUCN SSC and Secretariate. 2023 Report of the IUCN Species Survival Commission and Secretariat; IUCN: Gland, Switzerland, 2024. [Google Scholar]
  74. Chalukian, S.; Bustos, S.; Bitetti, M.; Angelo, C.; Paviolo, A. Orden Perissodactyla. In Libro Rojo de los Mamíferos Amenazados de la Argentina; Ojeda, R., Chillo, V., Díaz Isenrath, G.B., Eds.; Sociedad Argentina para el Estudio de los Mamíferos (SAREM): Buenos Aires, Argentina, 2012; p. 116. [Google Scholar]
  75. Chalukian, S.; Bustos, S.; Lizárraga, L.; Varela, D.; Paviolo, A.; Quse, V. Plan de Acción para la Conservación del Tapir (Tapirus terrestris) en Argentina; Dirección de Fauna Silvestre de la Nación—Secretaría de Ambiente y Desarrollo Sustentable: Buenos Aires, Argentina, 2009. [Google Scholar]
  76. Gongora, J.; Reyna-Hurtado, R.; Beck, H.; Taber, A.; Altrichter, M.; Keuroghlian, A. Pecari Tajacu. IUCN Red List. Threat. Species 2011, 2011, e.T41777A10562361. [Google Scholar] [CrossRef]
  77. MAyDS. Listado de Especies de Fauna Silvestre en Riesgo de Extinción en Argentina; Secretaría de Ambiente: Buenos Aires, Argentina, 2020. [Google Scholar]
  78. Illia, G. Effects of Habitat Modification on Ecosystem Health: The Role of the Capuchin Monkey (Sapajus nigritus) in the Transmission of Infectious Diseases in Remnants of the Atlantic Forest of Argentina [Efectos de La Modificación de Habitat En La Salud Del Ecosistema: El Papel Del Mono Caí (Sapajus nigritus) En La Tranmisión de Enfermedades Infecciosas En Remanentes Del Bosque Atlántico Argentino]. Ph.D. Thesis, Universidad de Buenos Aires, Buenos Aires, Argentina, 2025. [Google Scholar]
  79. Martínez de Zorzi, V. Impact of Habitat Fragmentation on Capuchin Monkeys (Sapajus nigritus cucullatus) in Northeastern Argentina [Impacto de La Fragmentación de Habitat Sobre Los Monos Caí (Sapajus nigritus cucullatus) En El Noreste Argentino]. Ph.D. Thesis, Universidad de Buenos Aires, Buenos Aires, Argentina, 2025. [Google Scholar]
  80. DeMatteo, K.E.; Rinas, M.A.; Sede, M.M.; Davenport, B.; Argüelles, C.F.; Lovett, K. Detection Dogs: An Effective Technique for Bush Dog Surveys. J. Wildl. Manag. 2009, 73, 1436–1440. [Google Scholar] [CrossRef]
  81. DeMatteo, K.E.; Rinas, M.A.; Argüelles, C.F.; Holman, B.E.; Bitetti, M.S.; Davenport, B. Using Detection Dogs and Genetic Analyses of Scat to Expand Knowledge and Assist Felid Conservation in Misiones, Argentina. Integr. Zool. 2014, 9, 623–639. [Google Scholar] [CrossRef]
  82. DeMatteo, K.E.; Rinas, M.A.; Argüelles, C.F.; Zurano, J.P.; Selleski, N.; Bitetti, M.S. Noninvasive techniques provide novel insight for the elusive bush dog (Speothos venaticus). Wildl. Soc. Bull. 2014, 38, 862–873. [Google Scholar] [CrossRef]
  83. Cusack, J.J.; Dickman, A.J.; Rowcliffe, J.M.; Carbone, C.; Macdonald, D.W.; Coulson, T. Random versus Game Trail-Based Camera Trap Placement Strategy for Monitoring Terrestrial Mammal Communities. PLoS ONE 2015, 10, 0126373. [Google Scholar] [CrossRef]
  84. Kolowski, J.M.; Forrester, T.D. Camera Trap Placement and the Potential for Bias Due to Trails and Other Features. PLoS ONE 2017, 12, 0186679. [Google Scholar] [CrossRef]
  85. Foster, R.; Harmsen, B. A Critique of Density Estimation from Camera-Trap Data. J. Wildl. Manag. 2012, 76, 224–236. [Google Scholar] [CrossRef]
  86. Wearn, O.R.; Glover-Kapfer, P. Camera-Trapping for Conservation: A Guide to Best-Practices; WWW Conservation Technology Series; WWF-UK: Woking, UK, 2017. [Google Scholar]
  87. Nussear, K.; Esque, T.; Heaton, J.; Cablk, M.; Drake, K.; Valentin, C.; Yee, J.; Medica, P. Are Wildlife Detector Dogs or People Better at Finding Desert Tortoises (Gopherus agassizii). Herpetol. Conserv. Biol. 2008, 3, 103–115. [Google Scholar]
  88. Delgado, P.M.; Argüelles, C.F.; DeMatteo, K.E. Using Noninvasive Techniques to Monitor Game Species Targeted by Poaching in Misiones, Argentina. Neotrop. Biodivers. 2021, 7, 78–85. [Google Scholar] [CrossRef]
  89. Sotorres, D. Forensic Identification and Analysis of Distribution of Species in the Proposed Biological Corridor for Misiones (Argentina) [Identificación Forense y Análisis de Distribución de Especies Presa a Lo Largo Del Corredor Biológico Propuesto Para Misiones (Argentina)]. Bachelor’s Thesis, Universidad Nacional de Misiones—Facultad de Ciencias Exactas, Químicas y Naturales, Posadas, Misiones, Argentina, 2019. [Google Scholar]
  90. Sambrook, J.; Fritsch, E.F.; Maniatis, T. Molecular Cloning: A Laboratory Manual; Cold Spring Harbor Laboratory Press: New York, NY, USA, 1989. [Google Scholar]
  91. Vynne, C. Landscape Use by Wide-Ranging Mammals of the Brazilian Cerrado. Ph.D. Dissertation, University of Washington, Seattle, WA, USA, 2010. [Google Scholar]
  92. Farrell, L.E.; Roman, J.; Sunquist, M.E. Dietary Separation of Sympatric Carnivores Identified by Molecular Analysis of Scats. Mol. Ecol. 2000, 9, 1583–1590. [Google Scholar] [CrossRef] [PubMed]
  93. Miotto, R.; Rodrigues, F.; Ciocheti, G.; Galetti, P., Jr. Determination of the Minimum Population Size of Pumas (Puma concolor) through Fecal DNA Analysis in Two Protected Cerrado Areas in the Brazilian Southeast. Biotropica 2007, 39, 647–654. [Google Scholar] [CrossRef]
  94. Hall, T.A. BioEdit: A User-Friendly Biological Sequence Alignment Editor and Analysis Program for Windows 95/98/NT. Nucleic Acids Symp. Ser. 1999, 41, 95–98. [Google Scholar]
  95. Altschul, S.F.; Gish, W.; Miller, W.; Myers, E.W.; Lopman, D.J. Basic Local Alignment Search Tool. J. Mol. Biol. 1990, 215, 403–410. [Google Scholar] [CrossRef]
  96. Phillips, S.J.; Anderson, R.P.; Schapire, R.E. Maximum Entropy Modeling of Species Geographic Distributions. Ecol. Model. 2006, 190, 231–259. [Google Scholar] [CrossRef]
  97. Duan, R.-Y.; Kong, X.-Q.; Huang, M.-Y.; Fan, W.-Y.; Wang, Z.-G. The Predictive Performance and Stability of Six Species Distribution Models. PLoS ONE 2014, 9, 112764. [Google Scholar] [CrossRef]
  98. Elith, J.; Graham, C.; Anderson, R.; Dudík, M.; Ferrier, S.; Guisan, A. Novel Methods Improve Prediction of Species’ Distributions from Occurrence Data. Ecography 2006, 29, 129–151. [Google Scholar] [CrossRef]
  99. Ahmadi, M.; Hemami, M.-R.; Kaboli, M.; Shabani, F. MaxEnt Brings Comparable Results When the Input Data Are Being Completed; Model Parameterization of Four Species Distribution Models. Ecol. Evol. 2023, 13, e9827. [Google Scholar] [CrossRef]
  100. Phillips, S.J.; Dudík, M. Modeling of Species Distributions with Maxent: New Extensions and a Comprehensive Evaluation. Ecography 2008, 31, 161–175. [Google Scholar] [CrossRef]
  101. Warren, D.L.; Seifert, S.N. Ecological Niche Modeling in Maxent: The Importance of Model Complexity and the Performance of Model Selection Criteria. Ecol. Appl. 2011, 21, 335–342. [Google Scholar] [CrossRef] [PubMed]
  102. Merow, C.; Smith, M.J.; Silander, J.A. A Practical Guide to MaxEnt for Modeling Species’ Distributions. What It Does, and Why Inputs and Settings Matter. Ecography 2013, 36, 1058–1069. [Google Scholar] [CrossRef]
  103. Fourcade, Y.; Engler, J.; Rodder, D.; Secondi, J. Mapping Species Distribution with MAXENT Using a Geographically Biased Sample of Presence Data: A Performance Assessment of Methods for Correcting Sampling Bias. PLoS ONE 2014, 9, e97122. [Google Scholar] [CrossRef]
  104. Liu, C.; Berry, P.M.; Dawson, T.P.; Pearson, R.G. Selecting Thresholds of Occurrence in the Prediction of Species Distributions. Ecography 2005, 28, 385–393. [Google Scholar] [CrossRef]
  105. Trisurat, Y.; Bhumpakphan, N.; Reed, D.H.; Kanchanasaka, B. Using Species Distribution Modeling to Set Management Priorities for Mammals in Northern Thailand. J. Nat. Conserv. 2012, 20, 264–273. [Google Scholar] [CrossRef]
  106. Liu, C.; White, M.; Newell, G.; Pearson, R. Selecting Thresholds for the Prediction of Species Occurrence with Presence-Only Data. J. Biogeogr. 2013, 40, 778–789. [Google Scholar] [CrossRef]
  107. Liu, C.; Newell, G.; White, M. On the Selection of Thresholds for Predicting Species Occurrence with Presence-Only Data. Ecol. Evol. 2016, 6, 337–348. [Google Scholar] [CrossRef]
  108. Hirzel, A.H.; Hausser, J.; Chessel, D.; Perrin, N. Ecological-Niche-Factor Analysis: How to Computer Habitat-Suitability Maps without Absences Data? Ecology 2002, 83, 2027–2036. [Google Scholar] [CrossRef]
  109. Medici, E.P.; Mezzini, S.; Fleming, C.; CalabreseCH, J.; Noonan, M. Movement Ecology of Vulnerable Lowland Tapirs between Areas of Varying Human Disturbance. Mov. Ecol. 2022, 10, 14. [Google Scholar] [CrossRef]
  110. Keuroghlian, A.; Eaton, D.P.; Longland, W.S. Area Use by White-Lipped and Collared Peccaries (Tayassu Pecari and Tayassu Tajacu) in a Tropical Forest Fragment. Biol. Conserv. 2004, 120, 411–425. [Google Scholar] [CrossRef]
  111. Manuel, J.; Fragoso, V. Perception of Scale and Resource Partitioning by Peccaries: Behavioral Causes and Ecological Implications. J. Mammal. 1999, 80, 993–1003. [Google Scholar] [CrossRef]
  112. Carrillo, E.; Saenz, J.; Fuller, T. Movements and Activities of White-Lipped Peccaries in Corcovado National Park, Costa Rica. Biol. Conserv. 2002, 108, 317–324. [Google Scholar] [CrossRef]
  113. Judas, J.; Henry, O. Seasonal Variation of Home Range of Collared Peccary in Tropical Rain Forests of French Guiana. J. Wildl. Manag. 1999, 63, 546–552. [Google Scholar] [CrossRef]
  114. Fielding, A.H.; Bell, J.F. A Review of Methods for the Assessment of Prediction Errors in Conservation Presence/Absence Models. Environ. Conserv. J. 1997, 24, 38–49. [Google Scholar] [CrossRef]
  115. Skov, F.; Borchsenius, F. Predicting Plant Species Distribution Patterns Using Simple Climatic Parameters: A Case Study of Ecuadorian Palms. Ecography 1997, 20, 347–355. [Google Scholar] [CrossRef]
  116. Swets, K.A. Measuring the Accuracy of Diagnostic Systems. Science 1988, 240, 1285–1293. [Google Scholar] [CrossRef]
  117. Ripple, W.; Estes, J.; Beschta, R.; Wilmers, C.; Ritchie, E.; Hebblewhite, M. Status and Ecological Effects of the World’s Largest Carnivores. Science 2014, 343, 1241484. [Google Scholar] [CrossRef] [PubMed]
  118. Flesher, K.M.; Medici, E.P. The Distribution and Conservation Status of Tapirus Terrestris in the South American Atlantic Forest. Neotrop. Biol. Conserv. 2022, 17, 1–19. [Google Scholar] [CrossRef]
  119. Kiltie, R.A.; Terborgh, J. Observations on the Behavior of Rain-Forest Peccaries in Peru—Why Do White-Lipped Peccaries Form Herds. Z. Tierpsychol. 1983, 62, 241–255. [Google Scholar] [CrossRef]
  120. Tobler, M.W.; Carrillo-Percastegui, S.E.; Powell, G. Habitat Use, Activity Patterns and Use of Mineral Licks by Five Species of Ungulate in South-Eastern Peru. J. Trop. Ecol. 2009, 25, 261–270. [Google Scholar] [CrossRef]
  121. Goulart, F.; Cáceres, N.; Graipel, M.; Tortato, M.; Ghizoni, I., Jr.; Oliveira-Santos, L. Habitat Selection by Large Mammals in a Southern Brazilian Atlantic Forest. Mamm. Biol. 2009, 74, 182–190. [Google Scholar] [CrossRef]
  122. Kiesecker, J.M.; Copeland, H.; Pocewicz, A.; McKenney, B. Development by Design: Blending Landscape-Level Planning with the Mitigation Hierarchy. Front. Ecol. Environ. 2010, 8, 261–266. [Google Scholar] [CrossRef]
  123. Sandker, M.; Campbell, B.M.; Ruiz-Pérez, M.; Sayer, J.A.; Cowling, R.; Habtemariam, K.; Knight, A. The Role of Participatory Modeling in Landscape Approaches to Reconcile Conservation and Development. Ecol. Soc. 2010, 15, 13. [Google Scholar] [CrossRef]
  124. Young, J.C.; Marzano, M.; White, R.M.; McCracken, D.I.; Redpath, S.; Carss, D.; Quine, C.; Watt, A. The Emergence of Biodiversity Conflicts from Biodiversity Impacts: Characteristics and Management Strategies. Biodivers. Conserv. 2010, 19, 3973–3990. [Google Scholar] [CrossRef]
  125. McShane, T.O.; Hirsch, P.D.; Trung, T.C.; Songorwa, A.N.; Kinzig, A.; Monteferri, B. Hard Choices: Making Trade-Offs between Biodiversity Conservation and Human Well-Being. Biol. Conserv. 2011, 144, 966–972. [Google Scholar] [CrossRef]
  126. Veíssimo, D. Influencing Human Behaviour: An Underutilized Tool for Biodiversity Management. Conserv. Evid. 2013, 10, 29–31. [Google Scholar]
  127. Young, J.C.; Jordan, A.; Searle, K.R.; Butler, A.; Chapman, D.S.; Simmons, P. Does Stakeholder Involvement Really Benefit Biodiversity Conservation. Biol. Conserv. 2013, 158, 359–370. [Google Scholar] [CrossRef]
  128. Young, J.C.; Jordan, A.; Searle, K.R.; Butler, A.; Simmons, P.; Watt, A.D. Framing Scale in Participatory Biodiversity Management May Contribute to More Sustainable Solutions. Conserv. Lett. 2013, 6, 333–340. [Google Scholar] [CrossRef]
  129. Dilkina, B.; Houtman, R.; Gomes, C.P.; Montgomery, C.A.; McKelvey, K.S.; Kendall, K. Trade-Offs and Efficiencies in Optimal Budget-Constrained Multispecies Corridor Networks. Conserv. Biol. 2017, 31, 192–202. [Google Scholar] [CrossRef]
  130. Keesstra, S.; Nunes, J.; Novara, A.; Finger, D.; Avelar, D.; Kalantari, C. The Superior Effect of Nature Based Solutions in Land Management for Enhancing Ecosystem Services. Sci. Total Environ. 2018, 610–611, 997–1009. [Google Scholar] [CrossRef]
  131. Peterson, D.L.; Miller, C.L.; Joyce, L.A.; Furniss, M.J.; Halofsky, J.E.; Neilson, R.P. Responding to Climate Change in National Forests: A Guidebook to Developing Adaptation Options; U.S. Department of Agriculture Forest Service, Pacific Northwest Research Station: Portland, OR, USA, 2011; p. 109.
  132. Schwartz, M.W. Using Niche Models with Climate Projections to Inform Conservation Management Decisions. Biol. Conserv. 2012, 155, 149–156. [Google Scholar] [CrossRef]
  133. Faleiro, F.V.; Machado, R.B.; Loyola, R.D. Defining Spatial Conservation Priorities in the Face of Land-Use and Climate Change. Biol. Conserv. 2013, 158, 248–257. [Google Scholar] [CrossRef]
  134. Di Minin, E.; Slotow, R.; Hunter, L.; Pouzols, F.; Toivonen, T.; Verburg, P. Global Priorities for National Carnivore Conservation under Land Use Change. Sci. Rep. 2016, 6, 23814. [Google Scholar] [CrossRef]
  135. Fick, S.E.; Higmans, R. WorldClim 2: New 1-Km Spatial Resolution Climate Surfaces for Global Land Areas. Int. J. Climatol. 2017, 37, 4302–4315. [Google Scholar] [CrossRef]
  136. Venter, O.; Sanderson, E.W.; Magrach, A.; Allan, J.; Beher, J.; Jones, K.; Possingham, H.; Laurance, W.; Wood, P.; Fekete, B.; et al. Global Terrestrial Human Footprint Maps for 1993 and 2009. Sci. Data 2016, 3, 160067. [Google Scholar] [CrossRef] [PubMed]
  137. Venter, O.; Sanderson, E.W.; Magrach, A.; Allan, J.; Beher, J.; Jones, K.; Possingham, H.; Laurance, W.; Wood, P.; Fekete, B.; et al. Sixteen Years of Change in the Global Terrestrial Human Footprint and Implications for Biodiversity Conservation. Nat. Commun. 2016, 7, 12558. [Google Scholar] [CrossRef]
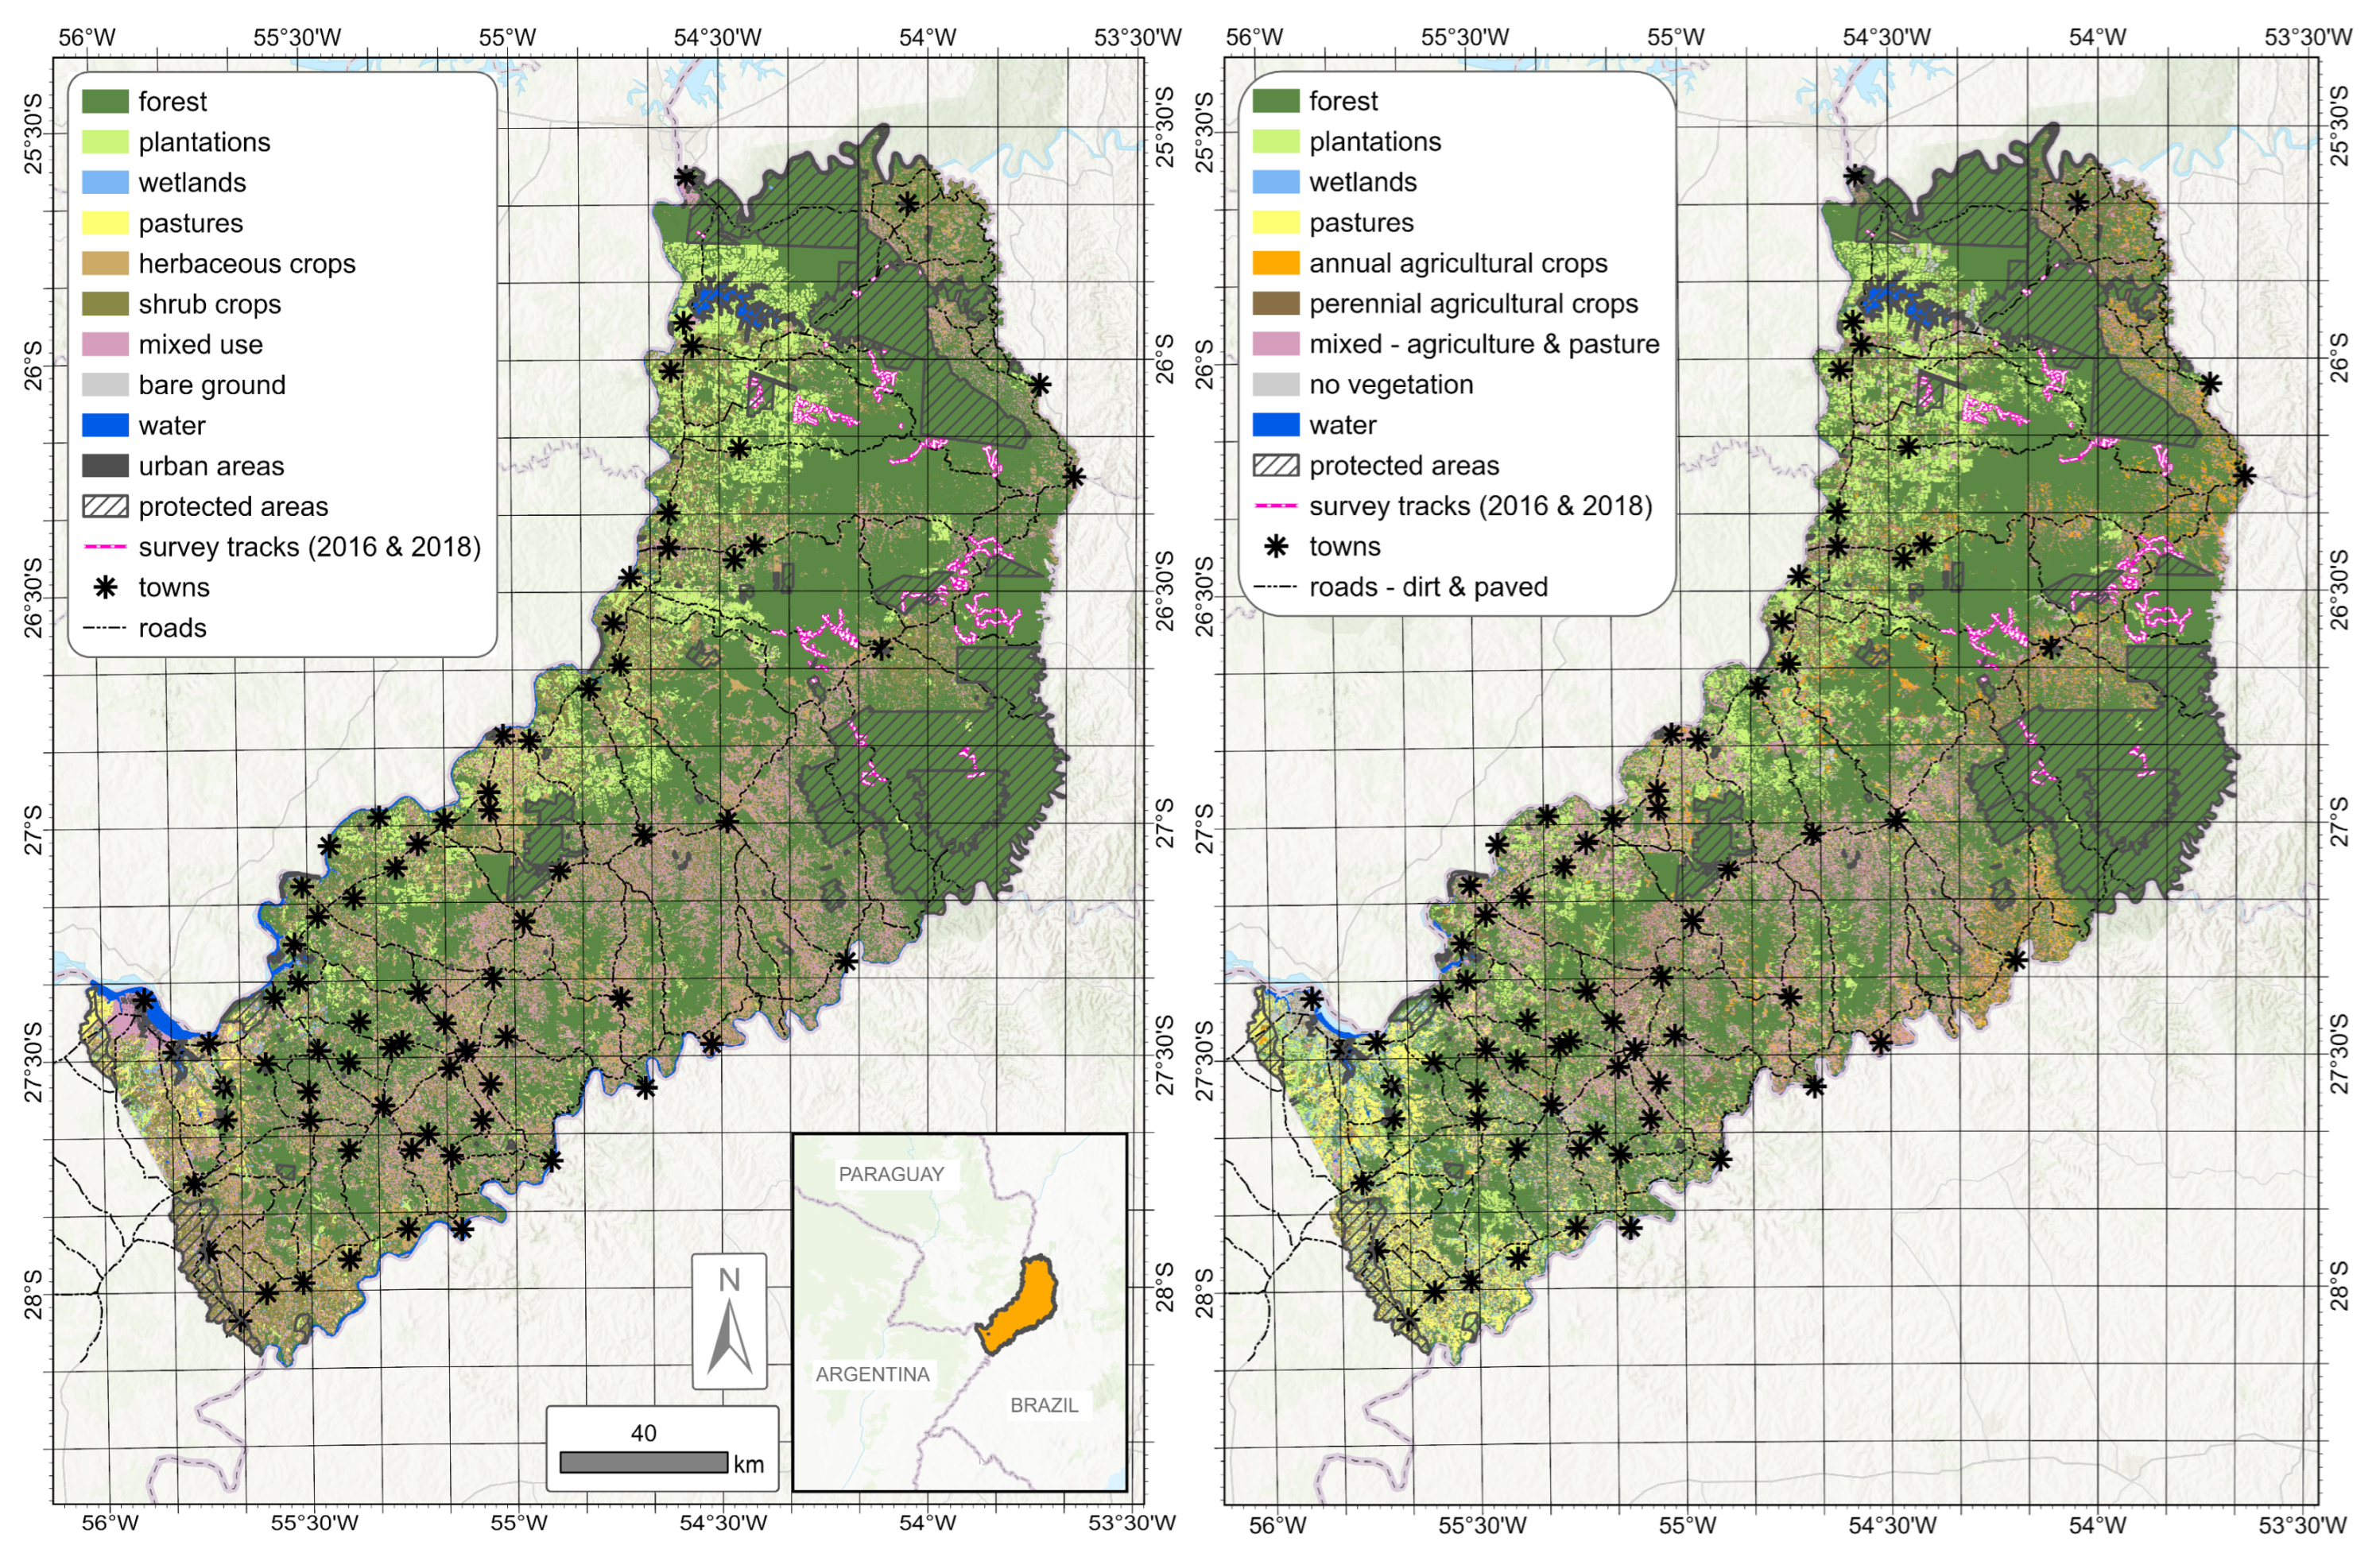
Figure 1. Map of Misiones, Argentina, with detection dog survey routes (2016 and 2018) in the northern-central zone shown relative to protected areas, major roads, towns, and the two land-use raster grids used in spatial analyses. (left): Land use was derived from a mosaic of Landsat-8 TM (Thematic Mapper) satellite images from 2015 [43]. (right): Land use was derived using the automated classification of satellite images from 2018 [70].
Diversity 17 00748 g001
Figure 2. A summary of the binary prediction for the proportion (%) of total suitable habitat (marginal plus optimal) in the northern-central zone of Misiones, Argentina. Each model, Model 1 (left) and Model 2 (right), includes the three species-specific ecological niche models (tapir, white-lipped peccary, and collared peccary) and the potential species richness (PSR) that quantifies the overlap (0–3 species) among those areas defined as suitable for each species. The latter is only represented as a summary of the species-specific binary predictions of habitat suitability.
Diversity 17 00748 g002
Figure 3. Proportion (% on y-axis) of habitat relative to the total area defined as suitable in the species-specific ecological niche models (ENM) across the approximately 1.5 million ha in the northern-central zone in Misiones, Argentina. Those values < 1% are not reported. Each species has two ENMs reported: Model 1 (top) and Model 2 (bottom).
Diversity 17 00748 g003aDiversity 17 00748 g003b
Figure 4. Using potential species richness to evaluate the proportion (% on y-axis) of unsuitable (0 species) and suitable habitat (1–3 species) across the approximately 1.5 million ha in the northern-central zone in Misiones, Argentina (N-C zone ALL), located outside of protected areas (N-C zone OUTSIDE PA), and captured by approximately 400,000 ha multispecies biological corridor modelled by DeMatteo et al. [52]. Each species has two ENMs compared: Model 1 (left) and Model 2 (right).
Diversity 17 00748 g004
Figure 5. Proportion (% on y-axis) of native forest and modified environments for the 1.5 million ha in the northern-central (N-C) zone of Misiones, Argentina, as well as the proportion (%) in the approximately 400,000 ha multispecies biological corridor modelled by DeMatteo et al. [52]. Those values ≤ 1% are not reported. In Model 1 (top), this corresponds to wetlands, pastures, naturally bare ground, water bodies (natural & artificial), and urban infrastructure. In Model 2 (bottom), this corresponds to wetlands, pastures, no vegetation, and water.
Diversity 17 00748 g005
Figure 6. The potential species richness is represented as a summary of the proportion (%) of marginal and optimal habitats defined as suitable in the northern-central zone, for Model 1 (left) and Model 2 (right). A visual reference is provided for the 400,000 ha multispecies biological corridor modelled by DeMatteo et al. [52]. For each model, the overlap of marginal and optimal habitats was grouped into five classes: 0 species (unsuitable habitat), 1–2 species with marginal habitat, 1–2 species with optimal habitat, 2 species with optimal habitat, and 3 species with optimal habitat. Each level is then categorized by the type of land management required to optimize the long-term survival of species in the corridor: habitat restoration, habitat protection, or a combination of both strategies.
Diversity 17 00748 g006
Figure 7. Potential species richness (PSR) is subdivided into marginal and optimal habitats based on habitat suitability [number of species (sp.)/habitat type]. For each model [Model 1 (top) and Model 2 (bottom)] three summaries are reported: (1) the proportion (% on y-axis) of suitable habitat across the range of PSR within the approximately 1.5 million ha of the northern-central (N-C) zone in Misiones, Argentina, (2) the proportion (%) of PSR found within approximately 400,000 ha multispecies biological corridor modelled by DeMatteo et al. [52], and (3) the proportion (%) of PSR found in the ‘connectors’ (lowest PSR and habitat integrity) in this corridor. While marginal habitat is exclusive, within optimal habitat, there are varying levels of marginal habitat that overlap. To simplify the categories, only the number of species for optimal habitat is reported.
Diversity 17 00748 g007
Figure 8. The potential species richness (PSR) is represented as a summary of the proportion (%) of marginal and optimal habitats defined as suitable in the northern-central zone for Model 1 (left) and Model 2 (right). Presented is the overlap of the PSR with defined marginal and optimal habitats for each model with the DeMatteo et al. [52] corridor, specifically the connectors or those areas defined as having the lowest levels of PSR and habitat integrity. Areas in the connectors are determined by the type of habitat (marginal or optimal), the number of overlapping species (1–3), and whether habitat restoration and/or protection are needed. The remainder of the corridor is referred to as the core buffer, as it corresponds to zones delimited by DeMatteo et al. [52].
Diversity 17 00748 g008
Table 1. Summary of the predictor variables tested and used in the two species-specific ecological niche models (ENMs). Model 1 used land use derived from a mosaic of Landsat-8 TM (Thematic Mapper) satellite images from 2015 [43] and Model 2 used land use derived from the automated classification of satellite images from 2018 [70]. The list includes all predictor variables used in the development of the species-specific ENMs, as well as whether each variable had a focal statistic frequency operation (%) at a species-specific neighborhood scale applied and if it was ultimately included in the final model.
VariableFrequencyFinal Model
Model 1:
Native forest yes yes
Plantations of pine & eucalyptus yesyes
Wetlands yesno
Pastures yesno
Herbaceous crops of tobacco & maize yesyes
Shrub crops of tea & yerba mate yesyes
Mixed crops with small patches of shrubs & herbaceous plants yesyes
Naturally bare ground yesno
Water bodies (natural & artificial)yesno
Urban and infrastructure yesyes
Landscape heterogeneity index yesyes
Land use type noyes
Model 2:
Native forestyesyes
Forest plantationsyesyes
Wetlandsyesno
Pasturesyesyes
Annual agricultural cropsyesyes
Mix of agriculture and pasturesyesyes
No vegetationyesno
Wateryesyes
Perennial agricultural cropsyesyes
Landscape heterogeneity indexyesyes
Land use type noyes
Table 2. A summary of the proportion (%) of suitable habitat, as determined within each species-specific ecological niche model (ENM), at three scales. The northern-central (N-C) zone ALL refers to the proportion (%) of suitable habitat across the approximately 1.5 million ha in the N-C zone in Misiones, Argentina, including overlap with existing protected areas (approximately 540,000 ha). In contrast, the N-C Zone OUTSIDE PA refers to the percentage (%) of total suitable habitat that excludes areas overlapping with existing protected areas. The corridor relates to the proportion (%) of total suitable habitat captured by the approximately 400,000 ha multispecies biological corridor modeled by DeMatteo et al. [52]. For each species the total suitability, as defined by the binary threshold, plus the division of this category into marginal and optimal habitat, is reported. Each species has two ENMs reported: Model 1 and Model 2.
ENMN-C Zone ALLN-C Zone OUTSIDE PACorridor
TotalMarginalOptimalTotalMarginalOptimalTotalMarginalOptimal
TapirModel 152.7336.1716.5637.9125.1612.7551.5231.0020.52
Model 251.3138.1513.1637.1125.2611.8559.3438.4620.88
White-lipped PeccaryModel 169.8040.8528.9559.0834.1324.9578.0130.7747.24
Model 262.5937.6824.9151.9127.8324.0869.3130.4738.84
Collared PeccaryModel 160.2914.1746.1245.5517.5827.9767.8620.2447.62
Model 263.2916.0847.2150.8920.0530.8464.3617.7046.66
Disclaimer/Publisher’s Note: The statements, opinions and data contained in all publications are solely those of the individual author(s) and contributor(s) and not of MDPI and/or the editor(s). MDPI and/or the editor(s) disclaim responsibility for any injury to people or property resulting from any ideas, methods, instructions or products referred to in the content.