Article

The Complete Chloroplast Genome of the Green Algae Desmodesmus spinosus (Chodat) E.Hegewald: Genome Structure, Phylogeny, and Comparative Analysis

1
College of Fisheries, Neijiang Normal University, Neijiang 641004, China
2
Conservation and Utilization of Fishes Resources in the Upper Reaches of the Yangtze River, Key Laboratory of Sichuan Province, Neijiang 641000, China
3
Department of Biotechnology and Genetic Engineering, Faculty of Life Sciences, University of Development Alternative, Dhaka 1209, Bangladesh
*
Authors to whom correspondence should be addressed.
These authors contributed equally to this work.
Diversity 2025, 17(10), 721; https://doi.org/10.3390/d17100721
Submission received: 19 September 2025 / Revised: 12 October 2025 / Accepted: 15 October 2025 / Published: 16 October 2025
(This article belongs to the Section Freshwater Biodiversity)

Abstract

Desmodesmus spinosus (Chodat) E.Hegewald is a common freshwater green microalgae widely distributed in various aquatic environments. Owing to its pollution tolerance and rapid growth characteristics, it is often used in bioremediation and biofuel studies. Here, we report the draft chloroplast (cp) genome of this species here for the first time to facilitate its genomic features and phylogenetic position in Scenedesmaceae. The whole chloroplast genome was 167, 203 base pairs in length, with 104 annotated genes, including 69 protein-coding genes, 29 tRNAs, and 6 rRNAs. The introns identified among them were: rbcL, psaA, and petD, each containing 1 intron; atpB with 2 introns; and psbA with 3 introns. A total of 106 SSRs with 16 motif classes, 50 dispersed repeats, and 17 long tandem repeats were identified in this genome. A total of 221 RNA-editing sites were distributed across 46 protein-coding genes in this genome. In IR boundaries, the position of genes was found to be remarkable in differentiating species, such as trnH and ycf1 at JLB and JSA, cemA, psbC, and rpl22 at JS, and cemA, psbC and rrs at JSB. Notably, psbA-rps11, psbH-psbK, and trnR-ACG-psbM were highly variable regions. Phylogenetic analysis revealed a sister relationship between D. spinosus and D. abundans. Chloroplast genomic data and findings from phylogenetic studies of D. spinosus could provide useful information and shed light on in-depth studies on the evolution pattern of the understudied species, as well as that of Scenedesmaceae.

1. Introduction

Green algae from Scenedesmaceae belong to Sphaeropleales (Order), Chlorophyceae (Class), Chlorophyta (Division). It has several species, including a subfamily of Coelastroideae that contains Coelastrella and Coelastrum, a subfamily of Desmodesmoideae that contains Desmodesmus (Chodat) S.S.An, T.Friedl & E.Hegewald, a subfamily of Scenedesmoideae that includes Scenedesmus and Truncatulus, and a distinct genus of Pediludiella, according to the World register of Marine Species (WoRMs, https://www.marinespecies.org/aphia.php?p=taxdetails&id=160541; accessed on 5 January 2025). In addition to the genus listed by WoRMS, from NCBI, Scenedesmaceae also includes the following: Acutodesmus, Asterarcys, Chodatodesmus, Coelastropsis, Comasiella, Coronastrum, Crucigenia, Didymocystis, Dimorphococcus, Enallax, Flechtneria, Hariotina, Hylodesmus (also named as one genus of higher plant), Komarekia, Neodesmus, Pectinodesmus, Pectodictyon, Pediludiella, Protodesmus, Pseudodidymocystis, Pseudospongiococcum, Scotiellopsis, Tetradesmus, Tetranephris, Verrucodesmus, and Westella [1]. Scenedesmaceae species have many biofunctional uses, including MACC-401, which can be used to produce biomass and lipids [2,3]. Some Scenedesmaceae species can produce biodiesel fuel [4], such as Desmodesmus communis (E.Hegewald) E.Hegewald, which can be used to yield polyhydroxybutyrate (PHB) [5]. In addition to biomass, interest molecules, namely lipids and carbohydrates, have also been reported in species such as Desmodesmus, Tetradesmus, and Scenedesmus, revealing their potential for biofuels in the biotechnology industry [6,7,8,9]. Under non-optimal conditions, particularly fluctuations in pH and salinity, species like Desmodesmus sp. KNUA231 has great potential for third-generation bioenergy production [10]. Moreover, Desmodesmus species have strong inhibitory effects on microcystis blooms [11].
Desmodesmus spinosus (Chodat) E.Hegewald (Chlorophyceae, Scenedesmaceae, Scenedesmoideae) was listed as new according to the results of ITS-2 rDNA sequencing, and Desmodesmus spinosus has a basionym of Scenedesmus spinosus [12,13], which also has synonyms of Desmodesmus quadricauda, Desmodesmus abundans, Desmodesmus subspicatus, Desmodesmus furcoasus, and Desmodesmus multicauda, and was seldom been studied for characterization of the chloroplast genome (cp). Genomic data are used to establish phylogenetic relationships and outline species boundaries is a fundamental practice, along with morphological characteristics, in taxonomy for classifying and naming organisms [1]. Although genome sequencing of the D. spinosus cp genome may not serve as direct reference material, it is noteworthy for numerous details. For example, cp genomes are conserved in terms of organization, but existing variations offer crucial markers for differentiating species and are useful for phylogenetic and evolutionary studies, which are essential for biodiversity conservation. Thus, complete sequencing and analysis of the cp genome is a powerful tool for resolving taxonomic ambiguities across plant lineages, such as those present in Scenedesmaceae [8,13]. Moreover, the genes in cp genomes involved in photosynthesis and stress response, along with their characterization, could provide insights into adaptation to specific environmental conditions, informing biotechnological applications and conservation strategies.

2. Materials and Methods

2.1. Plant Materials, DNA Extraction and Genome Sequencing

A sample of algae was collected from a lake at Neijiang Normal University (N 29°36′44.23″, E 105°6′2.10″) in Sichuan Province, China. BG-11 medium (100 mL) was used to inoculate the microalgae, which were then incubated at 25 °C with a 12:12 light (white fluorescent lamp at 3000 lux)/dark cycle for one week to promote growth. After reaching the stationary growth phase, the culture was harvested, centrifuged (4032× g for 5 min), and the supernatant was removed. An antibiotic mixture (penicillin–streptomycin–neomycin (PSN); Sigma Aldrich, St. Louis, MO, USA) was added to a final concentration of 100 μg mL−1. The resulting pellet was cultured on BG-11 agar medium to develop distinct single colonies (Figure 1). This Desmodesmus spinosus alga was identified by the fact that its population is usually composed of four cells arranged in a straight line in a flat shape. The upper and lower ends of the outer cells had straight or curved spiny protrusions that were inclined outward. The middle section of the outer wall of the population has 1–3 short spines, and the middle cells have no spines or short spines at both ends [13]. Molecular identification was conducted in later stages through comparative analysis in this study to distinguish it from other Desmodesmus species. Total genomic DNA was extracted using suspension, lysis, isolation, cleaning, elution, and cleanup from the modified cetyltrimethylammonium bromide (CTAB) method [14] and stored in the Molecular Biology Lab of Neijiang Normal University, Neijiang, Sichuan, China.

2.2. De novo Chloroplast Genome Assemblies

The short-reads of D. spinosus chloroplast genome were sequenced by a genomic library with insert sizes of 260 bp, which were prepared and sequenced on an Illumina Hi-Seq 2500 platform. Approximately 8.72 G of raw reads were obtained and filtered using the program Trimmomatic (Version 0.39) [15]. The filtered reads were assembled into the chloroplast genome using NOVOPlasty (version 4.3.1) [16].

2.3. Genome Annotation and Visualization

Annotation was conducted using GeSeq with 3rd Party Stand-Alone Annotators from Chloë (version 0.1.0) and tRNA annotation from tRNAscan-SE (version 2.0.7) [17]. The annotation was followed by a manual check compared with the information of NCBI with the reference genome of Tetradesmus obliquus (Accession number: KX756229) and submitted to the NCBI database with GenBank accession number PV295633. The chloroplast genome was visualized using OGDRAW version 1.3.1 [18].

2.4. Codon Usage Bias, Simple Sequence Repeat, Long Tandem Repeat and Dispersed Repeat Analysis

CPGAVAS2 (an integrated Plastome Annotator and Analyzer; http://47.96.249.172:16019/analyzer/home, accessed on 20 August 2025) is a web server used to generate reports on codon usage bias (CUB) [19]. The MicroSarellite identification tool (MISA, version v2.1; https://webblast.ipk-gatersleben.de/misa/index.php?action=1; accessed on 19 August 2025) was used for simple sequence repeat (SSR) locus analysis [20]. We set the parameters as follows: 1–10, 2–5, 3–4, 4–3, 5–3, 6–3, and 100 bp was fixed as the minimum distance between two SSRs. We calculated the long tandem repeats (LTR) using the online program ‘tandem repeat finder’ (TRF, https://tandem.bu.edu/trf/trf.html; accessed on 20 August 2025) using default parameter settings [21]. Dispersed Repeats (DR) were identified using the VMATCH tool with the following parameters: “-f -p -h 3 -l 30” in the web server CPGview (http://www.1kmpg.cn/cpgview; accessed on 20 August 2025) [22,23].

2.5. Predicting RNA-Editing Sites

We predicted RNA-editing sites in the cp genome of D. spinosus using a convolutional neural network (CNN) model-based tool called Deepred-mt [24]. We extracted the PCGs from this cp genome and inputted them into the Deepred-mt tool for prediction, considering threshold probability values greater than 0.9 as reliable results.

2.6. Comparative Analysis of cp Genomes

Including D. spinosus, a total of seventeen cp genome sequences from Scenedesmaceae were downloaded from NCBI. Subsequently, their basic genomic information was generated using Chloroplot (https://irscope.shinyapps.io/Chloroplot, accessed on 11 September 2025) and is tabulated in Table S1 [25]. For nucleotide diversity analysis (Pi), the cp genome sequences of Desmodesmus spinosus and Desmodesmus abundans, whole genome sequences available in the NCBI database, were aligned using the program MAFFT 7.388 [26]. During analysis, exclusion criteria were ambiguously aligned loci (‘N’) from aligned DNA sequences, and only unambiguous sequences were used for analysis. DnaSP v6 was used to identify hypervariable sites among Desmodesmus cp genomes through a sliding window analysis [27]. We compared the IR regions of all species via the web-based tool IRplus (https://irscope.shinyapps.io/IRplus/, accessed on 3 September 2025) to visualize the IR-SC boundaries and their gene orientations [28].

2.7. Phylogenetic Analysis

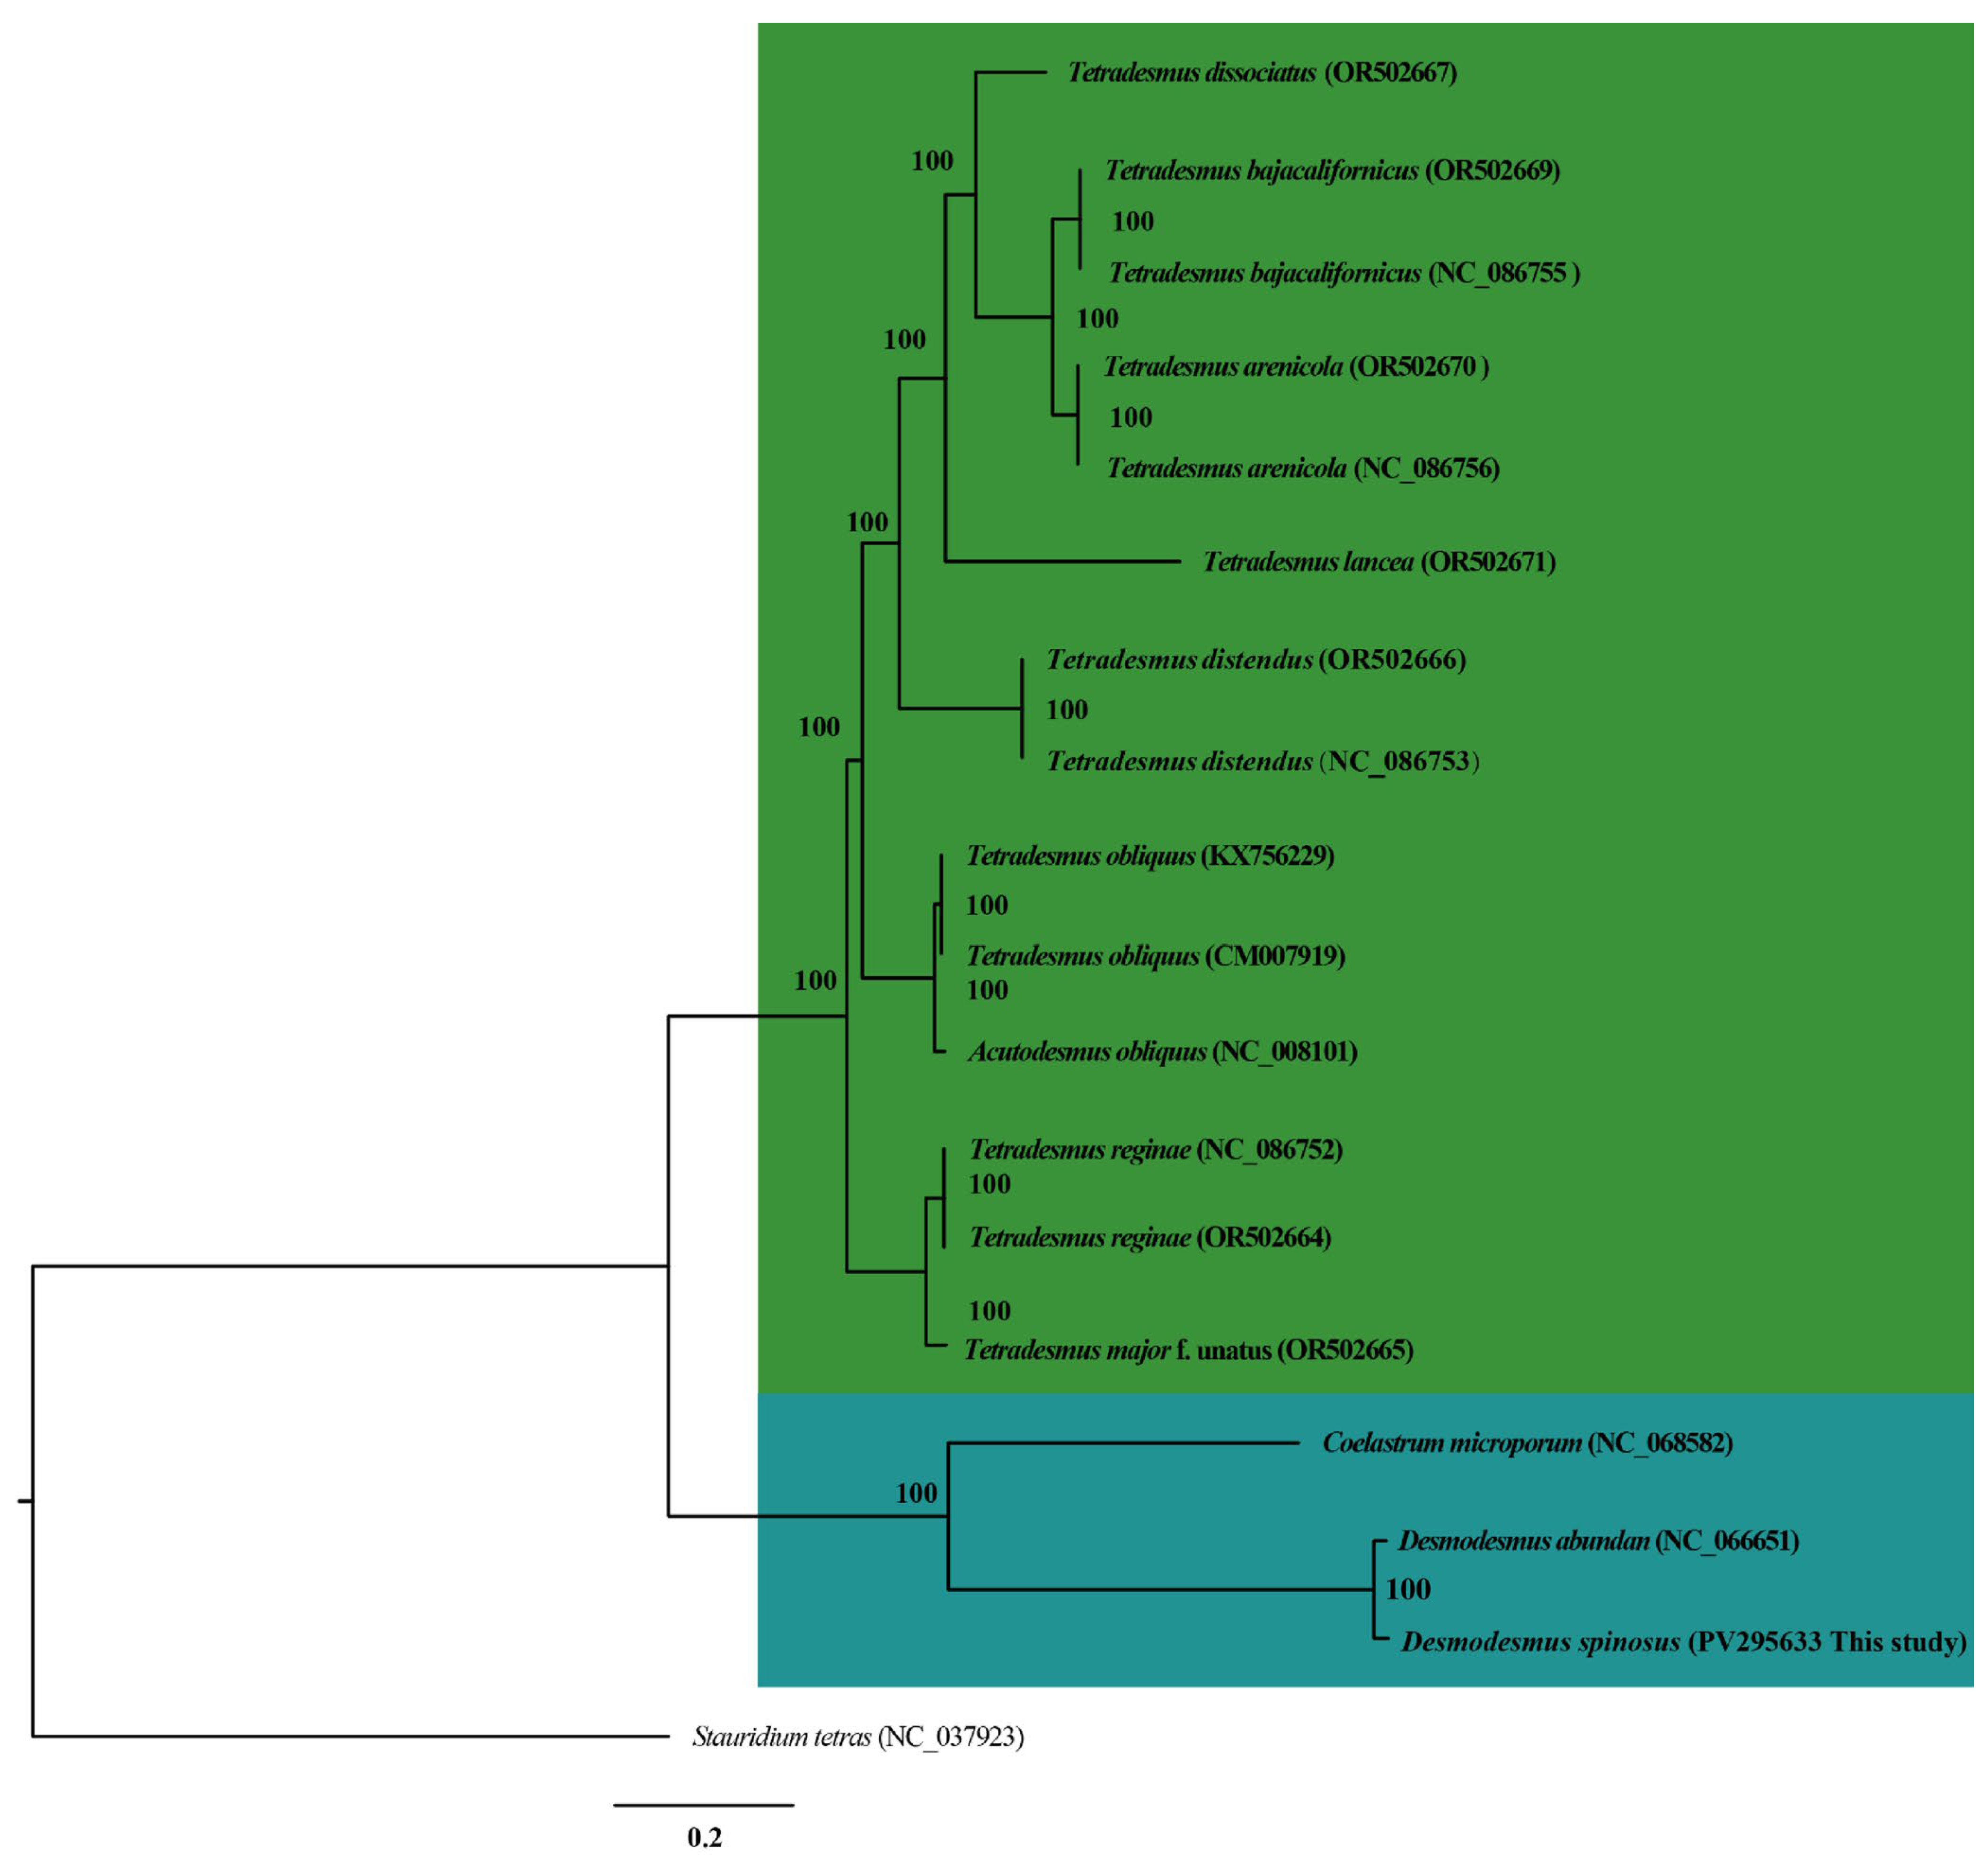
To further determine the phylogenetic position of D. spinosus within Scenedesmaceae, complete cp genomes of 11 species were analyzed, and Stautridiun tetras (NC_037923) was chosen as an outgroup. Alignment and phylogenetic reconstructions were performed using the “build” function of ETE3 3.1.2 [29] as implemented on the GenomeNet (https://www.genome.jp/tools/ete/; accessed on 20 December 2024). Alignment was performed using MAFFT v6.861b with default options [30]. The ML tree was inferred using IQ-TREE 1.5.5 with ModelFinder and tree reconstruction [31]. Best-fit model according to BIC was K3Pu+I. Tree branches were tested by SH-like aLRT with 1000 replicates.

3. Results

3.1. Features of the cp Genome and Its Base Composition

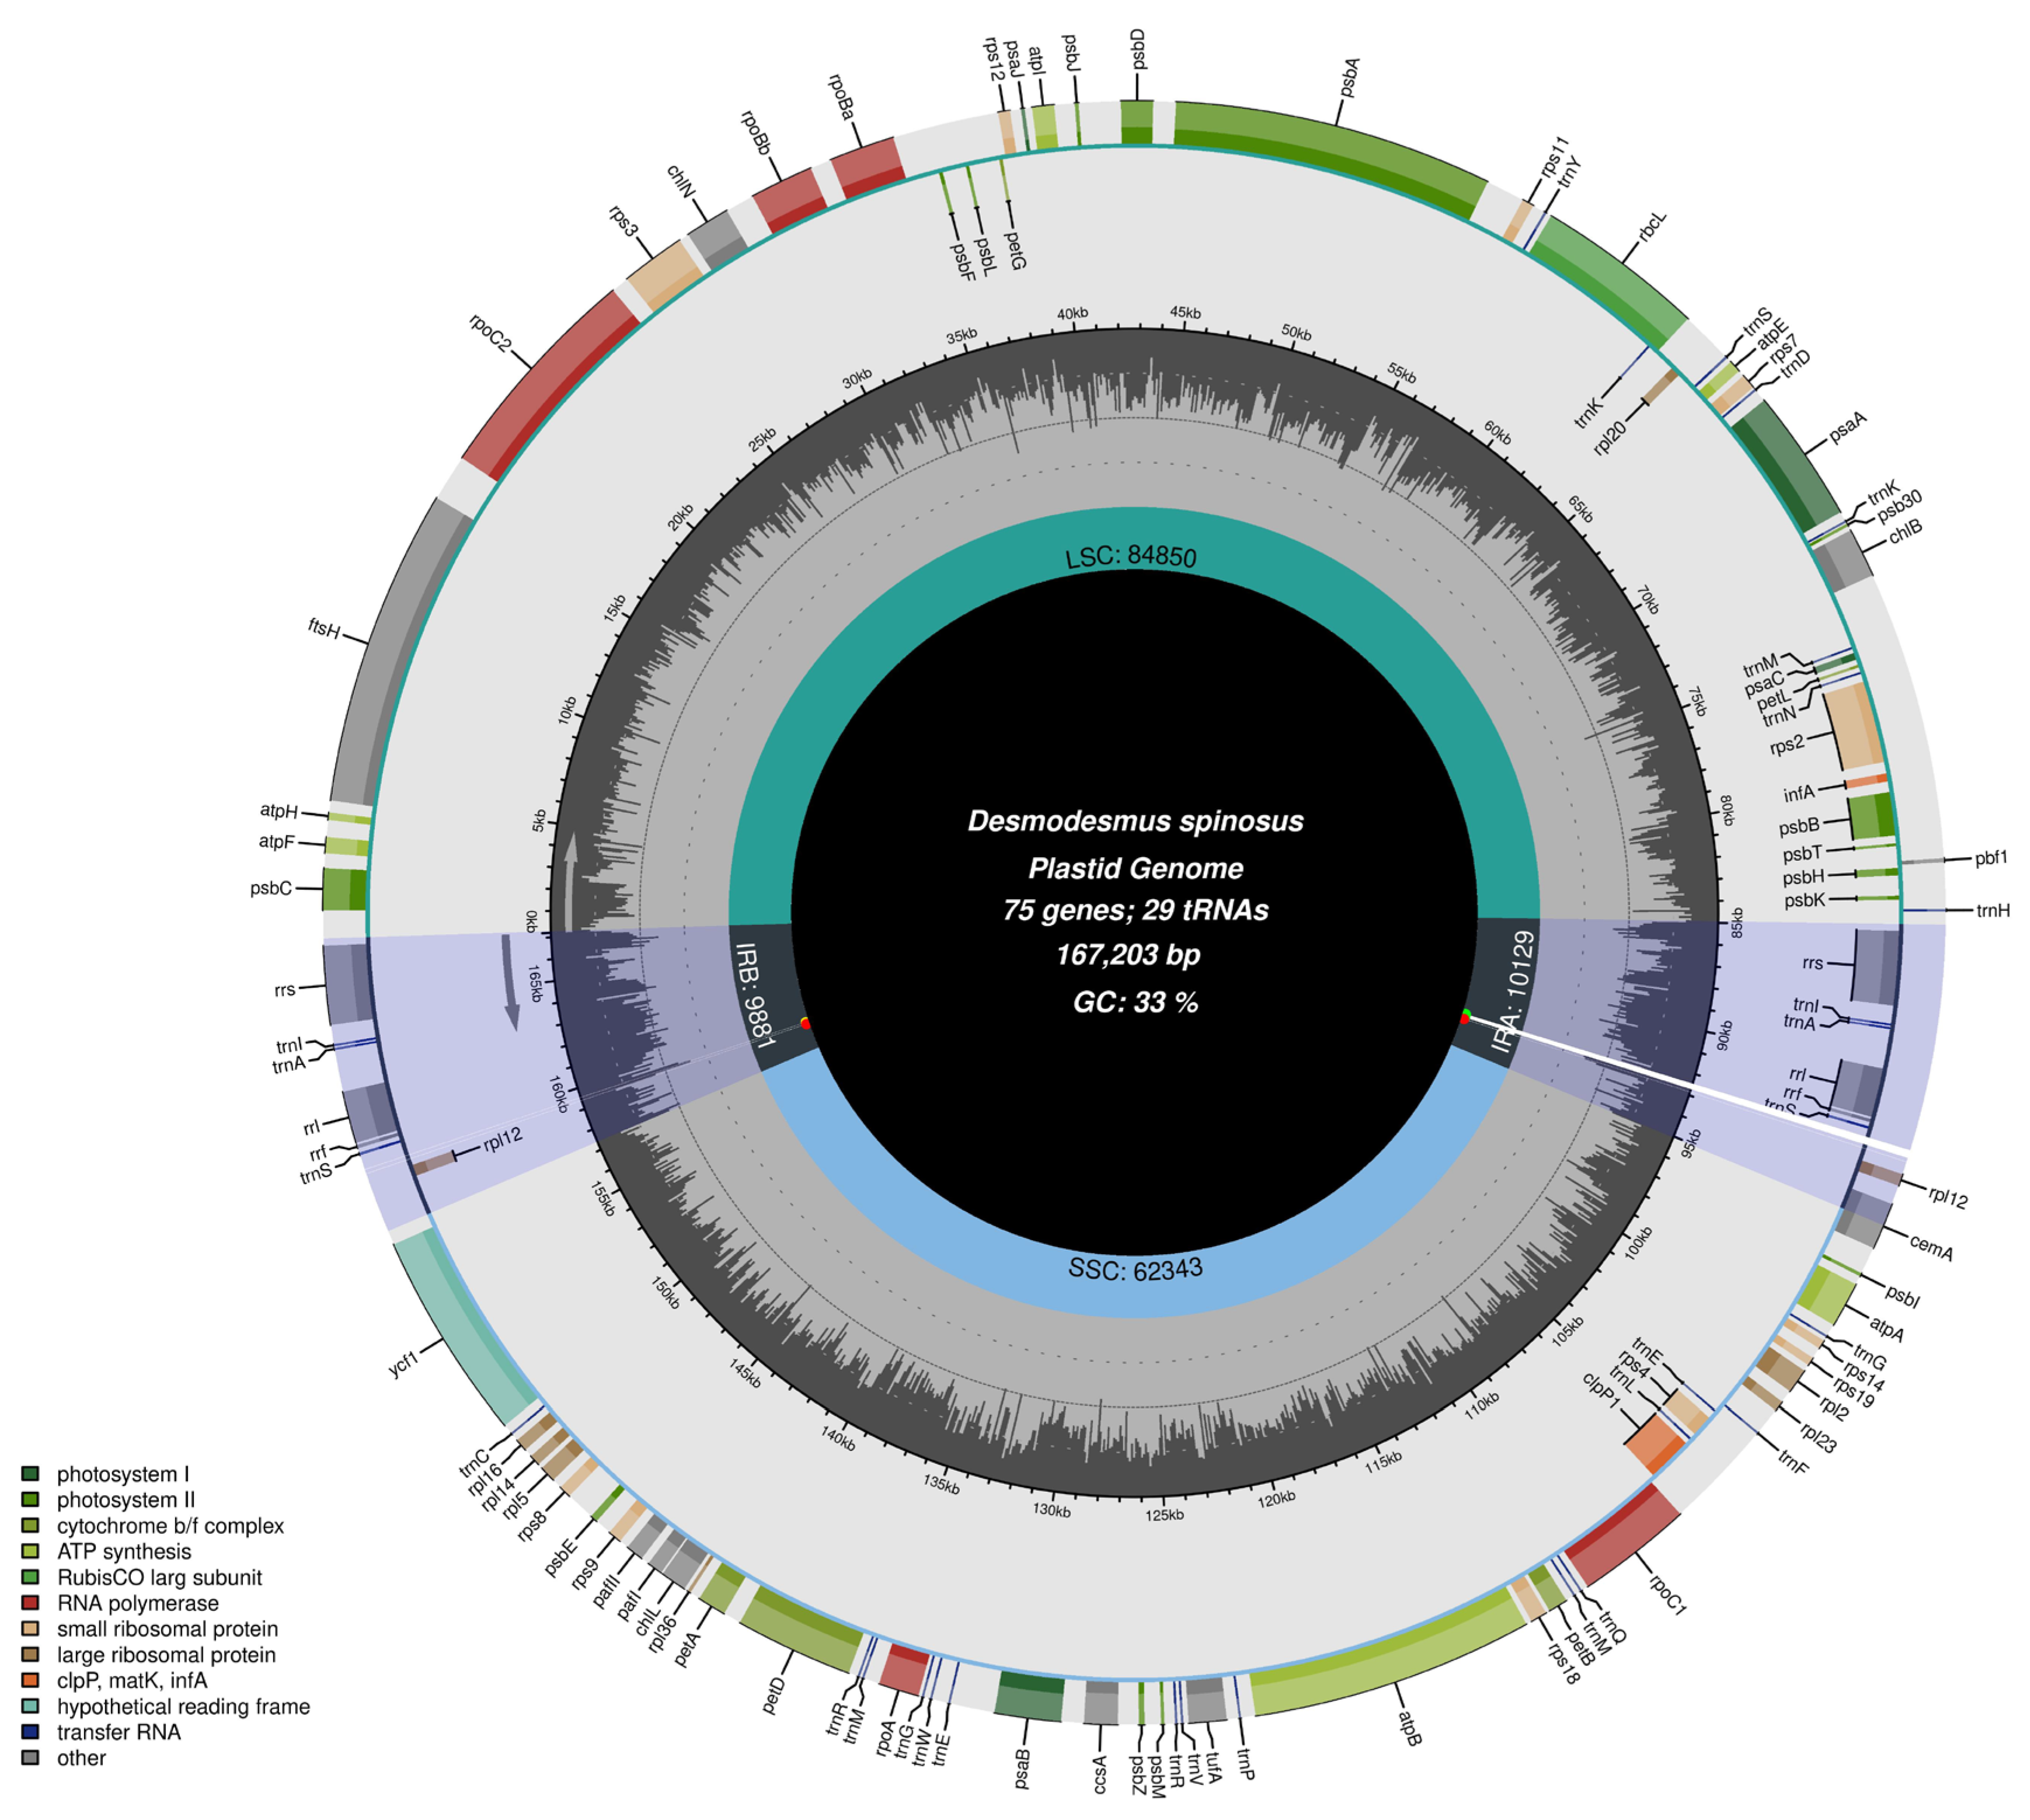
Similar to most Chlorophyta, the newly sequenced chloroplast genome of D. spinosus was 167, 203 bp in length and divided into typical quadripartite regions, including the 84, 850 bp of the large single-copy (LSC) region, 62, 343 bp of the small single-copy (SSC) region, and two inverted repeat (IR) regions: (i) IRA (10,129 bp) and IRB (9881 bp) (Figure 2). This genome was annotated with 104 genes, including 69 protein-coding genes (including one duplicated gene: rpl12), 29 tRNA genes (including seven duplicated genes: trnK-UUU, trnM-CAU, trnE-UUC, trnM-CAU, trnS-GCU, trnA-UGC, trnI-GAU), and duplicated ribosomal RNA genes of rrs, rrl and rrf.
The identified genes were categorized as photosynthesis-related genes (n = 36), self-replicating genes (n = 60), other genes (n = 7), and unknown genes (n = 1) (Table 1). Among these genes, five contained introns, of which three (rbcL, psaA and petD) contained one intron, atpB had two introns, and psbA had three introns, as revealed by their cis-splicing structural mapping (Table S2 and Figure S1). The overall GC content of the D. spinosus chloroplast genome was 33%. In the LSC, SSC and IR regions, the contents (%) of A, T, G and C ranged between 26.19–32.96, 26.19–36.15, 16.33–24.15 and 16.08–24.15, respectively. The GC% for LSC, SSC, IRA and IRB were 32.57, 31.40, 43.43 and 43.43, respectively (Table S3).

3.2. Diversity and Composition of SSR, LTR and DR

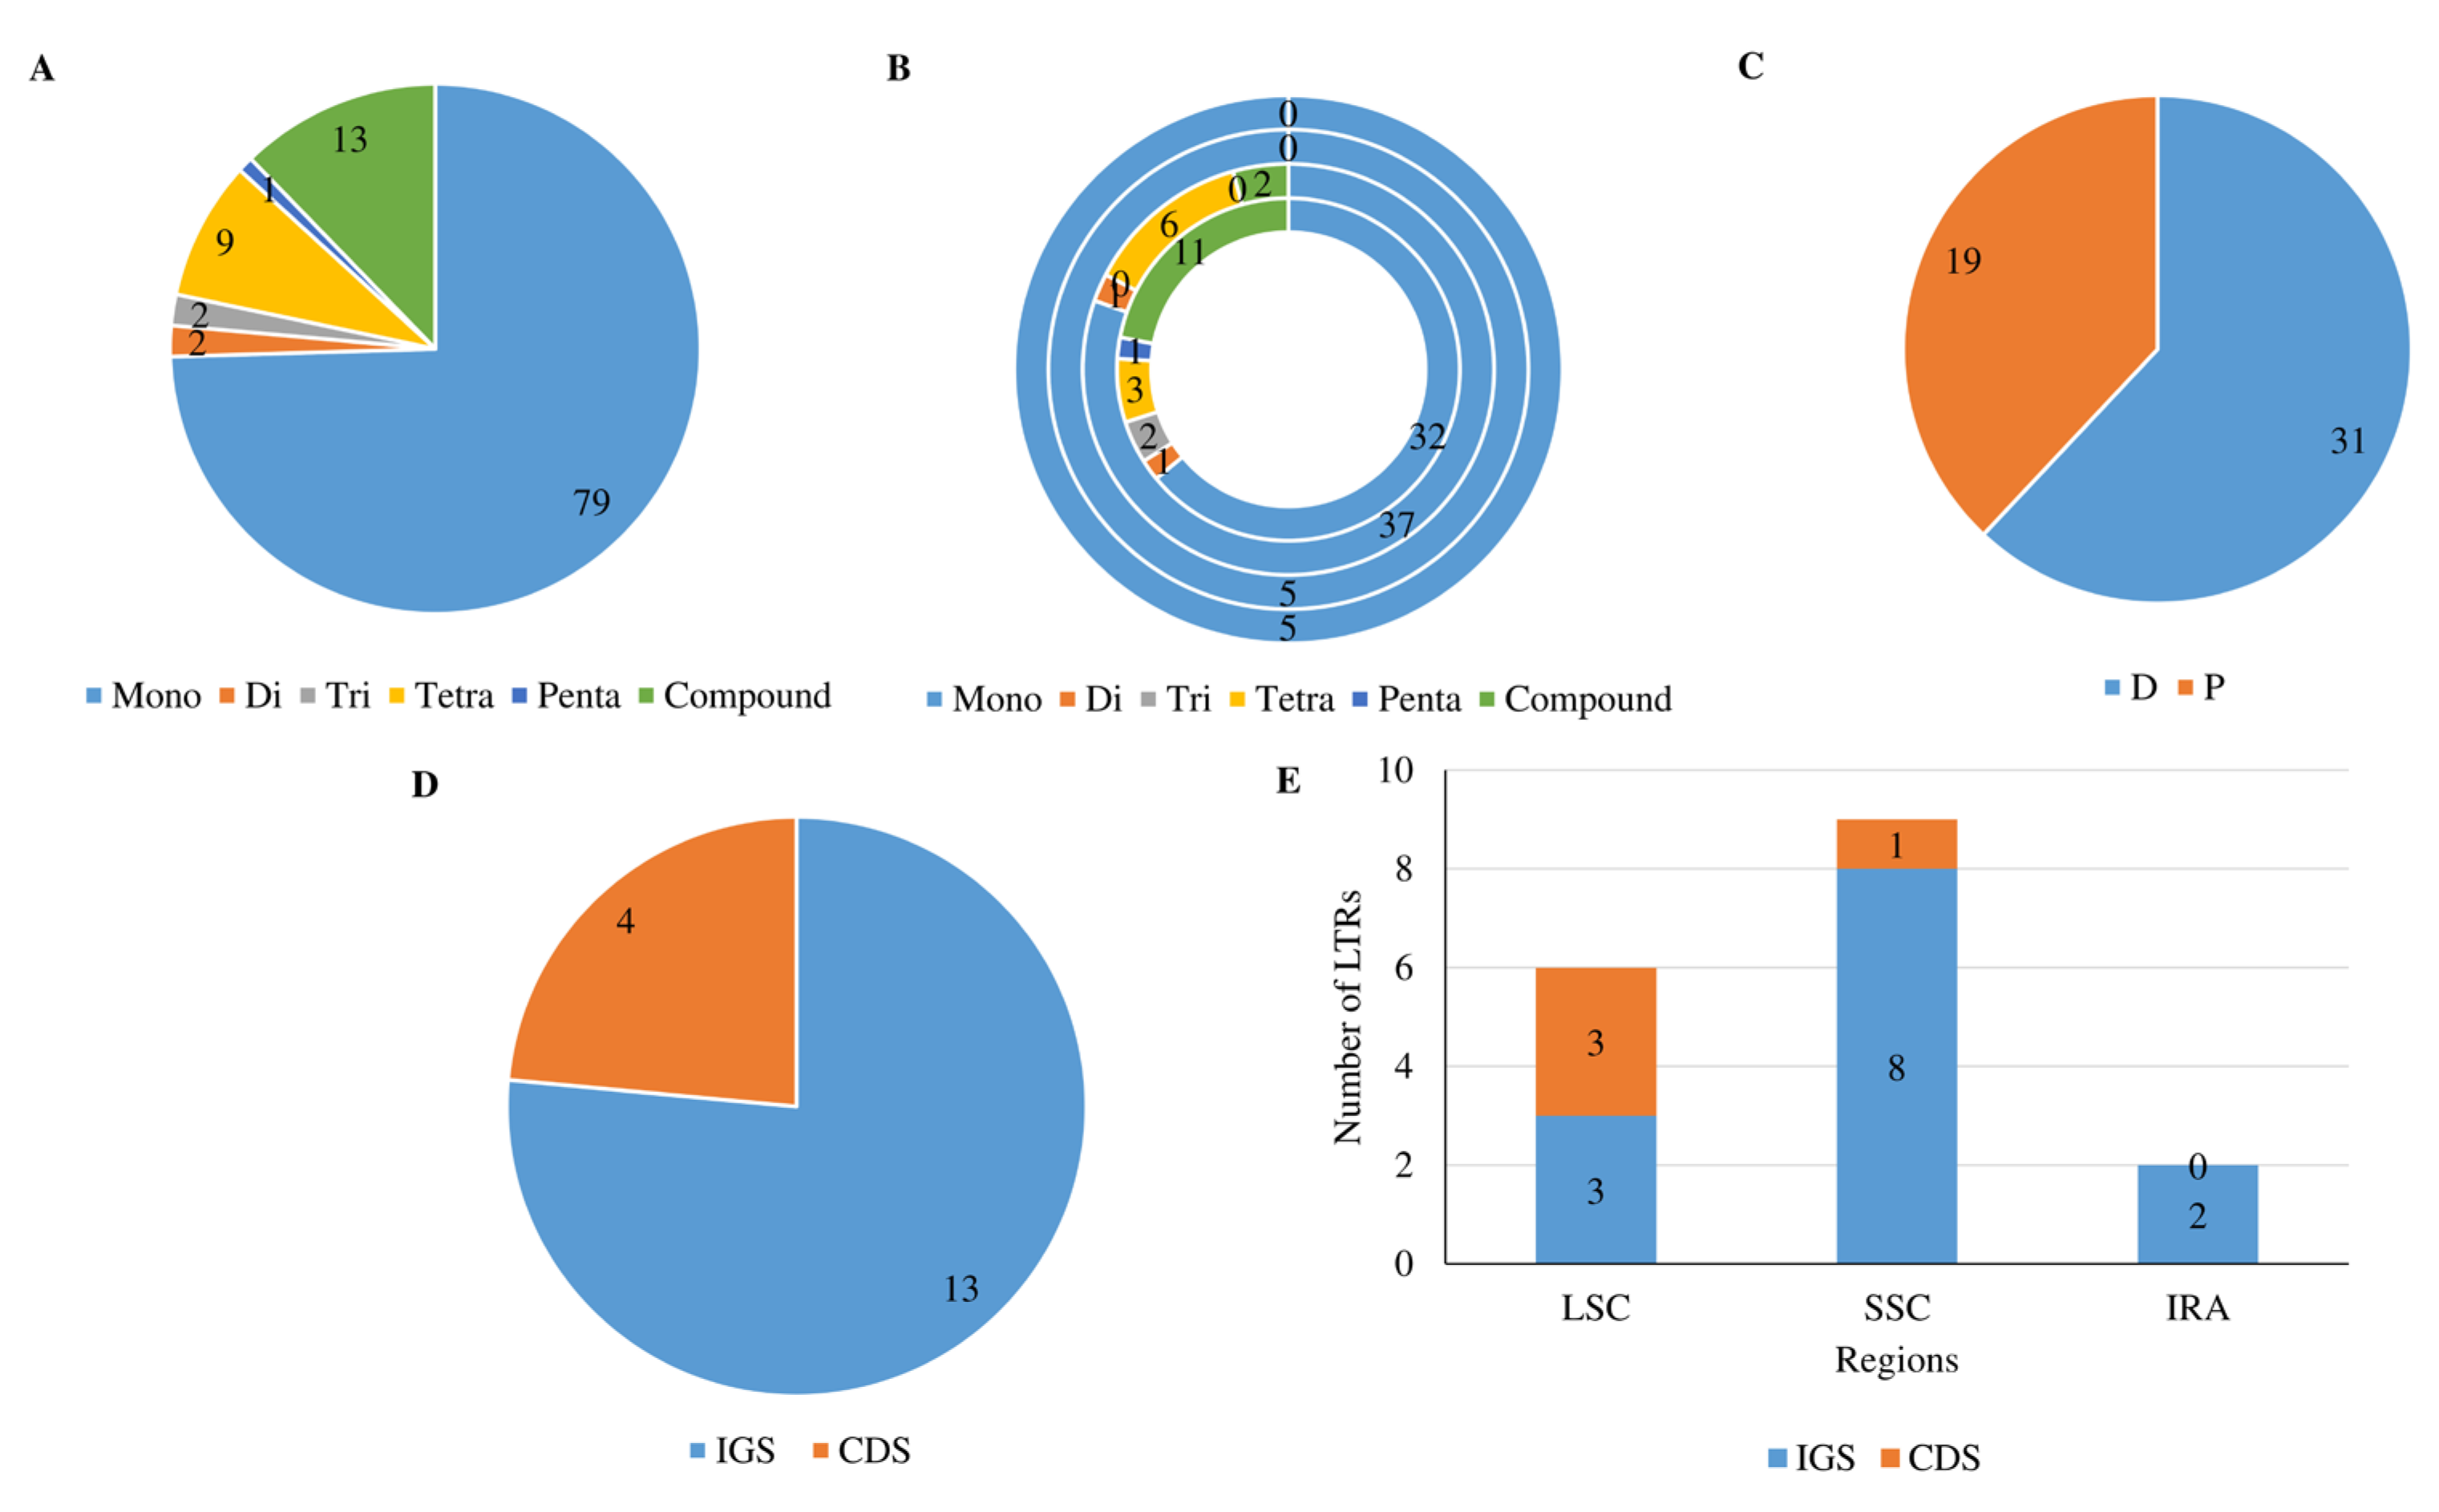
Microsatellite repeats, known as simple sequence repeats (SSRs), are composed of 1–6 bp repeat units as shorter tandem repeats that are generally dispersed in different regions of the cp genome. Three aspects of SSR are considered: repeat composition and its number, repeat motif class (mono-, di-, tri, etc.) and the sequence of the repeat motif. In total, 106 SSRs were found in the cp genome, with 79, 2, 2, 9, 1 and 13 mono-, di-, tri-, tetra-, penta- and compound-repeat types, respectively (Figure 3A–E).
The size (bp) of different repeats ranged from 10 to 18 for mono, 10 for di, 12 for tri and tetra, 15 for penta, and 27 to 226 for compound repeats (Figure 3A). For the LSC and SSC regions, monotypes had the highest number of repeats (32 and 7, respectively), and both IRA and IRB contained only monotypes (n = 5) (Figure 3B). For compound types, LSC and SSC were distributed as 11 and 2, respectively (Table S4). Moreover, motif class of these repeats was 16 types, where mono class was predominant and comprised as 39.84% and T 47.15% (Table S5A), and nine motif sequences (considering sequence complimentary) were revealed (Table S5B). Dispersed repeats (n = 50) were only found to be 31 and 19 matches for direct and palindromic repeats in this cp genome, respectively (Figure 3C, Table S5C). A total of 17 LTRs were observed in the genome, of which 13 were in the IGS region and four were in the CDS (Figure 3D; Table S5D). Among the CDS, three of our four LTRs were in the ftsH gene and one was in rpoC1. In LSC, three LTRs were found for both IGS and CDS regions, and SSC has eight and one, respectively, whereas the IRA region had only two LTRs and IRB contained none (Figure 3E).

3.3. Prediction of RNA-Editing Sites

In the pursuit of a comprehensive exploration of the cp genome, a key aspect is the identification of RNA-editing events. This analysis detected 221 RNA-editing sites distributed across 46 protein-coding genes of the cp genome with probability values greater than 0.9. Notably, ftsH, rpoC2, ycf1, psbB and rpoBb had a higher number of sites, with 39, 20, 18, 13 and 11 RNA-editing sites, respectively (Figure S2).

3.4. Relative Synonymous Codon Usage (RSCU)

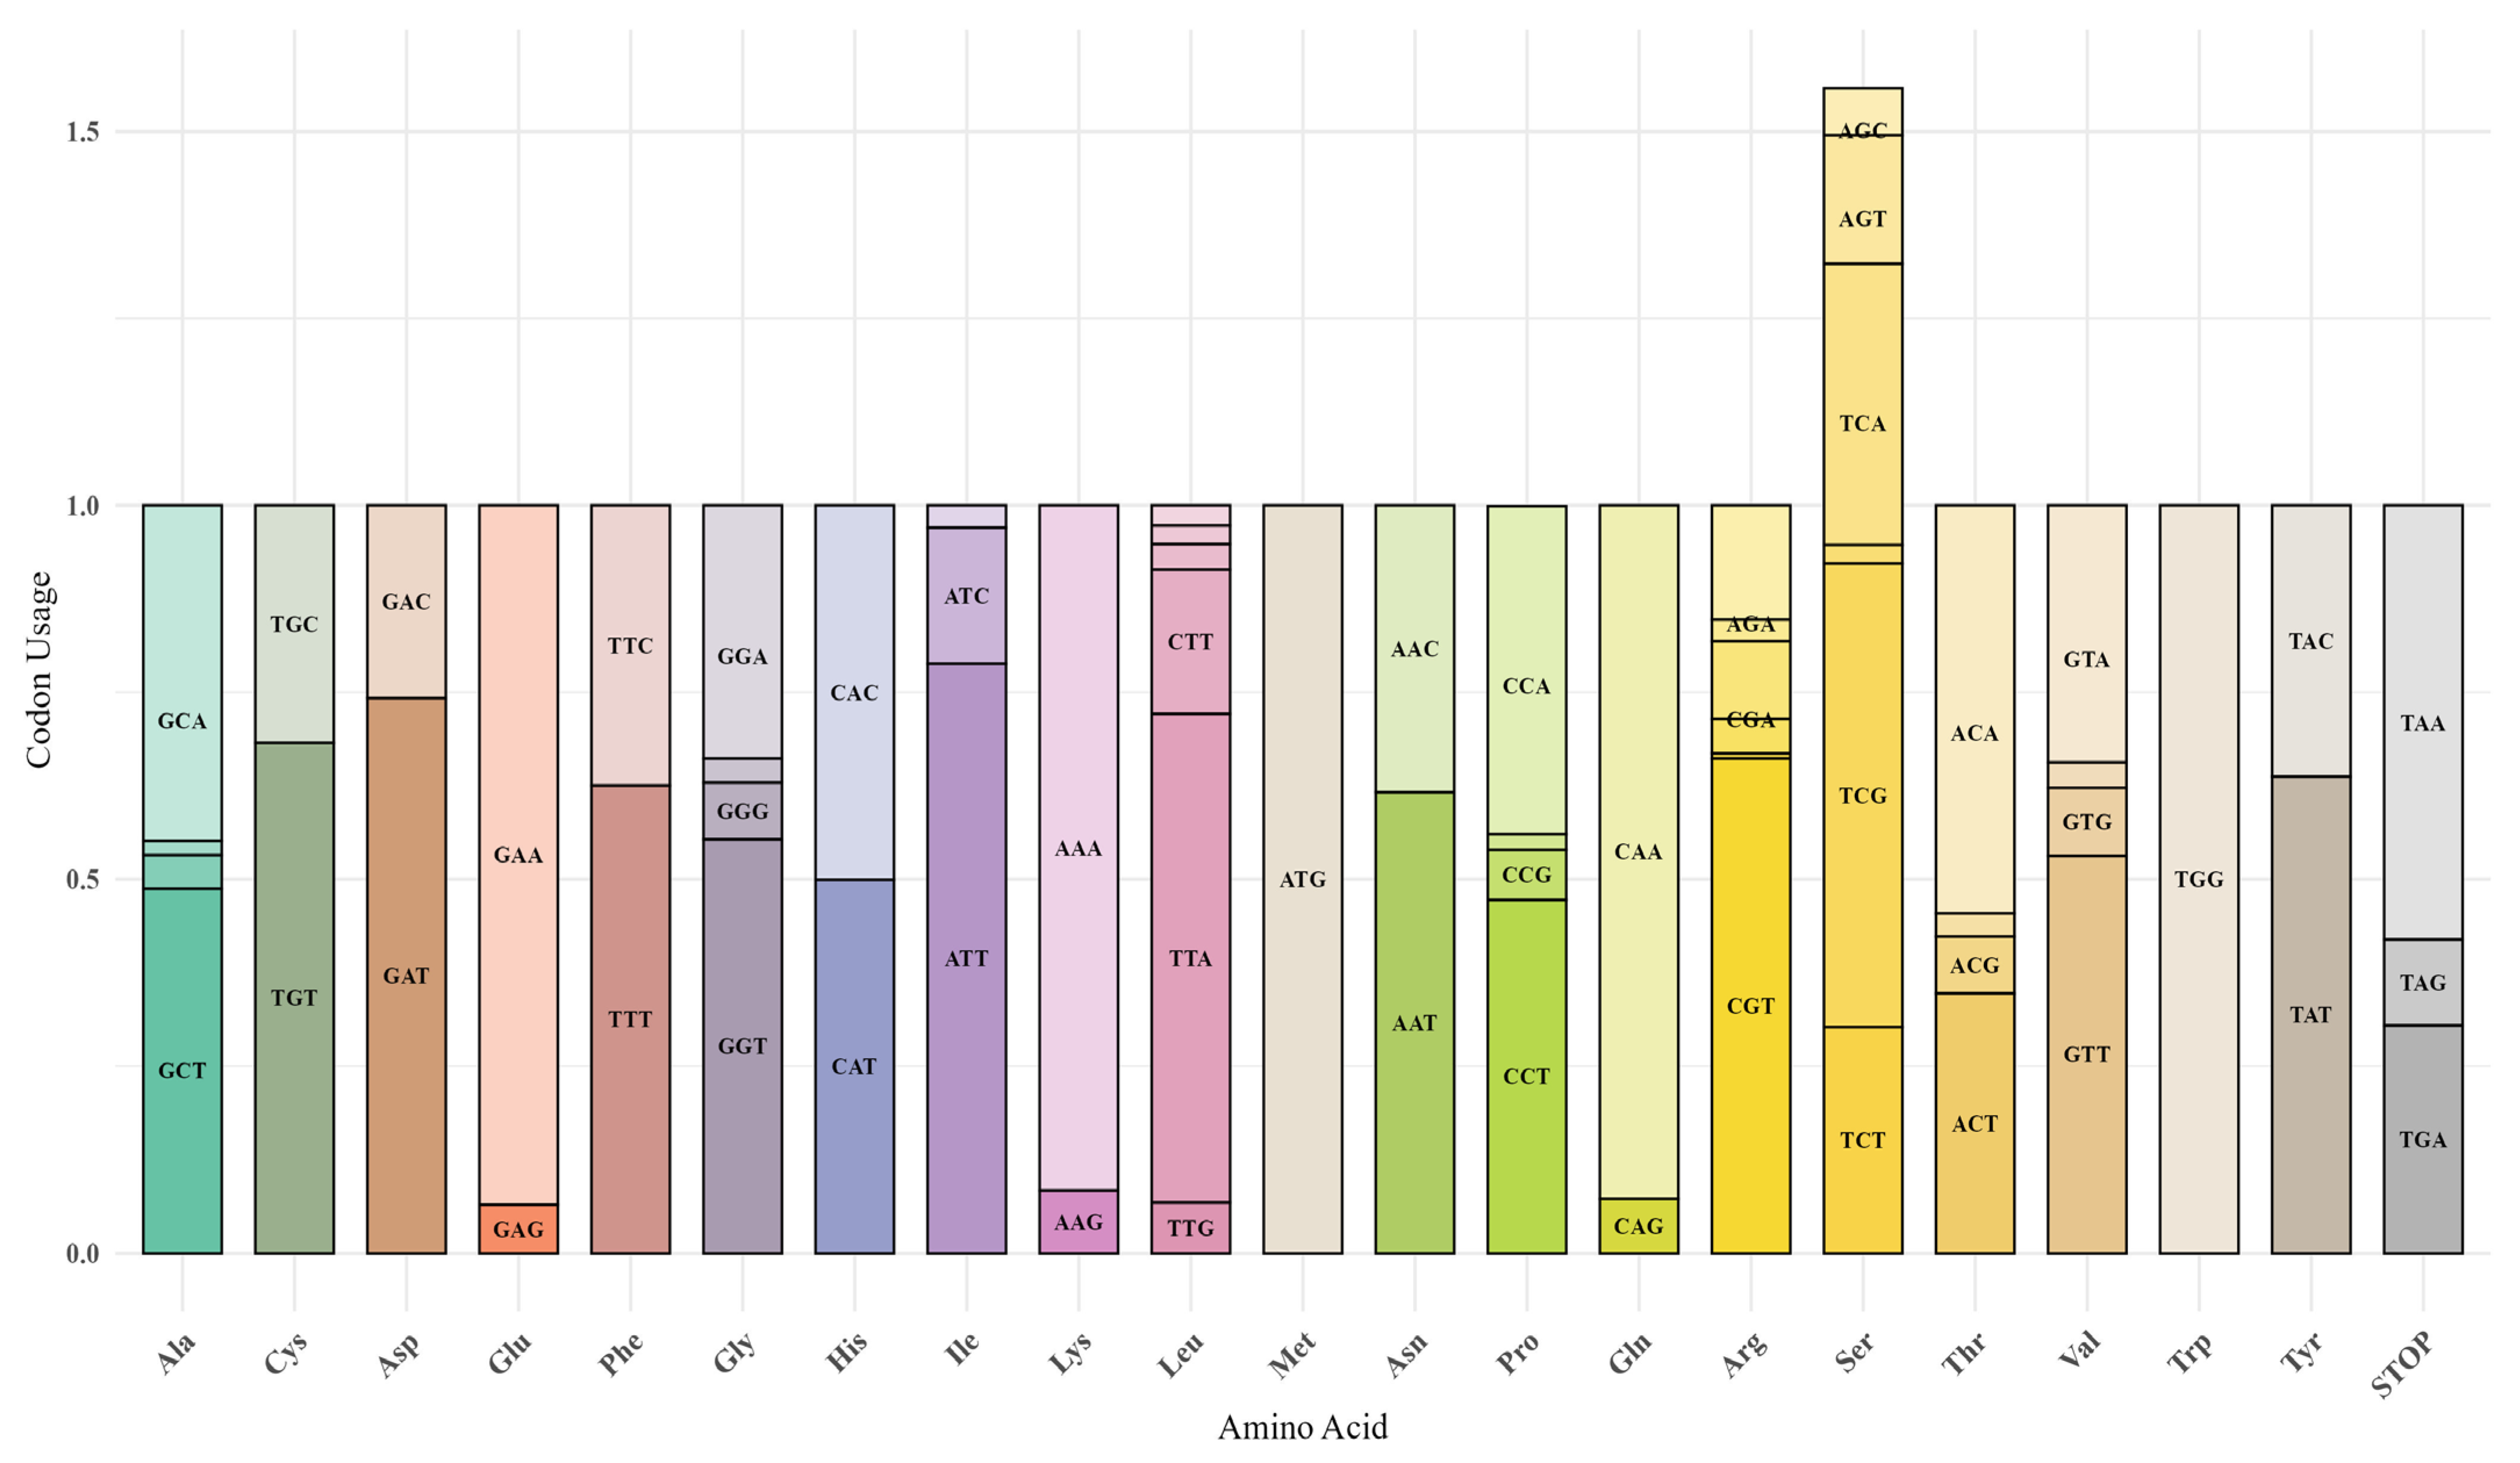
Determining the frequency of codon usage and the associated RSCU values is essential to understand the details of codon usage in cp genomes. From a total of 48 coding sequences, encompassing 18,116 codon counts, the GC content was 34.67% (Figure 4). GC contents in the 1st, 2nd and 3rd positions of the codon were 45.03%, 38.84% and 20.16%, respectively. Among all codons, Leu (TTA) and Lys (AAA) were the most frequently used amino acids in this genome, while Agr (CGG) and Pro (CCC) were the least frequently used. The most frequently used termination codon was TAA, and the least frequently used STOP codon was TAG. Highest five RSCU value containing codons were Glu (GAA), Gln (CAA), Lys (AAA), Ile (ATT) and Asp (GAT) (Table S6).

3.5. IR-Boundaries and Adjacent Genomic Structures

As common evolutionary events, IR borders undergo contraction and expansion, resulting in size differences between chloroplast genomes [32,33]. The Figure 5 shows IR boundaries (JLB, JSB, JSA, JLA) have divided chloroplast (cp) genomes into LSC (Large Single Copy), SSC (Small Single Copy), and IRa/IRb (Inverted Repeats) across several Desmodesmus, Coelastrum, Tetradesmus, and Acutodesmus species. The placement of adjacent genes around the boundaries and the length of the IR regions varied across species, revealing structural evolution in these genomes and a prominent feature for differentiating species among Desmodesmus.
At the LSC/IRb junction (JLB), the gene trnH, in most species, is either inside the LSC and closer to IRB, with minor overlaps (194–212 bp). In contrast, ycf1 was shown to stretch into the LSC region (such as in Tetradesmus major), and the distance varied from (473–603 bp) the JLB junction, which represented variation at this intersection. The cemA and psbC genes appeared to be variable points between species at JSB because of the distance of the rpl22 gene from the border point and flaking between IRB and SSC. Similar to JLB, the yfc1 and trnH genes been shown to be distinguishing features at the JSA junction between species, where they are located at a distance of 469–629 bp for yfc1 and 92–218 bp for trnH towards the SSC region. In JLA, the position of psbC and rpl12 was found to be an identifying element, except for D. spinosus and D. abundans. Regarding the separation of key points between D. spinosus and D. abundans, there were remarkable differrences, such as rrs, which has only a 1 bp difference in distance from JLA towards IRB, and the gene was 237 and 238 bp far from the junctions for D. spinosus and D. abundans, respectively.

3.6. Nucleotide Diversity

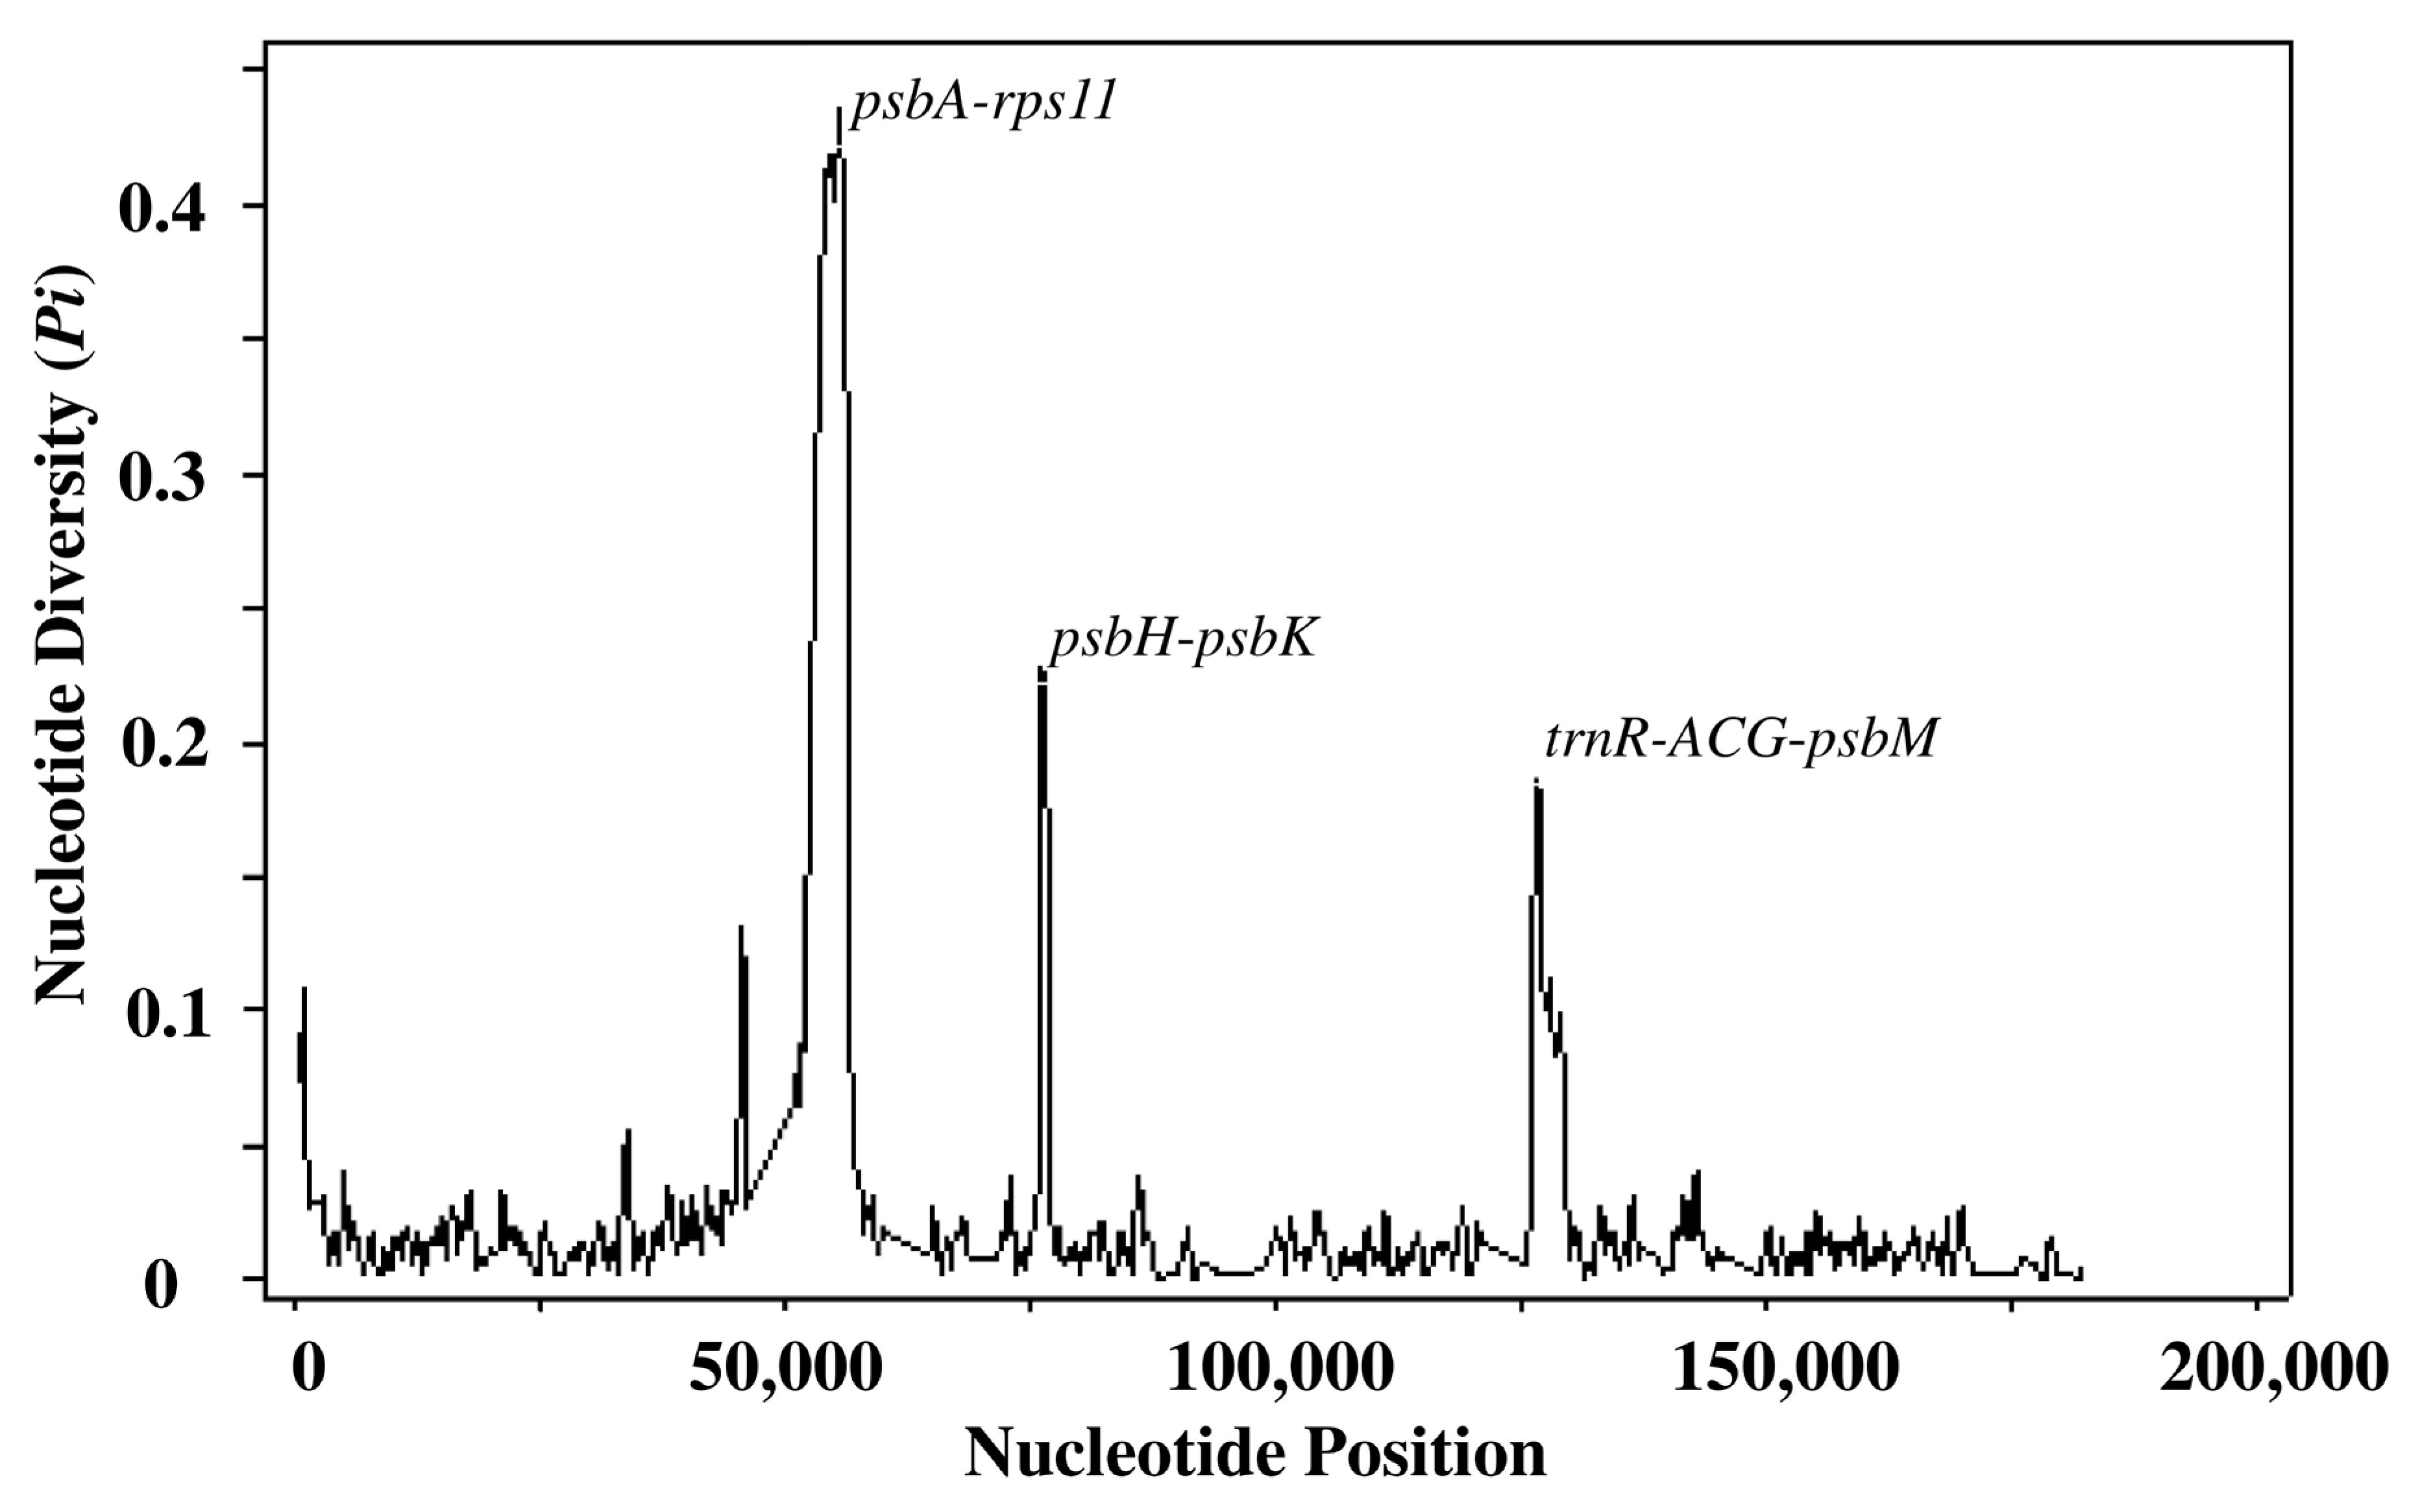
In cp genome sequences, determining the phylogenetic relationships between species and genera is highly variable sites has potential roles [34,35]. A comparative analysis between the two Desmodesmus species was conducted to calculate the nucleotide variability (Pi) following multiple sequence alignment to indentify the region distinguishing D. spinosus and D. abundans (Figure 6 and Table S7). Intergenic regions exhibited Pi values (<0.15) and psbA-rps11, psbH-psbK and trnR-ACG-psbM showed the highest peakes. We observed that the LSC and SCC regions contained higher nucleotide diversity than the IR regions.

3.7. Phylogenetic Analyses

Through our phylogenetic analysis, Tetradesmus and Desmodesmus/Coleodesmus formed two distinct clades in the ML phylogenetic tree (Figure 7). A large, well-supported clade comprising Tetradesmus and Acutodesmus species revealed robust evolutionary connections. In contrast, Desmodesmus and Coelastrum formed distinct clades. The fragment between these two core clades proposes two evolutionary ancestries within the family Scenedesmaceae. Our newly sequenced Desmodesmus spinosus was tightly positioned within the Desmodesmus lineage, closely related to D. abundans, and showed a sister relationship with it. Our results provided relatively stable and fundamental information for further evolutionary and phylogenetic research on Scenedesmaceae.

4. Discussion

Our study sheds light on the genomic composition, structural evolution, repeat diversity, codon usage and phylogenetic relationships within Scenedesmaceae. Complete sequencing and annotation of the D. spinosus chloroplast genome revealed a quadripartite structure with a genome size of 167,203 bp. These features fall within the range observed in Scenedesmaceae algae cp genomes [36,37]. The LSC, SSC, and IR regions of this genome differ in length, with particularly, IR regions being smaller than those in angiosperms, indicating evolutionary contraction and extension in cp genomes [33,39]. This may explain the reduced gene content in Desmodesmus compared to that in higher plants [36]. Notably, this cp genome exhibited an insertion-deletion event, as evident by the shorter IRB compared to IRA in the studied cp genome; however, in D. abundan, these regions are equal [40,41]. In contrast, the GC content (33%) is consistent with that of other chlorophytes, which is a typical feature of conserved patterns [42,43].
Having the majority of photosynthesis- and self-replication-related genes, the annotation revealed 104 genes, which is identical to other Desmodesmus [36]. Among them, rbcL and psbA contain 1 and 3 introns, respectively, which play key roles in photosynthesis efficiency and regulation [44]. Interestingly, multiple introns are commonly observed in the psbA gene, including in the Genus Tetradesmus of Scenedesmaceae [37], demonstrating a potential common ancestral insertion or maintenance event. Considering such events, the psbA-rps11 locus was found to be a hypervariable site in the cp genome of Desmodesmus spinosus, which is a remarkable finding in the present study.
Furthermore, A/T-rich mononucleotide SSRs were observed in our study, which is in harmony with other green algae and higher plants [36,40]. Interestingly, D. perforates and D. hystrix also contain A/T-rich mononucleotides, which has established a common phenomenon within the genus Desmodesmus [36]. SSRs distribution was observed across the LSC and SSC regions in this cp genome, suggesting their role as hotspots for mutation occurrence and serving as potential markers for population genomics, phylogenetics, and species identification. Dispersed and palindromic repeats may play a role in structural variation and shifts in IR boundaries among related species, including Desmodesmus [37,39]. A/U-ending codons were found to be prominent from codon usage analysis, persistent as AT-rich characteristics in cp genomes [35]. The overrepresentation of such codons indicates a bias towards translation selection and mutation in this genome. Genes such as ftsH, rpoC2 and yfc1, with high RNA-editing frequencies, can be used to fine-tune the regulation mechanism in stressed environments [45]. For example, high RNA-editing frequencies were observed in the rpoC2 (n = 13) and ycf1 (n = 17) genes of Thalictrum fargesii cp genomes, [35]. IR boundaries in our cp genome are remarkable for differentiating species within the Scenedesmaceae. The phylogenetic tree robustly separated Tetradesmus from Desmodesmus/Coelastrum, supporting previous molecular evidence of divergence within Scenedesmaceae, which is agreement with Cho and Lee [37], and Xu et al. [36].

5. Conclusions

Overall, in this study, the chloroplast genome sequence of D. spinosus was assembled for the first time, and the structure of this species was annotated, which was the same as that of D. abundan [36]. The phylogenetic relationship revealed that both Desmodesmus species were closely related, consistent with other findings [36]. Chloroplast genome data supported the validity of D. spinosus, which was previously named Scenedesmus spinosus, and the division of Scenedesmus into the genera Scenedesmus and Desmodesmus [46,47]. The present study revealed several significant features of adaptive mechanisms in this cp genome that facilitate tolerance under environmental stress conditions, which supports its natural distribution in changing freshwater territories. This cp genome contains genes associated with antioxidant defense, such as psbA, petB, and rbcL, and genes related to energy metabolism, including ATP synthase subunits (atpA, atpB and atpE). Notably, the presence of rbcL gene suggests a robust carbon absorption mechanism that could promote lipid accumulation under stress or nutrient-depleted environments [10,36]. The ftsH gene is also present in the genome, allowing the species to retain quality control of photosynthetic protein complexes, mostly in the repair cycle of Photosystem II (PSII) during environmental stressors such as intense light, heat, or oxidative stress. The gene also functions to improve biofuel potential by alleviating photosynthetic efficiency and promoting carbon fixation, even under stress environments [48,49]. Moreover, due to its high number of RNA-editing sites (n = 39), this gene has genome-editing potential for biotechnological application. Moreover, this study provides fundamental information for comparative chloroplast genomics and phylogenetic and population-level studies of Scenedesmaceae, supporting both basic evolutionary biology and applied algal biotechnology.

Supplementary Materials

The following supporting information can be downloaded at: https://www.mdpi.com/article/10.3390/d17100721/s1, Table S1. Basic genomic organizations of seventeen species of Scenedesmaceae used in this study including Desmodesmus spinosus. Table S2. Intron containing genes in cp genome of D. spinosus. Table S3. Nucleotide composition in different regions of the D. spinosus cp genome. Table S4. Compound SSR in the cp genome of D. spinosus. Table S5A. SSR motif class in cp genome of D. spinosus. Table S5B. SSR motif class in cp genome of D. spinosus. Table S5C. Dispersed repeats in cp genome of D. spinosus. Table S5D. Tandem Repeats in cp genome of D. spinosus. Table S6. RSCU values of codons in cp genome of D. spinosus. Table S7. Pi values of nucleotide diversity. Figure S1. cis-splicing gene mapping in cp genome of D. spinosus. Figure S2. RNA-editing sites in cp genome of D. spinosus.

Author Contributions

Conceptualization, S.C. and F.M.S.A.; methodology, S.C., F.M.S.A., J.T., B.L. and A.L.; software, S.C., F.M.S.A.; validation, S.C., F.M.S.A., J.T., B.L. and R.Z.; formal analysis, S.C., F.M.S.A., J.T., B.L. and A.L.; investigation, S.C., F.M.S.A., J.T., B.L., A.L. and R.Z.; resources, S.C., B.L. and R.Z.; data curation, S.C., F.M.S.A., J.T., A.L. and R.Z.; writing—original draft preparation, S.C., F.M.S.A., B.L., J.T., A.L. and R.Z.; writing—review and editing, S.C., F.M.S.A., J.T., B.L., A.L. and R.Z.; visualization, S.C., F.M.S.A. and R.Z.; supervision, S.C. and F.M.S.A.; project administration, S.C., B.L. and A.L.; funding acquisition, S.C. All authors have read and agreed to the published version of the manuscript.

Funding

This research was funded by the NEIJIANG NORMAL UNIVERSITY SCHOOL-LEVEL SCIENCE AND TECHNOLOGY PROJECTS—PRIORITY PROJECTS, grant number No. 2024ZDZ12 to S.C.

Institutional Review Board Statement

Not applicable.

Data Availability Statement

The genome sequence data that support the findings of this study are openly available in GenBank of NCBI at under the accession no. PV295633. The associated BioProject, NCBI Sequence Read Archive (SRA), and Bio-Sample numbers are PRJNA1245010, SRR32946018 and SAMN47737432, respectively.

Acknowledgments

We thank for the student of Siqing Yang, Duolin Liao, Jianli Xiong, and Xihao Wang in Neijiang Normal University to cultivate the algae.

Conflicts of Interest

The authors declare no conflicts of interest.

References

  1. Schoch, C.L.; Ciufo, S.; Domrachev, M.; Hotton, C.L.; Kannan, S.; Khovanskaya, R.; Leipe, D.; Mcveigh, R.; O’nEill, K.; Robbertse, B.; et al. NCBI Taxonomy: A Comprehensive Update on Curation, Resources And Tools. Database 2020, 2020, baaa062. [Google Scholar] [CrossRef]
  2. Soós, V.; Shetty, P.; Maróti, G.; Incze, N.; Badics, E.; Bálint, P.; Ördög, V.; Balázs, E. Biomolecule Composition and Draft Genome of a Novel, High-Lipid Producing Scenedesmaceae Microalga. Algal Res. 2021, 54, 102181. [Google Scholar] [CrossRef]
  3. Leite, G.B.; Paranjape, K.; Hallenbeck, P.C. Breakfast of Champions: Fast Lipid Accumulation by Cultures of Chlorella and Scenedesmus Induced By Xylose. Algal Res. 2016, 16, 338–348. [Google Scholar] [CrossRef]
  4. Tsarenko, P.M.; Borysova, O.V.; Korkhovyi, V.I.; Blume, Y.B. High-Efficiency Ukrainian Strains of Microalgae for Biodiesel Fuel Production (Overview). Open Agric. J. 2020, 14, 209–218. [Google Scholar] [CrossRef]
  5. Pezzolesi, L.; Samorì, C.; Zoffoli, G.; Xamin, G.; Simonazzi, M.; Pistocchi, R. Semi-Continuous Production of Polyhydroxybutyrate (PHB) in the Chlorophyta Desmodesmus Communis. Algal Res. 2023, 74, 103196. [Google Scholar] [CrossRef]
  6. Hess, S.K.; Lepetit, B.; Kroth, P.G.; Mecking, S. Production of chemicals from microalgae lipids—Status and perspectives. Eur. J. Lipid Sci. Technol. 2018, 120, 1700152. [Google Scholar] [CrossRef]
  7. Akgül, R.; Akgül, F.; Kızılkaya, I.T. Effects of different phosphorus concentrations on growth and biochemical composition of Desmodesmus communis (E.Hegewald) E.Hegewald. Prep. Biochem. Biotechnol. 2021, 51, 705–713. [Google Scholar] [CrossRef]
  8. Burgel, G.; Ribas, P.G.; Ferreira, P.C.; Passos, M.F.; Santos, B.; Savi, D.C.; Ludwig, T.A.V.; Vargas, J.V.C.; Galli-Terasawa, L.V.; Kava, V.M. Morphology, molecular phylogeny and biomass evaluation of Desmodesmus abundans (Scenedesmaceae-Chlorophyceae) from Brazil. Braz. J. Biol. 2022, 82, e265235. [Google Scholar] [CrossRef]
  9. Najeeb, M.I.; Ahmad, M.-D.; Anjum, A.A.; Maqbool, A.; Ali, M.A.; Nawaz, M.; Ali, T.; Manzoor, R. Distribution, screening and biochemical characterization of indigenous microalgae for bio-mass and bio-energy production potential from three districts of Pakistan. Braz. J. Biol. 2024, 84, e261698. [Google Scholar] [CrossRef]
  10. Shin, Y.-S.; Do, J.-M.; Noh, H.-S.; Yoon, H.-S. Exploring the Potential of Desmodesmus sp. KNUA231 for Bioenergy and Biofertilizer Applications and Its Adaptability to Environmental Stress. Appl. Sci. 2025, 15, 5097. [Google Scholar] [CrossRef]
  11. Yang, B.; Li, Y.; Wang, Z.; Yue, Z.; Wen, J.; Zhao, X.; Zhang, H.; Wang, X.; Wang, X.; Zhang, M. Strong Inhibitory Effects of Desmodesmus sp. on Microcystis blooms: Potential as a Biological Control Agent in Aquaculture. Aquac. Rep. 2025, 40, 102579. [Google Scholar] [CrossRef]
  12. Krienitz, L. The Contribution of Eberhard Hegewald (1942–2024) to the Systematics of Coccoid Green Algae—An Obituary. Nova Hedwig. 2024, 119, 261–268. [Google Scholar] [CrossRef]
  13. Nguyen, M.L.; Mai, X.C.; Chu, N.H.; Trinh, D.M.; Liu, C.-L.; Shen, C.-R. DNA signaturing derived from the internal transcribed spacer 2 (ITS2): A novel tool for identifying Desmodesmus species (Scenedesmaceae, Chlorophyta). Fottea 2023, 23, 1–7. [Google Scholar] [CrossRef]
  14. Porebski, S.; Bailey, L.G.; Baum, B.R. Modification of a CTAB DNA extraction protocol for plants containing high polysaccharide and polyphenol components. Plant Mol. Biol. Rep. 1997, 15, 8–15. [Google Scholar] [CrossRef]
  15. Bolger, A.M.; Lohse, M.; Usadel, B. Trimmomatic: A Flexible Trimmer for Illumina Sequence Data. Bioinformatics 2014, 30, 2114–2120. [Google Scholar] [CrossRef]
  16. Dierckxsens, N.; Mardulyn, P.; Smits, G. NOVOPlasty: De Novo Assembly of Organelle Genomes from Whole Genome Data. Nucleic Acids Res. 2017, 45, e18. [Google Scholar] [CrossRef]
  17. Tillich, M.; Lehwark, P.; Pellizzer, T.; Ulbricht-Jones, E.S.; Fischer, A.; Bock, R.; Greiner, S. GeSeq—Versatile and Accurate Annotation of Organelle Genomes. Nucleic Acids Res. 2017, 45, W6–W11. [Google Scholar] [CrossRef]
  18. Greiner, S.; Lehwark, P.; Bock, R. OrganellarGenomeDRAW (OGDRAW) Version 1.3.1: Expanded Toolkit for the Graphical Visualization of Organellar Genomes. Nucleic Acids Res. 2019, 47, W59–W64. [Google Scholar] [CrossRef]
  19. Shi, L.; Chen, H.; Jiang, M.; Wang, L.; Wu, X.; Huang, L.; Liu, C. CPGAVAS2, an integrated plastome sequence annotator and analyzer. Nucleic Acids Res. 2019, 47, W65–W73. [Google Scholar] [CrossRef]
  20. Beier, S.; Thiel, T.; Münch, T.; Scholz, U.; Mascher, M. MISA-web: A web server for microsatellite prediction. Bioinformatics 2017, 33, 2583–2585. [Google Scholar] [CrossRef]
  21. Benson, G. Tandem repeats finder: A program to analyze DNA sequences. Nucleic Acids Res. 1999, 27, 573–580. [Google Scholar] [CrossRef]
  22. Kurtz, S. The Vmatch large scale sequence analysis software. Ref Type Comput. Program 2003, 412, 297. [Google Scholar]
  23. Liu, S.; Ni, Y.; Li, J.; Zhang, X.; Yang, H.; Chen, H.; Liu, C. CPGView: A package for visualizing detailed chloroplast genome structures. Mol. Ecol. Resour. 2023, 23, 694–704. [Google Scholar] [CrossRef] [PubMed]
  24. Edera, A.A.; Small, I.; Milone, D.H.; Sanchez-Puerta, M.V. Deepred-Mt: Deep representation learning for predicting C-to-U RNA editing in plant mitochondria. Comput. Biol. Med. 2021, 136, 104682. [Google Scholar] [CrossRef] [PubMed]
  25. Zheng, S.; Poczai, P.; Hyvönen, J.; Tang, J.; Amiryousefi, A. Chloroplot: An online program for the versatile plotting of organelle genomes. Front. Genet. 2020, 11, 576124. [Google Scholar] [CrossRef] [PubMed]
  26. Katoh, K.; Rozewicki, J.; Yamada, K.D. MAFFT online service: Multiple sequence alignment, interactive sequence choice and visualization. Briefings Bioinform. 2017, 20, 1160–1166. [Google Scholar] [CrossRef]
  27. Rozas, J.; Ferrer-Mata, A.; Sánchez-DelBarrio, J.C.; Guirao-Rico, S.; Librado, P.; Ramos-Onsins, S.E.; Sánchez-Gracia, A. DnaSP 6: DNA sequence polymorphism analysis of large data sets. Mol. Biol. Evol. 2017, 34, 3299–3302. [Google Scholar] [CrossRef]
  28. Menéndez, C.D.; Poczai, P.; Williams, B.; Myllys, L.; Amiryousefi, A. IRplus: An augmented tool to detect inverted repeats in plastid genomes. Genome Biol. Evol. 2023, 15, evad177. [Google Scholar] [CrossRef]
  29. Huerta-Cepas, J.; Serra, F.; Bork, P. ETE 3: Reconstruction, Analysis, and Visualization of Phylogenomic Data. Mol. Biol. Evol. 2016, 33, 1635–1638. [Google Scholar] [CrossRef]
  30. Katoh, K.; Kuma, K.I.; Toh, H.; Miyata, T. MAFFT Version 5: Improvement in Accuracy of Multiple Sequence Alignment. Nucleic Acids Res. 2005, 33, 511–518. [Google Scholar] [CrossRef]
  31. Nguyen, L.-T.; Schmidt, H.A.; Von Haeseler, A.; Minh, B.Q. IQ-TREE: A Fast and Effective Stochastic Algorithm for Estimating Maximum-Likelihood Phylogenies. Mol. Biol. Evol. 2015, 32, 268–274. [Google Scholar] [CrossRef] [PubMed]
  32. Wang, R.-J.; Cheng, C.-L.; Chang, C.-C.; Wu, C.-L.; Su, T.-M.; Chaw, S.-M. Dynamics and evolution of the inverted repeat-large single copy junctions in the chloroplast genomes of monocots. BMC Evol. Biol. 2008, 8, 36. [Google Scholar] [CrossRef] [PubMed]
  33. Park, S.; Jun, M.; Park, S.; Park, S. Lineage-specific variation in IR boundary shift events, inversions, and substitution rates among Caprifoliaceae s.l. (Dipsacales) Plastomes. Int. J. Mol. Sci. 2021, 22, 10485. [Google Scholar] [CrossRef] [PubMed]
  34. Liu, M.-L.; Fan, W.-B.; Wang, N.; Dong, P.-B.; Zhang, T.-T.; Yue, M.; Li, Z.-H. Evolutionary analysis of plastid genomes of seven Lonicera L. species: Implications for sequence divergence and phylogenetic relationships. Int. J. Mol. Sci. 2018, 19, 4039. [Google Scholar] [CrossRef]
  35. Chen, S.; Azam, F.M.S.; Akter, M.L.; Ao, L.; Zou, Y.; Qian, Y. The first complete chloroplast genome of Thalictrum fargesii: Insights into phylogeny and species identification. Front. Plant Sci. 2024, 15, 1356912. [Google Scholar] [CrossRef]
  36. Xu, Y.; Chen, X.; Melkonian, M.; Wang, S.; Sahu, S.K. Comparative chloroplast genome analysis of two Desmodesmus species reveals genome diversity within Scenedesmaceae (Sphaeropleales, Chlorophyceae). Protist 2024, 175, 126073. [Google Scholar] [CrossRef]
  37. Cho, H.S.; Lee, J. Taxonomic Reinvestigation of the Genus Tetradesmus (Scenedesmaceae; Sphaeropleales) Based on Morphological Characteristics and Chloroplast Genomes. Front. Plant Sci. 2024, 15, 1303175. [Google Scholar] [CrossRef]
  38. Lee, C.; Cooper, J.T.; Moroni, F.; Salim, A.M.; Lee, C.; Spanbauer, T.; Theriot, E.C. Complete Plastome of Coelastrum microporum Nägeli (Scenedesmaceae, Sphaeropleales). Mitochondrial DNA Part B 2024, 8, 948–951. [Google Scholar] [CrossRef]
  39. Guo, Y.-Y.; Yang, J.-X.; Bai, M.-Z.; Zhang, G.-Q.; Liu, Z.-J. The chloroplast genome evolution of Venus slipper (Paphiopedilum): IR expansion, SSC contraction, and highly rearranged SSC regions. BMC Plant Biol. 2021, 21, 248. [Google Scholar] [CrossRef]
  40. Qin, Q.; Dong, Y.; Chen, J.; Wang, B.; Peng, Y.; Zhang, X.; Wang, X.; Zeng, J.; Zhong, G.; Zhang, S.; et al. Comparative analysis of chloroplast genomes reveals molecular evolution and phylogenetic relationships within the Papilionoideae of Fabaceae. BMC Plant Biol. 2025, 25, 157. [Google Scholar] [CrossRef]
  41. Park, H.; Park, J.H.; Kang, Y.J. Characterization of the complete chloroplast genome of Wolffia arrhiza and comparative genomic analysis with relative Wolffia species. Sci. Rep. 2024, 14, 5873. [Google Scholar] [CrossRef] [PubMed]
  42. Wang, T.; Feng, H.; Zhu, H.; Zhong, B. Molecular phylogeny and comparative chloroplast genome analysis of the type species Crucigenia quadrata. BMC Plant Biol. 2025, 25, 64. [Google Scholar] [CrossRef] [PubMed]
  43. Song, H.; Peng, H.; Fang, Z.; Zhang, B.; Zhu, Z.; Xiao, Z.; Liu, G.; Hu, Y. Koliella bifissiva sp. nov (Chlorellaceae, Chlorophyta) and analysis of its organelle genomes. Plants 2024, 13, 2604. [Google Scholar] [CrossRef] [PubMed]
  44. Odom, O.W.; Holloway, S.P.; Deshpande, N.N.; Lee, J.; Herrin, D.L. Mobile self-splicing group I introns from the psbA gene of Chlamydomonas reinhardtii: Highly efficient homing of an exogenous intron containing its own promoter. Mol. Cell. Biol. 2001, 21, 3472–3481. [Google Scholar] [CrossRef]
  45. Chu, D.; Wei, L. The chloroplast and mitochondrial C-to-U RNA editing in Arabidopsis thaliana shows signals of adaptation. Plant Direct 2019, 3, e00169. [Google Scholar] [CrossRef]
  46. Saleh, M.M. Effect of Electromagnetic Field on Growth and Morphology of Some Algal Species. Ph.D. Thesis, Suez Canal University, Ismailia, Egypt, 2006. [Google Scholar]
  47. Hegewald, E. New Combinations in the Genus Desmodesmus (Chlorophyceae, Scenedesmaceae). Arch. Für Hydrobiol. 2000, 96, 1–18. [Google Scholar] [CrossRef]
  48. Wang, F.; Qi, Y.; Yu, F. The biological functions of FtsH in plant organelle protein homeostasis. J. Exp. Bot. 2025, 76, 4220–4231. [Google Scholar] [CrossRef]
  49. Krynická, V.; Komenda, J. The role of FtsH complexes in the response to abiotic stress in cyanobacteria. Plant Cell Physiol. 2024, 65, 1103–1114. [Google Scholar] [CrossRef]
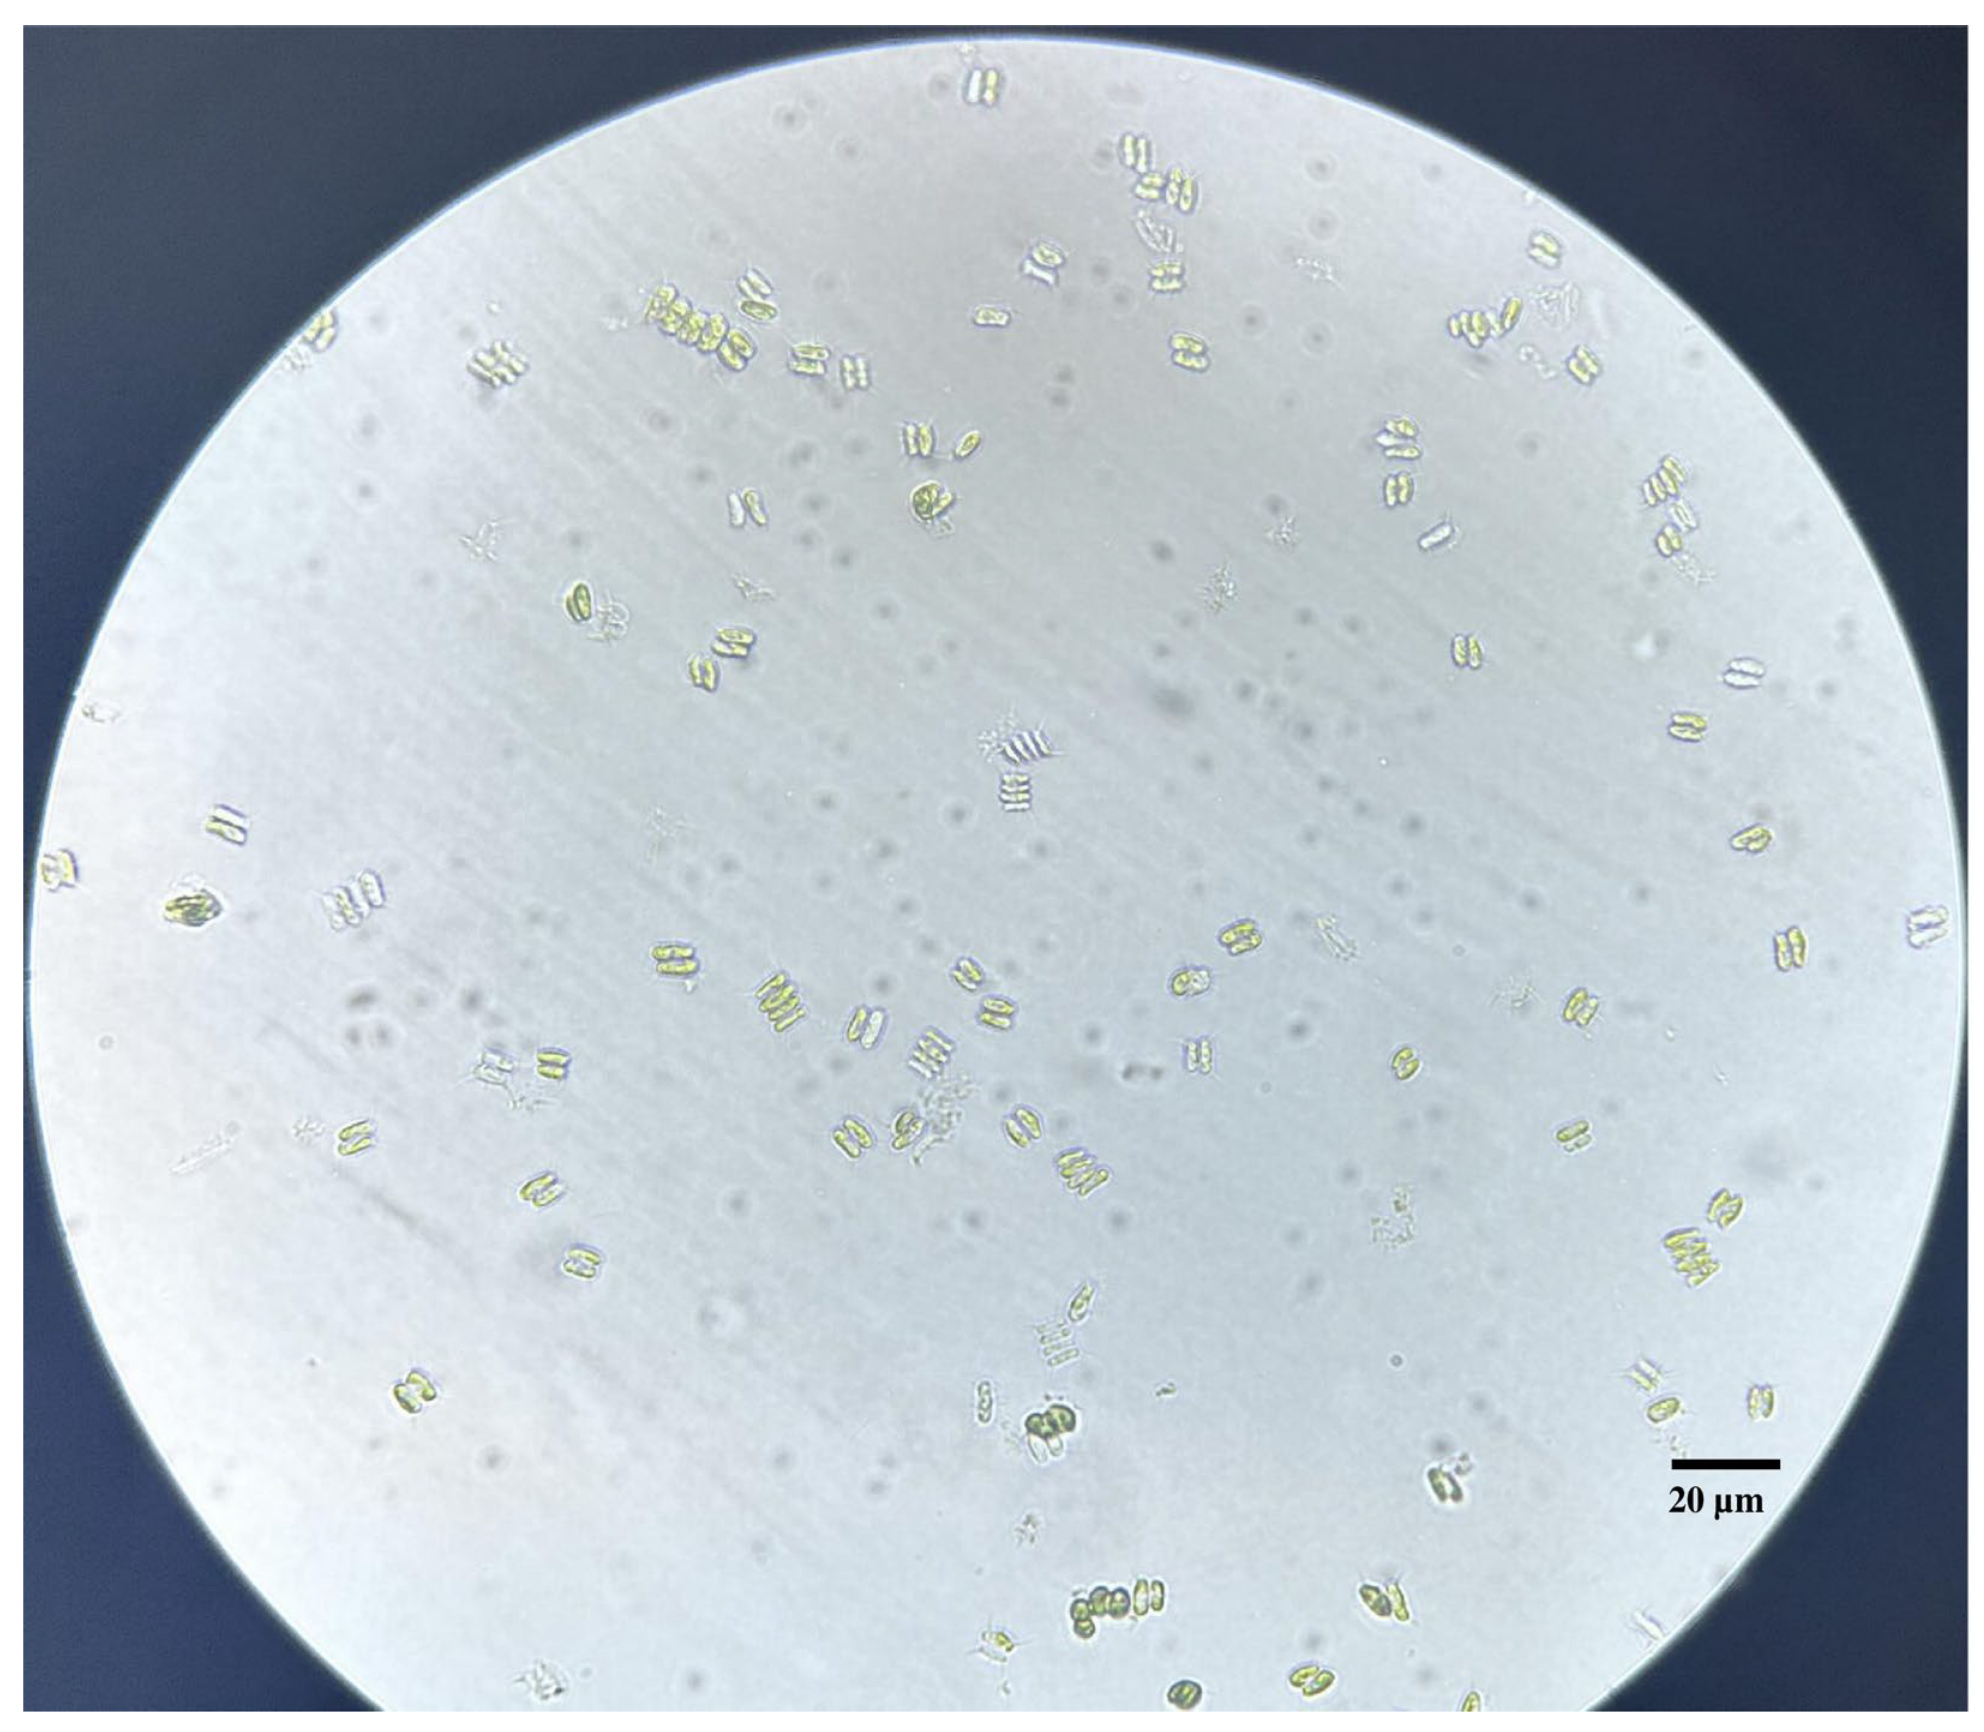
Figure 1. Micrograph of Desmodesmus spinosus (photographed by Renqing Zhang), showing algal cells. Magnification 400× (objective lens, 40×; ocular lens, 10×). The black straight line represents the scale bar which is equal to 20 µm.
Diversity 17 00721 g001
Figure 2. Graphical representation of the features identified in the cp genome of Desmodesmus spinosus. Species name, genome length, GC content, and number of genes are represented at the center of the plot. The boundaries of the small single-copy (SSC), large single-copy (LSC), and inverted repeat (IRA and IRB) regions are denoted in the inner circle. Transcripts for genes inside and outside the circle are generated in the opposite directions of the tetrad structure of the cp genome, as represented by arrows. Different colors were used to distinguish between genes belonging to specific functional categories, and their legend is shown in the lower left corner of the bottom panel. The darker shaded region inside the inner circle indicates the GC content, whereas the light color indicates the AT content of the cp genome. The gradient GC content of the cp genome is represented by the second circle, with a zero level based on the outer circle. The GC content of each gene is displayed by the proportion of shaded areas. The bold dots on the inner circle of the IR regions, each with a corresponding shadow extending outward with green, red, and yellow colors, indicate the existence of insertions, SNPs, and deletions on the corresponding genomic coordinates, respectively.
Diversity 17 00721 g002
Figure 3. Different repeats in the cp genome of D. spinosus. (A) SSR type distribution in the genome; (B) Distribution of SSR types across the regions, inner circle to outermost representing LSC, SSC, IRA and IRB; (C) Diversity of dispersed repeats, D and P representing direct and palindromic repeats, respectively; (D) Positions of long tandem repeats (LTRs) in cp genome; (E) LTRs location across regions in the cp genome.
Diversity 17 00721 g003
Figure 4. Relative synonymous codon usage (RSCU) of 20 amino acids and stop codons in all protein-coding genes of the cp genome of D. spinosus.
Diversity 17 00721 g004
Figure 5. Comparison of IR boundaries of chloroplast genomes within Tetradesmus, Acutodesmus, Desmodesmus and Coelastrum. The junctions are LSC-IRB (JLB), IRB-SSC (JSB), SSC-IRA (JSA), and IRA-LSC (JLA). Thin lines represent the connection points of each region. The numbers inside the boxes represent the lengths of the LSC, SSC, and IRA/B regions. The number alongside the gene name indicates the size (bp) of the gene. The number aside the gene boxes indicates the distance (bp) between the end of the gene and the border sites. Arrows indicate the distance (bp) between the gene and the junction.
Diversity 17 00721 g005
Figure 6. Nucleotide diversity analysis (Pi-value) of the complete chloroplast genomes of Desmodesmus. Sliding window analysis of the complete cp genome of Desmodesmus spinosus. Window length: 600 bp; step size: 200 bp. X-axis: Position of the midpoint of the window. Y-axis: Nucleotide diversity of each window.
Diversity 17 00721 g006
Figure 7. Phylogenetic relationships of Desmodesmus spinosus inferred from maximum likelihood (ML) analysis. Numbers beside the node indicate bootstrap support values, and numbers beside the species name indicate the GenBank accession number. Green and teal colored background represents mostly genus of Tetradesmus and Desmodesmus/Coleodesmus, respectively. The following sequences were used: Desmodesmus spinosus PV295633; D. abundans NC_066651; Tetradesmus reginae NC_086752, OR502664 [36]; Tetradesmus major f. lunatus OR502665; Tetradesmus obliquus KX756229, CM007919; Acutodesmus obliquus NC_008101; Tetradesmus distendus OR502666, NC_086753; Tetradesmus lancea OR502671; Tetradesmus arenicola NC_086756, OR502670; Tetradesmus bajacalifornicus OR502669, NC_086755; Tetradesmus dissociates OR502667 [37]; with Stauridium tetras NC_037923 [38] as out group.
Diversity 17 00721 g007
Table 1. Genes according to the categories within the D. spinosus cp genome.
CategoryGene GroupGene Name *
PhotosynthesisSubunits of photosystem IpsaA i, psaB, psaC, psaJ
Subunits of photosystem IIpsbA q, psbB, psbC, psbD, psbE, psbF, psbH, psbI, psbJ, psbK, psbL, psbM, psbT, psbZ
Subunits of cytochrome b/f complexpetA, petB, petD i, petG, petL
Subunits of ATP synthaseatpA, atpB e, atpE, atpF, atpH, atpI
Large subunit of rubiscorbcL i
light-independent protochlorophyllide reductase (DPOR) enzyme complexchlB, chlL, chlN
Photosystem I assembly proteinpafI, pafII
Photosystem II reaction center proteinpsb30
Self-replicationLarge ribosomal subunitrpl2, rpl5, rpl12 d, rpl14, rpl16, rpl20, rpl23, rpl36
Small ribosomal subunitrps11, rps12, rps14, rps18, rps19, rps2, rps3, rps4, rps7, rps8, rps9
Subunits of RNA polymeraserpoA, rpoBa, rpoBb, rpoC1, rpoC2
Ribosomal RNAsRrs d, rrl d, rrf d
Transfer RNAstrnY-GUA, trnK-UUU d, trnS-UGA, trnD-GUC, trnM-CAU t, trnN-GUU, trnH-GUG, trnI-GAU d, trnA-UGC d, trnS-GCU d, trnG-UCC, trnF-GAA, trnE-UUC d, trnL-UAG, trnQ-UUG, trnP-UGG, trnV-UAC, trnR-ACG, trnW-CCA, trnG-GCC, trnR-UCU, trnC-GCA
Other genesATP-dependent CLP proteaseclpP1
ATP-dependent zinc metalloproteaseftsH
N-terminal nucleophile amino hydrolase superfamily pbf1
Envelope membrane proteincemA
c-type cytochrome synthesis geneccsA
Translational initiation factorinfA
Elongation factortufA
Genes of unknown
function
Conserved hypothetical chloroplast ORFycf1
* d-duplicate gene, t-triplicate gene, i-genes with one intron, e-genes with two introns, q-genes with three introns.
Disclaimer/Publisher’s Note: The statements, opinions and data contained in all publications are solely those of the individual author(s) and contributor(s) and not of MDPI and/or the editor(s). MDPI and/or the editor(s) disclaim responsibility for any injury to people or property resulting from any ideas, methods, instructions or products referred to in the content.