Article

The Aging of Urban Gardens Can Enhance Their Role as Refuges for Local Ant Species

by
Gema Trigos-Peral
1,* and
Joaquín L. Reyes-López
2
1
Museum and Institute of Zoology, Polish Academy of Sciences, Wilcza St 64, 00-679 Warszaw, Poland
2
Departamento de Botánica, Ecología y Fisiología Vegetal, Universidad de Córdoba, Edificio Celestino Mutis C4, 14014 Cordoba, Spain
*
Author to whom correspondence should be addressed.
Diversity 2025, 17(1), 64; https://doi.org/10.3390/d17010064
Submission received: 30 December 2024 / Revised: 13 January 2025 / Accepted: 15 January 2025 / Published: 17 January 2025
(This article belongs to the Section Biodiversity Conservation)

Abstract

:
Urban gardens can be crucial for preserving the biodiversity in cities, but their construction often leads to shifts in local ant communities due to drastic habitat changes. Over time, ant communities can recover as species arrive from surrounding habitats. In this study, we explored ant community dynamics over ten years in four gardens of varying maturity on a university campus in South Spain. We examined: (1) ant community composition in the gardens and surrounding natural/seminatural areas; (2) changes in biodiversity over time; (3) indicator values of species in the campus; and (4) population dynamics of the most representative species. We found distinct ant community compositions in gardens and natural/seminatural habitats. The ant community in older gardens showed greater similarity to surrounding natural areas than in young gardens. In the youngest garden, biodiversity initially declined post-construction but later increased to levels comparable to older gardens. Exotic species were more abundant in the young garden, and the population of native species like the garden ant Lasius niger increased over the years. We found that disturbances promote the establishment of exotic species, regardless of habitat maturity. We emphasize the importance of a context-dependent interpretation of species bioindicator information to assess habitat ecological status accurately.

1. Introduction

Urban ecology is an expanding field of study as ecologists seek to diminish the negative effects of urbanization on biodiversity [1]. Through urbanization, natural habitats undergo drastic changes in their landscapes and biodiversity composition that are linked to habitat loss and the introduction of exotic species. In the new habitat, both biotic and abiotic interactions have been altered, resulting in the creation of novel environmental pressures [2,3,4] and threatening the survival of many local ones [5]. In this context, urban green spaces can act as major species refuges [6,7,8,9]. However, their efficiency as such will depend on various factors, including their size, location, structure, and even similarity to the close natural habitats [10,11,12].
Urban green spaces can be viewed as landscapes undergoing continuous early succession, a status maintained via management practices [13,14], namely pruning or mowing. However, the creation of an urban green space causes a major shift in habitat features, leading to changes in local ant communities, with populations responding differently over time based on their ecological compatibility and potentially reaching a balance as the habitat matures [15]. Similarly to an island, the biodiversity of these artificial ecosystems is determined by a balance between the extinction and immigration rates of species, with imigration being determined by the distance to the source habitats [16]. Similar to islands, the biodiversity of these artificial ecosystems is determined by a balance between extinction and immigration rates, with the latter influenced by the distance to source habitats [16]. Since MacArthur and Wilson revolutionized ecological research in 1967 by describing the theory of island biogeography [16], several authors have highlighted the similarities in the functioning of islands and urbanized areas. They have demonstrated how biodiversity dynamics in these ecosystems can be predicted by this theory [17,18,19].
Many studies have explored the effects of urbanization on local biodiversity using ants as model species. Because ants have short generation times and traits that reflect habitat characteristics, they are excellent bioindicators for evaluating the state of ecosystems and the impacts of environmental factors [20,21,22,23]. However, most research has focused on comparing the biodiversity of an area before and after urbanization [24] or in two different distant years after the construction of greenery [8]. All of them show some general common results such as the arrival of exotic species with ornamental plants or material of construction, the differences in native species’ resilience against habitat disturbance, or the displacement of some local species. Urban biodiversity studies have also found that mature habitats are less vulnerable to the effects of disturbance [15]. However, it remains unknown how particular species respond to the disturbances linked to management practices. As Buczkowski and Richmond [24] have underscored, there is a need for research that explores how different species respond over longer periods of time (i.e., years) and that addresses the relationship between species responses and ecology.
Another limitation in this body of research is that, to date, studies conducted on natural or urban habitats have tended to assess disturbance effects by classifying ant species into general functional groups [16,25,26,27] or based on the functional traits of the species [28]. In a broad sense, these approaches can be well suited to urban greenery whose structure and size are large enough to allow for a large number of microhabitats [29,30]. Nevertheless, it may be less appropriate when examining residential gardens or small gardens among buildings, which typically comprise a lawn area with some ornamental plants. These spaces are also usually irrigated, which is crucial to their persistence in southern Europe, where summers are mostly dry and extremely hot. Despite their artificial nature, these gardens play an important role as a refuge for local species [6], and this role grows in importance when it comes to hydrophilic species [31].
In this study, we attempt to evaluate how the maturation of urban gardens influences their ant community by carrying out a 10-year study in four gardens on the Rabanales Campus of the University of Córdoba (Andalusia, Spain). During the study, we characterized the following: (1) similarities between the ant community composition among the four gardens, as well as with the surrounding natural and seminatural areas on campus; (2) the most representative species in each garden based on their indicator status; and (3) the population dynamics of the most representative species in the gardens over time.

2. Materials and Methods
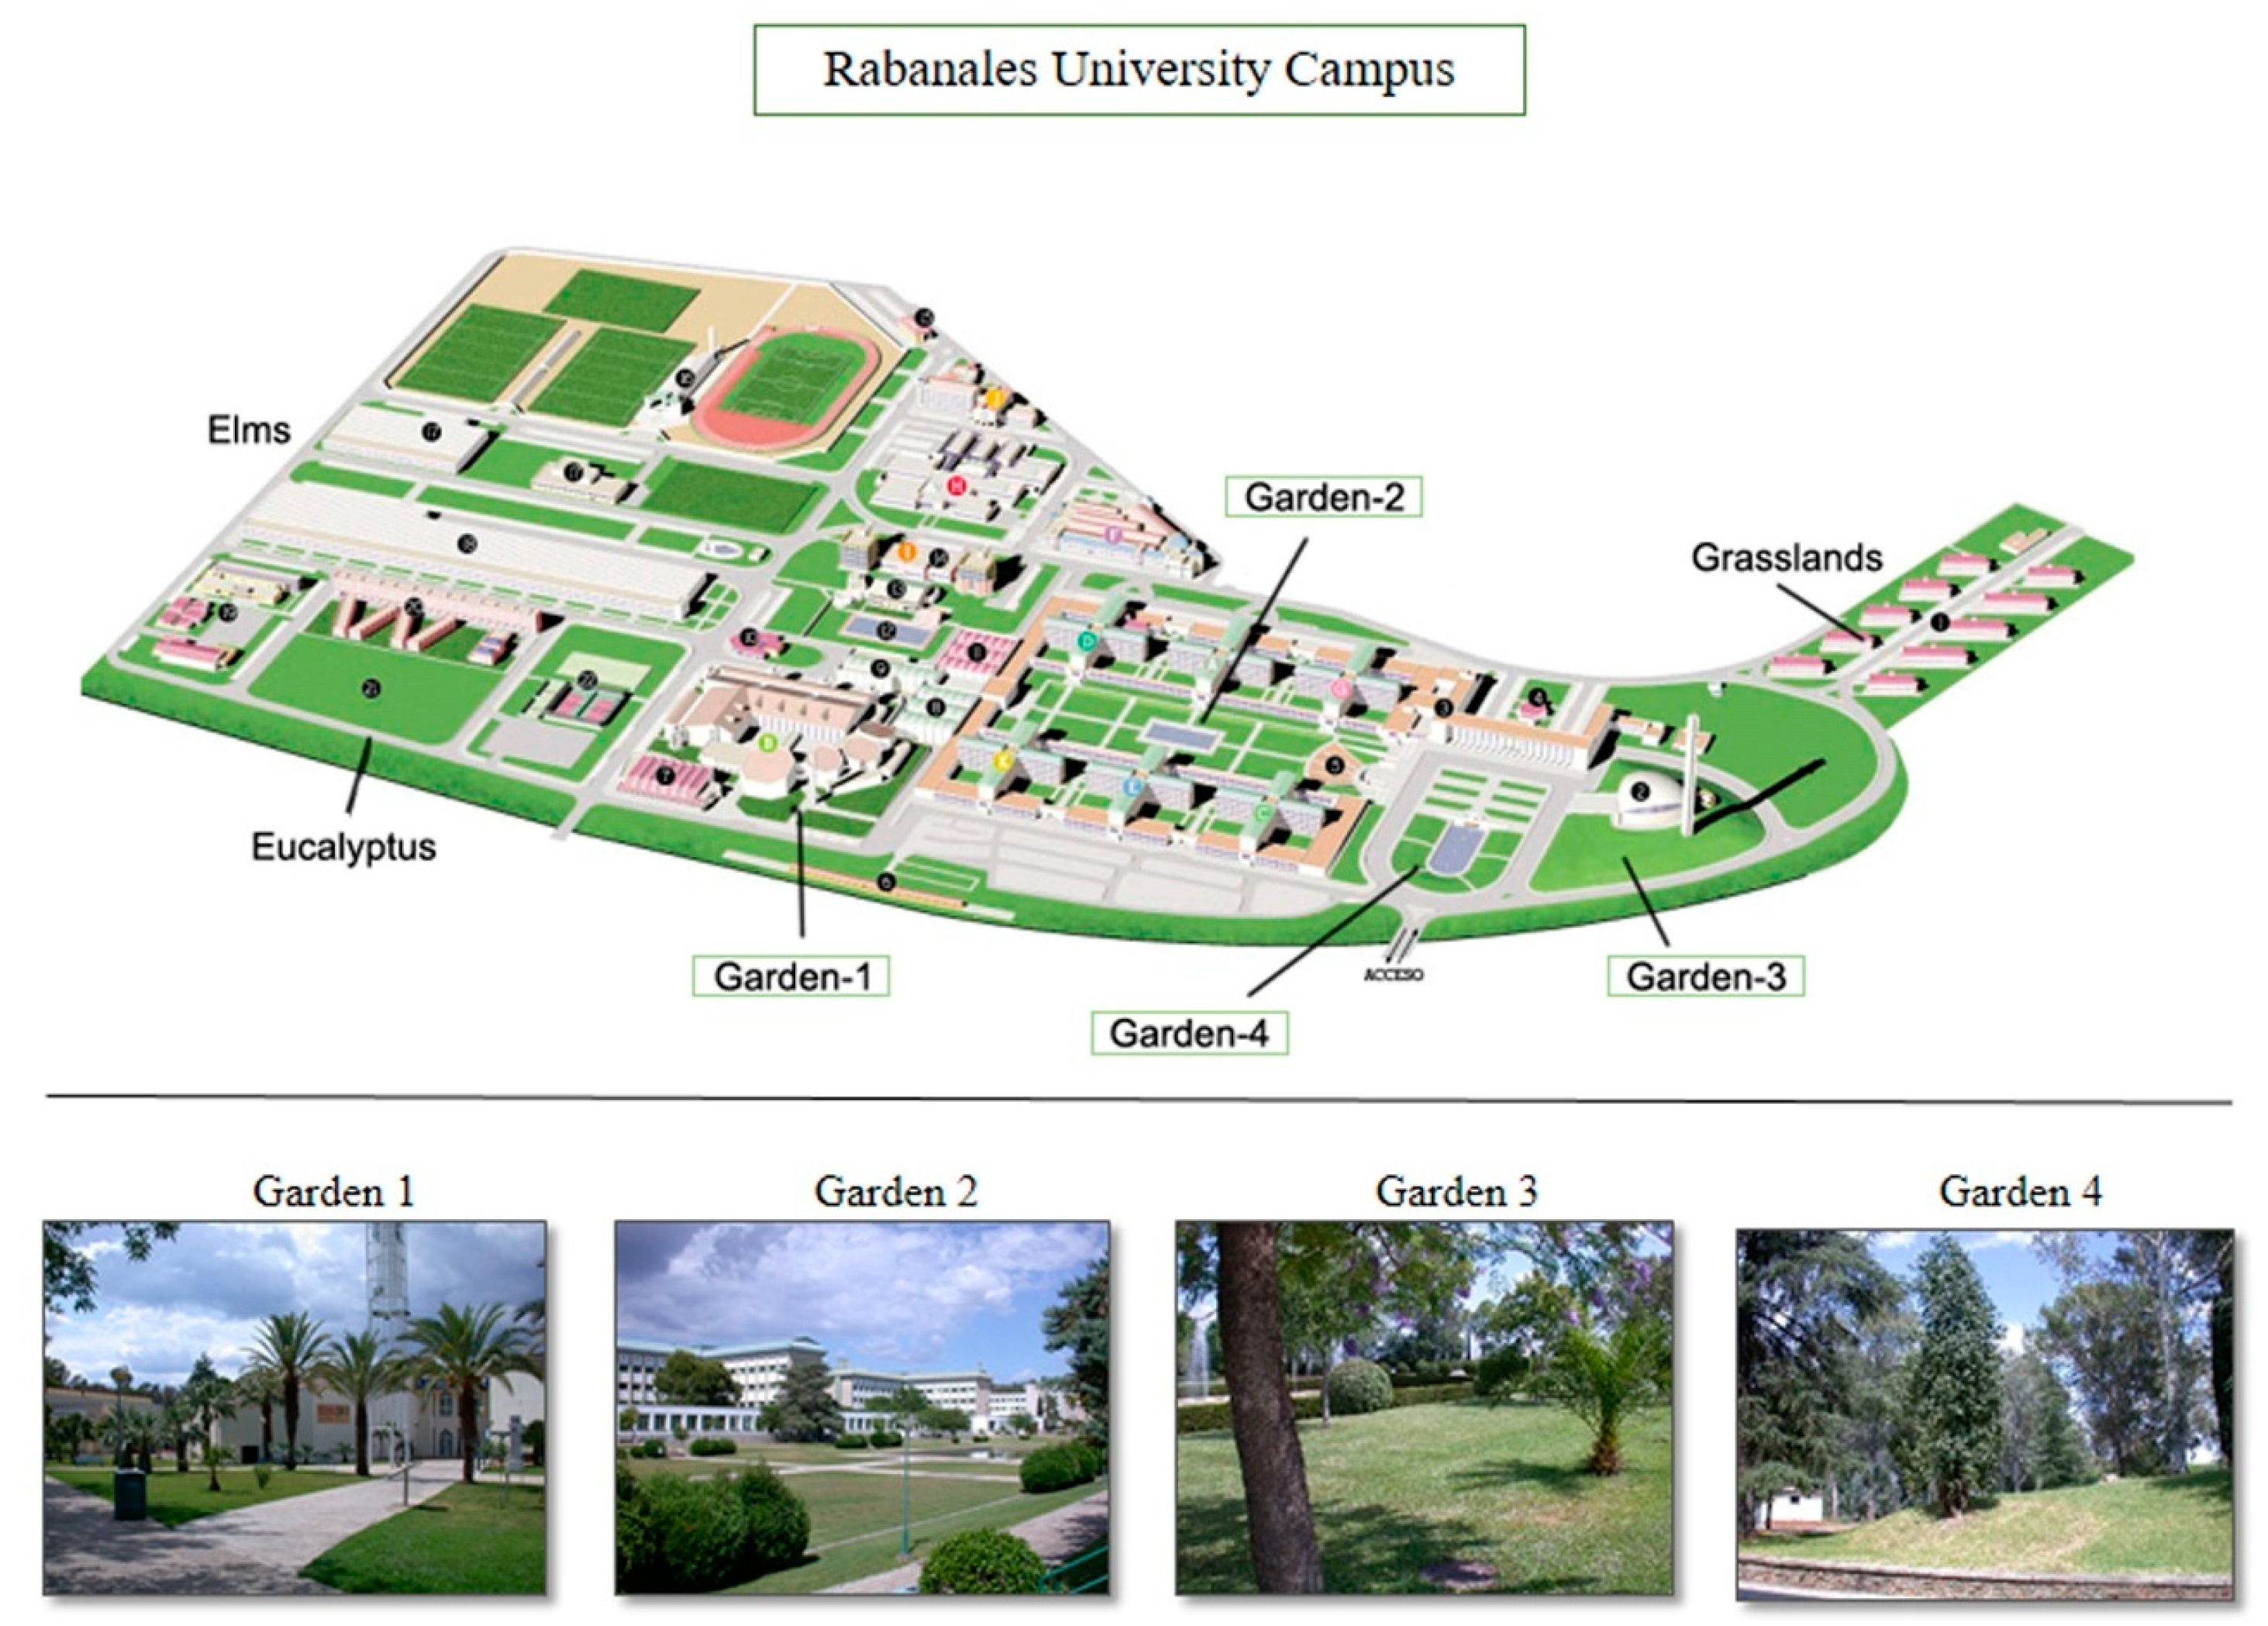
2.1. Study Areas

The Rabanales Campus of the University of Córdoba was inaugurated in 1999, following the renovation of what had previously been the Vocational University of Córdoba (Universidad laboral de Córdoba). It is located 3 km outside the city and covers a surface area of 50 ha. In this region, the climate is continental Mediterranean and is influenced by the Atlantic Ocean: winters are mild, with occasional frost, and summers are hot, with temperatures that can exceed 40 °C. Precipitation mainly falls during the colder months. Summer droughts are common, which means that irrigation is essential.
In this study, we sampled the four main gardens on campus (referred to as Garden 1, Garden 2, Garden 3, and Garden 4) using pitfall traps (Figure 1). Gardens 2, 3, and 4 were originally established in 1956 when the campus first opened. However, they underwent several renovations starting in the late 1990s when the campus reopened. In contrast, Garden 1, a small garden (4325 m2) located in front of the lecture hall, was newly constructed in 2005. Garden 2 is the largest of the gardens (17,094 m2). This garden is located behind the library and has a fountain at its center. Garden 3 is the second largest garden (11,063 m2), and it has a small building that is also located in the center. Garden 4 covers 8346 m2, and like Garden 2, it has a fountain at the center. The four gardens are located relatively close to one another (but still separated by buildings), and they display similar landscaping, namely an expanse of lawn with the very sporadic presence of herbs due to the maintenance labors. In all four gardens, there are some ornamental bushes and trees, whose composition varies across the gardens. In Garden 1, there are a Chinese fan palm (Livistona chinensis), an ombu tree (Phytolacca dioica), and date palm trees (Phoenix dactilifera). In Garden 2, the plant composition includes the atlas cedar (Cedrus atlantica), the Japanese pittosporum (Pittosporum tobira), oriental arborvitae (Thuja orientalis), oleander (Nerium oleander), European privet (Ligustrum vulgare), and carob tree (Ceratonia siliqua). Garden 3 is the most different one since its vegetation constitutes an Aleppo pine grove. Finally, Garden 4 is the garden with a larger variety of ornamental plants, including the date palm (Phoenix dactilifera), European privet (Ligustrum vulgare), silver wattle (Acacia dealbata), box elder (Hacer negundo), smooth-leaved elm (Ulmus minor), crepe myrtle (Lagerstroemia indica), Red-leaf Photinia (Plotinia serrulata), rose of Sharon (Hibiscus syriacus), Southern catalpa (Catalpa bignonioides), Judas tree (Cercis siliquastrum), bull bay (Magnolia grandiflora), Ceylon cinnamon tree (Cinnamomum verum), and London plane tree (Platanus hispanica). All the gardens are regularly maintained. Three of the four are watered, providing crucial moisture during the hot and dry season in the south of the Iberian Peninsula (late spring and summer) with the exception of Garden 2, which is not connected to the automatic watering system and, therefore, experiences major droughts.
The gardens are surrounded by two natural areas (Elms 1 and Elms 2) and three seminatural areas (named Eucalyptus, Grassland 1, and Grassland 2 according to their main vegetation composition). Elms 1 and Elms 2 are elm groves located along a streambank, covering areas of 1081 m2 and 782 m2, respectively. The Eucalyptus area is a reforested grove of Eucalyptus camaldulensis, spanning approximately 4250 m2. Grassland 1 covers 1825 m2 and features herbaceous vegetation along with Mediterranean shrubs such as Rosmarinus officinalis, Pistacia lentiscus, and Quercus coccifera. Grassland 2, approximately 3600 m2 in size, also consists of Mediterranean herbaceous vegetation but lacks the aforementioned shrubs. None of these areas receive any maintenance. Additionally, due to the environmental policy of the University of Córdoba, the use of pesticides is not allowed on the campus.

2.2. Sampling Method

We carried out pitfall trapping in the four gardens over a period of 10 years (2004–2013, both included). Sampling occurred in June or July, which are the months of maximum ant activity in Europe [32]. Each year in each garden, we set 20 pitfall traps, distributed in two independent transects. Exceptionally, Garden 2 was sampled twice in 2005, and Garden 3 could not be sampled in 2006. The pitfall traps used in the study were semi-transparent plastic cups with a depth of 7.3 cm that measured 5.7 cm in diameter at their top lip and 5 cm in diameter at their base (REF. 409702, DELTALAB SL). They were filled with 50 mL of water, to which 1–2 drops of detergent were added to reduce the surface tension and thus prevent ants from escaping. The traps were placed 10 to a transect and were left open for 48 h, which was enough time to limit digging-in effects [33], capture a maximum number of species, and avoid trap desiccation and the deterioration of the captured material due to high temperatures. Pitfalls along a given transect were separated by 5 m. They were placed to cover as many different microhabitats as possible (under trees, shrubs, garden lawn, etc.), and the 10-pitfall transects were separated by at least 20 m. The contents of the traps were collected and brought to the laboratory to identify the ants under the stereomicroscope using the identification keys available in Tinaut Ranera [34] and followed by comparison with the material from the personal collection of Reyes-López at the Department of Botany, Ecology and Plant Physiology (University of Córdoba). Punctually, for the identification of some specimens, we used the online keys available in AntWiki [35] and Hormigas.org [36].
Data on the ant communities present in the natural and seminatural areas were gathered during an ecological study carried out at the University of Córdoba to assess the biodiversity of Rabanales Campus. In the study, the same sampling methodology was used (same type of pitfall traps and sampling schedule), but the years of sampling differed. The information about the species present in these areas was gathered as follows: species present in a total of 30 pitfall traps placed in Eucalyptus in 2005; a total of 100 pitfall traps placed in Elms during the years 2001 and 2002; Elms 2 was sampled in 2001 with a total of 75 pitfall traps; and Grassland 1 and Grassland 2 were sampled in 2001, 2005, and 2013 with a total of 460 and 90 pitfall traps, respectively.

2.3. Statistical Analyses

All of our statistical analyses were carried out with R [37]. We created graphical representations of the results using the ggplot function in the ggplot2 package.

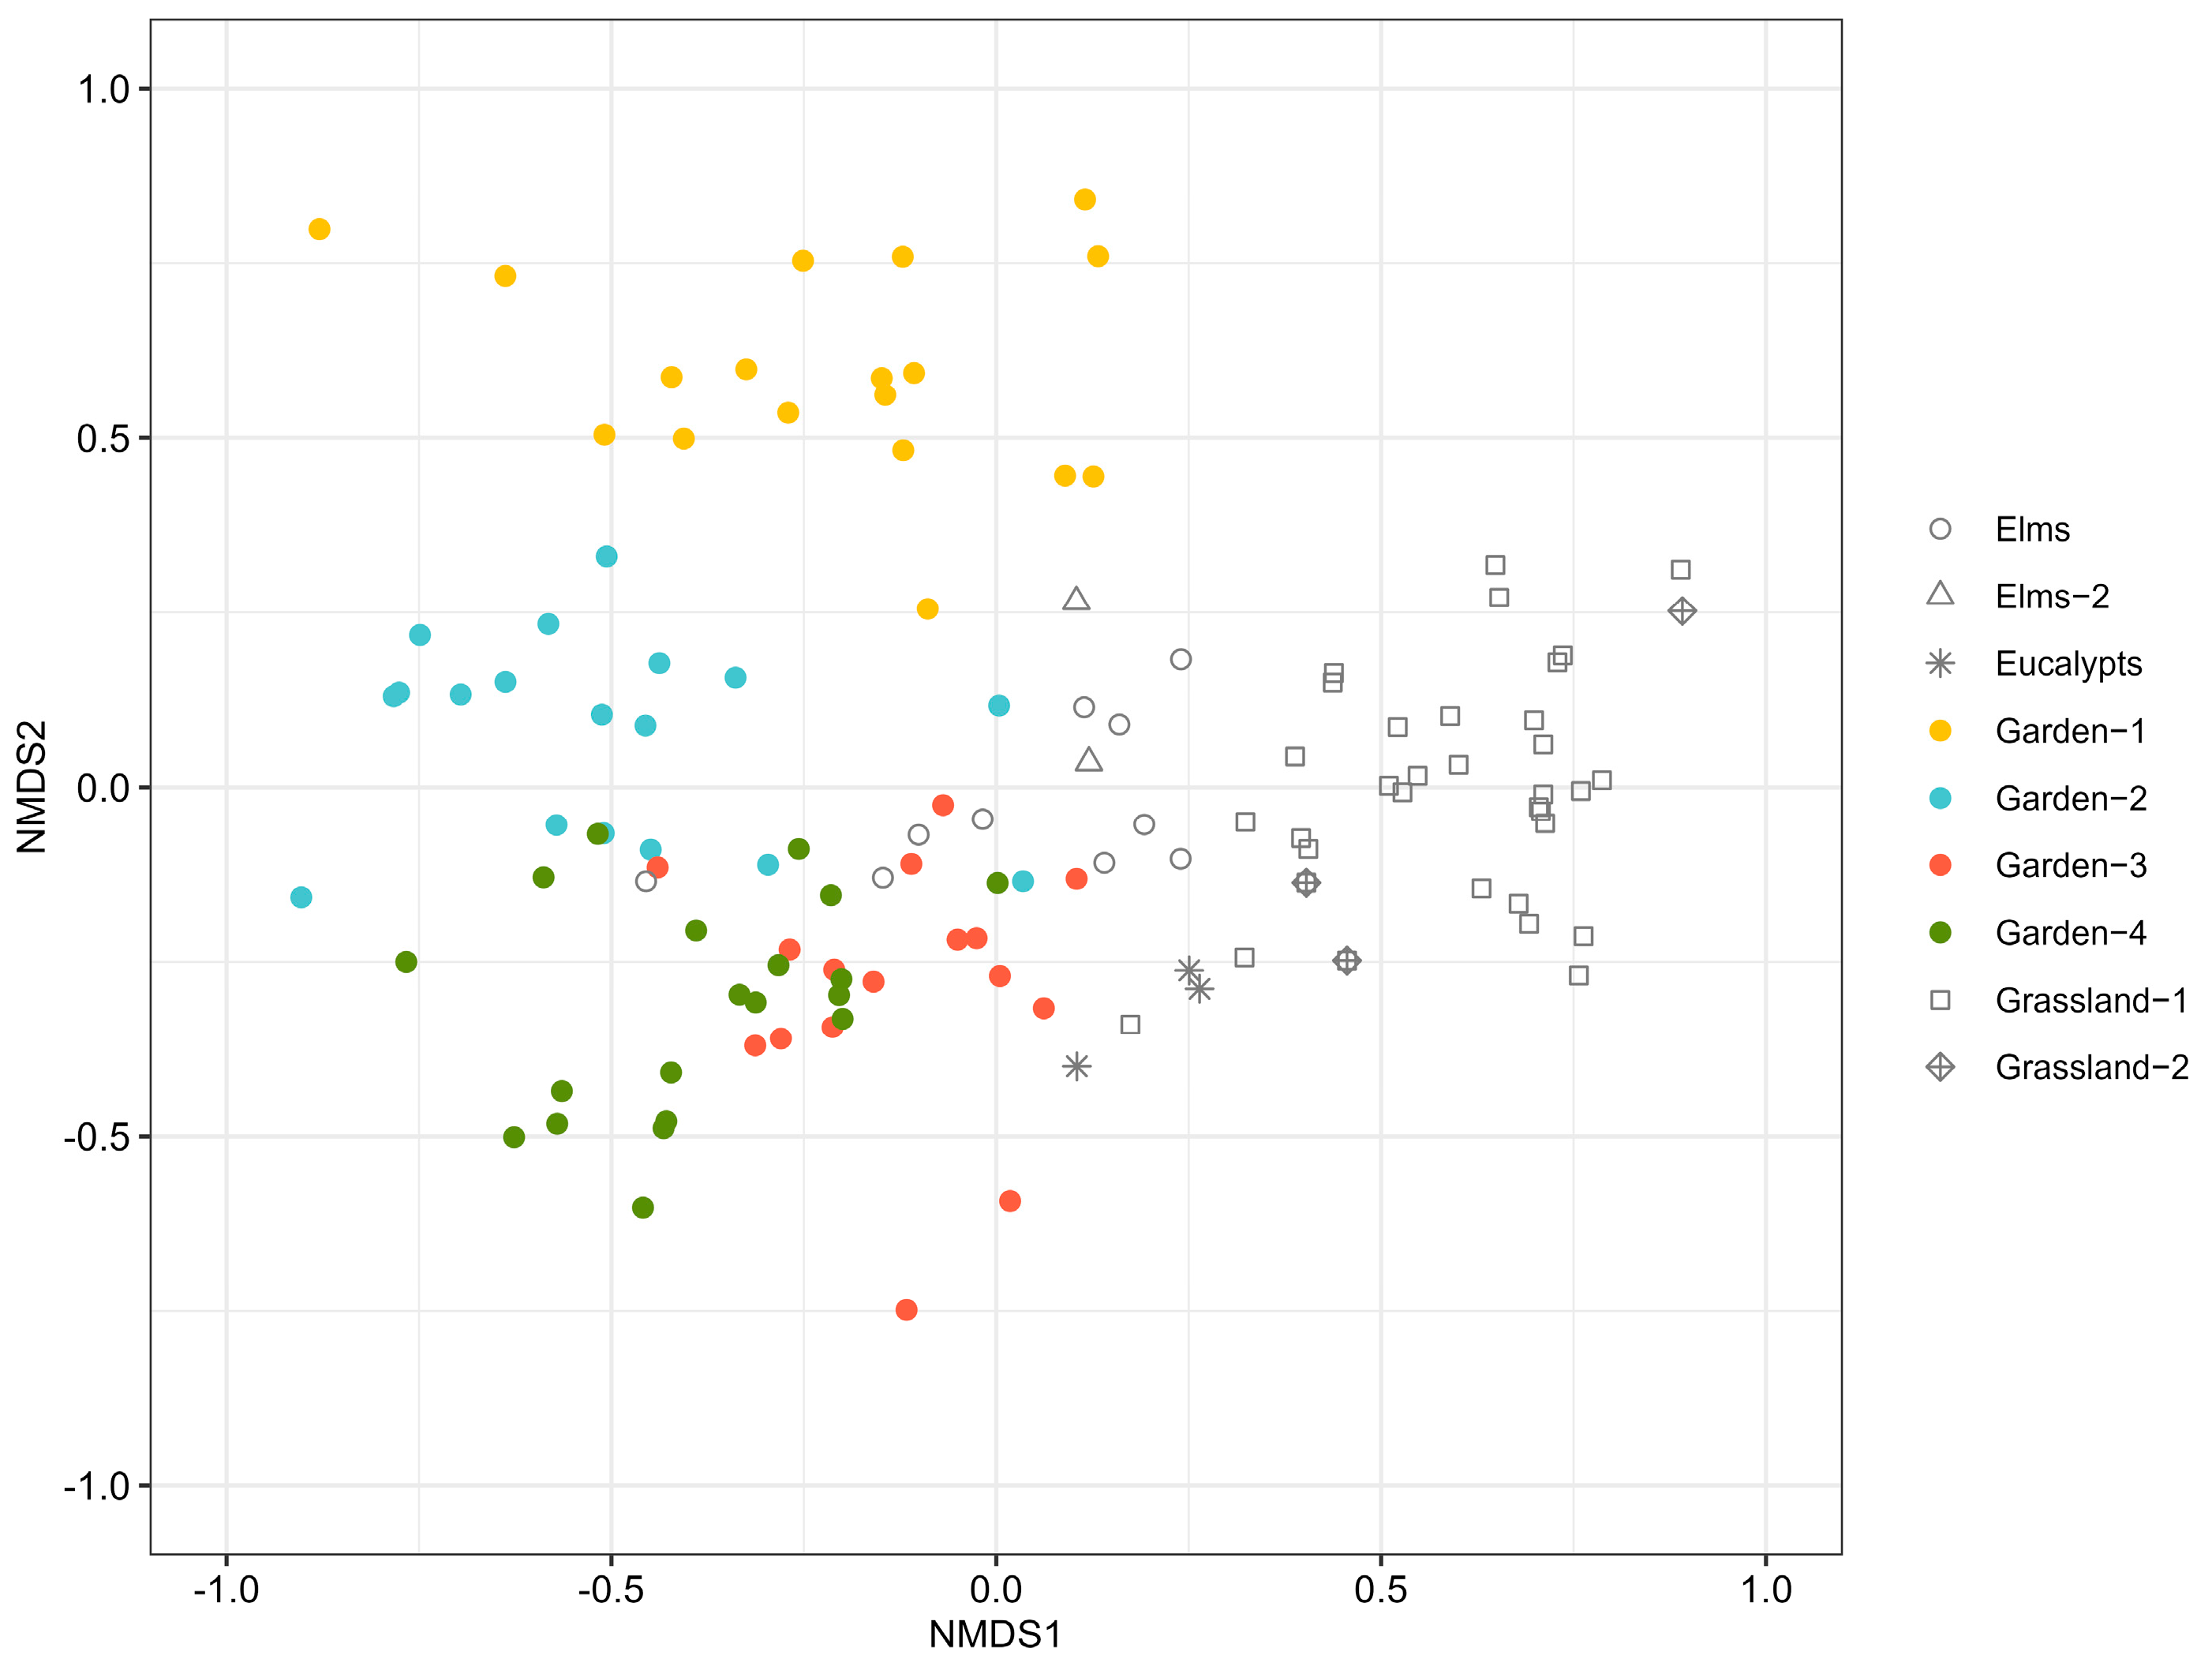
2.3.1. Comparing Ant Communities Among Campus Habitats

To explore habitat-related differences in ant communities, we performed permutational multivariate analyses of variance (PERMANOVAs; vegan package: adonis2 function; [38]) using the matrix of species presence/absence per transect each sampled year, followed by a post hoc (Holm test) to explore further pairwise comparisons between the study areas (vegan package: pairwise.adonis function; [38]). We compared the ant community composition (1) among the gardens, natural areas, and seminatural areas (using data for each transect and year). We employed non-metric multidimensional scaling (NMDS) to visualize the results (vegan package: metaMDS function [Bray–Curtis] distance).

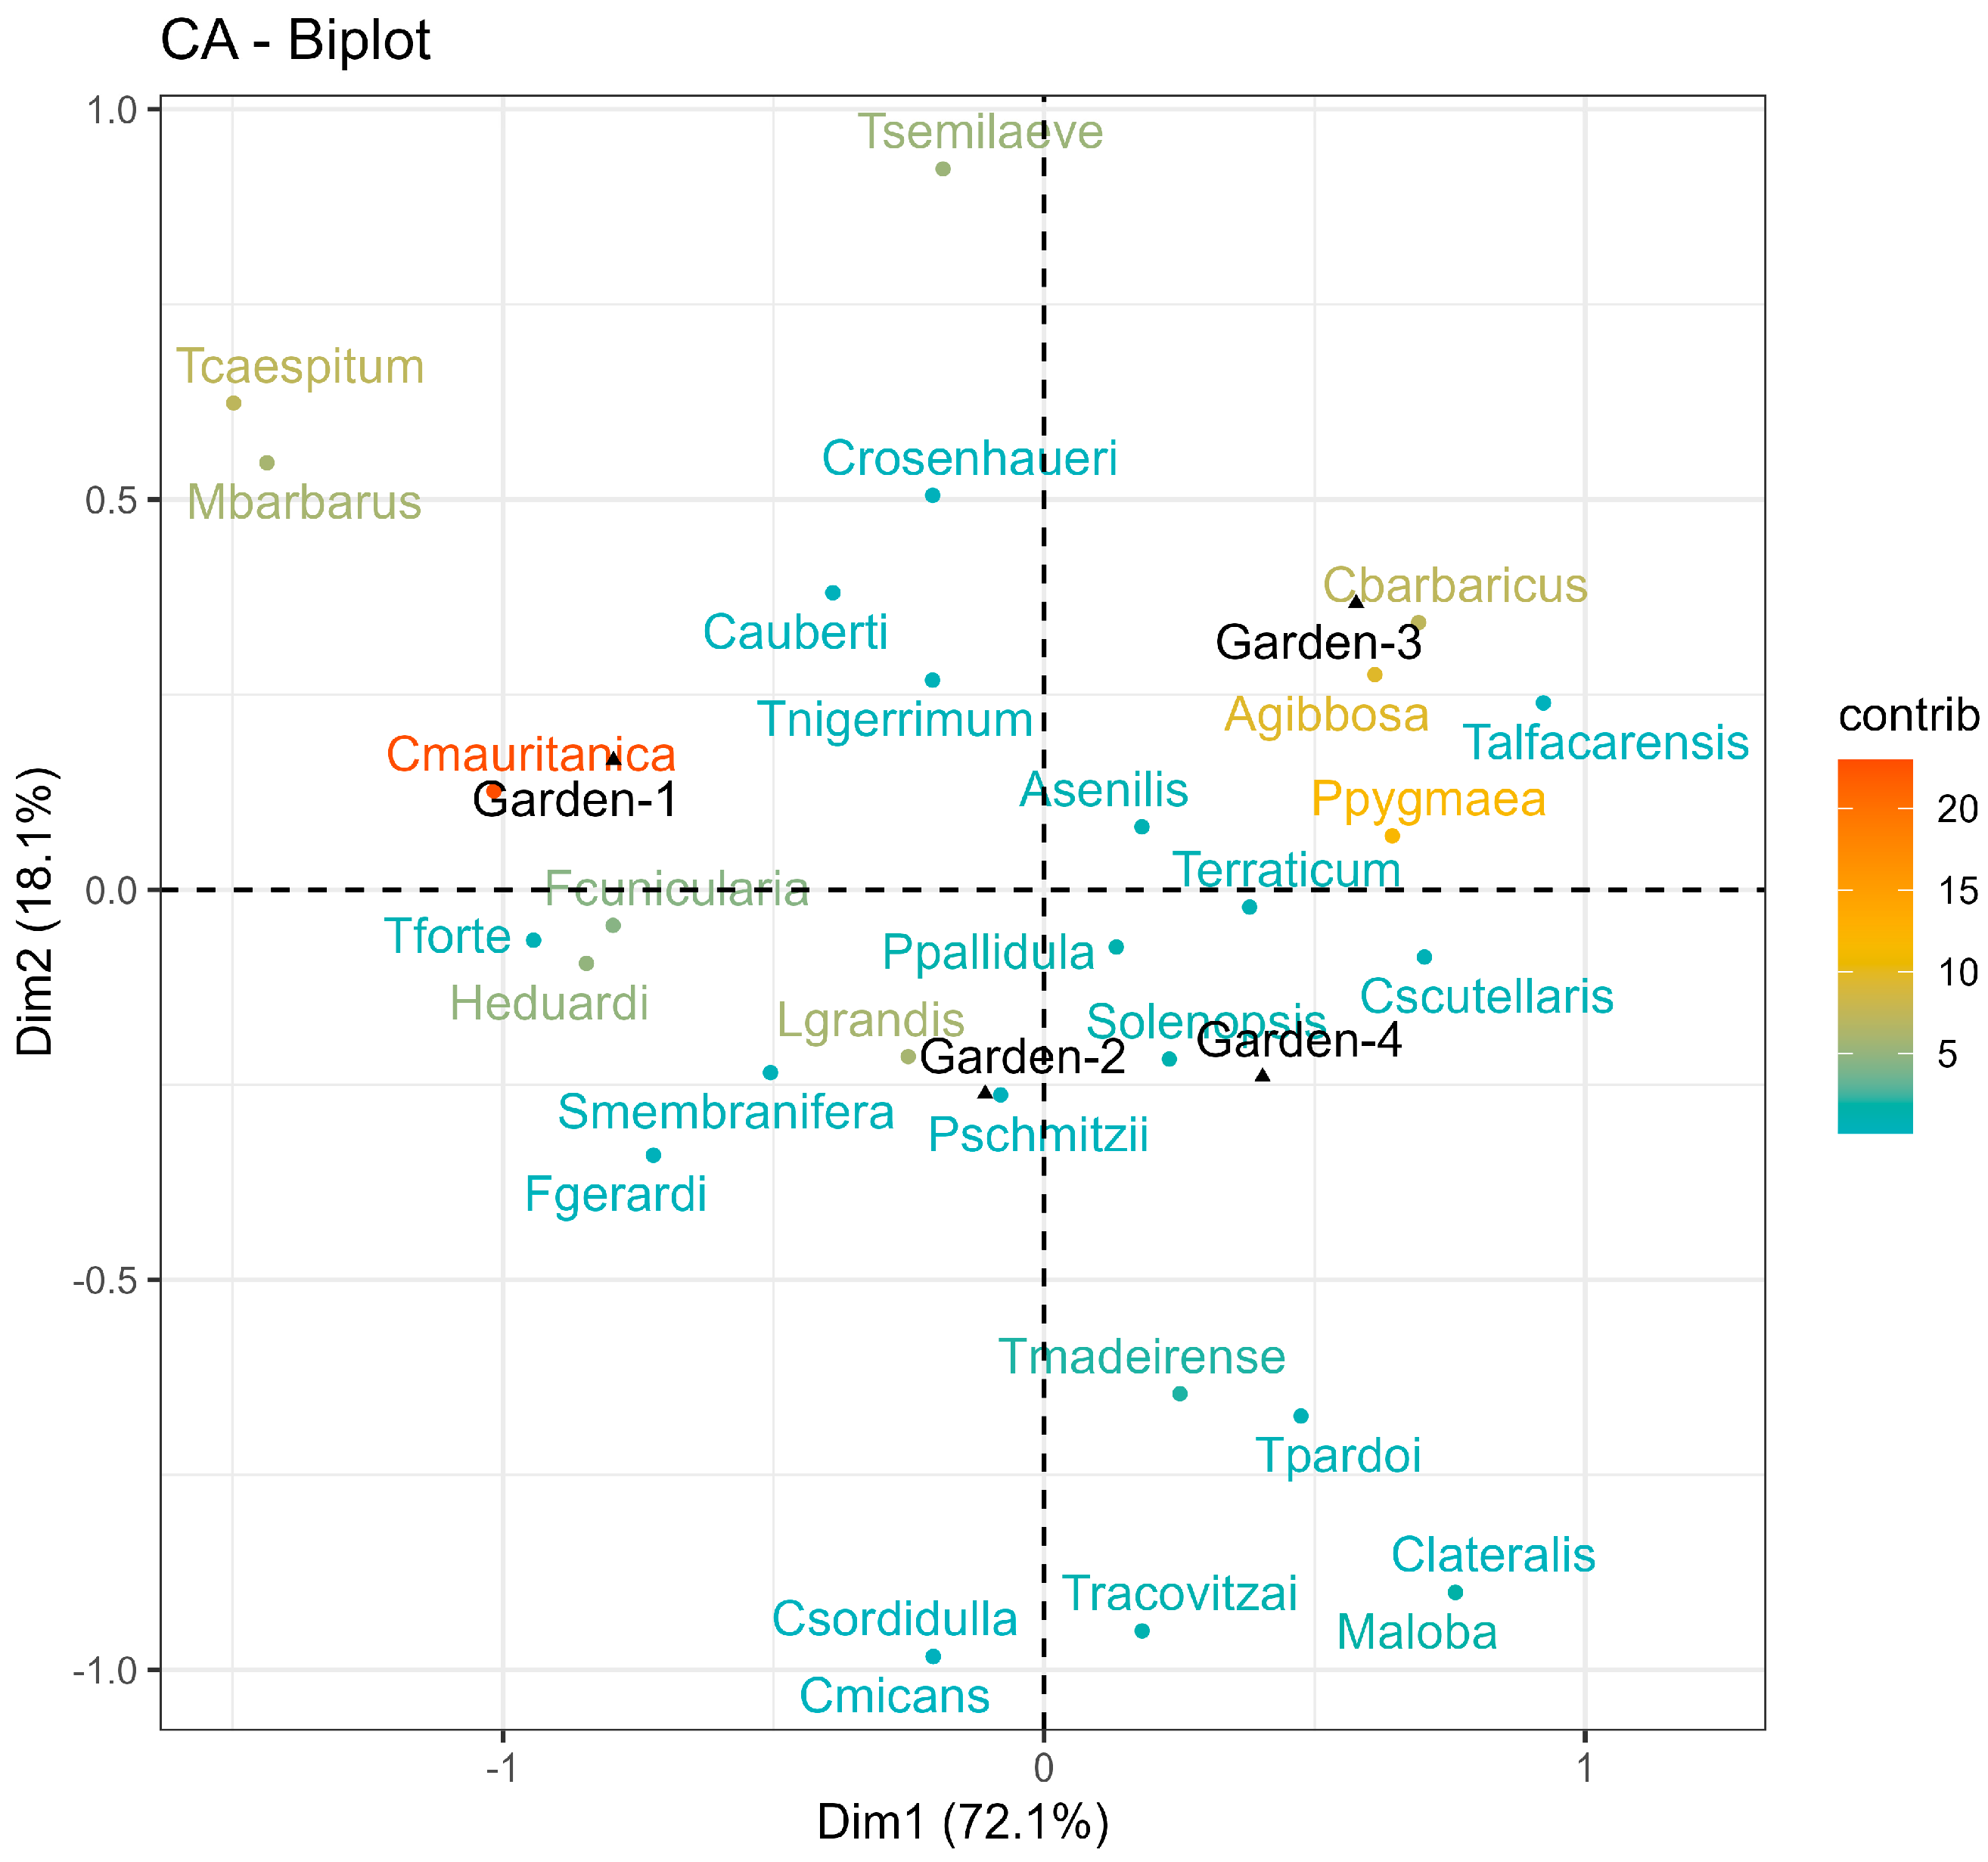
2.3.2. Species–Habitat Association

We tested whether the species were associated with a particular habitat type using the indicator value method (IVM; [39]). First, we calculated the indicator values (IVs) for the species observed on campus using relative species abundance for a given ant community (indicspecies package: multipatt function; [40]). Second, as highly artificial habitats like gardens can impact the presence of the species, we divided the campus’s habitats into two main groups—gardens (group 1) versus natural and seminatural areas (group 2)—and determined whether different ant species’ presence was associated with the group type. Third, we were also interested in potential differences among the four gardens since they differ in their trees’ and bushes’ composition, as well as in their watering maintenance during the warm season (lack of watering in Garden 2). Fourth, we tested the association between the ant species and the four different gardens by performing a correspondence analysis (CA) on the presence/absence matrix, including the number of pitfall traps per transect occupied by each species in each garden (FactoMineR package: CA function; [41]). We visualized the CA results using the fviz_ca_biplot function in the factoextra package [42].

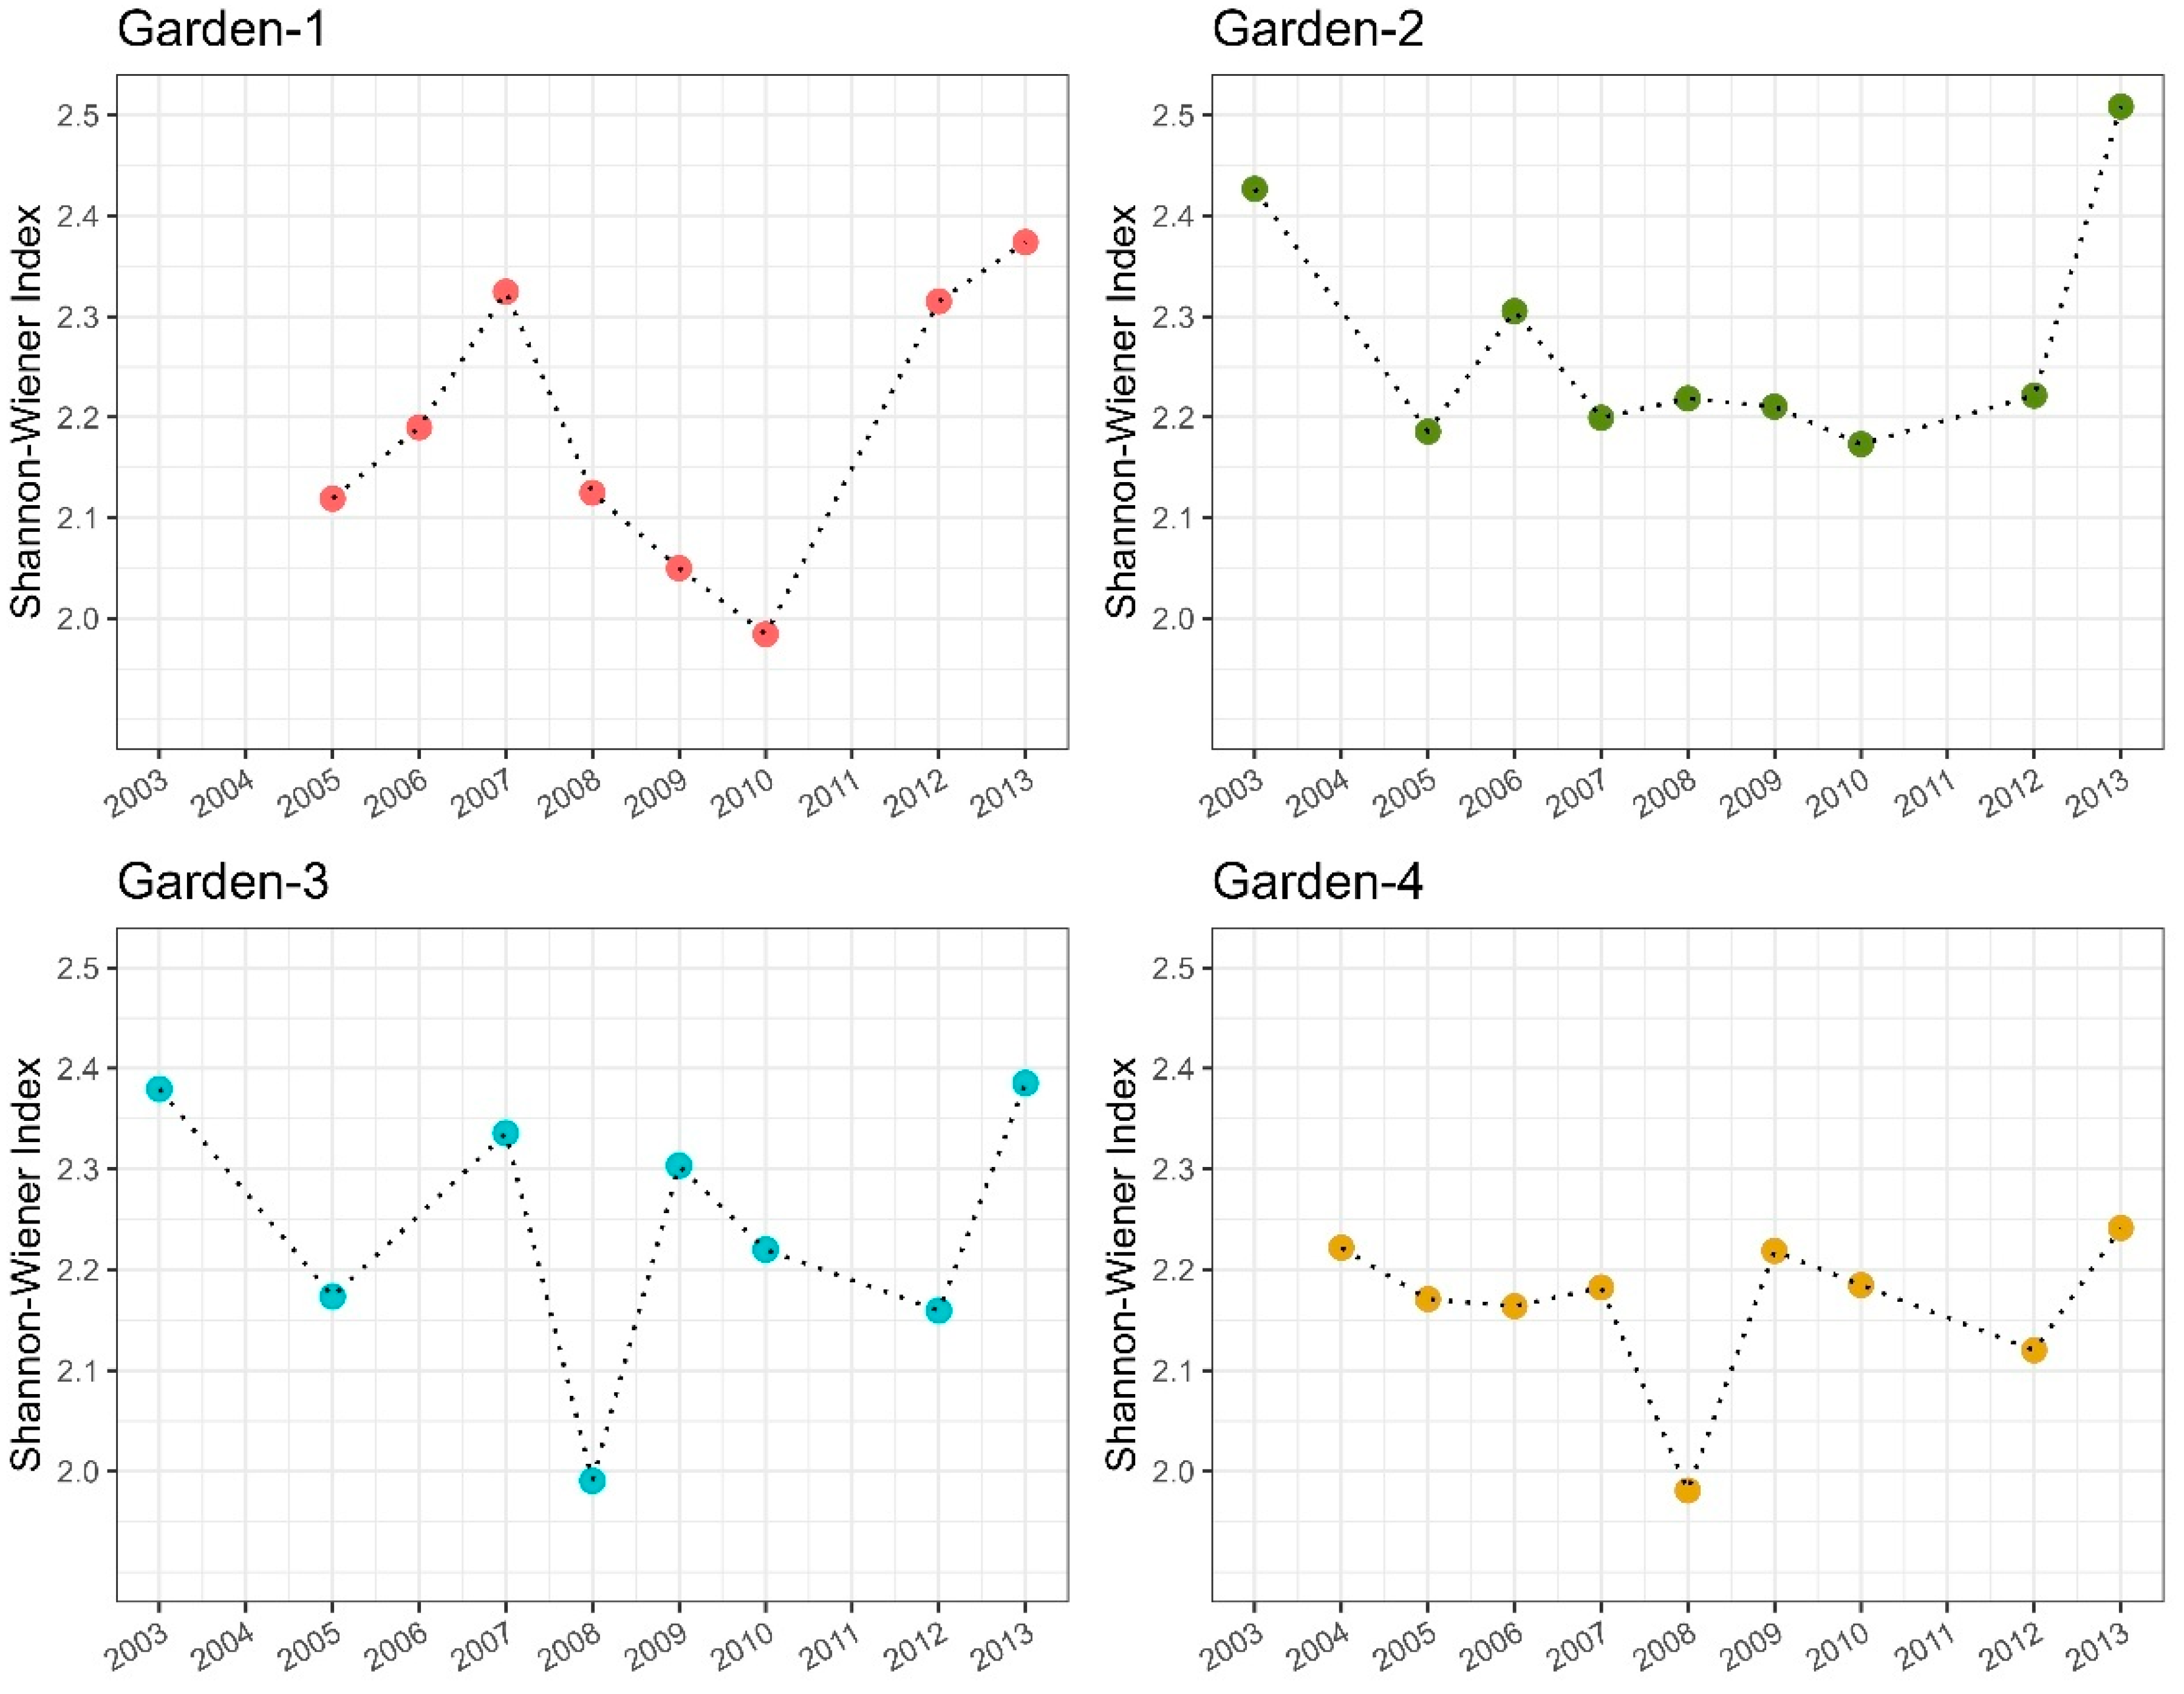
2.3.3. Species Population Dynamic over the Years

Local extinctions and colonization from the surroundings lead to changes in the biodiversity indexes over the years. Therefore, we first calculated the Shannon–Wiener index per each garden and study year. Later, we created a graphical representation of the data to check for differences in the biodiversity trends among the gardens.
To explore fluctuations in the abundance of the most representative species of the studied gardens (according to IV results) over the years, we carried out two GLMs (lme4 package: glm.nb function [negative binomial, maximum likelihood]). In the first of the models, the response variable was the total number of pitfalls per transect in which each species was found, and the year of sampling was used as the fixed factor. The establishment of a species’ population can be associated with the increase in the number of foragers due to colony growth. Then, we performed a second GLM (negative binomial, maximum likelihood) per each species in which the response variable was the species-specific number of workers per pitfall trap and the fixed factor was the year of sampling; transect identity was used as a random factor. The models were performed only for those species with a significant indicator value (IV) among gardens.

3. Results

In total, 30 ant species belonging to 18 genera were captured in the four study gardens (Table 1). On the entire campus, 41 species belonging to 19 genera were observed (Supplementary Table S1). Overall, the two most abundant species in the gardens were Lasius grandis and Pheidole pallidula, two anthropophilic ants that are common in Mediterranean gardens [11]. Two exotic species, Cardiocondyla mauritanica and Strumigenys membranifera, were particularly abundant in Garden 1 and Garden 2.

3.1. Comparing Ant Communities Among Campus Habitats

There were significant differences in the ant communities found in the different habitats (PERMANOVA: F = 19.689, p-value < 0.001, Supplementary Table S2). Among all gardens, Garden 3 and Garden 4 were more similar to the natural and seminatural areas, followed by Garden 2. The young Garden 1 was shown to be the one that differed the most from the ant community found in the natural and seminatural areas of the campus (NMDS: Figure 2; stress = 0.132).

3.2. Species–Habitat Association

The IV results clearly reflect the excellent bioindicator character of ants [43]. More generalist and opportunistic species (species occurring in a wide range of habitats) are associated with the youngest garden (Garden 1) and with the garden experiencing summer droughts. In contrast, specialist species (more specialized species occurring in habitats with specific local environmental conditions) are associated with the mature gardens provided of watering (Garden 3 and Garden 4), the natural areas, and the seminatural areas.
Many of the studied species show preferences for different types of habitats on the campus, depending on their ecology. For instance, the species associated with the gardens are mostly those considered synanthropic. They include the garden ant in the Mediterranean area L. grandis, the native P. pallidula, and the exotic species C. mauritanica and S. membranifera. The grasslands are characterized by the presence of the seed harvesting Messor species and G. hispanicum, whereas the forested areas (Elms and Elms-2) are characterized by the higher presence of A. dulcineae, Temnothorax spp., and Camponotus spp. Finally, Cataglyphis species are the most commonly found in natural open areas (Table 2).
Differences in species composition are also found among the gardens. The young Garden 1 is characterized by a higher presence of anthropophilic species, like the pavement ants Tetramorium spp., or species strongly linked to disturbed habitats—the exotic Moorish sneaking ant C. mauritanica [44] and the native H. eduardi (considered a widely spread tramp species [45])—and species linked to open grasslands but rarely found within urban lawns, like M. barbarus. The mature but summer-dry Garden 2 also hosted a high presence of exotic species like S. membranifera. Other representative species in this garden are the native thermotolerant species F. cunicularia, P. pygmaea, Solenopsis sp., and T. racovitzai. The oldest and watered gardens, Garden 3 and Garden 4, are characterized by the presence of species linked to Mediterranean forests like A. gibbosa or C. barbaricus (both with a higher presence in Garden 3) and M. aloba—the most hygrophilous species being found in the study—only present in Garden 4 (Figure 3; Table 1 and Table 2).

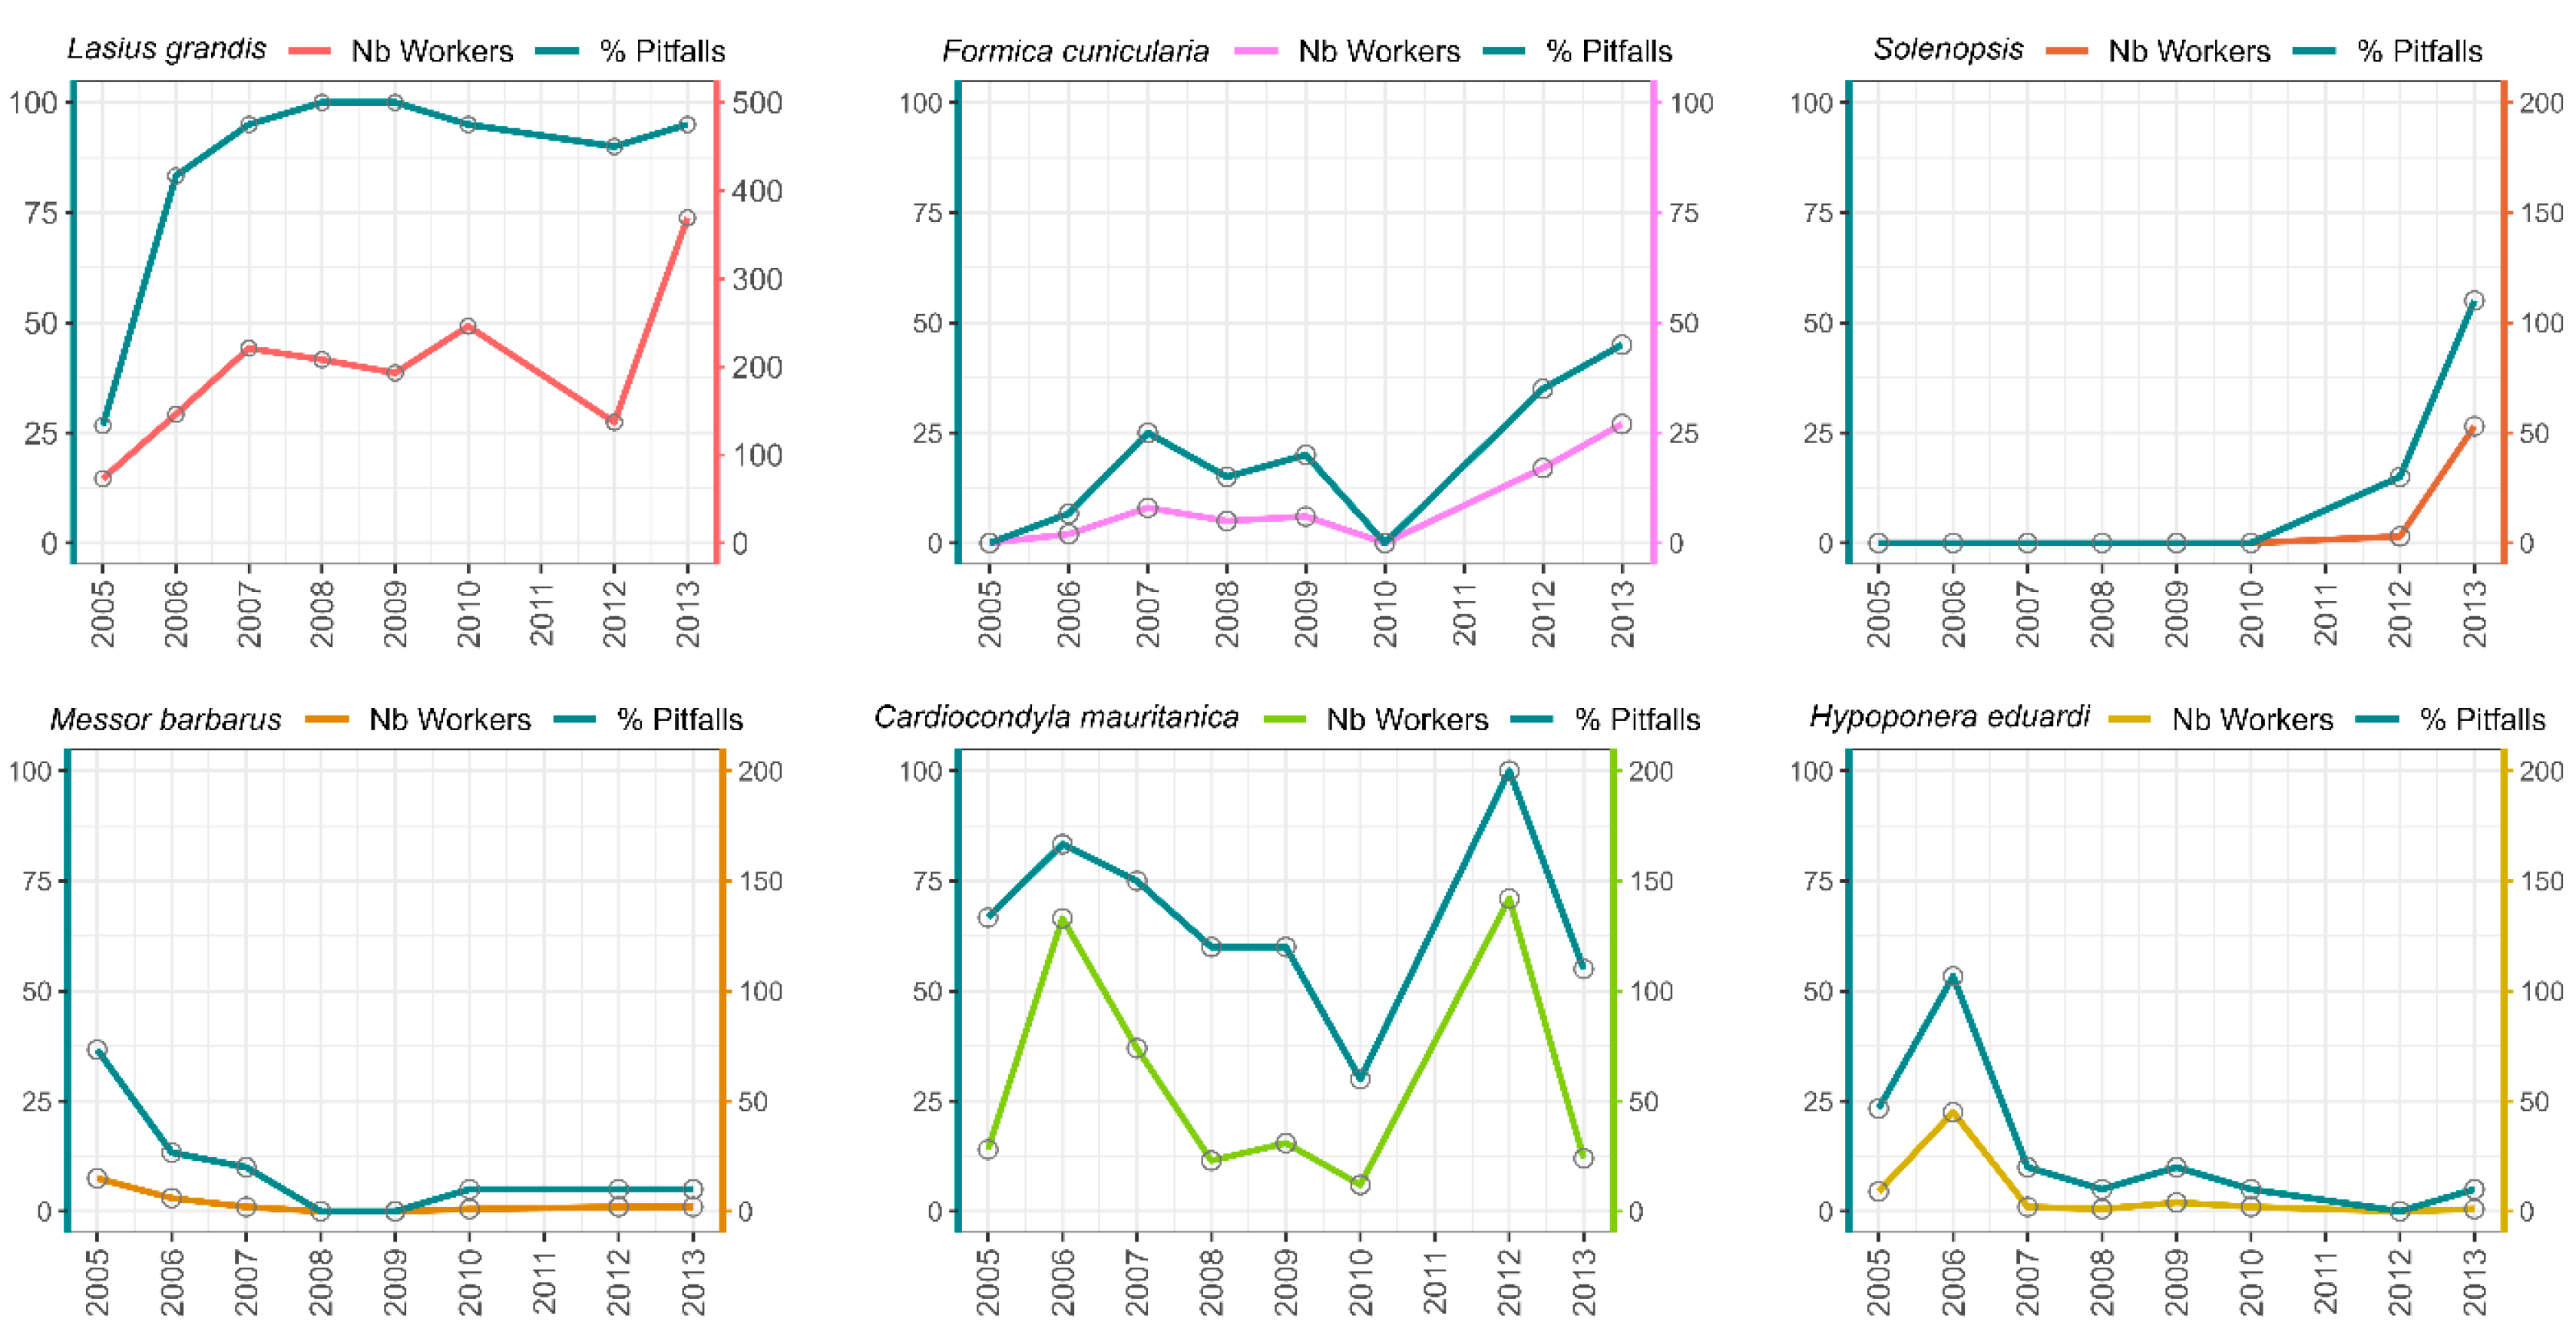
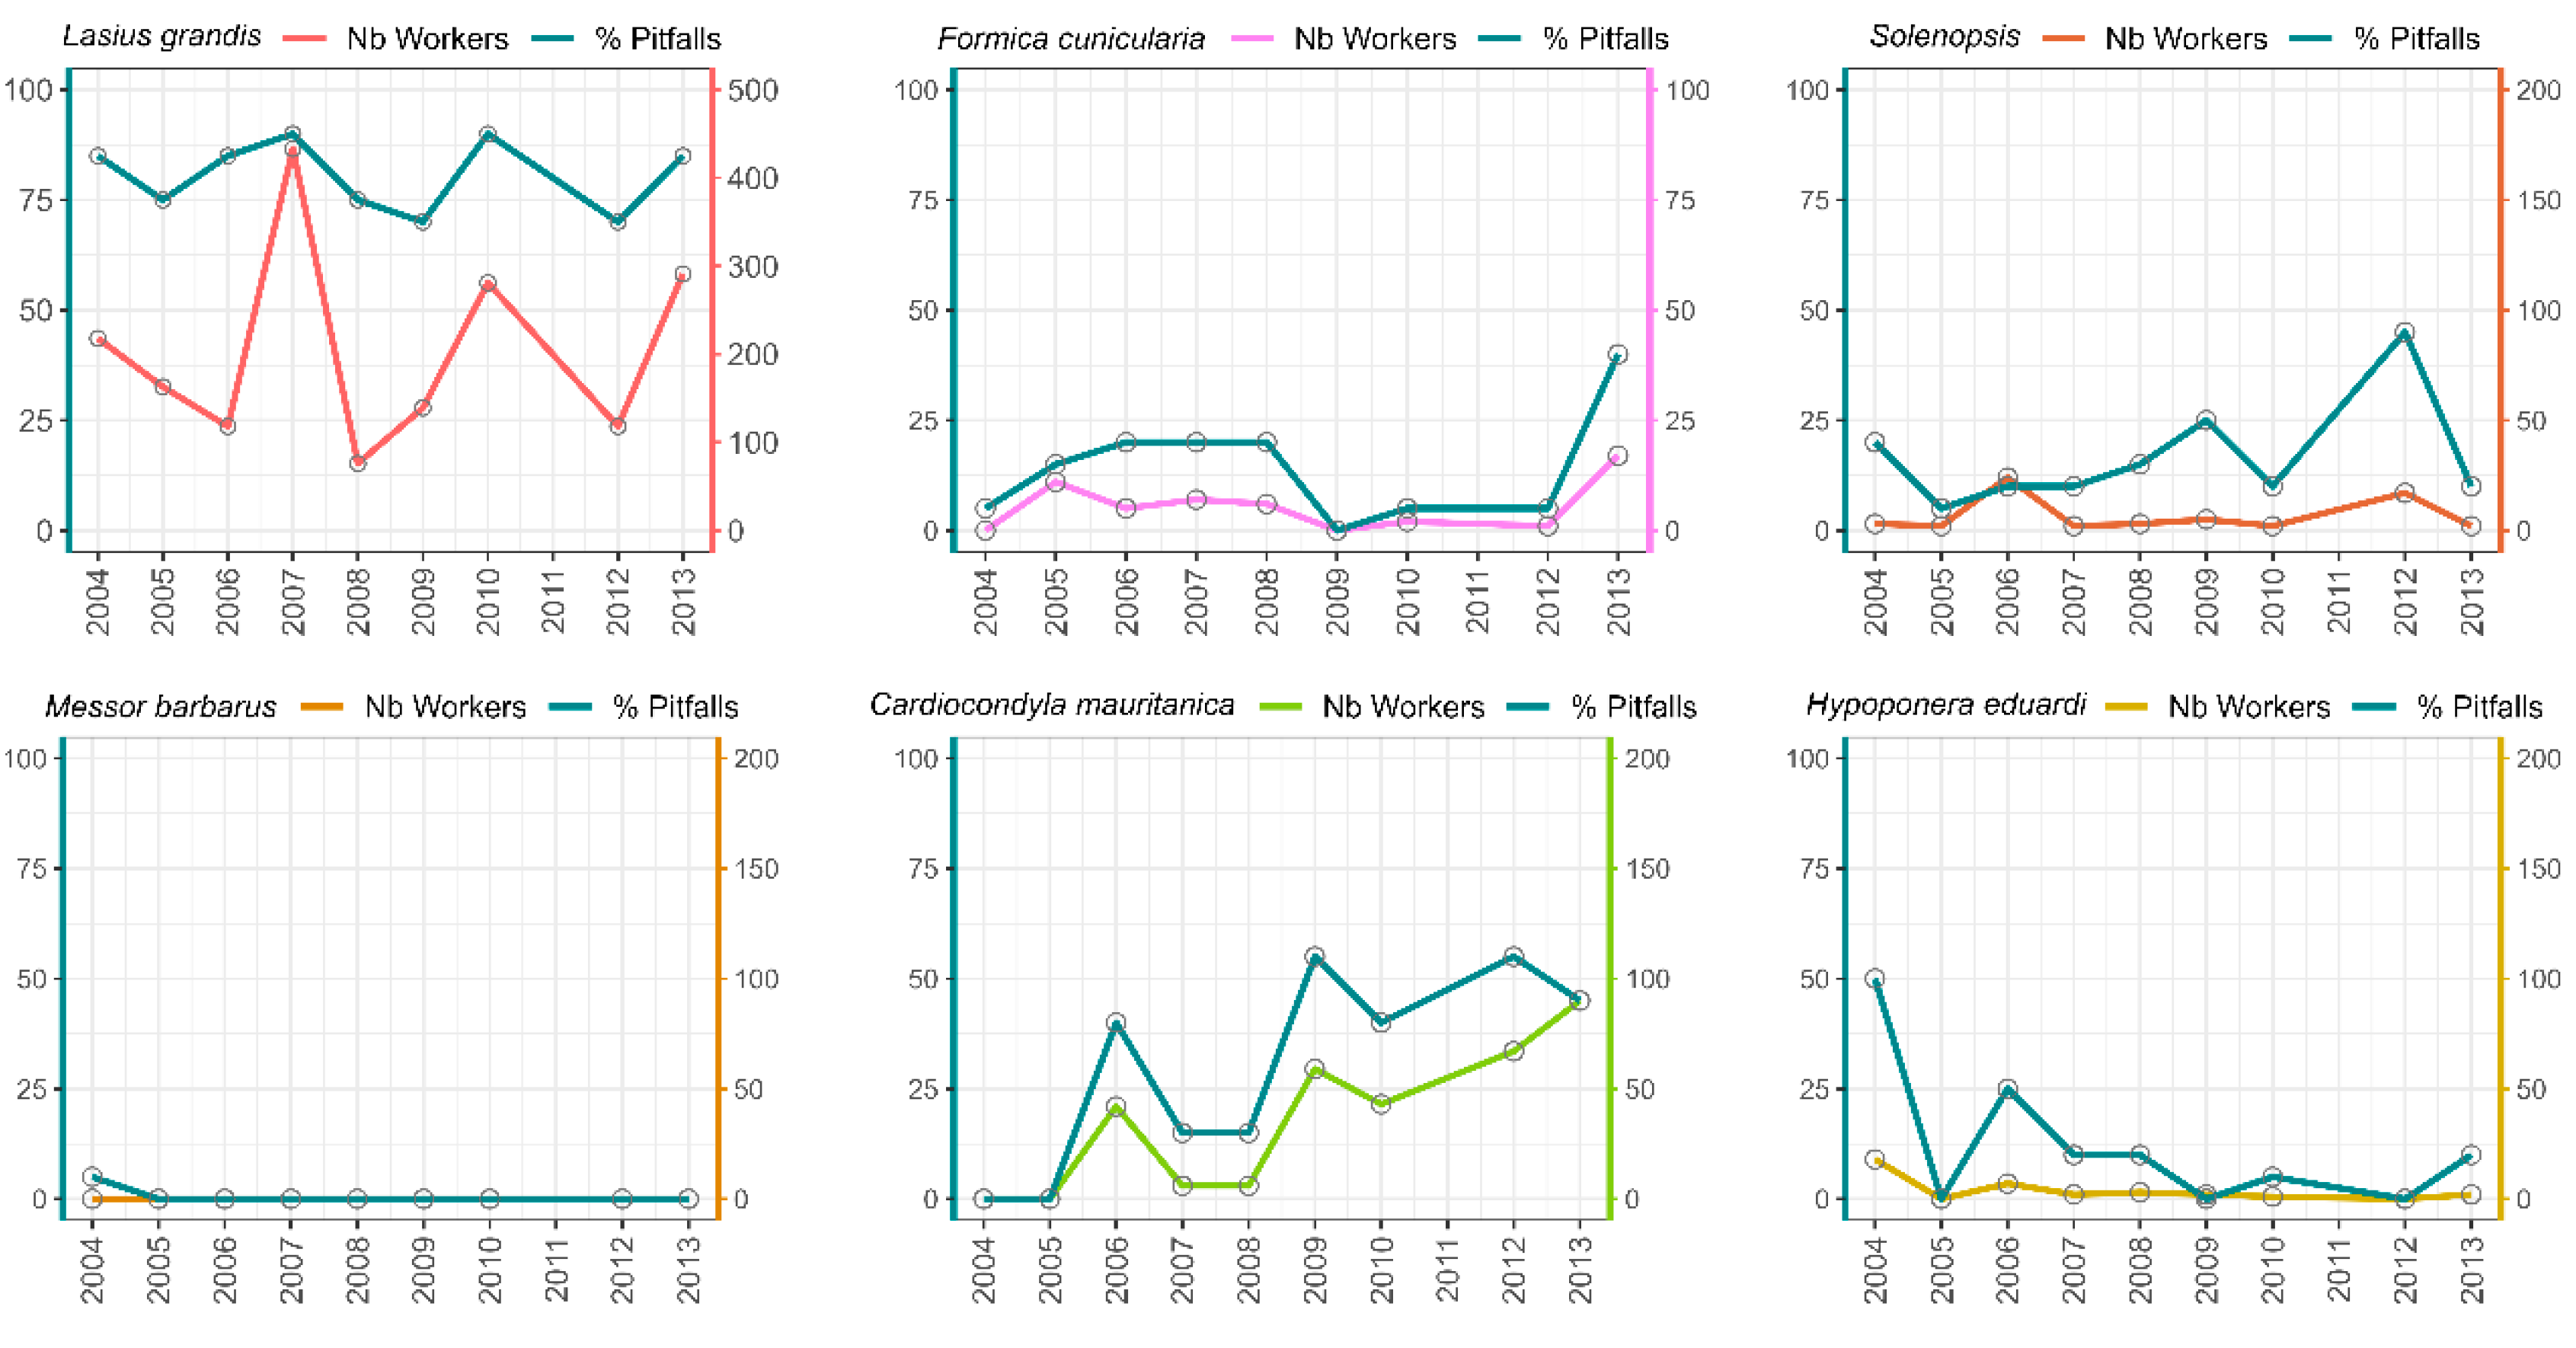
3.3. Relationship Between Species Abundance and Habitat Maturity

Among all four gardens, the young Garden 1 shows the largest biodiversity fluctuations over the years (Figure 4). Different ant species display different population-level trends among the gardens over time. In general, Garden 3 and Garden 4 harbor more stable populations over the years (Table 3; Figure 4; Supplementary Figures S1 and S2). In contrast, Garden 1 (the younger garden) and Garden 2 (the disturbed mature garden) are home to highly fluctuating populations of species with higher IVs.
In Garden 1, populations of common garden dwellers such as L. grandis, F. cunicularia, and Solenopsis species grew significantly over the years (both in terms of pitfall traps occupied and the number of workers in the traps) (Figure 5).
No significant patterns of this type were observed in the other three, more mature gardens. Furthermore, the exotic C. mauritanica occurs at higher abundances in Garden 1 and increased in abundance in Garden 2 over time (Figure 5 and Figure 6). The population of H. edudardi decreased in Garden 1 and increased in Garden 2 (Figure 5 and Figure 6). Finally, the seed harvester M. barbarus, which was only seen in Garden 1, declined significantly in abundance through the years (Figure 5 and Figure 6).

4. Discussion

Ants are recognized as important bioindicators in ecosystems [29,46], with their presence or absence closely linked to habitat features [3,10,47,48]. Consequently, the design, location, and plant diversity of urban green spaces are crucial in determining whether these habitats can function as refuges for local species [6,10,11,30]. However, the construction of new green spaces usually involves significant habitat disturbances and the use of materials for construction and ornamentation that can inadvertently transport clusters of exotic species, which often benefit from these disturbances [49,50,51]. Our results support these findings, as the presence of exotic species was recorded only in the gardens on the campus, while the more natural surrounding areas were free of them. Moreover, among the gardens, Garden 1, the most recently constructed, had the highest number of synanthropic and exotic species, including C. mauritanica and S. membranifera.
One major challenge is to construct urban greenery that effectively serves its intended ecological and recreational functions, even at small sizes, such as gardens. The plant composition and maintenance practices in these areas can act as filtering factors that shape their ant communities by regulating key environmental characteristics such as soil humidity and nesting resources [52], illumination [53], or food sources [54,55,56], among others. Accordingly, only four gardens on the university campus were able to serve as refuge for at least 30 ant species (potentially more, as hypogeic ant species are difficult to capture), representing nearly 10% of the Iberian Peninsula’s myrmecofauna. Although the structure of the soil surface (a large lawn) was shared among all four gardens, the ornamental plants and the presence of fountains, paved paths, or differences in their maintenance provided a sufficient diversity of microhabitats to host this high diversity, supporting the already mentioned capacity of urban greenery to host a high ant species richness [6].
As previously outlined, the species composition of urban green spaces follows the principles described by the theory of island biogeography [16], in which final biodiversity results from the interplay of local extinctions and the arrival of species from surrounding habitats. In urban green spaces, local disturbances, regardless of their nature, lead to an initial biodiversity loss that is gradually recovered through colonization from the surrounding areas [57]. Consequently, these green spaces experience changes in their biodiversity composition over the years, increasing the similarities in species composition between the donor and the receiver areas. Thus, the similarity between the ant community at a given site and in the nearby landscape can be used to reveal the site’s ecological status [15,58,59]. Over our ten years of monitoring, we have observed a similar trend supporting the theory of island biogeography, as the older gardens (Garden 2, Garden 3, and Garden 4) tended to harbor more similar ant biodiversity to the surrounding areas than the young ones.
Not all arriving species are able to survive, as their survival depends on whether the characteristics of the destination habitat align with their specific ecological requirements. A similar fate is shared by the remnant populations of the original species, which will either persist or become extinct based on the compatibility between the habitat and the species’ needs. This specificity in species requirements is widely used to interpret the bioindicator information provided by the species gathered in each habitat. Indeed, it has enabled researchers like Andersen [19] and many others to classify ant species from different regions or habitat types into bioindicator functional groups [25,26,47,60]. However, these classifications largely remain based on the ecological characteristics of natural habitats. To date, ant species continue to be equally categorized as bioindicators of either habitat disturbance or maturity without distinguishing between the nature of the habitat (natural or urban). For some species, this approach does not pose any issues; for example, the presence of exotic and tramp species is interpreted as a sign of disturbance in both natural and urban habitats [30,47,61]. The results concerning the indicator value (IV) of the species follow this interpretation and show how some species are more likely to be found in natural areas. In our study, the gardens’ artificial nature was reflected in their ant communities, which contained exotic species such as C. mauritanica and S. membranifera. Another reflection of the artificial nature of gardens is the presence of hygrophilous species such as M. aloba., whose presence is facilitated by the gardens’ humid conditions during the dry seasons due to the watering system. Our results also showed a group of species that can be commonly found in both the gardens and the meadows, including, i.e., L. grandis, a common garden ant on the southern Iberian Peninsula, P. pallidula, or F. cunicularia. In contrast, more specialist species were rare in the four gardens, as moisture levels were too high, and/or other ecological requirements were not met. This group includes the forest species A. gibbosa, the seed harvesters M. barbarus and M. celiae, various carpenter ants in the genus Camponotus, as well as Tetramorium and Cataglyphis species that require more open spaces. All of these ants were common in the nearby natural and seminatural areas, where the mosaic of elm groves, grasslands, and Eucalyptus groves provide better conditions for these species with more specialized ecological requirements.
Changes in the myrmecofauna over the years following the construction of a garden (and other urban green spaces) can be driven by various factors, such as the introduction of exotic species [8,16,62,63] or the local extinction of native species unable to survive under new habitat conditions. As a result, it is feasible to observe a temporary decline in biodiversity during the initial years of a young garden, followed by a gradual recovery with the arrival of species from the surrounding areas. These changes can continue until a form of stability is reached at maturity, when most species have successfully (re)established populations [24]. This trend aligns with the predictions of MacArthur and Wilson [16], who proposed that, over time, the rates of species loss and arrival decrease, eventually balancing each other out. This results in an equilibrium with biodiversity composition similar to those of the surrounding habitats, as described by the equilibrium theory of island biogeography [16].
In our study, this trend was observed in Garden 1, which showed a gradual decrease in biodiversity after its construction in 2005, followed by a progressive increase a few years later, reaching its maximum value in the last year of the study (2013). Delving into species trends, these fluctuations in biodiversity were based on an increase in the population of common garden species like Lasius grandis, Formica cunicularia, or Solenopsis spp., along with the extinction of the granivorous Messor barbarus (typical of more open and drier habitats) and the synanthropic species Hypoponera eduardi.
When examining urban local extinctions, Fattorini et al. [62] highlighted their crucial role in determining the final insect communities. They applied the theory of island biogeography [16] to investigate how various factors contribute to the extinction rate of local species in urban areas and its implications for insect conservation. In urban green spaces, besides their maturity status, slight differences in the management or the ornamentation can drive changes among close habitats with similar landscapes. For instance, despite its maturity, Garden 2 showed some similarities in the presence of exotic or tramp species. The summer droughts due to a lack of watering might weaken native populations, thereby facilitating the establishment of these opportunistic species. However, these species seem incapable of expanding in mature gardens with regular watering (Garden 3 and Garden 4), where native biodiversity is well established. Indeed, mature gardens with watering provide a humid environment that can promote the presence of hydrophilic species [31], which struggle to survive in the surrounding arid habitats. For example, the mature lawns in Garden 4, together with the watering provided in the hot summer, allow the presence of species that need constant levels of moisture, like M. aloba (typical of hot but humid places, [63]), which are unable to persist in the common drier natural habitats in the south of the Iberian Peninsula but was an indicator of the good quality of a mature garden in our study.
In conclusion, to our knowledge, this study is the first to explore long-term species dynamics in gardens of different ages. Our findings support previous studies that highlight the importance of urban green spaces as biodiversity refuges, as the four study gardens host a valuable number of species (near 10% of Iberian myrmecofauna). Our results also underscore the importance of providing adequate management during the maturation process of gardens to enhance their conservation role and mitigate the impact of exotic species. Furthermore, our study emphasizes that ants are important bioindicator tools whose presence should be interpreted contextually. For example, Messor barbarus acts as a bioindicator of disturbance in our study gardens, although it was classified as a bioindicator of maturity in previous studies. Similarly, Lasius grandis and Myrmica aloba should be considered bioindicators of maturity in our gardens despite traditionally being viewed as signs of disturbance. Therefore, to accurately evaluate habitats, traditional bioindicator systems must be adapted to reflect the nature and characteristics of the specific habitat.

Supplementary Materials

The following supporting information can be downloaded at: https://www.mdpi.com/article/10.3390/d17010064/s1, Table S1: Species found in each studied habitat in the Rabanales Campus; Table S2: Anova post-hoc for testing pairwise differences between the different study areas of the campus. Significant results are highlighted in bold; Figure S1: Population dynamics over time for the most abundant and representative ant species found in Garden-3 (a mature watered garden); Figure S2: Population dynamics over time for the most abundant and representative ant species found in Garden 4 (a mature watered garden).

Author Contributions

Conceptualization, methodology, validation, supervision, and project administration, R.-L.J.L.; formal analysis and writing—original draft preparation, T.-P.G.; investigation, data curation, and writing—review and editing, T.-P.G. and R.-L.J.L. All authors have read and agreed to the published version of the manuscript.

Funding

This research received no external funding.

Institutional Review Board Statement

Not applicable.

Data Availability Statement

The data used in this study are available through the scientific repository figshare.com (https://doi.org/10.6084/m9.figshare.28102538, accessed on 16 January 2025).

Acknowledgments

We would like to express our gratitude to Soledad Carpintero, Ana Moreno, and Carmen Ordóñez for their contributions to this study, as well as the management board of the Rabanales Campus for allowing us to perform the study. Additionally, we extend our thanks to the editor and reviewers for the opportunity to publish our research in this journal and for their valuable input.

Conflicts of Interest

The authors declare no conflicts of interest.

References

  1. Szulkin, M.; Munshi-South, J.; Chamantier, A. Urban Evolutionary Biology; Oxford University Press: New York, NY, USA, 2020. [Google Scholar]
  2. Rega-Brodsky, C.C.; Aronson, M.F.J.; Piana, M.R.; Carpenter, E.S.; Hahs, A.K.; Herrera-Montes, A.; Nilon, C.H. Urban biodiversity: State of the science and future directions. Urban Ecosyst. 2022, 25, 1083–1109. [Google Scholar] [CrossRef]
  3. Trigos-Peral, G.; Maák, I.; Schmid, S.; Chodzik, P.; Czaczkes, T.J.; Witek, M.; Casacci, L.P.; Sánchez-Garcia, D.; Lörincz, A.; Kochanowski, M.; et al. Urban abiotic stressors drive changes in the foraging activity and colony growth of the black garden ant Lasius niger. Sci. Total Environ. 2024, 915, 170157. [Google Scholar] [CrossRef] [PubMed]
  4. Johnson, M.T.J.; Munshi-South, J. Evolution of life in urban environments. Science 2017, 358, eaam8327. [Google Scholar] [CrossRef]
  5. Lososová, Z.; Chytrý, M.; Tichý, L.; Danihelka, J.; Fajmon, K.; Hájek, O.; Kintrová, K.; Láníková, D.; Otýpková, Z.; Řehořek, V. Biotic homogenization of Central European urban floras depends on residence time of alien species and habitat types. Biol. Conserv. 2012, 145, 179–184. [Google Scholar] [CrossRef]
  6. Brassard, F.; Leong, C.M.; Chan, H.H.; Guénard, B. High Diversity in Urban Areas: How Comprehensive Sampling Reveals High Ant Species Richness within One of the Most Urbanized Regions of the World. Diversity 2021, 13, 358. [Google Scholar] [CrossRef]
  7. Langemeyer, J.; Gómez-Baggethun, E. Urban biodiversity and ecosystem services. In Urban Biodiversity—From Research to Practice; Ossola, A., Niemelä, J., Eds.; Routledge: Oxon, UK; New York, NY, USA, 2018; pp. 36–53. [Google Scholar]
  8. Guénard, B.; Cardinal-De Casas, A.; Dunn, R.R. High diversity in an urban habitat: Are some animal assemblages resilient to long-term anthropogenic change? Urban Ecosyst. 2015, 18, 449–463. [Google Scholar] [CrossRef]
  9. Menke, S.B.; Guénard, B.; Sexton, J.O.; Weiser, M.D.; Dunn, R.R.; Silverman, J. Urban areas may serve as habitat and corridors for dry-adapted, heat tolerant species; an example from ants. Urban Ecosyst. 2011, 14, 135–163. [Google Scholar] [CrossRef]
  10. Trigos-Peral, G.; Rutkowski, T.; Witek, M.; Ślipiński, P.; Babik, H.; Czechowski, W. Three categories of urban green areas and the effect of their different management on the communities of ants, spiders and harvestmen. Urban Ecosyst. 2020, 23, 803–818. [Google Scholar] [CrossRef]
  11. Reyes-López, J.L.; Carpintero, S. Comparison of the exotic and native ant communities (Hymenoptera: Formicidae) in urban green areas at inland, coastal and insular sites in Spain. Eur. J. Entomol. 2014, 111, 421–428. [Google Scholar] [CrossRef]
  12. Ślipiński, P.; Zmihorski, M.; Czechowski, W. Species Diversity and nestedness of Ant Assemblages in an Urban Environment. Eur. J. Entomol. 2012, 109, 197–206. [Google Scholar] [CrossRef]
  13. Llewellyn, T.; Gaya, E.; Murrell, D.J. Are Urban Communities in successional Stasis? A Case Study on Epiphytic Lichen Communities. Diversity 2020, 12, 330. [Google Scholar] [CrossRef]
  14. Vepsäläinen, K.; Ikonen, H.; Koivula, M.J. The structure of ant assemblages in an urban area of Helsinki, southern Finland. Ann. Zool. Fenn. 2008, 45, 109–127. [Google Scholar] [CrossRef]
  15. Gliessman, S.R. Agroecology: The Ecology of Sustainable Food Systems, 3rd ed.; CRC Press/Taylor & Francis: Boca Raton, FL, USA, 2015. [Google Scholar]
  16. MacArthur, R.H.; Wilson, E.O. The Theory of Island Biogeography; Princeton University Press: Princeton, NJ, USA, 1967. [Google Scholar]
  17. Davis, A.M.; Glick, T.F. Urban Ecosystems and Island Biogeography. Environ. Conserv. 1978, 5, 299. [Google Scholar] [CrossRef]
  18. Marzluff, J.M. Island biogeography for an urbanizing world: How extinction and colonization may determine biological diversity in human-dominated landscapes. Urban Ecosyst. 2005, 8, 157–177. [Google Scholar] [CrossRef]
  19. Dunn, R.R.; Burger, J.R.; Carlen, E.J.; Koltz, A.M.; Light, J.E.; Martin, R.A.; Munshi-South, J.; Nichols, L.M.; Vargo, E.L.; Yitbarek, S.; et al. A Theory of City Biogeography and the Origin of Urban Species. Front. Conserv. Sci. 2022, 3, 761449. [Google Scholar] [CrossRef]
  20. King, J.R.; Andersen, A.N.; Cutter, A.D. Ants as bioindicators of habitat disturbance: Validation of the functional group model for Australia's humid tropics. Biodivers. Conserv. 1998, 7, 1627–1638. [Google Scholar] [CrossRef]
  21. Andersen, A.N.; Hoffmann, B.D.; Müller, W.J.; Griffiths, A.D. Using ants as bioindicators in land management simplifying assessment of ant community responses. J. Appl. Ecol. 2002, 39, 8–17. [Google Scholar] [CrossRef]
  22. Andersen, A.N.; Majer, J.D. Ants show the way Down Under: Invertebrates as bioindicators in land management. Front. Ecol. Environ. 2004, 2, 291–298. [Google Scholar] [CrossRef]
  23. Ivanov, K.; Keiper, J. Ant (Hymenoptera: Formicidae) diversity and community composition along sharp urban forest edges. Biodivers. Conserv. 2010, 19, 3917–3933. [Google Scholar] [CrossRef]
  24. Buczkowski, G.; Richmond, D.S. The effect of urbanization on ant abundance and diversity: A temporal examination of factors affecting biodiversity. PLoS ONE 2012, 7, e41729. [Google Scholar] [CrossRef]
  25. Czechowski, W.; Radchenko, A.; Czechowska, W.; Vepsäläinen, K. The Ants of Poland with Reference to the Myrmecofauna of Europe; Fauna Polonia 4; Natura Optima Dux Foundation: Warsaw, Poland, 2012. [Google Scholar]
  26. Roig, X.; Espadaler, X. Propuesta de grupos funcionales de hormigas para la Península Ibérica y Baleares, y su uso como bioindicadores Proposal of functional groups of ants for the Iberian Peninsula and Balearic Islands, and their use as bioindicators. Iberomyrmex 2010, 2, 28–29. [Google Scholar]
  27. Andersen, A.N. A classification of Australian ant communities, based on functional groups which parallel plant life-forms in relation to stress and disturbance. J. Biogeogr. 1995, 22, 15–29. [Google Scholar] [CrossRef]
  28. Arnán, X.; Cerdá, X.; Retana, J. Partitioning the impact of environment and spatial structure on alpha and beta components of taxonomic, functional, and phylogenetic diversity in European ants. PeerJ 2015, 3, e1241. [Google Scholar] [CrossRef] [PubMed]
  29. Cabrero-Sañudo, F.J.; Cañizares García, R.; Caro-Miralles, E.; Gil-Tapetado, D.; Grzechnik, S.; López-Collar, D. Seguimiento de artrópodos bioindicadores en áreas urbanas: Objetivos, experiencias y perspectivas. Ecosistemas 2022, 31, 2340. [Google Scholar] [CrossRef]
  30. Carpintero, S.; Reyes-López, J.L. Effect of park age, size, shape and insolation on ant assemblages in two cities of. Southern Spain. Entomol. Sci. 2014, 17, 41–51. [Google Scholar] [CrossRef]
  31. Miguelena, G.J.; Baker, P.B. Effects of urbanization on the diversity, abundance, and composition of ant assemblages in an arid city. Environ. Entomol. 2019, 48, 836–846. [Google Scholar] [CrossRef]
  32. Tinaut Ranera, J.A. Estudio de los Formícidos de Sierra Nevada. Ph.D. Thesis, Universidad de Granada, Granada, Spain, 1981. [Google Scholar]
  33. R Core Team R: A Language and Environment for Statistical Computing; R Foundation for Statistical Computing: Vienna, Austria. 2010. Available online: https://www.R-project.org/ (accessed on 23 August 2024).
  34. Oksanen, J.; Simpson, G.L.; Guillaume Blanchet, F.; Kindt, R.; Legendre, P.; Minchin, P.R.; O’Hara, R.B.; Solymos, B.; Stevens, M.H.H.; Szoecs, E.; et al. Vegan: Community Ecology package. R Package Version 2.0-10. 2024. Available online: http://CRAN.R-project.org/package=vegan (accessed on 23 August 2024).
  35. AntWiki. AntWiki: The Ants of the World. Available online: https://www.antwiki.org (accessed on 13 January 2025).
  36. Hormigas.org. Hormigas.org: The Ants of Spain. Available online: https://www.hormigas.org (accessed on 13 January 2025).
  37. Dufrêne, M.; Legendre, P. Species assemblages and indicator species: The need for a flexible asymmetrical approach. Ecol. Monogr. 1997, 67, 345–366. [Google Scholar] [CrossRef]
  38. De Cáceres, M.; Legendre, P. Associations between species and groups of sites: Indices and statistical inference. Ecology 2009, 90, 3566–3574. [Google Scholar] [CrossRef]
  39. Lê, S.; Josse, J.; Husson, F. FactoMineR: An R Package for Multivariate Analysis. J. Stat. Softw. 2008, 25, 1–18. [Google Scholar] [CrossRef]
  40. Kassambara, A.; Mundt, F. factoextra: Extract and Visualize the Results of Multivariate Data Analyses. R package Version 1.0.5. 2020. Available online: https://CRAN.R-project.org/package=factoextra (accessed on 23 August 2024).
  41. Trigos-Peral, G.; Reyes-López, J.L. Las hormigas como bioindicadores para la gestión de zonas verdes urbanas en el sur de la Península Ibérica. Iberomyrmex 2016, 8, 37–38. [Google Scholar]
  42. Wetterer, J.K. Worldwide Spread of the Moorish Sneaking Ant, Cardiocondyla mauritanica (Hymenoptera: Formicidae). Sociobiology 2012, 59, 985–997. [Google Scholar]
  43. Taheri, A.; Wetterer, J.K.; Reyes-López, J. Tramp ants of Tangier, Morocco. Trans. Am. Entomol. Soc. 2017, 143, 299–304. [Google Scholar] [CrossRef]
  44. Hölldobler, B.; Wilson, E.O. The Ants; Harvard University Press: Cambridge, UK, 1990. [Google Scholar]
  45. Jiménez-Carmona, F.; Heredia-Arévalo, A.M.; Reyes-López, J.L. Ants (Hymenoptera: Formicidae) as an indicator group of human environmental impact in the riparian forests of the Guadalquivir river (Andalusia, Spain). Ecol. Indic. 2020, 118, 106762. [Google Scholar] [CrossRef]
  46. Lőrincz, Á.; Habenczyus, A.A.; Kelemen, A.; Ratkai, B.; Tölgyesi, C.; Lőrinczi, G.; Frei, K.; Bátori, Z.; Maák, I.E. Wood-pastures promote environmental and ecological heterogeneity on a small spatial scale. Sci. Total Environ. 2024, 906, 167510. [Google Scholar] [CrossRef]
  47. McKinney, M.L. Urbanization as a Major Cause of Biotic Homogenization. Biol. Conserv. 2006, 127, 247–260. [Google Scholar] [CrossRef]
  48. McKinney, M.L. Effects of urbanization on species richness: A review of plants and animals. Urban Ecosyst. 2008, 11, 161–176. [Google Scholar] [CrossRef]
  49. Pearson, D.E.; Ortega, Y.K.; Eren, Ö.; Villareal, D.; Lekberg, Y.; Hierro, J. Exotic success following disturbance explained by weak native resilience and ruderal exotic bias. J. Ecol. 2023, 111, 2412–2423. [Google Scholar] [CrossRef]
  50. Cotton, J. Diversity, abundance, and species composition of ants in urban green spaces. Urban Ecosyst. 2010, 13, 25–441. [Google Scholar]
  51. Stukalyuk, S.; Maák, I.E. The influence of illumination regimes on the structure of ant (Hymenoptera, Formicidae) community composition in urban habitats. Insectes Sociaux 2023, 70, 423–437. [Google Scholar] [CrossRef]
  52. Penick, C.A.; Savage, A.M.; Dunn, R.R. Stable isotopes reveal links between human food inputs and urban ant diets. Proc. R. Soc. B-Biol. Sci. 2015, 282, art 20142608. [Google Scholar] [CrossRef]
  53. Trigos-Peral, G.; Witek, M.; Csata, E.; Chudzik, P.; Heinze, J. Urban diet as potential cause of low body fat content in female ant sexuals. Myrmecol. News 2024, 34, 181–190. [Google Scholar]
  54. Gaber, H.; Ruland, F.; Jeschke, J.; Bernard-Verdier, M. Behavioural changes in the city: The common black garden ant defends aphids more aggressively in urban environments. Ecol. Evol. 2024, 4, e11639. [Google Scholar] [CrossRef]
  55. Vidal-Cordero, J.M.; Angulo, E.; Molina, F.P.; Boulay, R.; Cerdá, X. Long-term recovery of Mediterranean ant and bee communities after fire in southern Spain. Sci. Total Environ. 2023, 887, 164132. [Google Scholar] [CrossRef] [PubMed]
  56. Zina, V.; Ordeix, M.; Franco, J.C.; Ferreira, M.T.; Fernandes, M.R. Ants as Bioindicators of Riparian Ecological Health in Catalonian Rivers. Forests 2021, 12, 625. [Google Scholar] [CrossRef]
  57. Gollan, J.R.; Lobry de Bruyn, L.; Reid, N.; Smith, D.; Wilkie, L. Can ants be used as ecological indicators of restoration progress in dynamic environments? A case study in a revegetated riparian zone. Ecol. Indic. 2011, 11, 1517–1525. [Google Scholar] [CrossRef]
  58. Hill, J.G.; Summerville, K.S.; Brown, R.L. Habitat associations of ant species (Hymenoptera: Formicidae) in a heterogeneous Mississippi landscape. Environ. Entomol. 2008, 37, 453–463. [Google Scholar] [CrossRef]
  59. Wetterer, J.K.; Espadaler, X.; Wetterer, A.L.; Cabral, S.G.M. Native and exotic ants of the Azores (Hymenoptera: Formicidae). Sociobiology 2004, 44, 265–297. [Google Scholar]
  60. Yamaguchi, T. Influence of urbanization on ant distribution in parks of Tokyo and Chiba City, Japan I. Analysis of ant species richness. Ecol. Res. 2004, 19, 209–216. [Google Scholar] [CrossRef]
  61. Clarke, K.M.; Fisher, B.L.; LeBuhn, G. The influence of urban park characteristics on ant (Hymenoptera, Formicidae) communities. Urban Ecosyst. 2008, 11, 317–334. [Google Scholar] [CrossRef]
  62. Fattorini, S.; Mantoni, C.; De Simoni, L.; Galassi, D.M.P. Island biogeography of insect conservation in urban green spaces. Environ. Conserv. 2017, 45, 1–10. [Google Scholar] [CrossRef]
  63. Radchenko, A.G.; Elmes, G.W. Myrmica Ants (Hymenoptera: Formicidae) of the Old World; Fauna Mundi 3; Natura Optima dux Foundation: Warszawa, Poland, 2010. [Google Scholar]
Figure 1. Map of the studied gardens and the natural and seminatural areas on the Rabanales Campus or the University of Córdoba, Spain.
Diversity 17 00064 g001
Figure 2. NMDS showing differences in ant communities among the study gardens and the natural and seminatural areas of the campus. Dots represent the values obtained per transect in each year of sampling.
Diversity 17 00064 g002
Figure 3. Graphical representation (correspondence analyses) of the relationship between the species found in the gardens and their association with each garden.
Diversity 17 00064 g003
Figure 4. Fluctuation in Shannon–Wiener index in the study gardens over the years.
Diversity 17 00064 g004
Figure 5. Population dynamics over time for the most abundant and representative ant species found in Garden 1 (the youngest garden).
Diversity 17 00064 g005
Figure 6. Population dynamics over time for the most abundant and representative ant species found in Garden 2 (the mature unwatered garden).
Diversity 17 00064 g006
Table 1. Ant species found for each study garden during the study. Values belong to the total number of pitfall traps in which each species was found.
SpeciesGarden 1Garden 2Garden 3Garden 4Total
Aphaenogaster gibbosa (Latreille, 1798)14118056161
Aphaenogaster senilis Mayr, 185331485444177
Camponotus barbaricus Emery, 1905021551692
Camponotus lateralis (Olivier, 1792)00011
Camponotus micans (Nylander, 1856)01001
Cardiocondyla mauritanica Forel, 18901075335168
Cataglyphis rosenhaueri Santschi, 192522206
Crematogaster auberti Emery, 186922206
Crematogaster scutellaris (Olivier, 1792)024511
Crematogaster sordidula (Nylander, 1849)01001
Formica cunicularia Latreille, 179830253058
Formica gerardi Bondroit 191723005
Hypoponera eduardi (Forel, 1894)26201148
Lasius grandis Forel, 190914113738107423
Messor barbarus Linnaeus, 17671800018
Myrmica aloba Forel, 19090001010
Pheidole pallidula (Nylander, 1849)79100100127406
Plagiolepis pygmaea (Latreille, 1798)1569864219
Plagiolepis schmitzii Forel, 18958156635
Solenopsis sp. cfr1429213397
Strumigenys membranifera (Emery, 1869)571013
Tapinoma erraticum (Latreille, 1798)413141445
Tapinoma madeirense Forel, 189511841235
Tapinoma nigerrimum group (Nylander, 1856)1388433
Temnothorax alfacarensis Tinaut & Reyes-López, 202000112
Temnothorax pardoi Tinaut, 198703148
Temnothorax racovitzai Bondroit, 1918060410
Tetramorium caespitum (Linnaeus, 1758)2300023
Tetramorium forte Forel, 190441005
Tetramorium semilaeve André, 188323122147
Table 2. Analysis of the species indicator values showing which ants were significantly associated with (a) the gardens versus the natural and seminatural areas and (b) gardens experiencing different levels of disturbance. The assigned categories correspond to:Young garden (maturity status = 0) vs mature gardens (unwatered, maturity status = 1; watered, maturity status = 2).
SpeciesGreenery CategoryIndicator Value (%)p
(a) Gardens vs. natural/seminatural areas.
Lasius grandisGarden85.10.001
Pheidole pallidulaGarden79.20.001
Cardiocondyla mauritanicaGarden70.70.001
Plagiolepis pygmaeaGarden69.30.002
Solenopsis spp.Garden63.90.021
Formica cuniculariaGarden56.50.001
Hypoponera eduardiGarden54.90.001
Tapinoma erraticumGarden52.80.013
Strumigenys membraniferaGarden40.80.005
Temnothorax pardoiGarden35.40.015
Messor barbarusNatural/Seminatural87.90.001
Plagiolepis shcmitziiNatural/Seminatural79.10.001
Tetramorium semilaeveNatural/Seminatural77.20.001
Aphaenogaster gibbosaNatural/Seminatural76.40.001
Aphaenogaster senilisNatural/Seminatural76.20.001
Tapinoma nigerrimumNatural/Seminatural70.40.001
Crematogaster aubertiNatural/Seminatural64.20.001
Temnothorax tyndaleiNatural/Seminatural57.20.001
Temnothorax alfacarensisNatural/Seminatural54.90.001
Camponotus micansNatural/Seminatural54.30.001
Cataglyphis veloxNatural/Seminatural51.90.001
Cataglyphis rosenhaueriNatural/Seminatural45.30.009
Camponotus pilicornisNatural/Seminatural43.90.001
Tetramorium forteNatural/Seminatural41.20.025
Goniomma hispanicumNatural/Seminatural36.70.003
Messor celiaeNatural/Seminatural310.011
(b) Young garden (maturity status = 0) vs. mature gardens (unwatered, maturity status = 1; watered, maturity status = 2).
Cardiocondyla mauritanica073.90.001
Messor barbarus071.10.001
Hypoponera eduardi060.30.001
Tetramorium semilaeve057.20.007
Tetramorium caespitum052.70.002
Plagiolepis pygmaea168.80.001
Solenopsis spp.161.50.027
Formica cunicularia159.60.002
Strumigenys membranifera150.90.024
Temnothorax racovitzai144.50.025
Aphaennogaster gibbosa274.70.001
Camponotus barbarus262.50.006
Myrmica aloba237.30.045
Table 3. Population dynamics of the gardens’ most representative species (GLMM analyses). Significant results are highlighted in bold. Additionally, we added dash (-) when statistical analyses were not possible due to the absence of the species in the garden.
Garden 1Garden 2Garden 3Garden 4
Specieszpzpzpzp
Number of
workers
L. grandis2.570.010.200.8381.070.284−1.030.305
F. cunicularia2.820.0050.480.63401--
Solenopsis spp.2.570.0240.130.896−0.530.5980.430.664
C. mauritanica−0.80.9362.590.0091.180.237−3.230.001
H. eduardi−3.140.002−2.390.0170101
M. barbarus−1.840.06------
Number of
pitfalls
L. grandis2.270.024−0.050.957−0.740.459−1.420.157
F. cunicularia2.720.050.830.4040.0020.998--
Solenopsis spp.2.860.0041.190.232−1.830.061.580.113
C. mauritanica−0.440.6592.900.0040.880.3810.820.413
H. eduardi−3.110.002−2.050.0410.0010.999−0.0010.999
M. barbarus−2.690.007------
Disclaimer/Publisher’s Note: The statements, opinions and data contained in all publications are solely those of the individual author(s) and contributor(s) and not of MDPI and/or the editor(s). MDPI and/or the editor(s) disclaim responsibility for any injury to people or property resulting from any ideas, methods, instructions or products referred to in the content.

